


1 Introduction
The interaction dynamics, breakup and dispersion of droplets in a coflowing gas medium are ubiquitous to many industrial applications. In particular, droplet–flow interactions attract special attention in liquid-fuelled gas turbine combustion systems. In gas turbines, fuel droplets are injected in the form of sprays in the high-speed coaxial swirling gas phase (Wang, McDonell & Samuelsen Reference Wang, McDonell and Samuelsen1993; Moin & Apte Reference Moin and Apte2006; Boileau et al. Reference Boileau, Pascaud, Riber, Cuenot, Gicquel, Poinsot and Cazalens2008). Here, the momentum associated with the gas phase is usually several orders higher than that of the liquid phase, which results in the imposition of inherent gas phase instabilities on the liquid phase, leading to primarily one-way coupling. The injected droplets hence couple tightly with the highly turbulent swirling flow, leading to significant dispersion (Gu, Basu & Kumar Reference Gu, Basu and Kumar2012) and multimodal secondary breakups. The resultant spatially inhomogeneous dispersion process is of particular importance in combustion research since it will usually lead to spatiotemporal fluctuations in the mixing. The mixing fluctuations affect the combustion efficiency and emissions (Lefebvre Reference Lefebvre2010), and may lead to combustion instabilities.
The complexity and the influence of several coupled parameters prohibit a complete understanding of how the droplets interact with the flow (especially the large-scale coherent structures). Studies carried out by Shirolkar, Coimbra & McQuay (Reference Shirolkar, Coimbra and McQuay1996), Crowe, Sommerfeld & Tsuji (Reference Crowe, Sommerfeld and Tsuji1998) and Balachandar & Eaton (Reference Balachandar and Eaton2010) highlighted the dynamic behaviour of dispersion due to the presence of large-scale coherent structures in the gas phase. The key parameters identified in droplet–vortex/flow interactions are turbulent fluctuations in both the carrier phase (gas) and the dispersed phase (droplets) with respect to one another (Chung & Troutt Reference Chung and Troutt1988; Lazaro & Lasheras Reference Lazaro and Lasheras1992; Kulick, Fessler & Eaton Reference Kulick, Fessler and Eaton1994) and subsequent clustering of droplets/particles in the small/large-scale eddies (Sirignano Reference Sirignano1999; Sankaran & Menon Reference Sankaran and Menon2002). In particle-laden flows, Elghobashi & Truesdell (Reference Elghobashi and Truesdell1993) and Loth et al. (Reference Loth, Tryggvason, Tsuji, Elghobashi, Crowe, Berlemont, Reeks, Simonin, Frank and Onishi2006) categorized the carrier and dispersed phase interaction in terms of the droplet response time scale
 $(\unicode[STIX]{x1D70F}_{D})$
and the carrier phase turbulent time scale
$(\unicode[STIX]{x1D70F}_{D})$
and the carrier phase turbulent time scale
 $(\unicode[STIX]{x1D70F}_{k})$
, concisely represented in non-dimensional form by the Stokes number
$(\unicode[STIX]{x1D70F}_{k})$
, concisely represented in non-dimensional form by the Stokes number
 $St=\unicode[STIX]{x1D70F}_{D}/\unicode[STIX]{x1D70F}_{k}$
. In dense droplet regions (e.g. near the nozzle), the momentum coupling is identified as two-way (i.e. the carrier phase is influenced by the dispersed phase), whereas in dilute regions (i.e. the far field of the spray nozzle), momentum transfer into the carrier phase is negligible (i.e. one-way coupling). The other important parameter in the dispersion process is the evaporative nature of the liquid phase (as in combustion applications). In evaporating droplets, Aggarwal & Park (Reference Aggarwal and Park1999) pointed out the importance of the droplet life time
$St=\unicode[STIX]{x1D70F}_{D}/\unicode[STIX]{x1D70F}_{k}$
. In dense droplet regions (e.g. near the nozzle), the momentum coupling is identified as two-way (i.e. the carrier phase is influenced by the dispersed phase), whereas in dilute regions (i.e. the far field of the spray nozzle), momentum transfer into the carrier phase is negligible (i.e. one-way coupling). The other important parameter in the dispersion process is the evaporative nature of the liquid phase (as in combustion applications). In evaporating droplets, Aggarwal & Park (Reference Aggarwal and Park1999) pointed out the importance of the droplet life time
 $(\unicode[STIX]{x1D70F}_{t})$
in addition to the droplet response time scale
$(\unicode[STIX]{x1D70F}_{t})$
in addition to the droplet response time scale
 $(\unicode[STIX]{x1D70F}_{D})$
. It has been shown that in situations like droplets interacting with large-scale coherent structures, if
$(\unicode[STIX]{x1D70F}_{D})$
. It has been shown that in situations like droplets interacting with large-scale coherent structures, if
 $\unicode[STIX]{x1D70F}_{t}\ll \unicode[STIX]{x1D70F}_{d}$
, then the dispersion process is altered significantly.
$\unicode[STIX]{x1D70F}_{t}\ll \unicode[STIX]{x1D70F}_{d}$
, then the dispersion process is altered significantly.
The fundamental interaction mechanisms and dispersion may differ as a function of the flow configuration (combustor geometry, injector design). For instance, most gas turbine combustors utilize swirling flows to accomplish intense mixing and flame stability (Lilley Reference Lilley1977). Unlike round jets, in addition to axial shear, swirling jets exhibit centrifugal instabilities (Ribeiro & Whitelaw Reference Ribeiro and Whitelaw1980), which add additional complexities in quantifying the vortex–droplet interaction. The origin of centrifugal instabilities in swirling flows is governed by vortex bubble breakdown (VBB) caused by intense rotation of the fluid (Santhosh, Miglani & Basu Reference Santhosh, Miglani and Basu2014). Further, the spatial dispersion of the droplets is significantly affected by the presence of the radial velocity component in swirling jets, i.e. droplets are forced towards the periphery of the flow field (Sanadi, Rajamanickam & Basu Reference Sanadi, Rajamanickam and Basu2017). Numerical simulations carried out by Park, Katta & Aggarwal (Reference Park, Katta and Aggarwal1998) revealed enhancement of the spatial dispersion of droplets in swirl flows due to the vortex pairing mechanism. Large eddy simulation (LES) studies of droplet dispersion in swirling flows carried out by Sankaran & Menon (Reference Sankaran and Menon2002) revealed the crucial role of the central toroidal recirculation zone (CTRZ) manifested in VBB. They pointed out the spatial clustering behaviour of extremely small-sized droplets (
 $St\ll 1$
) within the vortical region. The droplet size scales pertaining to
$St\ll 1$
) within the vortical region. The droplet size scales pertaining to
 $St\gg 1$
exhibit radially outward dispersion arising from the large-scale coherent structures. The degree of complexity in coaxial two-phase flow interactions lies in the carrier phase (instability modes, frequency spectrum, etc.). However, most of these studies related to dispersion and clustering are computational in nature without significant experimental backing.
$St\gg 1$
exhibit radially outward dispersion arising from the large-scale coherent structures. The degree of complexity in coaxial two-phase flow interactions lies in the carrier phase (instability modes, frequency spectrum, etc.). However, most of these studies related to dispersion and clustering are computational in nature without significant experimental backing.
Another parameter of interest is the associated droplet breakup mechanism during interaction with the coherent structures of the swirling flow field. Droplet breakup experiments (Faeth, Hsiang & Wu Reference Faeth, Hsiang and Wu1995; Guildenbecher, López-Rivera & Sojka Reference Guildenbecher, López-Rivera and Sojka2009) carried out in high-speed coaxial flow suggest different breakup mechanisms such as bag, sheet thinning, multimodal and catastrophic, to name a few. Wave formation over the droplet surface is considered to be a key parameter governing the breakup mechanism. The nature of the waves and the corresponding length scales are solely dictated by instabilities associated with the carrier phase. Marmottant & Villermaux (Reference Marmottant and Villermaux2004) have shown the dominance of Kelvin–Helmholtz (KH) waves in droplets subjected to high shear. Flock et al. (Reference Flock, Guildenbecher, Chen, Sojka and Bauer2012) identified the bag breakup mechanism when droplets interact with the shedding vortices. However, all of these experiments were carried out primarily in non-swirling flow conditions.
Computational and theoretical studies have been conducted to elucidate the flow dynamics of the carrier phase. For instance, Al Taweel & Landau (Reference Al Taweel and Landau1977), Danon, Wolfshtein & Hetsroni (Reference Danon, Wolfshtein and Hetsroni1977) and Elghobashi & Abou-Arab (Reference Elghobashi and Abou-Arab1983) developed a correlation function based on the droplet–droplet and droplet–gas interactions to delineate the effects of modulation of the carrier phase across multiple length scales. However, most models fail to accurately predict the interactions and demand more experimental insight. Since the problem involves interphase momentum coupling, simultaneous two-phase measurements are needed to elucidate the various time and length scales involved in the process. Gillandt, Fritsching & Bauckhage (Reference Gillandt, Fritsching and Bauckhage2001) have used a phase Doppler anemometry (PDA) system to reveal the turbulence modulation in two-phase flows by simultaneous measurement of the droplet size and velocity of both the gas and liquid phases. However, as it is a point measurement technique, PDA has limitations in probing the influence of large-scale flow structures present in a highly turbulent environment. This mandates the need for planar measurement systems such as particle imaging velocimetry (PIV) or interferometric Mie imaging (IMI), to name a few. Sakakibara, Wicker & Eaton (Reference Sakakibara, Wicker and Eaton1996) and Khalitov & Longmire (Reference Khalitov and Longmire2003) implemented simultaneous PIV measurements in the two-phase flow to evaluate the gas and liquid phase velocities. The recorded PIV images allowed phase separation between the two fluids (i.e. gas and liquid) using a thresholding technique. The phase separated images could be used later to correlate the influence of one fluid over the other, enabling the formulation of relevant universal scales (eddy strength, droplet dispersion angle).

Figure 1. Schematic of a standard coaxial atomizer coupled with a swirler.

Figure 2. (a) Schematic of the experimental set-up. A horizontal stream of monodispersed droplets is injected at various axial and radial locations. (b) Geometrical details of the swirler and capillary nozzle.
1.1 Scope of the work
The literature survey set out in the previous section clearly points towards the lack of understanding of how droplets interact with large-scale coherent structures (vortices) as in a swirling flow field. In particular, an understanding of droplet–vortex interaction in the near field of the swirler is of significant importance. In the near field, the swirling flow exhibits highly complicated structures such as counter-rotating eddies and a precessing vortex core (PVC), to name a few. Since most of the interphase (gas–liquid) momentum exchange occurs in this zone, it is mandatory to precisely probe the physical mechanisms behind droplet dispersion and breakup. The main objective of this work is to identify these physical mechanisms using high-fidelity laser diagnostic techniques.
In this study, we consider a flow geometry similar to lean direct injection (LDI) combustors, where a simplex nozzle and an air swirler are mounted in a coaxial configuration. The simplex nozzle discharges a hollow cone liquid sheet into the swirling air. Due to the shear layer instability, the liquid sheet breaks up into ligaments and droplets (see figure 1). Furthermore, these droplets undergo breakup as a function of local interactions with the flow field (e.g. eddies) (Saha et al. Reference Saha, Lee, Basu and Kumar2012). In our previous study (Rajamanickam & Basu Reference Rajamanickam and Basu2017), the near-field breakup mechanism and the sizes of the first-generation droplets were elaborated in greater detail.
However, the above-mentioned configuration (figure 1) cannot be used to answer certain questions such as (i) how the injection location of the droplets alters the dispersion/breakup behaviour, (ii) how the gas phase momentum leads to heterogeneous clustering and multimodal breakup of droplets and (iii) how the flow is locally modified on interaction with the droplets. These questions require the injection of a monodispersed stream of low-momentum droplets instead of a polydispersed varying cone angle spray. Hence, in the present study, attention is mainly focused on how these well-defined streams of droplets behave in the swirling flow field depending on the injection location.
Although the flow geometry is similar to LDI, in the experiments reported, the simplex nozzle (figure 1) does not discharge any droplets into the flow field. Hence, this study does not attempt to mimic the real-life LDI scenario.
To elucidate the dynamics, as stated earlier, a stream of monodispersed droplets is injected radially at various predefined locations in the flow field (figure 2). The injection point locations are selected based on the maximum shear strength and turbulent kinetic energy (TKE) distributions in the spatial domain (to be shown later). The radial configuration (akin to droplets in cross-flow) allows dilute injection at various locations in the swirling flow field, which is not achievable by coaxial means.
This paper is arranged in the following manner. In § 2, we explain the experimental details, flow conditions and optical diagnostics tools used in this study. Section 3 describes the global flow field characterization (including the time-averaged vorticity contours and the velocity field) using time-resolved PIV. This section provides topological observations on how the flow field becomes altered (i.e. local disruption of the vortex core) with the liquid injection location and the corresponding global droplet response. This also helps to quantify weak and strong interaction flow conditions. Spectral coherence analysis is implemented in § 4 to elucidate how the circulation strengths of the flow and dispersion are coupled in various frequency bands depending on the injection location. Subsequently, the instability modes and their associated frequency signatures are extracted using proper orthogonal decomposition (POD) in § 5. Here, the modal coupling between the two phases is delineated with the help of POD analysis applied to the flow field with and without the presence of droplets. The POD enabled us to find that the global droplet dispersion is caused by different distinct flow eigenmodes. In § 6, the local breakup mechanism and the dynamics of the droplets in the presence of gas phase coherent structures are elucidated using a high-speed (
 $7500~\text{frames}~\text{s}^{-1}$
) shadow imaging technique. This establishes how the vorticity fluctuations can lead to multimodal breakup events even for fixed flow rates. Finally, the spatially inhomogeneous dispersion of the droplets is explained in § 7 along with the possible mechanisms. All of the sections combined together offer a comprehensive understanding of droplet–vortex interactions.
$7500~\text{frames}~\text{s}^{-1}$
) shadow imaging technique. This establishes how the vorticity fluctuations can lead to multimodal breakup events even for fixed flow rates. Finally, the spatially inhomogeneous dispersion of the droplets is explained in § 7 along with the possible mechanisms. All of the sections combined together offer a comprehensive understanding of droplet–vortex interactions.
2 Experimental conditions and procedure
The experimental set-up utilized in this study is schematically shown in figure 2. The principal component consists of a vane swirler with a solid central hub. The swirler has six vanes with a vane angle of
 $\emptyset =45^{\circ }$
(other geometric details can be found in figure 2
b). For all of the experiments, air and water are used as the working fluids. Droplet injection is carried out using a capillary nozzle (radial arrangement) with an orifice diameter of
$\emptyset =45^{\circ }$
(other geometric details can be found in figure 2
b). For all of the experiments, air and water are used as the working fluids. Droplet injection is carried out using a capillary nozzle (radial arrangement) with an orifice diameter of
 $D_{N}=0.25$
mm. The generated droplets are predominantly monodispersed in nature. The droplets are injected as a horizontal stream at specific locations, as indicated in figure 2(a). Across all of the experiments, the airflow rate across the swirler is progressively varied from 500 to 3000 lpm, while the liquid flow rate is maintained constant (0.05 lpm). The airflow rate is metered using a thermal mass flow controller (MFC) (make: Alicat Inc., range
$D_{N}=0.25$
mm. The generated droplets are predominantly monodispersed in nature. The droplets are injected as a horizontal stream at specific locations, as indicated in figure 2(a). Across all of the experiments, the airflow rate across the swirler is progressively varied from 500 to 3000 lpm, while the liquid flow rate is maintained constant (0.05 lpm). The airflow rate is metered using a thermal mass flow controller (MFC) (make: Alicat Inc., range
 $-0{-}3000~\text{lpm}\pm 0.8\,\%$
full scale). The nominal initial size (
$-0{-}3000~\text{lpm}\pm 0.8\,\%$
full scale). The nominal initial size (
 $d_{o}$
) of the injected droplets is approximately
$d_{o}$
) of the injected droplets is approximately
 $500~\unicode[STIX]{x03BC}\text{m}$
.
$500~\unicode[STIX]{x03BC}\text{m}$
.
2.1 Measurement methodology
(a) Time-resolved PIV. The complex flow structures and intricate instabilities exhibited by swirling flows mandate time-resolved measurements for fundamental insights. The measurement tools can be chosen on the basis of their dynamic response to the fluid flows. The most widely used tools in fluid flows include hot wire anemometry (HWA), laser Doppler anemometry (LDA) and PIV (Adrian Reference Adrian1991; Tropea, Yarin & Foss Reference Tropea, Yarin and Foss2007; Albrecht et al. Reference Albrecht, Damaschke, Borys and Tropea2013), to name a few. Among these, PIV receives special attention because of its planar measurement features (Sung & Yoo Reference Sung and Yoo2001; Schröder et al. Reference Schröder, Geisler, Staack, Elsinga, Scarano, Wieneke, Henning, Poelma and Westerweel2011), unlike LDA and HWA where measurements are pointwise. The arrangement involved in time-resolved PIV is schematically shown in figure 3(a,b). The arrangement includes a high-speed laser (illumination source) and an imaging system (camera) positioned in an orthogonal manner.

Figure 3. (a) Schematic showing the arrangement of the different optical diagnostic systems. (b) Time-resolved PIV set-up. (c) High-speed shadow imaging system.
The laser used here is of high-repetition-rate (10 kHz) dual-pulse Nd:YLF type, with a pulse energy of
 $30~\text{mJ}~\text{pulse}^{-1}$
at an emission wavelength of 527 nm (make: Photonics Inc.). A flexible guiding arm is employed to direct the cylindrical laser beam towards the measurement section. Furthermore, the cylindrical beam is converted to a thin sheet (
$30~\text{mJ}~\text{pulse}^{-1}$
at an emission wavelength of 527 nm (make: Photonics Inc.). A flexible guiding arm is employed to direct the cylindrical laser beam towards the measurement section. Furthermore, the cylindrical beam is converted to a thin sheet (
 ${\sim}$
1 mm) with the help of sheet optics (see figure 3
a). The focal length
${\sim}$
1 mm) with the help of sheet optics (see figure 3
a). The focal length
 $f$
of the sheet optics is chosen as
$f$
of the sheet optics is chosen as
 $-$
10 mm, to ensure an optimum aperture angle
$-$
10 mm, to ensure an optimum aperture angle
 $\unicode[STIX]{x1D6FC}$
to illuminate the desired spatial dimensions of the flow field. In this study, PIV is carried out in two ways. In the first case, PIV is performed only in the gas phase (i.e. without the presence of droplets). In the second case, the flow field in the presence of droplets is imaged. In both cases, only the gas phase is seeded with diethyl hexyl sebacate (DEHS; oil density
$\unicode[STIX]{x1D6FC}$
to illuminate the desired spatial dimensions of the flow field. In this study, PIV is carried out in two ways. In the first case, PIV is performed only in the gas phase (i.e. without the presence of droplets). In the second case, the flow field in the presence of droplets is imaged. In both cases, only the gas phase is seeded with diethyl hexyl sebacate (DEHS; oil density
 $\unicode[STIX]{x1D70C}=912~\text{kg}~\text{m}^{-3}$
) as tracer particles. The diameter (
$\unicode[STIX]{x1D70C}=912~\text{kg}~\text{m}^{-3}$
) as tracer particles. The diameter (
 ${\sim}1{-}3~\unicode[STIX]{x03BC}\text{m}$
) of tracer particles is chosen in such a way as to maintain tracing accuracy error of less than 1 %. During PIV measurements in the presence of droplets, it is important to minimize the influence of tracer particles in droplet breakup and other related processes (Khalitov & Longmire Reference Khalitov and Longmire2002; Kosiwczuk et al.
Reference Kosiwczuk, Cessou, Trinite and Lecordier2005). To validate this, comparison is made between PIV raw images recorded in the presence of both droplets and tracer particles, as well as only with droplets. There is no significant difference in the breakup process, which confirms negligible influence of the tracer particles. In addition, for a given incident laser excitation, the intensity of light scattered by the water droplets is much higher than that by the DEHS particles. This is because the initial size of the injected water droplets (
${\sim}1{-}3~\unicode[STIX]{x03BC}\text{m}$
) of tracer particles is chosen in such a way as to maintain tracing accuracy error of less than 1 %. During PIV measurements in the presence of droplets, it is important to minimize the influence of tracer particles in droplet breakup and other related processes (Khalitov & Longmire Reference Khalitov and Longmire2002; Kosiwczuk et al.
Reference Kosiwczuk, Cessou, Trinite and Lecordier2005). To validate this, comparison is made between PIV raw images recorded in the presence of both droplets and tracer particles, as well as only with droplets. There is no significant difference in the breakup process, which confirms negligible influence of the tracer particles. In addition, for a given incident laser excitation, the intensity of light scattered by the water droplets is much higher than that by the DEHS particles. This is because the initial size of the injected water droplets (
 $d_{o}=500~\unicode[STIX]{x03BC}\text{m}$
) is much higher than that of the DEHS particles (
$d_{o}=500~\unicode[STIX]{x03BC}\text{m}$
) is much higher than that of the DEHS particles (
 ${\sim}1{-}3~\unicode[STIX]{x03BC}\text{m}$
), leading to larger scattering cross-sections. This characteristic feature enables to us distinguish the droplets from the DEHS particles in the raw images.
${\sim}1{-}3~\unicode[STIX]{x03BC}\text{m}$
), leading to larger scattering cross-sections. This characteristic feature enables to us distinguish the droplets from the DEHS particles in the raw images.
The light scattered by the DEHS particles and droplets is recorded with a Photron SA5 high-speed camera (maximum imaging rate is
 $7000~\text{frames}~\text{s}^{-1}$
at 1024 pixel
$7000~\text{frames}~\text{s}^{-1}$
at 1024 pixel
 $\times$
1024 pixel resolution). The camera and laser units are controlled with a programmable tuning unit (PTU) to ensure effective synchronization. In addition, an optical bandpass filter of 527 nm is attached in front of the camera lens to avoid any noisy scattering signals due to the ambient. Images are acquired in double-frame mode with an optimal time interval d
$\times$
1024 pixel resolution). The camera and laser units are controlled with a programmable tuning unit (PTU) to ensure effective synchronization. In addition, an optical bandpass filter of 527 nm is attached in front of the camera lens to avoid any noisy scattering signals due to the ambient. Images are acquired in double-frame mode with an optimal time interval d
 $t$
between two images. Further details on the steps involved in identifying the optimal d
$t$
between two images. Further details on the steps involved in identifying the optimal d
 $t$
, tracer particles and other PIV measurement settings can be found in Keane & Adrian (Reference Keane and Adrian1990) and Raffel et al. (Reference Raffel, Willert, Wereley and Kompenhans2013).
$t$
, tracer particles and other PIV measurement settings can be found in Keane & Adrian (Reference Keane and Adrian1990) and Raffel et al. (Reference Raffel, Willert, Wereley and Kompenhans2013).
Across all the flow conditions, images are acquired at 3.5 kHz (
 $3500~\text{frames}~\text{s}^{-1}$
) with an acquisition time of 0.59 s (i.e. 2000 images are acquired for each case). Superior spatial resolution is ensured by employing a magnification factor of
$3500~\text{frames}~\text{s}^{-1}$
) with an acquisition time of 0.59 s (i.e. 2000 images are acquired for each case). Superior spatial resolution is ensured by employing a magnification factor of
 ${\sim}$
10.24 (
${\sim}$
10.24 (
 $10~\text{pixels}~\text{mm}^{-1}$
) with a field of view (FOV) of 100 mm
$10~\text{pixels}~\text{mm}^{-1}$
) with a field of view (FOV) of 100 mm
 $\times$
100 mm.
$\times$
100 mm.
The vector fields are reconstructed from the recorded double-frame raw images using a commercial PIV postprocessing package (Davis 8.3; make: Lavision GmbH). The vector field calculation is carried out using a cross-correlation technique with a multipass decreasing window size (the final interrogation window size is 48 pixel
 $\times$
48 pixel). The choice of interrogation window size (i.e. 48 pixel
$\times$
48 pixel). The choice of interrogation window size (i.e. 48 pixel
 $\times$
48 pixel) is arrived at based on the peak correlation value (0.8–0.9) inside the field of view.
$\times$
48 pixel) is arrived at based on the peak correlation value (0.8–0.9) inside the field of view.
The accuracy of the PIV measurements is highly dictated by the laser sheet thickness
 $(\unicode[STIX]{x1D6FF}_{t})$
, the time delay between two pulses
$(\unicode[STIX]{x1D6FF}_{t})$
, the time delay between two pulses
 $(\text{d}t)$
, the particle displacement
$(\text{d}t)$
, the particle displacement
 $(\unicode[STIX]{x1D6FF}s)$
and the number of particles
$(\unicode[STIX]{x1D6FF}s)$
and the number of particles
 $(N)$
per interrogation window. The correctness of the abovementioned parameters is validated by performing uncertainty analysis using the ‘correlation statistics’ method. This method attempts to compute the disparity between the correlation peaks observed across two images. The uncertainty in the velocity
$(N)$
per interrogation window. The correctness of the abovementioned parameters is validated by performing uncertainty analysis using the ‘correlation statistics’ method. This method attempts to compute the disparity between the correlation peaks observed across two images. The uncertainty in the velocity
 $(\boldsymbol{u}_{\boldsymbol{e}\boldsymbol{r}\boldsymbol{r}\boldsymbol{o}\boldsymbol{r}})$
values is computed based on the positional disparity observed across two peaks. In the present study, the uncertainty in the velocity is found to be
$(\boldsymbol{u}_{\boldsymbol{e}\boldsymbol{r}\boldsymbol{r}\boldsymbol{o}\boldsymbol{r}})$
values is computed based on the positional disparity observed across two peaks. In the present study, the uncertainty in the velocity is found to be
 $\pm$
1 % of the local velocity value. Further details about this method can be found in Sciacchitano, Wieneke & Scarano (Reference Sciacchitano, Wieneke and Scarano2013) and Wieneke (Reference Wieneke2015).
$\pm$
1 % of the local velocity value. Further details about this method can be found in Sciacchitano, Wieneke & Scarano (Reference Sciacchitano, Wieneke and Scarano2013) and Wieneke (Reference Wieneke2015).
(b) High-speed shadow imaging. The near-field (i.e. locations close to the initial interaction) droplet breakup mechanism and vortex–droplet interactions are visualized using a high-speed shadow imaging system. The optical arrangement involves in the same plane mounting of a high-pulse-rate (100 kHz) LED strobe lamp (make: IDT vision) and a high-speed camera in the same plane (see figure 3 a,c). A diffuser plate is positioned in front of the strobe lamp to ensure uniform background light intensity. Furthermore, the camera shutter and strobe lamp flash duration are synchronized via a delay generator to yield time frozen images of the droplets.
For near-field imaging, a long-distance microscope (make: Questar; QM1 model) with a zoomed-in field of view of 10 mm
 $\times$
10 mm is coupled to the high-speed camera. This arrangement ensures a relatively high spatial resolution (i.e. magnification factor
$\times$
10 mm is coupled to the high-speed camera. This arrangement ensures a relatively high spatial resolution (i.e. magnification factor
 ${\sim}75~\text{pixels}~\text{mm}^{-1}$
). Images are acquired at
${\sim}75~\text{pixels}~\text{mm}^{-1}$
). Images are acquired at
 $7500~\text{frames}~\text{s}^{-1}$
with an exposure time of
$7500~\text{frames}~\text{s}^{-1}$
with an exposure time of
 $1/7500~\text{s}$
. The acquisition time is chosen as 0.67 s (i.e. 5000 images per experimental realization).
$1/7500~\text{s}$
. The acquisition time is chosen as 0.67 s (i.e. 5000 images per experimental realization).
2.2 Flow parameters and test conditions
The experiments are globally characterized using two major non-dimensional numbers, the liquid and gas phase Reynolds numbers
 $(Re_{g},Re_{l})$
, and the momentum ratio (
$(Re_{g},Re_{l})$
, and the momentum ratio (
 $MR$
). These two parameters represent global flow conditions, whereas the local droplet–vortex interaction dynamics is characterized by the Weber number defined based on the vortex strength
$MR$
). These two parameters represent global flow conditions, whereas the local droplet–vortex interaction dynamics is characterized by the Weber number defined based on the vortex strength
 $(We)$
(to be explained later),
$(We)$
(to be explained later),
 $$\begin{eqnarray}\displaystyle & \displaystyle Re_{g}=\frac{\unicode[STIX]{x1D70C}_{g}U_{g}D_{s,eff}}{\unicode[STIX]{x1D707}_{g}}, & \displaystyle\end{eqnarray}$$
 $$\begin{eqnarray}\displaystyle & \displaystyle Re_{l}=\frac{\unicode[STIX]{x1D70C}_{l}U_{l}D_{o}}{\unicode[STIX]{x1D707}_{l}}, & \displaystyle\end{eqnarray}$$
 $$\begin{eqnarray}\displaystyle & \displaystyle MR=\frac{\unicode[STIX]{x1D70C}_{g}U_{g}^{2}A_{s,eff}}{\unicode[STIX]{x1D70C}_{l}U_{l}^{2}A_{o}}. & \displaystyle\end{eqnarray}$$
Here, the parameters
 $\unicode[STIX]{x1D70C}$
,
$\unicode[STIX]{x1D70C}$
,
 $\unicode[STIX]{x1D707}$
and
$\unicode[STIX]{x1D707}$
and
 $U$
are the density, the viscosity and the bulk exit velocity of the fluids used, where ‘
$U$
are the density, the viscosity and the bulk exit velocity of the fluids used, where ‘
 $g$
’ and ‘
$g$
’ and ‘
 $l$
’ stand for the gas and liquid phases respectively. Since the airflow is routed through the swirler, it is customary to define an effective diameter
$l$
’ stand for the gas and liquid phases respectively. Since the airflow is routed through the swirler, it is customary to define an effective diameter
 $D_{s,eff}$
to account for the vanes and hub in the flow path. In most previous works, the area ratio
$D_{s,eff}$
to account for the vanes and hub in the flow path. In most previous works, the area ratio
 $(A_{s,eff}/A_{o})$
is not included in the calculation of
$(A_{s,eff}/A_{o})$
is not included in the calculation of
 $MR$
. In those cases,
$MR$
. In those cases,
 $MR$
is viewed as the dynamic pressure ratio between two coflowing fluids. Few researchers (Engelbert, Hardalupas & Whitelaw Reference Engelbert, Hardalupas and Whitelaw1995; Lozano et al.
Reference Lozano, Barreras, Siegler and Löw2005) have explicitly included the area ratio for precise representation of the momentum transfer across the two fluids. For instance, if the area ratio is not included in (2.3), the calculated value of
$MR$
is viewed as the dynamic pressure ratio between two coflowing fluids. Few researchers (Engelbert, Hardalupas & Whitelaw Reference Engelbert, Hardalupas and Whitelaw1995; Lozano et al.
Reference Lozano, Barreras, Siegler and Löw2005) have explicitly included the area ratio for precise representation of the momentum transfer across the two fluids. For instance, if the area ratio is not included in (2.3), the calculated value of
 $MR$
for all of the flow cases shown in table 1 is found to be
$MR$
for all of the flow cases shown in table 1 is found to be
 ${<}$
1, which implies a weak interaction between the droplets and the flow. However, the experimental observations show different trends, i.e. significant coupling (one-way and two-way) for almost all of the airflow rates.
${<}$
1, which implies a weak interaction between the droplets and the flow. However, the experimental observations show different trends, i.e. significant coupling (one-way and two-way) for almost all of the airflow rates.
Further, it should be noted that the term
 $U_{l}$
in (2.2) is the bulk liquid jet velocity at the nozzle exit before it breaks up into droplets. Here,
$U_{l}$
in (2.2) is the bulk liquid jet velocity at the nozzle exit before it breaks up into droplets. Here,
 $U_{l}$
is evaluated based on the mass conservation principle. In addition, the axis length scales (
$U_{l}$
is evaluated based on the mass conservation principle. In addition, the axis length scales (
 $y,r$
) are non-dimensionalized with the swirler outer annulus radius (
$y,r$
) are non-dimensionalized with the swirler outer annulus radius (
 $R_{o}$
). The experimental flow conditions are compiled in table 1.
$R_{o}$
). The experimental flow conditions are compiled in table 1.
Table 1. Experimental test cases.

LG–GL, liquid to gas and gas to liquid two-way coupling; G–L, transition to one-way gas to liquid coupling; GL, strong one-way gas to liquid coupling.
3 Global characterization of the flow field using time-resolved PIV
This section describes the global coupling between the swirling gas phase and the droplets injected at various locations across different levels of airflow rates
 $(0\leqslant Re_{g}\leqslant 33\,888)$
. The flow field signature acquired from time-resolved PIV is elucidated in this section. In the first part, we present the topological modifications of the flow field, including global quantities such as the time-averaged vorticity contours, velocity field and streamlines, among others. Next, we will show how the droplets respond to the vortices (convective and absolute) in the swirling gas flow field. The flow field information presented corresponds to the gas phase with and without droplets.
$(0\leqslant Re_{g}\leqslant 33\,888)$
. The flow field signature acquired from time-resolved PIV is elucidated in this section. In the first part, we present the topological modifications of the flow field, including global quantities such as the time-averaged vorticity contours, velocity field and streamlines, among others. Next, we will show how the droplets respond to the vortices (convective and absolute) in the swirling gas flow field. The flow field information presented corresponds to the gas phase with and without droplets.

Figure 4. The time-averaged flow field without droplets. (a) The velocity field superimposed with vorticity contours (without the presence of droplets;
 $C2,C4,C7$
;
$C2,C4,C7$
;
 $Re_{g}=5089,14\,177,33\,888$
). (b) Streamline plot illustrating shedding and counter-rotating vortices. (c) Illustration of different forms of shear layers in the velocity field. Adapted from Rajamanickam & Basu (Reference Rajamanickam and Basu2017).
$Re_{g}=5089,14\,177,33\,888$
). (b) Streamline plot illustrating shedding and counter-rotating vortices. (c) Illustration of different forms of shear layers in the velocity field. Adapted from Rajamanickam & Basu (Reference Rajamanickam and Basu2017).
3.1 Global swirling flow field in the absence of droplets
The global features of the flow field are elucidated on the basis of vector fields reconstructed from the PIV raw images. It is mandatory to analyse the gas phase flow field in the absence of droplets across all flow rates since the droplet interaction is expected to be a strong function of
 $MR$
. The time-averaged flow fields obtained for different airflow rates are shown in figure 4. For brevity, only three flow conditions (
$MR$
. The time-averaged flow fields obtained for different airflow rates are shown in figure 4. For brevity, only three flow conditions (
 $C2$
,
$C2$
,
 $C4$
,
$C4$
,
 $C7$
) are shown in figure 4(a). The remaining data can be found in the supplementary material (§ 1, figure S1) available at https://doi.org/10.1017/jfm.2017.495. It should be noted that the flow field looks identical in a topological sense for all cases (figure 4), irrespective of airflow rate. This feature can be elucidated by invoking the definition of swirl number (
$C7$
) are shown in figure 4(a). The remaining data can be found in the supplementary material (§ 1, figure S1) available at https://doi.org/10.1017/jfm.2017.495. It should be noted that the flow field looks identical in a topological sense for all cases (figure 4), irrespective of airflow rate. This feature can be elucidated by invoking the definition of swirl number (
 $S_{G}$
), which embodies the ratio between the axial flux of tangential momentum and the axial flux of axial momentum,
$S_{G}$
), which embodies the ratio between the axial flux of tangential momentum and the axial flux of axial momentum,
 $$\begin{eqnarray}\displaystyle S_{G}=\frac{\displaystyle \int _{R_{h}}^{R_{o}}\unicode[STIX]{x1D70C}U_{y}U_{w}2\unicode[STIX]{x03C0}r^{2}\,\text{d}r}{\displaystyle \int _{R_{h}}^{R_{o}}\unicode[STIX]{x1D70C}U_{y}^{2}2\unicode[STIX]{x03C0}r\,\text{d}r}. & & \displaystyle\end{eqnarray}$$
Beér & Chigier (Reference Beér and Chigier1972) showed that for a flat vane swirler, the ratio between the two fluxes (tangential and axial) is geometry-dependent and remains constant irrespective of the flow rate. Hence, (3.1) can be rewritten as
 $$\begin{eqnarray}\displaystyle S_{G}=\frac{2}{3}\left[\frac{1-\left(\displaystyle \frac{d_{h}}{d_{o}}\right)^{3}}{1-\left(\displaystyle \frac{d_{h}}{d_{o}}\right)^{2}}\right]\tan \emptyset , & & \displaystyle\end{eqnarray}$$
where
 $d_{o}$
and
$d_{o}$
and
 $d_{h}$
are the swirler outer and inner hub diameters.
$d_{h}$
are the swirler outer and inner hub diameters.
In the present experiments, the swirl number (
 $S_{G}$
) is found to be 0.81, which represents a strong swirling jet (figure 3
b). Detailed information regarding the spatial regimes of the abovementioned flow configuration can be found in Rajamanickam & Basu (Reference Rajamanickam and Basu2017).
$S_{G}$
) is found to be 0.81, which represents a strong swirling jet (figure 3
b). Detailed information regarding the spatial regimes of the abovementioned flow configuration can be found in Rajamanickam & Basu (Reference Rajamanickam and Basu2017).
3.1.1 Evolution of vortices in the flow field
The combined action of centrifugal and axial shear instabilities in swirling flow leads to two major forms of vortices (Chigier & Chervinsky Reference Chigier and Chervinsky1967; Gallaire & Chomaz Reference Gallaire and Chomaz2003). First, vortices are shed in the OSL (see figure 4
b,c) due to the axial shear instabilities with the ambient fluid. Second, the rotational influence of the flow leads to the formation of VBB near the vicinity of the swirler (Billant, Chomaz & Huerre Reference Billant, Chomaz and Huerre1998; Champagne & Kromat Reference Champagne and Kromat2000). Vortex bubble breakdown is identified as the characteristic feature of any flow with rotational influence (Benjamin Reference Benjamin1962; Sarpkaya Reference Sarpkaya1971). Hall (Reference Hall1967) reported that the stagnation point in the flow field is the prime cause for vortex breakdown. The stagnation point occurs only when the flow acquires sufficient angular momentum. This criterion translates to a critical value of the swirl number in the current experimental conditions. It has been experimentally validated that vortex breakdown occurs if the swirl number is
 ${\geqslant}$
0.6 (Lucca-Negro & O’doherty Reference Lucca-Negro and O’doherty2001; Liang & Maxworthy Reference Liang and Maxworthy2005). Strong centrifugal instabilities associated with vortex breakdown lead to the formation of a CTRZ characterized by two counter-rotating vortices (see figure 4
b). Hence, unlike axial round jets, swirling jets exhibit an ISL (figure 4
c), in addition to the OSL, due to the recirculated flow (see figure 4
c; see also movie 1). Among these two, the counter-rotating vortices exhibit higher strength, which can be delineated from the vorticity magnitudes shown for all of the cases in figures 4(a) and S1.
${\geqslant}$
0.6 (Lucca-Negro & O’doherty Reference Lucca-Negro and O’doherty2001; Liang & Maxworthy Reference Liang and Maxworthy2005). Strong centrifugal instabilities associated with vortex breakdown lead to the formation of a CTRZ characterized by two counter-rotating vortices (see figure 4
b). Hence, unlike axial round jets, swirling jets exhibit an ISL (figure 4
c), in addition to the OSL, due to the recirculated flow (see figure 4
c; see also movie 1). Among these two, the counter-rotating vortices exhibit higher strength, which can be delineated from the vorticity magnitudes shown for all of the cases in figures 4(a) and S1.
3.1.2 Droplet injection locations
It has already been said that the shear strength and the TKE are the two prime parameters in the context of coaxial atomization. Hence, to identify the optimal injection location, the spatial distributions of these two parameters are evaluated from the vector field calculated from PIV. The procedure involved with calculation of the shear strength from the flow field is shown in the supplementary material. Figure S2a,b shows that the majority of shear strength and TKE is concentrated in the region
 $0<y/R_{o}\leqslant 1.5$
;
$0<y/R_{o}\leqslant 1.5$
;
 $-1<r/R_{o}<1$
. This is due to the combined azimuthal and axial shear induced by VBB in that region. In addition, the flow recirculation induced by the pressure deficit (due to VBB) causes opposite signs in the radial (
$-1<r/R_{o}<1$
. This is due to the combined azimuthal and axial shear induced by VBB in that region. In addition, the flow recirculation induced by the pressure deficit (due to VBB) causes opposite signs in the radial (
 $U_{r}$
) and axial (
$U_{r}$
) and axial (
 $U_{y}$
) velocities (see figure 5
c,d). The flow is subdivided into two spatial regimes, namely zone A and zone B (figure 5
a). Zone A is essentially a region exhibiting counter-rotating eddies (VBB), while zone B is governed by low-energy shedding eddies.
$U_{y}$
) velocities (see figure 5
c,d). The flow is subdivided into two spatial regimes, namely zone A and zone B (figure 5
a). Zone A is essentially a region exhibiting counter-rotating eddies (VBB), while zone B is governed by low-energy shedding eddies.
From the above arguments, it is conceived that the region
 $0<y/R_{o}\leqslant 1.5$
is ideal for droplet injection. Furthermore, in the spatial region
$0<y/R_{o}\leqslant 1.5$
is ideal for droplet injection. Furthermore, in the spatial region
 $0<y/R_{o}\leqslant 1.5$
,
$0<y/R_{o}\leqslant 1.5$
,
 $1\leqslant r/R_{o}\leqslant 1$
, two radial and three axial injection positions are selected, as shown in figure 6. The radial positions (
$1\leqslant r/R_{o}\leqslant 1$
, two radial and three axial injection positions are selected, as shown in figure 6. The radial positions (
 $r/R_{o}$
) are chosen so as to inject the droplets at the OSL and ISL (see figure 6). In addition, with respect to the core of the vortex breakdown bubble, three axial positions are chosen, the intermediate of which corresponds to the vortex core centre (VCC) (
$r/R_{o}$
) are chosen so as to inject the droplets at the OSL and ISL (see figure 6). In addition, with respect to the core of the vortex breakdown bubble, three axial positions are chosen, the intermediate of which corresponds to the vortex core centre (VCC) (
 $y/R_{o}=1$
). The other two positions are chosen at locations upstream (
$y/R_{o}=1$
). The other two positions are chosen at locations upstream (
 $y/R_{o}=0.5$
) and downstream of the VCC (
$y/R_{o}=0.5$
) and downstream of the VCC (
 $y/R_{o}=1.5$
) (figure 6). The chosen injection locations (with corresponding acronyms) are summarized in table 2.
$y/R_{o}=1.5$
) (figure 6). The chosen injection locations (with corresponding acronyms) are summarized in table 2.

Figure 5. Salient features of the swirling gas flow field in the spatial domain: (a) time-averaged velocity field; (b) time-averaged velocity distribution; (c,d) time-averaged axial and radial velocity contours. Adapted from Rajamanickam & Basu (Reference Rajamanickam and Basu2017).

Figure 6. Illustration of the droplet injection locations in the swirling gas flow field.
Table 2. Droplet injection locations.


Figure 7. Illustration of the global evolution of the flow field (time-averaged). (a) The flow field for only the liquid phase and the gas phase. (b,d) The combined liquid and gas phase flow field for droplets injected at the OSL and the ISL: (i) OSL 1, ISL 1; (ii) OSL 2; (iii) OSL 3. (c) The deformation of the vector field (with respect to the gas phase flow field in figure 4 a) near the vortex core region for OSL injection.

Figure 8. Global representation of droplet response with vortices. (a) Diagram illustrating the forces between the vortices and the droplets. (b) The vortex–droplet interaction at
 $MR=0$
. (c,d) The vortex–droplet interactions at high airflow rates (
$MR=0$
. (c,d) The vortex–droplet interactions at high airflow rates (
 $MR=8164$
).
$MR=8164$
).
3.2 Global response of the swirling flow field in the presence of droplets
The alterations of the flow field in the presence of droplets with respect to different injection locations (OSL 1–3, ISL 1–3) are shown in figure 7 and figure S3. To elucidate the topological modifications, the flow field involving only droplets (i.e.
 $MR=0$
) is also shown in figure 7(a). From a global viewpoint, it is seen that at very low airflow rates (i.e.
$MR=0$
) is also shown in figure 7(a). From a global viewpoint, it is seen that at very low airflow rates (i.e.
 $MR=185$
,
$MR=185$
,
 $Re_{g}=5089$
), the injected droplets penetrate inside the vortex core region, which results in complete alteration of the flow field (see the first column in figure 7
b,d and figure S3). In these conditions, substantial momentum is transferred from the liquid to the gas phase, leading to flow variations. On the other hand, slight variation is observed in the droplet trajectories (shown later), without any major breakup event. This situation represents two-way coupling between the droplets and the swirling gas phase (denoted as LG–GL coupling (i.e. liquid to gas, gas to liquid)). However, at high airflow rates
$Re_{g}=5089$
), the injected droplets penetrate inside the vortex core region, which results in complete alteration of the flow field (see the first column in figure 7
b,d and figure S3). In these conditions, substantial momentum is transferred from the liquid to the gas phase, leading to flow variations. On the other hand, slight variation is observed in the droplet trajectories (shown later), without any major breakup event. This situation represents two-way coupling between the droplets and the swirling gas phase (denoted as LG–GL coupling (i.e. liquid to gas, gas to liquid)). However, at high airflow rates
 $(14\,000<Re_{g}\leqslant 33\,888,1920<MR\leqslant 8164)$
, the swirling gas flow predominantly transfers momentum to the liquid droplets, leading to different forms of breakup and dispersion (to be explained later). Here, the flow field (see the second and third columns in figure 7
b,d) resembles the one shown in figure 3(a). This is identified as one-way gas to liquid coupling (GL coupling). Hence, with the increase in the airflow rate, a transition is observed from two-way LG–GL to one-way GL coupling. This G–L coupling transition occurs at
$(14\,000<Re_{g}\leqslant 33\,888,1920<MR\leqslant 8164)$
, the swirling gas flow predominantly transfers momentum to the liquid droplets, leading to different forms of breakup and dispersion (to be explained later). Here, the flow field (see the second and third columns in figure 7
b,d) resembles the one shown in figure 3(a). This is identified as one-way gas to liquid coupling (GL coupling). Hence, with the increase in the airflow rate, a transition is observed from two-way LG–GL to one-way GL coupling. This G–L coupling transition occurs at
 $(Re_{g}\sim 7965,MR\sim 450)$
, where the effect of droplets on the flow field starts to become insignificant in a global sense.
$(Re_{g}\sim 7965,MR\sim 450)$
, where the effect of droplets on the flow field starts to become insignificant in a global sense.
The gas phase flow fields for OSL and ISL injection are largely unaltered for high
 $MR$
, except that there is slight deformation of the vortex core in certain local regions (shown as white dotted lines in figure 7
bi,ii). On account of this, slight change in orientation is observed for the vector fields (see figure 7
c). In particular, for injections corresponding to upstream of the vortex core (OSL 1), significant alteration of the vector field is detected. For instance, the deviation angle
$MR$
, except that there is slight deformation of the vortex core in certain local regions (shown as white dotted lines in figure 7
bi,ii). On account of this, slight change in orientation is observed for the vector fields (see figure 7
c). In particular, for injections corresponding to upstream of the vortex core (OSL 1), significant alteration of the vector field is detected. For instance, the deviation angle
 $\unicode[STIX]{x1D6FC}$
subtended by the velocity vectors for OSL 1 (
$\unicode[STIX]{x1D6FC}$
subtended by the velocity vectors for OSL 1 (
 $y/R_{o}=0.5$
) (figure 7
c) is found to be as high as
$y/R_{o}=0.5$
) (figure 7
c) is found to be as high as
 $39^{\circ }$
. Interestingly, the vector field deformation is much more pronounced in the recirculation zone (VBB). For these injection locations (OSL 1, OSL 2), the vortex core rotation is abruptly disturbed, leading to change in the orientation of the flow direction. This effect is not observed for the
$39^{\circ }$
. Interestingly, the vector field deformation is much more pronounced in the recirculation zone (VBB). For these injection locations (OSL 1, OSL 2), the vortex core rotation is abruptly disturbed, leading to change in the orientation of the flow direction. This effect is not observed for the
 $y/R_{o}=1.5$
location, because of the downstream nature of the injection (i.e. position away from the vortex core); in essence, the vortex core experiences negligible impact from the injected droplets (figure 7
b,c). In addition, the vortex core remains unaltered for all injection locations at the ISL. This yields a similar flow field irrespective of the injection location (ISL 1–3). Hence, in figure 7(d), only the flow field pertaining to ISL 1 is shown; the others (ISL 2, 3) can be found in figure S3(ii),(iii).
$y/R_{o}=1.5$
location, because of the downstream nature of the injection (i.e. position away from the vortex core); in essence, the vortex core experiences negligible impact from the injected droplets (figure 7
b,c). In addition, the vortex core remains unaltered for all injection locations at the ISL. This yields a similar flow field irrespective of the injection location (ISL 1–3). Hence, in figure 7(d), only the flow field pertaining to ISL 1 is shown; the others (ISL 2, 3) can be found in figure S3(ii),(iii).
The fundamental response between the gas phase vortices and the liquid droplets can be explained by a simple force balance model (see figure 8
a). The parameter
 $\unicode[STIX]{x1D709}$
, which defines the dynamic pressure ratio between the two phases (3.3) is used as a criterion to understand this phenomenon. The dynamic pressure ratio
$\unicode[STIX]{x1D709}$
, which defines the dynamic pressure ratio between the two phases (3.3) is used as a criterion to understand this phenomenon. The dynamic pressure ratio
 $\unicode[STIX]{x1D709}$
is the parameter that quantifies momentum transfer pathways between two coflowing fluids. For example, in situations where
$\unicode[STIX]{x1D709}$
is the parameter that quantifies momentum transfer pathways between two coflowing fluids. For example, in situations where
 $\unicode[STIX]{x1D709}<1$
, (3.3) represents the momentum transfer occurring from the liquid to the gas phase (i.e. LG coupling). The airflow rate pertaining to
$\unicode[STIX]{x1D709}<1$
, (3.3) represents the momentum transfer occurring from the liquid to the gas phase (i.e. LG coupling). The airflow rate pertaining to
 $\unicode[STIX]{x1D709}\sim 1$
is delineated as the transition condition, followed by strong one-way gas phase coupling when
$\unicode[STIX]{x1D709}\sim 1$
is delineated as the transition condition, followed by strong one-way gas phase coupling when
 $\unicode[STIX]{x1D709}\gg 1$
(i.e. GL coupling).
$\unicode[STIX]{x1D709}\gg 1$
(i.e. GL coupling).
 $$\begin{eqnarray}\displaystyle \unicode[STIX]{x1D709}\sim \frac{\unicode[STIX]{x1D70C}_{a}(V_{\unicode[STIX]{x1D714}})^{2}}{\unicode[STIX]{x1D70C}_{l}(V_{d})^{2}}. & & \displaystyle\end{eqnarray}$$
Here,
 $V_{\unicode[STIX]{x1D714}}$
represents the velocity induced by vortices. It can be written in terms of the space–time-averaged circulation strength
$V_{\unicode[STIX]{x1D714}}$
represents the velocity induced by vortices. It can be written in terms of the space–time-averaged circulation strength
 $(\overline{\unicode[STIX]{x1D6E4}})$
as
$(\overline{\unicode[STIX]{x1D6E4}})$
as
 $V_{\unicode[STIX]{x1D714}}=\overline{\unicode[STIX]{x1D6E4}}/2\unicode[STIX]{x03C0}r$
, where
$V_{\unicode[STIX]{x1D714}}=\overline{\unicode[STIX]{x1D6E4}}/2\unicode[STIX]{x03C0}r$
, where
 $r$
is the vortex core radius, which is calculated from a time-averaged streamline plot obtained from PIV. The steps involved in calculation of the circulation strength
$r$
is the vortex core radius, which is calculated from a time-averaged streamline plot obtained from PIV. The steps involved in calculation of the circulation strength
 $\overline{\unicode[STIX]{x1D6E4}}$
from the vorticity magnitude will be explained later in great detail. The droplet velocity
$\overline{\unicode[STIX]{x1D6E4}}$
from the vorticity magnitude will be explained later in great detail. The droplet velocity
 $V_{d}$
is acquired from PIV without coflowing swirl air (i.e.
$V_{d}$
is acquired from PIV without coflowing swirl air (i.e.
 $MR=0$
). For
$MR=0$
). For
 $0<Re_{g}<7164$
, the value of
$0<Re_{g}<7164$
, the value of
 $\unicode[STIX]{x1D709}$
is found to be less than 1, which shows that the effect of
$\unicode[STIX]{x1D709}$
is found to be less than 1, which shows that the effect of
 $\overline{\unicode[STIX]{x1D6E4}}$
is minimal and injected droplets penetrate inside the vortex core (figure 8
b). On the other hand, increased circulation strength
$\overline{\unicode[STIX]{x1D6E4}}$
is minimal and injected droplets penetrate inside the vortex core (figure 8
b). On the other hand, increased circulation strength
 $\overline{\unicode[STIX]{x1D6E4}}$
at
$\overline{\unicode[STIX]{x1D6E4}}$
at
 $7164\leqslant Re_{g}\leqslant 33\,888$
causes
$7164\leqslant Re_{g}\leqslant 33\,888$
causes
 $\unicode[STIX]{x1D709}\gg 1$
, which acts as a barrier to droplet penetration. As mentioned earlier, the deflection caused to the vortex eye for
$\unicode[STIX]{x1D709}\gg 1$
, which acts as a barrier to droplet penetration. As mentioned earlier, the deflection caused to the vortex eye for
 $x/R_{o}=2.5$
(OSL) is due to direct impact of droplets on the vortex centre (figure 8
c). However, the opposite effect is observed for
$x/R_{o}=2.5$
(OSL) is due to direct impact of droplets on the vortex centre (figure 8
c). However, the opposite effect is observed for
 $x/R_{o}=0.7$
(ISL); here, the injected droplets first interact with the recirculation zone, resulting in upward motion of the droplets. This phenomenon prevents direct impact of droplets on the right side of the vortex core, resulting in a virtually unaltered flow field (figure 8
d).
$x/R_{o}=0.7$
(ISL); here, the injected droplets first interact with the recirculation zone, resulting in upward motion of the droplets. This phenomenon prevents direct impact of droplets on the right side of the vortex core, resulting in a virtually unaltered flow field (figure 8
d).
Since, in these experiments, the liquid phase flow rate is maintained constant, the only variable that governs the dynamic pressure ratio
 $\unicode[STIX]{x1D709}$
is the circulation strength of the vortex (i.e.
$\unicode[STIX]{x1D709}$
is the circulation strength of the vortex (i.e.
 $=f(\overline{\unicode[STIX]{x1D6E4}})$
). Hence, the control parameter that defines this global modification is
$=f(\overline{\unicode[STIX]{x1D6E4}})$
). Hence, the control parameter that defines this global modification is
 $\overline{\unicode[STIX]{x1D6E4}}$
. The circulation strength
$\overline{\unicode[STIX]{x1D6E4}}$
. The circulation strength
 $\overline{\unicode[STIX]{x1D6E4}}$
corresponding to the transition flow condition
$\overline{\unicode[STIX]{x1D6E4}}$
corresponding to the transition flow condition
 $(Re_{g}\sim 7965,MR\sim 450)$
is identified as critical
$(Re_{g}\sim 7965,MR\sim 450)$
is identified as critical
 $\overline{\unicode[STIX]{x1D6E4}}_{c}$
.
$\overline{\unicode[STIX]{x1D6E4}}_{c}$
.
3.3 Global response of droplets in the swirling gas flow field
The results shown in the previous section outline how the global flow field is modified in the presence of the droplets. Here, we describe how the droplets respond to the swirling flow field (at both the OSL and the ISL). Once again, the results shown here are intended only for quantifying the global parameters. The detailed droplet–vortex interaction and breakup dynamics will be explained later using a high-speed shadow imaging technique.
To illustrate the dynamics, only droplet images are extracted from the PIV raw images, and the image processing steps involved with this are shown in figure S4.
The global response of the droplets on interaction with the vortical structures is shown in figure 9. Here, only two extreme cases are shown (i.e. one for OSL and the other for ISL injection, i.e. OSL 2 and ISL 2) across three flow conditions (
 $MR=185$
, 450, 8164). From the droplet perspective, the acquired images show LG–GL coupling (
$MR=185$
, 450, 8164). From the droplet perspective, the acquired images show LG–GL coupling (
 $MR=185$
) with the vortex (see figure 9ii). The droplet pathways are altered but not in a significant fashion. Similarly, in transition flow conditions (
$MR=185$
) with the vortex (see figure 9ii). The droplet pathways are altered but not in a significant fashion. Similarly, in transition flow conditions (
 $MR\sim 450$
), the increased circulation strength imposed by the vortex results in a strong interaction between the droplet and the swirling flow field (G–L). As a result, the droplet trajectory deviates from its straight path by an angle
$MR\sim 450$
), the increased circulation strength imposed by the vortex results in a strong interaction between the droplet and the swirling flow field (G–L). As a result, the droplet trajectory deviates from its straight path by an angle
 $\unicode[STIX]{x1D703}^{\prime }$
(spatially averaged instantaneous angle, shown as red dotted lines in figure 9iii–vi) along with significant spatial dispersion (explained in detail in later sections). The magnitude of the dispersion increases with the momentum ratio (
$\unicode[STIX]{x1D703}^{\prime }$
(spatially averaged instantaneous angle, shown as red dotted lines in figure 9iii–vi) along with significant spatial dispersion (explained in detail in later sections). The magnitude of the dispersion increases with the momentum ratio (
 $MR$
), as evidenced in figure 9(iv) and (vi). The global observations can be summarized as follows:
$MR$
), as evidenced in figure 9(iv) and (vi). The global observations can be summarized as follows:
-
(1)
 $0<Re_{g}<7164,0<MR<450\rightarrow \overline{\unicode[STIX]{x1D6E4}}<\overline{\unicode[STIX]{x1D6E4}}_{c}\rightarrow$
two-way LG, GL coupling (movie 2);
$0<Re_{g}<7164,0<MR<450\rightarrow \overline{\unicode[STIX]{x1D6E4}}<\overline{\unicode[STIX]{x1D6E4}}_{c}\rightarrow$
two-way LG, GL coupling (movie 2); -
(2)
$Re_{g}\approx 7164,MR\approx 450\rightarrow \overline{\unicode[STIX]{x1D6E4}}\sim \overline{\unicode[STIX]{x1D6E4}}_{c}\rightarrow$
transition to one-way GL coupling (movie 3); -
(3)
$7164\leqslant Re_{g}\leqslant 33\,888,450\leqslant MR\leqslant 8164\rightarrow \overline{\unicode[STIX]{x1D6E4}}\geqslant \overline{\unicode[STIX]{x1D6E4}}_{c}\rightarrow$
strong one-way GL coupling (movie 4).


To precisely locate the transition, experiments were carried out for three to four flow rates (
 $MR=365$
, 402, 420) close to the transition state. Strictly speaking, the transition does not pertain to a particular value, rather it is observed over a range. In the present experiments, we observed the transition in the range of
$MR=365$
, 402, 420) close to the transition state. Strictly speaking, the transition does not pertain to a particular value, rather it is observed over a range. In the present experiments, we observed the transition in the range of
 $420\leqslant MR\leqslant 460$
. However, for simplicity we have considered
$420\leqslant MR\leqslant 460$
. However, for simplicity we have considered
 $MR\sim 450$
as a representative critical/transition flow condition.
$MR\sim 450$
as a representative critical/transition flow condition.
In a nutshell,
 $\overline{\unicode[STIX]{x1D6E4}}$
is the forcing parameter induced by the vortex strength, which will predominantly determine the global response
$\overline{\unicode[STIX]{x1D6E4}}$
is the forcing parameter induced by the vortex strength, which will predominantly determine the global response
 $\unicode[STIX]{x1D703}^{\prime }$
of the droplet. The absolute values for
$\unicode[STIX]{x1D703}^{\prime }$
of the droplet. The absolute values for
 $\overline{\unicode[STIX]{x1D6E4}}$
and
$\overline{\unicode[STIX]{x1D6E4}}$
and
 $\unicode[STIX]{x1D703}^{\prime }$
will be shown in later sections.
$\unicode[STIX]{x1D703}^{\prime }$
will be shown in later sections.

Figure 9. Sample instantaneous visualization of droplet trajectories: (i), (ii) droplet trajectories at low
 $MR$
; (iii), (iv) droplets injected at the OSL (OSL 2) at medium to high
$MR$
; (iii), (iv) droplets injected at the OSL (OSL 2) at medium to high
 $MR$
; (v), (vi) droplets injected at the ISL (ISL 2) at medium to high
$MR$
; (v), (vi) droplets injected at the ISL (ISL 2) at medium to high
 $MR$
.
$MR$
.

Figure 10. The coherence function
 $C_{\unicode[STIX]{x1D6E4}^{\prime },\unicode[STIX]{x1D703}^{\prime }}(f)$
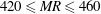
(a) evaluated for droplets injected at the OSL and (b) evaluated for droplets injected at the ISL: (i) OSL 1, ISL 1; (ii) OSL 2, ISL 2; (iii) OSL 3, ISL 3.
$C_{\unicode[STIX]{x1D6E4}^{\prime },\unicode[STIX]{x1D703}^{\prime }}(f)$
(a) evaluated for droplets injected at the OSL and (b) evaluated for droplets injected at the ISL: (i) OSL 1, ISL 1; (ii) OSL 2, ISL 2; (iii) OSL 3, ISL 3.
4 Flow–droplet interaction dynamics
We will now look into the interaction dynamics between the instantaneous circulation (rather than averaged circulation) strength
 $\unicode[STIX]{x1D6E4}^{\prime }$
and the dispersion angle
$\unicode[STIX]{x1D6E4}^{\prime }$
and the dispersion angle
 $\unicode[STIX]{x1D703}^{\prime }$
. It is well known that the swirling flow field will exhibit fluctuations in the circulation strength
$\unicode[STIX]{x1D703}^{\prime }$
. It is well known that the swirling flow field will exhibit fluctuations in the circulation strength
 $\unicode[STIX]{x1D6E4}^{\prime }$
which in turn introduce dynamical behaviour (modes of breakup and spatial dispersion) in the droplets that cannot be deciphered using
$\unicode[STIX]{x1D6E4}^{\prime }$
which in turn introduce dynamical behaviour (modes of breakup and spatial dispersion) in the droplets that cannot be deciphered using
 $\overline{\unicode[STIX]{x1D6E4}}$
. Hence, in this section, the idea is to extract the instantaneous circulation strength
$\overline{\unicode[STIX]{x1D6E4}}$
. Hence, in this section, the idea is to extract the instantaneous circulation strength
 $(\unicode[STIX]{x1D6E4}^{\prime })$
and dispersion angle
$(\unicode[STIX]{x1D6E4}^{\prime })$
and dispersion angle
 $(\unicode[STIX]{x1D703}^{\prime })$
and quantify the dynamic coupling between
$(\unicode[STIX]{x1D703}^{\prime })$
and quantify the dynamic coupling between
 $\unicode[STIX]{x1D6E4}^{\prime }$
and
$\unicode[STIX]{x1D6E4}^{\prime }$
and
 $\unicode[STIX]{x1D703}^{\prime }$
using spectral coherence analysis
$\unicode[STIX]{x1D703}^{\prime }$
using spectral coherence analysis
 $\{C_{\unicode[STIX]{x1D6E4}^{\prime }\unicode[STIX]{x1D703}^{\prime }}(f)\}$
. The procedure involved in the computation of
$\{C_{\unicode[STIX]{x1D6E4}^{\prime }\unicode[STIX]{x1D703}^{\prime }}(f)\}$
. The procedure involved in the computation of
 $\unicode[STIX]{x1D6E4}^{\prime }$
and
$\unicode[STIX]{x1D6E4}^{\prime }$
and
 $\unicode[STIX]{x1D703}^{\prime }$
from high-speed simultaneous PIV raw images is shown in figure S5 (§ 2.2 in the supplementary material). Here, the dispersion angle
$\unicode[STIX]{x1D703}^{\prime }$
from high-speed simultaneous PIV raw images is shown in figure S5 (§ 2.2 in the supplementary material). Here, the dispersion angle
 $\unicode[STIX]{x1D703}$
has two forms; one pertains to the mean angle (spatial sense) observed at any given instant of time (i.e.
$\unicode[STIX]{x1D703}$
has two forms; one pertains to the mean angle (spatial sense) observed at any given instant of time (i.e.
 $\unicode[STIX]{x1D703}^{\prime }$
) and the second is the space–time-averaged dispersion angle
$\unicode[STIX]{x1D703}^{\prime }$
) and the second is the space–time-averaged dispersion angle
 $(\overline{\unicode[STIX]{x1D703}})$
.
$(\overline{\unicode[STIX]{x1D703}})$
.
4.1 Coherence analysis
The essential role of coherence analysis is to estimate the relationship between the input
 $x(t)$
and output
$x(t)$
and output
 $y(t)$
signal in a linear time invariant system. Mathematically, it is defined as the ratio between the cross-spectral density of
$y(t)$
signal in a linear time invariant system. Mathematically, it is defined as the ratio between the cross-spectral density of
 $x(t),y(t)$
and the auto spectral density of
$x(t),y(t)$
and the auto spectral density of
 $x(t),y(t)$
(Bendat & Piersol Reference Bendat and Piersol1980). The coherence value can vary from 0 to 1; the higher the coherence value is (i.e. closer to unity), the greater the chance of linearity between the two signals:
$x(t),y(t)$
(Bendat & Piersol Reference Bendat and Piersol1980). The coherence value can vary from 0 to 1; the higher the coherence value is (i.e. closer to unity), the greater the chance of linearity between the two signals:
 $$\begin{eqnarray}\displaystyle C_{x,y}(f)=\left\{\frac{|G_{xy}(f)|^{2}}{G_{xx}(f)\cdot G_{yy}(f)}\right\},\quad 0<C_{x,y}(f)<1. & & \displaystyle\end{eqnarray}$$
In the present experiments,
 $x(t)$
and
$x(t)$
and
 $y(t)$
are
$y(t)$
are
 $\unicode[STIX]{x1D6E4}^{\prime }$
and
$\unicode[STIX]{x1D6E4}^{\prime }$
and
 $\unicode[STIX]{x1D703}^{\prime }$
respectively; hence, equation (4.1) can be written as
$\unicode[STIX]{x1D703}^{\prime }$
respectively; hence, equation (4.1) can be written as
 $$\begin{eqnarray}\displaystyle C_{\unicode[STIX]{x1D6E4}^{\prime },\unicode[STIX]{x1D703}^{\prime }}(f)=\left\{\frac{|G_{\unicode[STIX]{x1D6E4}^{\prime }\unicode[STIX]{x1D703}^{\prime }}(f)|^{2}}{G_{\unicode[STIX]{x1D6E4}^{\prime }\unicode[STIX]{x1D6E4}^{\prime }}(f)\cdot G_{\unicode[STIX]{x1D703}^{\prime }\unicode[STIX]{x1D703}^{\prime }}(f)}\right\}. & & \displaystyle\end{eqnarray}$$
The coherence function
 $C_{\unicode[STIX]{x1D6E4}^{\prime },\unicode[STIX]{x1D703}^{\prime }}(f)$
evaluated for different injection locations across various flow rates is presented in figure 10. On account of the LG–GL interaction (mostly liquid to flow), coherence values
$C_{\unicode[STIX]{x1D6E4}^{\prime },\unicode[STIX]{x1D703}^{\prime }}(f)$
evaluated for different injection locations across various flow rates is presented in figure 10. On account of the LG–GL interaction (mostly liquid to flow), coherence values
 $C_{\unicode[STIX]{x1D6E4}^{\prime },\unicode[STIX]{x1D703}^{\prime }}(f)$
are not evaluated for
$C_{\unicode[STIX]{x1D6E4}^{\prime },\unicode[STIX]{x1D703}^{\prime }}(f)$
are not evaluated for
 $0<MR<450$
. The results pertaining to
$0<MR<450$
. The results pertaining to
 $MR>450$
are depicted in figure 10(a) for droplets injected at the OSL. It is seen that for all three axial positions, higher coherence (
$MR>450$
are depicted in figure 10(a) for droplets injected at the OSL. It is seen that for all three axial positions, higher coherence (
 ${\sim}$
0.85) is observed around 80–100 Hz. Although the coherence value decays drastically at higher frequencies, interestingly, there is a second peak in
${\sim}$
0.85) is observed around 80–100 Hz. Although the coherence value decays drastically at higher frequencies, interestingly, there is a second peak in
 $C_{\unicode[STIX]{x1D6E4}^{\prime },\unicode[STIX]{x1D703}^{\prime }}(f)$
for frequencies around 600–900 Hz. In particular, these values are higher for downstream injection locations (i.e. OSL 3; figure 10
aiii). This indicates that the interaction between
$C_{\unicode[STIX]{x1D6E4}^{\prime },\unicode[STIX]{x1D703}^{\prime }}(f)$
for frequencies around 600–900 Hz. In particular, these values are higher for downstream injection locations (i.e. OSL 3; figure 10
aiii). This indicates that the interaction between
 $\unicode[STIX]{x1D6E4}^{\prime }$
and
$\unicode[STIX]{x1D6E4}^{\prime }$
and
 $\unicode[STIX]{x1D703}^{\prime }$
in the OSL (for OSL injections described earlier) is coupled in two frequency bands, namely the primary (
$\unicode[STIX]{x1D703}^{\prime }$
in the OSL (for OSL injections described earlier) is coupled in two frequency bands, namely the primary (
 $f_{p}$
) and secondary (
$f_{p}$
) and secondary (
 $f_{s}$
).
$f_{s}$
).
On the contrary, the dispersion of droplets injected at the ISL (figure 10
b; ISL injections) is predominantly coupled with the local circulation in a narrow frequency band (80–100 Hz) exhibiting very high coherence values of
 ${\sim}0.85{-}0.9$
. These two contradictory behaviours between the OSL and the ISL indicate radical changes in the interaction dynamics. In both cases (OSL and ISL injections), the transition flow condition is coupled only in a single frequency range (no second peak) and also exhibits low coherence,
${\sim}0.85{-}0.9$
. These two contradictory behaviours between the OSL and the ISL indicate radical changes in the interaction dynamics. In both cases (OSL and ISL injections), the transition flow condition is coupled only in a single frequency range (no second peak) and also exhibits low coherence,
 $C_{\unicode[STIX]{x1D6E4}^{\prime },\unicode[STIX]{x1D703}^{\prime }}(f)\sim 0.2{-}025$
(figure 10
a,bi).
$C_{\unicode[STIX]{x1D6E4}^{\prime },\unicode[STIX]{x1D703}^{\prime }}(f)\sim 0.2{-}025$
(figure 10
a,bi).
5 Proper orthogonal decomposition
The coherence analysis presented in § 4 yields information about the interaction dynamics of vortices and droplets in a swirling gas flow field. The observations made open up avenues for two important questions. First, what is the source of the high coherence at 80–100 Hz? Next, why do the droplets (i.e. trajectories) at the OSL couple with the flow field at multiple frequency bands compared with the ISL droplets? To understand the source of the frequencies observed in the vortex–droplet interaction, it is necessary to identify the dominant instability mechanisms that govern the flow field. The instability mechanism and its characteristic frequencies can be extracted in several ways like linear stability analysis, POD and dynamic mode decomposition, among others. In this study, POD is carried out to extract the dominant spatial and temporal modes. Implementation of POD in the flow field enables delineation of the characteristic frequencies of the fluctuating components of the flow field from its temporal modes.
5.1 Spatial eigenmodes of the gas flow field
Proper orthogonal decomposition can be implemented in two ways, classical POD and the method of snapshots (Sirovich Reference Sirovich1987). The latter one has received greater attention in analysing turbulent flows (Berkooz, Holmes & Lumley Reference Berkooz, Holmes and Lumley1993). Mathematically, POD decomposes the fluctuation in velocity components
 $(u^{\prime },v^{\prime })$
into spatial (
$(u^{\prime },v^{\prime })$
into spatial (
 $x$
) and temporal (
$x$
) and temporal (
 $j$
) modes. The detailed steps pertaining to implementation of POD over the flow field data are illustrated in figure S6 (§ 2.3).
$j$
) modes. The detailed steps pertaining to implementation of POD over the flow field data are illustrated in figure S6 (§ 2.3).
The spatial eigenmodes
 $\unicode[STIX]{x1D719}_{n}(x)$
pertaining to only the gas phase flow field (without droplets) are shown in figure 11. Here, only two flow conditions are shown for brevity, one for low airflow rate
$\unicode[STIX]{x1D719}_{n}(x)$
pertaining to only the gas phase flow field (without droplets) are shown in figure 11. Here, only two flow conditions are shown for brevity, one for low airflow rate
 $(Re_{g}=5089)$
and the other for high airflow rate
$(Re_{g}=5089)$
and the other for high airflow rate
 $(Re_{g}=33\,888).$
It should be noted that the eigenmodes depicted for both airflow rates look identical in the topological sense, due to the fixed value of the swirl number (as explained earlier in § 2). Logically, in POD, the number of eigenmodes is equal to the number of snapshots provided as input. However, only the first few modes contribute towards the overall TKE of the flow field. In the present experiments, the cumulative energy of first four modes (A1–A4) is found to be more than 95 % (see figure 11
c). Hence, only those eigenmodes are shown in figure 11(a,b).
$(Re_{g}=33\,888).$
It should be noted that the eigenmodes depicted for both airflow rates look identical in the topological sense, due to the fixed value of the swirl number (as explained earlier in § 2). Logically, in POD, the number of eigenmodes is equal to the number of snapshots provided as input. However, only the first few modes contribute towards the overall TKE of the flow field. In the present experiments, the cumulative energy of first four modes (A1–A4) is found to be more than 95 % (see figure 11
c). Hence, only those eigenmodes are shown in figure 11(a,b).
Figure 11. (a,b) Illustration of the POD spatial eigenmodes for only the gas phase for (a)
 $Re_{g}=5089$
and (b)
$Re_{g}=5089$
and (b)
 $Re_{g}=33\,888$
. (c) The modal energy distribution. A1, first mode, KH instability/centrifugal instability; A2, second mode, KH instability/axial shear instability; A3, third mode, helical instability; A4, fourth mode, shedding mode. Adapted from Rajamanickam & Basu (Reference Rajamanickam and Basu2017).
$Re_{g}=33\,888$
. (c) The modal energy distribution. A1, first mode, KH instability/centrifugal instability; A2, second mode, KH instability/axial shear instability; A3, third mode, helical instability; A4, fourth mode, shedding mode. Adapted from Rajamanickam & Basu (Reference Rajamanickam and Basu2017).
Several studies (Billant et al.
Reference Billant, Chomaz and Huerre1998; Gallaire & Chomaz Reference Gallaire and Chomaz2003) have reported the dominance of centrifugal or azimuthal shear instabilities in strongly swirling jets (
 $S_{G}\geqslant 0.6$
). The mechanism/type of the instabilities can be identified with the help of vorticity contours (spatial eigenmodes) and the frequency signatures (see figure 12) extracted from the temporal modes. From the viewpoint of the vorticity distribution along the longitudinal axis (
$S_{G}\geqslant 0.6$
). The mechanism/type of the instabilities can be identified with the help of vorticity contours (spatial eigenmodes) and the frequency signatures (see figure 12) extracted from the temporal modes. From the viewpoint of the vorticity distribution along the longitudinal axis (
 $y/r_{o}$
), the instability waves can be delineated as symmetric or asymmetric. For instance, modes 1 and 2 exhibit symmetric vorticity distributions (figure 11
a,bA1,A2). Modes 3 and 4 exhibit asymmetric (i.e. helical; figure 11
a,bA3,A4) vorticity distributions.
$y/r_{o}$
), the instability waves can be delineated as symmetric or asymmetric. For instance, modes 1 and 2 exhibit symmetric vorticity distributions (figure 11
a,bA1,A2). Modes 3 and 4 exhibit asymmetric (i.e. helical; figure 11
a,bA3,A4) vorticity distributions.
The strong negative vorticity region observed in the central region of mode 1 (A1) is induced by VBB due to the intense rotation of the fluid in the azimuthal direction (i.e. strong swirling jet,
 $S_{G}\geqslant 0.6$
). Moreover, in this region, the radial velocity magnitude shows dominance over the axial component
$S_{G}\geqslant 0.6$
). Moreover, in this region, the radial velocity magnitude shows dominance over the axial component
 $(\unicode[STIX]{x2202}U_{y}/\unicode[STIX]{x2202}r<\unicode[STIX]{x2202}U_{r}/\unicode[STIX]{x2202}y)$
. This results in a combination of axial and azimuthal shear.
$(\unicode[STIX]{x2202}U_{y}/\unicode[STIX]{x2202}r<\unicode[STIX]{x2202}U_{r}/\unicode[STIX]{x2202}y)$
. This results in a combination of axial and azimuthal shear.
Coles (Reference Coles1965) formulated the criteria for centrifugally unstable flows, which state that the flow becomes locally unstable if the vorticity magnitude in that region is negative (see (5.1)),
 $$\begin{eqnarray}\displaystyle \unicode[STIX]{x1D714}_{z}\unicode[STIX]{x1D6FA}<0. & & \displaystyle\end{eqnarray}$$
The dominance of azimuthal and axial shear in modes 1 and 2 is identified as the KH/strong shear instability mode. From the modal energy distribution viewpoint, it can be inferred that the flow field is dominated by azimuthal and axial shear instabilities (A1, A2) which account for 80 % of the total TKE. In contrast, modes 3 and 4 account for only 20 % of the energy.
In general, swirling jets exhibit helical waves before vortex breakdown occurs. This condition is true only for weak swirling jets (i.e.
 $S_{G}<0.6$
). However, in this study, the flow condition pertains to a strong VBB state. Hence, the helical modes appear as low-energy-content modes (
$S_{G}<0.6$
). However, in this study, the flow condition pertains to a strong VBB state. Hence, the helical modes appear as low-energy-content modes (
 ${\sim}$
20 % of the total energy). It is important to note that the vorticity contours in the POD modes (in particular for A1, A2 and A3; figure 11
a,b) predominantly appear in the region where counter-rotating vortices are present, whereas only in the fourth mode (A4; low-energy-content mode) do the vortices appear in alternate fashion in the OSL region (figure 11
a,b,A4). The above observations clearly demonstrate the dominance of counter-rotating vortices over shedding vortices (only in the A4 mode). The origin of the shedding vortices in the swirl flow can be traced to the oscillations induced by the PVC (Syred Reference Syred2006; Martinelli, Olivani & Coghe Reference Martinelli, Olivani and Coghe2007).
${\sim}$
20 % of the total energy). It is important to note that the vorticity contours in the POD modes (in particular for A1, A2 and A3; figure 11
a,b) predominantly appear in the region where counter-rotating vortices are present, whereas only in the fourth mode (A4; low-energy-content mode) do the vortices appear in alternate fashion in the OSL region (figure 11
a,b,A4). The above observations clearly demonstrate the dominance of counter-rotating vortices over shedding vortices (only in the A4 mode). The origin of the shedding vortices in the swirl flow can be traced to the oscillations induced by the PVC (Syred Reference Syred2006; Martinelli, Olivani & Coghe Reference Martinelli, Olivani and Coghe2007).

Figure 12. Illustration of frequency spectra obtained from the POD temporal modes for only the swirling gas flow field. Adapted from Rajamanickam & Basu (Reference Rajamanickam and Basu2017).
The frequency spectra obtained for modes 1 (A1) and 2 (A2) exhibit very narrow bands (see figure 12). The frequency values show an increasing trend with the flow rates from 30 Hz to 75 Hz for A1 and A2. However, repetitive frequency peaks are observed for the helical and shedding modes (A3, A4; figure 12). The important conclusion evident from the frequency signature is the nature of the instability wave induced in each mode. For instance, the single large peak observed around
 ${\sim}$
75 Hz for A1 and A2 suggests long waves (i.e. the wavelength is relatively larger than those of modes 3 (A3) and 4 (A4) (i.e.
${\sim}$
75 Hz for A1 and A2 suggests long waves (i.e. the wavelength is relatively larger than those of modes 3 (A3) and 4 (A4) (i.e.
 $\unicode[STIX]{x1D706}_{1,2}>\unicode[STIX]{x1D706}_{3,4}$
)). Since, A1 and A2 are identified as KH instability modes, the frequency signature and wavelength scales pertaining to A1 and A2 are delineated as
$\unicode[STIX]{x1D706}_{1,2}>\unicode[STIX]{x1D706}_{3,4}$
)). Since, A1 and A2 are identified as KH instability modes, the frequency signature and wavelength scales pertaining to A1 and A2 are delineated as
 $f_{1,2}\approx f_{KH}$
and
$f_{1,2}\approx f_{KH}$
and
 $\unicode[STIX]{x1D706}_{1,2}\approx \unicode[STIX]{x1D706}_{KH}$
respectively. Therefore, the frequency signatures in A1 and A2 are mainly contributed by large-scale coherence structures. On the other hand, small-scale/shedding eddies lead to the formation of multiple frequency peaks in A3 and A4. This may due to the coupling of large-scale coherent structures with low-energy-content eddies (i.e. small scale).
$\unicode[STIX]{x1D706}_{1,2}\approx \unicode[STIX]{x1D706}_{KH}$
respectively. Therefore, the frequency signatures in A1 and A2 are mainly contributed by large-scale coherence structures. On the other hand, small-scale/shedding eddies lead to the formation of multiple frequency peaks in A3 and A4. This may due to the coupling of large-scale coherent structures with low-energy-content eddies (i.e. small scale).
5.2 Spatial eigenmodes in the presence of droplets
The dominant instability mechanisms that govern the swirling flow field are presented in § 4.2. The objective of this section is to outline the qualitative and quantitative comparisons between the POD spatial eigenmodes pertaining to the flow field with and without droplets. The quantitative information involves coherence analysis between the temporal modes and the instantaneous spatially averaged circulation
 $\unicode[STIX]{x1D6E4}^{\prime }$
. This approach reveals the mechanisms behind the modal coupling between the two phases and the corresponding trends in the coherence function
$\unicode[STIX]{x1D6E4}^{\prime }$
. This approach reveals the mechanisms behind the modal coupling between the two phases and the corresponding trends in the coherence function
 $C_{\unicode[STIX]{x1D6E4}^{\prime },\unicode[STIX]{x1D703}^{\prime }}(f)$
, as observed in figure 10. Since the main interest lies in identifying the instability mechanism involved during strong interaction, only flow rates corresponding to GL coupling
$C_{\unicode[STIX]{x1D6E4}^{\prime },\unicode[STIX]{x1D703}^{\prime }}(f)$
, as observed in figure 10. Since the main interest lies in identifying the instability mechanism involved during strong interaction, only flow rates corresponding to GL coupling
 $(Re_{g}\sim 33\,888,MR\sim 8164)$
are considered here for brevity.
$(Re_{g}\sim 33\,888,MR\sim 8164)$
are considered here for brevity.
Spatial eigenmodes evaluated from instantaneous vector fields involving droplets for two injection locations (OSL 1, 2; ISL 1, 2) are shown in figure 13. The modal contours pertaining to the flow field with droplets are marked as M1–M4. The contour maps of the spatial eigenmodes suggest strong coupling of the azimuthal shear modes (i.e. M1 and A1 shown in figures 11 and 13 are similar) for both OSL and ISL injections.

Figure 13. The POD spatial eigenmodes computed from the instantaneous swirling gas flow field in the presence of droplets (
 $MR\sim 8164$
): (a) OSL 1; (b) OSL 2; (c) ISL 1; (d) ISL 2.
$MR\sim 8164$
): (a) OSL 1; (b) OSL 2; (c) ISL 1; (d) ISL 2.
The fundamental difference observed in the eigenmodes between ISL and OSL injections is the appearance of secondary instability modes in the OSL case. For instance, mode 2 (M2) shown in figure 13(b) exhibits shedding as a secondary mode in addition to the shear mode (here, the shear mode is depicted inside the dotted black box) observed in the gas phase. The same observation is valid for M3 also, i.e. the appearance of a shedding mode in addition to the helical modes. In contrast, the ISL depicts only shear (i.e. azimuthal and axial shear) instabilities in the first two modes (see M1 and M2 in figure 13 c,d). The spatial eigenmodes quantified at downstream injection locations (OSL 3, ISL 3) also exhibit similar trends; hence, for brevity, these are shown in the supplementary material (figure S7i,ii).
It should be noted that in figure 12, the helical and shedding modes exhibit multiple frequency peaks. The coupling of secondary modes with highly energetic modes (i.e. M2) in the OSL is suspected to be a cause of the secondary frequencies
 $(f_{s})$
observed in the coherence analysis (figure 10
ai–iii). To confirm this phenomenon, coherence analysis is carried out between the temporal modes (
$(f_{s})$
observed in the coherence analysis (figure 10
ai–iii). To confirm this phenomenon, coherence analysis is carried out between the temporal modes (
 $a_{n}(t)$
) and the forcing parameter
$a_{n}(t)$
) and the forcing parameter
 $\unicode[STIX]{x1D6E4}^{\prime }$
:
$\unicode[STIX]{x1D6E4}^{\prime }$
:
 $$\begin{eqnarray}\displaystyle C_{a_{n}(t),\unicode[STIX]{x1D6E4}^{\prime }}(f)=\left\{\frac{|G_{\unicode[STIX]{x1D6E4}^{\prime }a_{n}(t)}(f)|^{2}}{G_{\unicode[STIX]{x1D6E4}^{\prime }\unicode[STIX]{x1D6E4}^{\prime }}(f)\cdot G_{a_{n}(t)a_{n}(t)}(f)}\right\}. & & \displaystyle\end{eqnarray}$$

Figure 14. Coherence plots illustrating the dynamic coupling trends between the instantaneous circulation strength
 $\unicode[STIX]{x1D6E4}^{\prime }$
and the temporal modes
$\unicode[STIX]{x1D6E4}^{\prime }$
and the temporal modes
 $a_{n}(t)$
for
$a_{n}(t)$
for
 $MR=8164$
: (a) OSL 1; (b) OSL 2; (c) OSL 3; (d) ISL 1; (e) ISL 2; (f) ISL 3.
$MR=8164$
: (a) OSL 1; (b) OSL 2; (c) OSL 3; (d) ISL 1; (e) ISL 2; (f) ISL 3.
The coherence analysis carried out as per (5.2) is graphically shown in figure 14. Again, the results are shown only for the strong-interaction (GL) case
 $(Re_{g}\sim 33\,888,MR\sim 8164)$
. For OSL injection (figure 14
a–c), it is seen that modes M1 and M2 become coupled with
$(Re_{g}\sim 33\,888,MR\sim 8164)$
. For OSL injection (figure 14
a–c), it is seen that modes M1 and M2 become coupled with
 $\unicode[STIX]{x1D6E4}^{\prime }$
at very high coherence values of 0.8–0.9 in very narrow frequency band (90–110 Hz). In addition, mode 2 (M2, axial shear instability) shows intermediate coherence values of 0.3–0.5 at secondary frequency levels of 300–600 Hz. The interesting point to note in OSL injection is the activation of shedding modes (high-frequency modes) for downstream injection points in combination with high-energy-content modes, i.e. mode 2 (figure 14
b,c). This may be due to interaction of the droplets with shedding vortices (small-scale eddies). Moreover, the instantaneous raw images also suggest predominant interaction of droplets with these shedding vortices (see figure S8a and movie 4). Helical and shedding modes (M3 and M4) are coupled in higher and wider frequency bands (200–600 Hz) with lower coherence values. The existence of these secondary frequency bands was already established in the coherence analysis (§ 4) made between
$\unicode[STIX]{x1D6E4}^{\prime }$
at very high coherence values of 0.8–0.9 in very narrow frequency band (90–110 Hz). In addition, mode 2 (M2, axial shear instability) shows intermediate coherence values of 0.3–0.5 at secondary frequency levels of 300–600 Hz. The interesting point to note in OSL injection is the activation of shedding modes (high-frequency modes) for downstream injection points in combination with high-energy-content modes, i.e. mode 2 (figure 14
b,c). This may be due to interaction of the droplets with shedding vortices (small-scale eddies). Moreover, the instantaneous raw images also suggest predominant interaction of droplets with these shedding vortices (see figure S8a and movie 4). Helical and shedding modes (M3 and M4) are coupled in higher and wider frequency bands (200–600 Hz) with lower coherence values. The existence of these secondary frequency bands was already established in the coherence analysis (§ 4) made between
 $\unicode[STIX]{x1D6E4}^{\prime }$
and
$\unicode[STIX]{x1D6E4}^{\prime }$
and
 $\unicode[STIX]{x1D703}^{\prime }$
(see figure 10
a).
$\unicode[STIX]{x1D703}^{\prime }$
(see figure 10
a).
On the contrary, in ISL injection, the droplets undergo breakup (see the blue dotted lines in figure S8b,c) before they reach the rotating eddies. This pre-breakup of droplets induces a drastic reduction in size, which ultimately leads to lower local Stokes number (see (7.5)) values. The lower Stokes number causes significant droplet trapping inside the vortex core, rather than the interaction with the shedding eddies as observed in the OSL. Modal coherence results for the ISL cases confirmed that the instantaneous circulation values
 $\unicode[STIX]{x1D6E4}^{\prime }$
are primarily coupled with only azimuthal and axial shear instability modes (M1 and M2; see figure 14
d–f), which results in high coherence values of 0.8–0.9 around 80–110 Hz. In both cases (OSL, ISL), the frequency spectra corresponding to KH instability modes are delineated as
$\unicode[STIX]{x1D6E4}^{\prime }$
are primarily coupled with only azimuthal and axial shear instability modes (M1 and M2; see figure 14
d–f), which results in high coherence values of 0.8–0.9 around 80–110 Hz. In both cases (OSL, ISL), the frequency spectra corresponding to KH instability modes are delineated as
 $(f_{KH})$
.
$(f_{KH})$
.
The coherence observations made in §§ 4 and 5 can be summarized as follows.
For the OSL,
 $$\begin{eqnarray}\displaystyle \left.\begin{array}{@{}c@{}}\displaystyle \frac{x}{R_{o}}\sim 2.5,\quad \frac{y}{R_{o}}\leqslant 0.7,\quad \text{OSL }1\rightarrow \text{KH mode},\\ \displaystyle \frac{x}{R_{o}}\sim 2.5,\quad 0.7\leqslant \frac{y}{R_{o}}\leqslant 1.5,\quad \text{OSL 2},3\rightarrow \text{KH mode }+\text{ shedding mode}.\end{array}\right\} & & \displaystyle\end{eqnarray}$$
For the ISL,
 $$\begin{eqnarray}\displaystyle \frac{x}{R_{o}}\sim 0.75,\quad 0\leqslant \frac{y}{R_{o}}\leqslant 1.5,\quad \text{ISL }1,2,3\rightarrow \text{KH mode}. & & \displaystyle\end{eqnarray}$$
In summary, in this section, we found the mechanism behind the peculiar nature of coherence signatures corresponding to ISL and OSL injections.
6 Breakup dynamics of liquid droplets
In the previous section, we elucidated the dispersion mechanism of the droplets due to flow fluctuations. We will present in this section the droplet breakup processes and regimes as a function of the circulation strengths
 $\unicode[STIX]{x1D6E4}^{\prime }$
and
$\unicode[STIX]{x1D6E4}^{\prime }$
and
 $\overline{\unicode[STIX]{x1D6E4}}$
. First, instantaneous snapshots of the droplet breakup modes are shown, followed by a detailed analysis of the dynamics involved.
$\overline{\unicode[STIX]{x1D6E4}}$
. First, instantaneous snapshots of the droplet breakup modes are shown, followed by a detailed analysis of the dynamics involved.

Figure 15. Instantaneous visualization of droplet breakup/interaction with vortices: (a)
 $MR\sim 0$
; (b)
$MR\sim 0$
; (b)
 $MR\sim 184$
; (c)
$MR\sim 184$
; (c)
 $MR\sim 450$
; (d)
$MR\sim 450$
; (d)
 $MR\sim 1920$
; (e)
$MR\sim 1920$
; (e)
 $MR\sim 3720$
;(f)
$MR\sim 3720$
;(f)
 $MR\sim 5899$
; (g)
$MR\sim 5899$
; (g)
 $MR\sim 8164$
; (i) OSL 2; (ii) ISL 2.
$MR\sim 8164$
; (i) OSL 2; (ii) ISL 2.
6.1 High-speed visualization of vortex–droplet interaction
The flow conditions pertaining to two-way, transition and one-way interactions were identified in the global flow field characterization (§ 2). Instantaneous snapshots of droplet images corresponding to these interaction types are shown in figure 15(i),(ii). Interestingly, the interacting droplets exhibit several complicated structures (marked as red circles in figure 15i,iid–g) while breaking up into fragments. The driving mechanism for these breakups includes large-scale coherent structures present in the gas phase and the associated instability modes like KH shear and vortex shedding, as explained in the earlier sections.
6.2 Droplet breakup regimes
The droplets injected into vortices are subjected to oscillations induced by the swirling gas phase flow, leading to shape deformation and breakup. Several experimental and theoretical works (Hanson, Domich & Adams Reference Hanson, Domich and Adams1963; Simpkins & Bales Reference Simpkins and Bales1972) have been carried out to elucidate the droplet breakup mechanisms in coflowing air.
In general, the two major forces, namely the aerodynamic drag force
 $(F_{a})$
and the restoring surface tension force
$(F_{a})$
and the restoring surface tension force
 $(F_{\unicode[STIX]{x1D70E}})$
, involved in the droplet deformation/breakup process can be expressed in non-dimensional form (Weber number
$(F_{\unicode[STIX]{x1D70E}})$
, involved in the droplet deformation/breakup process can be expressed in non-dimensional form (Weber number
 $We$
) as follows:
$We$
) as follows:
 $$\begin{eqnarray}\displaystyle We\sim \frac{F_{a}}{F_{\unicode[STIX]{x1D70E}}}. & & \displaystyle\end{eqnarray}$$
The aerodynamic force induced by the vortex is given by
 $$\begin{eqnarray}\displaystyle F_{a}\sim \unicode[STIX]{x1D70C}_{a}\left(\frac{\overline{\unicode[STIX]{x1D6E4}}}{2\unicode[STIX]{x03C0}\overline{r_{cc}}}\right)^{2}. & & \displaystyle\end{eqnarray}$$
The detailed derivations and assumptions involved with (6.2) can be found in Oweis et al. (Reference Oweis, Van der Hout, Iyer, Tryggvason and Ceccio2005). Now, expression (6.2) can be rewritten as
 $$\begin{eqnarray}\displaystyle \overline{We}\sim \frac{\unicode[STIX]{x1D70C}_{a}\left(\displaystyle \frac{\overline{\unicode[STIX]{x1D6E4}}}{2\unicode[STIX]{x03C0}\overline{r_{cc}}}\right)^{2}}{\left(\displaystyle \frac{\unicode[STIX]{x1D70E}}{D_{o}}\right)}. & & \displaystyle\end{eqnarray}$$
Here,
 $\overline{\unicode[STIX]{x1D6E4}}$
is the time-averaged circulation strength,
$\overline{\unicode[STIX]{x1D6E4}}$
is the time-averaged circulation strength,
 $\overline{r_{cc}}$
is the vortex core radius obtained from time-averaged flow field images,
$\overline{r_{cc}}$
is the vortex core radius obtained from time-averaged flow field images,
 $\unicode[STIX]{x1D70E}$
is the interfacial tension and
$\unicode[STIX]{x1D70E}$
is the interfacial tension and
 $D_{o}$
is the initial droplet diameter. In the present experiments, the initial injected droplets are predominantly monodispersed in nature with an average diameter of
$D_{o}$
is the initial droplet diameter. In the present experiments, the initial injected droplets are predominantly monodispersed in nature with an average diameter of
 $500~\unicode[STIX]{x03BC}\text{m}$
. In addition, an instantaneous Weber number
$500~\unicode[STIX]{x03BC}\text{m}$
. In addition, an instantaneous Weber number
 $(We^{\prime })$
is also proposed as a function of the instantaneous spatially averaged circulation strength
$(We^{\prime })$
is also proposed as a function of the instantaneous spatially averaged circulation strength
 $(\unicode[STIX]{x1D6E4}^{\prime })$
. Here,
$(\unicode[STIX]{x1D6E4}^{\prime })$
. Here,
 $We^{\prime }$
is evaluated from (6.3) except that
$We^{\prime }$
is evaluated from (6.3) except that
 $\unicode[STIX]{x1D6E4}^{\prime }$
is used instead of
$\unicode[STIX]{x1D6E4}^{\prime }$
is used instead of
 $\overline{\unicode[STIX]{x1D6E4}}$
.
$\overline{\unicode[STIX]{x1D6E4}}$
.

Figure 16. Illustration of breakup modes as a function of the time-averaged Weber number: (a)
 $(0<\overline{We}\leqslant 16,0<MR\leqslant 184)$
; (b)
$(0<\overline{We}\leqslant 16,0<MR\leqslant 184)$
; (b)
 $(16<\overline{We}\leqslant 57,184<MR\leqslant 450)$
; (c)
$(16<\overline{We}\leqslant 57,184<MR\leqslant 450)$
; (c)
 $(57<\overline{We}\leqslant 95,450<MR\leqslant 3720)$
; (d)
$(57<\overline{We}\leqslant 95,450<MR\leqslant 3720)$
; (d)
 $(95<\overline{We}\leqslant 335,3720<MR\leqslant 5899)$
; (e)
$(95<\overline{We}\leqslant 335,3720<MR\leqslant 5899)$
; (e)
 $(335<\overline{We}\sim 500,5899<MR\leqslant 8164)$
.
$(335<\overline{We}\sim 500,5899<MR\leqslant 8164)$
.
It should be noted that
 $We^{\prime }$
and
$We^{\prime }$
and
 $\overline{We}$
are calculated in a small spatial window (at the location of first entry of droplets into the flow field, shown in figure S5) rather than around each droplet (which is impossible). The size of the spatial window (which varies with respect to the airflow rate;
$\overline{We}$
are calculated in a small spatial window (at the location of first entry of droplets into the flow field, shown in figure S5) rather than around each droplet (which is impossible). The size of the spatial window (which varies with respect to the airflow rate;
 ${\sim}10\times 10{-}30\times 30~\text{mm}$
) is chosen in such a way that the values of
${\sim}10\times 10{-}30\times 30~\text{mm}$
) is chosen in such a way that the values of
 $\unicode[STIX]{x1D6E4}^{\prime }$
and
$\unicode[STIX]{x1D6E4}^{\prime }$
and
 $\overline{\unicode[STIX]{x1D6E4}}$
are largely insensitive to the box size so long it encompasses the high-vorticity region. Therefore, it is assumed that all droplets in that window experience the same circulation at any time instant. Hence, the Weber number is not based on individual droplets but rather on the initial diameter of the droplets entering the spatial window. In summary,
$\overline{\unicode[STIX]{x1D6E4}}$
are largely insensitive to the box size so long it encompasses the high-vorticity region. Therefore, it is assumed that all droplets in that window experience the same circulation at any time instant. Hence, the Weber number is not based on individual droplets but rather on the initial diameter of the droplets entering the spatial window. In summary,
 $\overline{We}$
is a spatiotemporally averaged parameter, while
$\overline{We}$
is a spatiotemporally averaged parameter, while
 $We^{\prime }$
is only a spatially averaged parameter evaluated at any given time instant.
$We^{\prime }$
is only a spatially averaged parameter evaluated at any given time instant.
For precise representation, the calculation of
 $We^{\prime }$
should involve the instantaneous droplet diameter and the local vortex strength
$We^{\prime }$
should involve the instantaneous droplet diameter and the local vortex strength
 $(\unicode[STIX]{x1D6E4}^{\prime })$
. However, this demands simultaneous measurement of individual droplet morphology (shape oscillations), tracking of droplet location and its surrounding flow field. This also requires a sufficiently lower number of droplets (
$(\unicode[STIX]{x1D6E4}^{\prime })$
. However, this demands simultaneous measurement of individual droplet morphology (shape oscillations), tracking of droplet location and its surrounding flow field. This also requires a sufficiently lower number of droplets (
 ${\sim}1~\text{droplet}~\text{s}^{-1}$
) in the flow field. All of these are out of the scope of the current work.
${\sim}1~\text{droplet}~\text{s}^{-1}$
) in the flow field. All of these are out of the scope of the current work.
In the present study, the droplet breakup can be viewed as two processes, primary and secondary. Primary breakup is the event that occurs where droplets first interact with eddies (mostly large scale) and yield fluid dynamically unstable structures like ligaments, non-spherical droplets, etc. (see the yellow circles in figure 16 c,d). These droplets may further undergo breakup (secondary) while interacting with the shedding eddies.
The various breakup modes observed as a function of the Weber number (6.3) are illustrated in figure 16. It should be noted that the breakup modes shown above do not pertain to any particular injection location. They are just sample illustrations of breakup mechanisms common across all injection locations as a function of the Weber number. However, the instantaneous interaction and dispersion mechanisms are found to be tightly coupled functions of the injection location, which will be illustrated in later sections. In common practice, droplet breakup is initiated if the Weber number
 $(\overline{We})$
exceeds a certain threshold/critical value
$(\overline{We})$
exceeds a certain threshold/critical value
 $(\overline{We}_{c})$
. Theoretically,
$(\overline{We}_{c})$
. Theoretically,
 $\overline{We}_{c}$
is found to be
$\overline{We}_{c}$
is found to be
 ${\geqslant}$
10 (Hinze Reference Hinze1955).
${\geqslant}$
10 (Hinze Reference Hinze1955).
At this value, the waves formed over the droplet surface lead to multimodal shape oscillations (vibrational deformation), which ultimately result in breakup. In situations where lower aerodynamic forcing is involved,
 $0<\overline{We}<16$
, the surface tension damps the waves formed over the droplet surface, which mostly results in deformation/pinching of ligaments from the droplet surface (marked as red dotted lines in figure 16
a). In the current set-up, bag breakup (
$0<\overline{We}<16$
, the surface tension damps the waves formed over the droplet surface, which mostly results in deformation/pinching of ligaments from the droplet surface (marked as red dotted lines in figure 16
a). In the current set-up, bag breakup (
 $16<\overline{We}<57$
; figure 16
b) occurs at a transitional Weber number (i.e. low airflow rate). The physical mechanism that governs this process is identified as differential pressure across the front and rear ends of the droplets (Han & Tryggvason Reference Han and Tryggvason1999).
$16<\overline{We}<57$
; figure 16
b) occurs at a transitional Weber number (i.e. low airflow rate). The physical mechanism that governs this process is identified as differential pressure across the front and rear ends of the droplets (Han & Tryggvason Reference Han and Tryggvason1999).
Multimode breakup (figure 16
c) is witnessed for
 $450<MR\leqslant 1920$
. Dai & Faeth (Reference Dai and Faeth2001) categorized this breakup process as a transition between pressure difference induced bag and shear induced sheet thinning breakup modes. The different forms of breakup modes (vibrational, bag, multimode, sheet thinning, shear/catastrophic breakup) and their physical significance are elaborated in greater detail in Faeth et al. (Reference Faeth, Hsiang and Wu1995) and Guildenbecher et al. (Reference Guildenbecher, López-Rivera and Sojka2009). The governing mechanism involved with sheet thinning breakup (figure 16
d) is the formation of a boundary layer over the droplet surface due to the shear induced by fast moving gas (Nicholls & Ranger Reference Nicholls and Ranger1969; Chou, Hsiang & Faeth Reference Chou, Hsiang and Faeth1997). It involves deformation of the droplet periphery followed by stretching, formation of ligaments and subsequent breakup into daughter droplets. Catastrophic breakup (figure 16
e) is mostly encountered in extremely high-shear flows like the current swirling flow field (Hopfinger & Lasheras Reference Hopfinger and Lasheras1996). In this case, such breakup (figure 16
d,e) is mostly dominated by waves induced by surrounding gas phase instabilities (Taylor Reference Taylor and Batchelor1963; Hsiang & Faeth Reference Hsiang and Faeth1992). The resulting drop sizes in catastrophic breakup predominantly scale with the wavelength
$450<MR\leqslant 1920$
. Dai & Faeth (Reference Dai and Faeth2001) categorized this breakup process as a transition between pressure difference induced bag and shear induced sheet thinning breakup modes. The different forms of breakup modes (vibrational, bag, multimode, sheet thinning, shear/catastrophic breakup) and their physical significance are elaborated in greater detail in Faeth et al. (Reference Faeth, Hsiang and Wu1995) and Guildenbecher et al. (Reference Guildenbecher, López-Rivera and Sojka2009). The governing mechanism involved with sheet thinning breakup (figure 16
d) is the formation of a boundary layer over the droplet surface due to the shear induced by fast moving gas (Nicholls & Ranger Reference Nicholls and Ranger1969; Chou, Hsiang & Faeth Reference Chou, Hsiang and Faeth1997). It involves deformation of the droplet periphery followed by stretching, formation of ligaments and subsequent breakup into daughter droplets. Catastrophic breakup (figure 16
e) is mostly encountered in extremely high-shear flows like the current swirling flow field (Hopfinger & Lasheras Reference Hopfinger and Lasheras1996). In this case, such breakup (figure 16
d,e) is mostly dominated by waves induced by surrounding gas phase instabilities (Taylor Reference Taylor and Batchelor1963; Hsiang & Faeth Reference Hsiang and Faeth1992). The resulting drop sizes in catastrophic breakup predominantly scale with the wavelength
 $\unicode[STIX]{x1D706}_{max}$
that exhibits the highest growth rate.
$\unicode[STIX]{x1D706}_{max}$
that exhibits the highest growth rate.
It is interesting to note that, even for a fixed gas flow rate, different breakup modes are witnessed. For instance, in figure 17(a,b), it is shown that the flow rate pertaining to
 $MR\sim 8164$
exhibits several breakup modes like bag, sheet thinning and catastrophic at different time instants. This is due to the fact that fluctuations in the instantaneous circulation (i.e.
$MR\sim 8164$
exhibits several breakup modes like bag, sheet thinning and catastrophic at different time instants. This is due to the fact that fluctuations in the instantaneous circulation (i.e.
 $\unicode[STIX]{x1D6E4}^{\prime }$
) eventually lead to large-scale fluctuations in the instantaneous Weber number
$\unicode[STIX]{x1D6E4}^{\prime }$
) eventually lead to large-scale fluctuations in the instantaneous Weber number
 $We^{\prime }$
. This phenomenon is graphically illustrated in figure 17(b) for
$We^{\prime }$
. This phenomenon is graphically illustrated in figure 17(b) for
 $MR\sim 8164$
over one cycle. Here, a cycle is considered based on a time scale
$MR\sim 8164$
over one cycle. Here, a cycle is considered based on a time scale
 $(\unicode[STIX]{x1D70F}=1/f_{KH})$
as calculated from the dominant frequency spectrum obtained from modal analysis (POD).
$(\unicode[STIX]{x1D70F}=1/f_{KH})$
as calculated from the dominant frequency spectrum obtained from modal analysis (POD).
It can be observed (figure 17
a) that the instantaneous value of the Weber number shows a large variation (
 ${\sim}$
10–1050) during any one cycle of vortex shedding even though
${\sim}$
10–1050) during any one cycle of vortex shedding even though
 $\overline{We}$
is much lower (
$\overline{We}$
is much lower (
 ${\sim}$
400). Hence, it is natural to witness a whole gamut of breakup modes consistent with such Weber number ranges. The average Weber number
${\sim}$
400). Hence, it is natural to witness a whole gamut of breakup modes consistent with such Weber number ranges. The average Weber number
 $(\overline{We})$
would fail to explain the detailed dynamics of droplet breakup in these flows.
$(\overline{We})$
would fail to explain the detailed dynamics of droplet breakup in these flows.
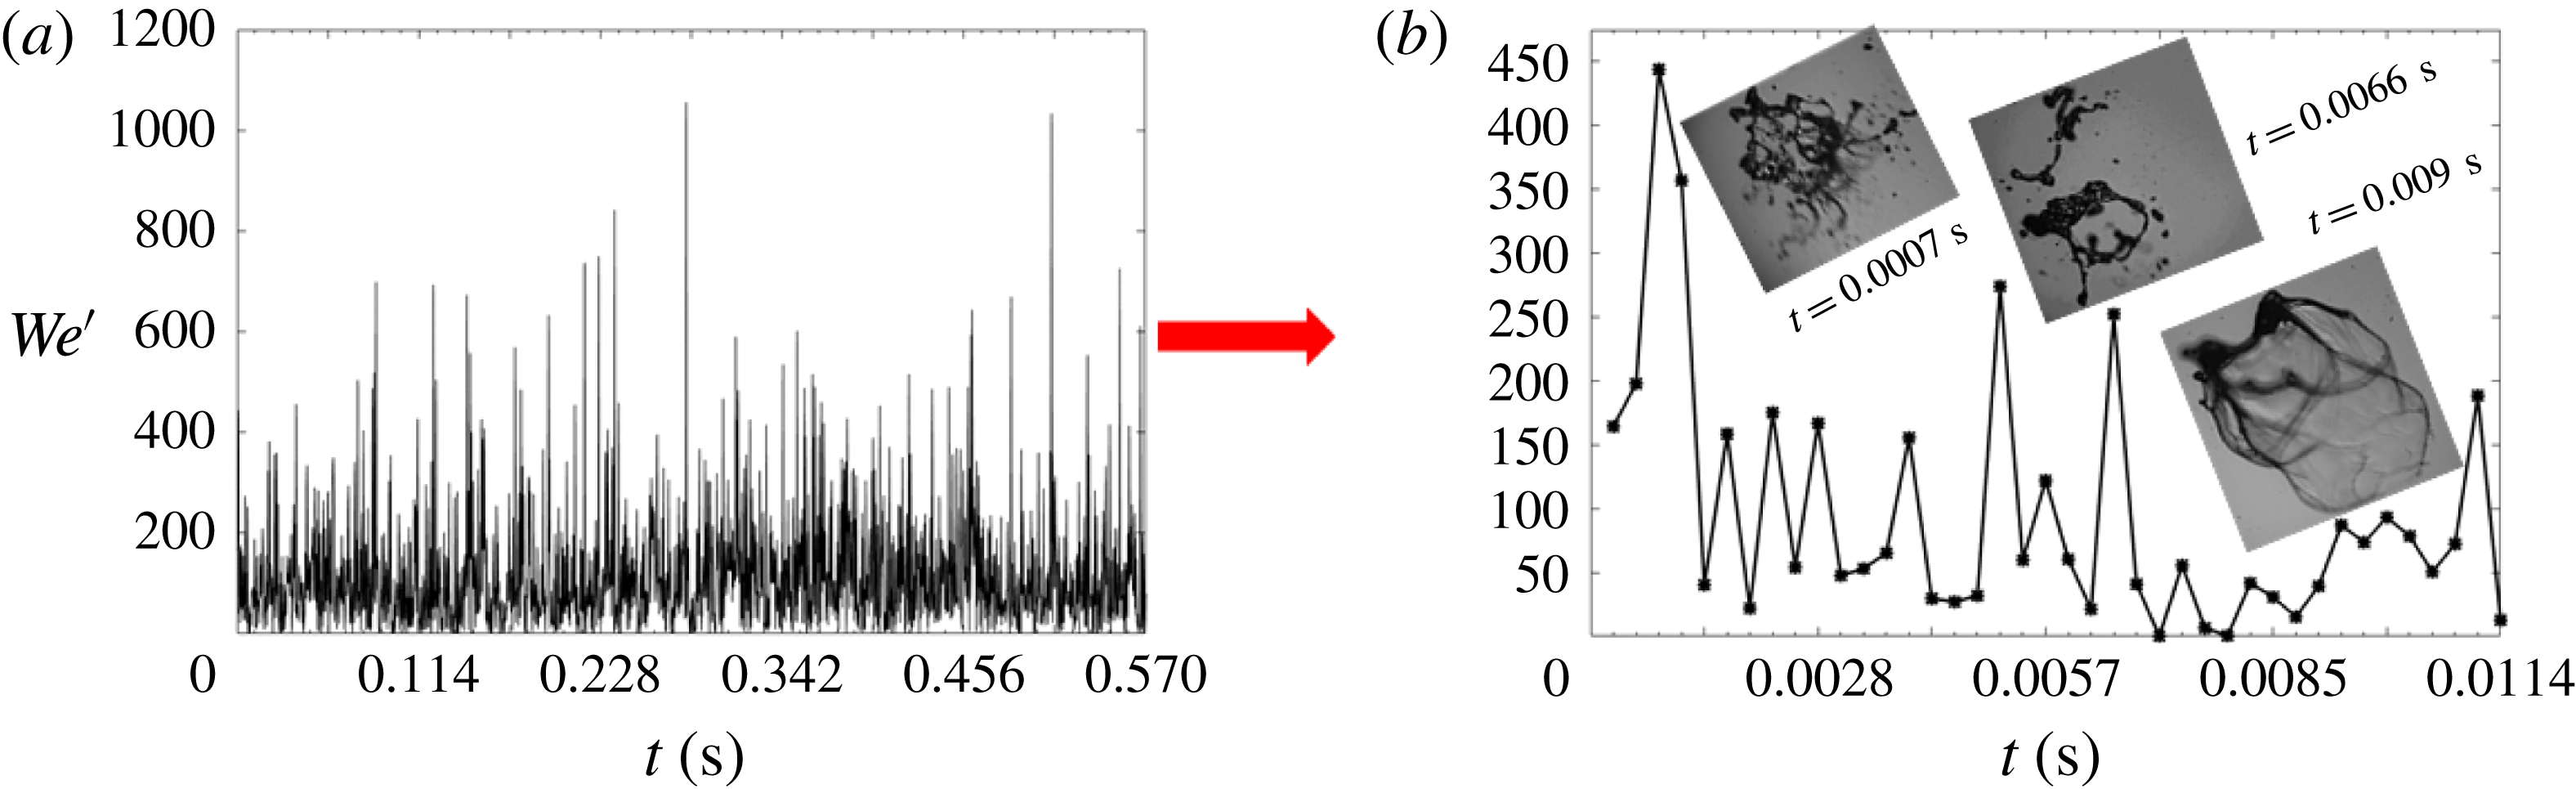
Figure 17. (a) Illustration of fluctuations observed in
 $We^{\prime }$
for a fixed flow rate (
$We^{\prime }$
for a fixed flow rate (
 $MR\sim 8164$
). (b) Cyclic behaviour of the Weber number
$MR\sim 8164$
). (b) Cyclic behaviour of the Weber number
 $(We^{\prime })$
for any given airflow rate (
$(We^{\prime })$
for any given airflow rate (
 $MR=8164$
).
$MR=8164$
).
6.3 Analysis of droplet eigenmodes
To evaluate the modal coupling in the droplet breakup process, POD is implemented for instantaneous droplet images acquired from high-speed shadowgraphy. The procedure involved in computing the POD is the same as shown in figure S6. For brevity, only one injection position (
 $y/R_{o}=1$
) pertaining to OSL 1 and ISL 1 across three flow conditions (
$y/R_{o}=1$
) pertaining to OSL 1 and ISL 1 across three flow conditions (
 $MR$
values) is shown. Similarly to the arguments made in coherence analysis, the eigenmodes (C1–C4) depict dominance of KH shear instability (i.e. mode 1, C1) in both cases. The results at the ISL suggest that even the second mode (C2) is shear dominant (figure 18
bii,iii). In contrast, the OSL exhibits shedding and shear as a combined mode. The other two modes (C3 and C4) are identified as helical and shedding modes. All of this modal information quantified from shadow images shows consistent behaviour, as seen in the flow field POD modes (figure 11). In coaxial atomization, it is well known that the atomization is driven by instability waves formed at the liquid–gas interface. The nature of the waves and their length scale
$MR$
values) is shown. Similarly to the arguments made in coherence analysis, the eigenmodes (C1–C4) depict dominance of KH shear instability (i.e. mode 1, C1) in both cases. The results at the ISL suggest that even the second mode (C2) is shear dominant (figure 18
bii,iii). In contrast, the OSL exhibits shedding and shear as a combined mode. The other two modes (C3 and C4) are identified as helical and shedding modes. All of this modal information quantified from shadow images shows consistent behaviour, as seen in the flow field POD modes (figure 11). In coaxial atomization, it is well known that the atomization is driven by instability waves formed at the liquid–gas interface. The nature of the waves and their length scale
 $(\unicode[STIX]{x1D706}_{max})$
are solely determined by the source of perturbations (i.e. instabilities) involved in the breakup process. Studies (Liu, Mather & Reitz Reference Liu, Mather and Reitz1993; Chandrasekhar Reference Chandrasekhar2013) have identified that the wave growth over the droplet surface is predominantly described by Rayleigh–Taylor (RT) and KH instabilities.
$(\unicode[STIX]{x1D706}_{max})$
are solely determined by the source of perturbations (i.e. instabilities) involved in the breakup process. Studies (Liu, Mather & Reitz Reference Liu, Mather and Reitz1993; Chandrasekhar Reference Chandrasekhar2013) have identified that the wave growth over the droplet surface is predominantly described by Rayleigh–Taylor (RT) and KH instabilities.

Figure 18. Spatial eigenmodes derived from high-speed instantaneous shadow images (
 $MR=8164$
): (a) OSL; (b) ISL; (i) OSL 1, ISL 1; (ii) OSL 2, ISL 2; (iii) OSL 3, ISL 3.
$MR=8164$
): (a) OSL; (b) ISL; (i) OSL 1, ISL 1; (ii) OSL 2, ISL 2; (iii) OSL 3, ISL 3.
The KH mode is shown to be a prime cause, where droplets are subjected to large shear like vortices and jets in cross-flow, to name a few (Lasheras, Villermaux & Hopfinger Reference Lasheras, Villermaux and Hopfinger1998; Marmottant & Villermaux Reference Marmottant and Villermaux2004). Subsequently, secondary events like pinching of ligaments, their breakup and formation of daughter droplets are governed by the RT instability. Here, the qualitative information about the dominant wavelength
 $(\unicode[STIX]{x1D706}_{max})$
can be predicted from POD temporal mode frequency spectra. The most unstable wavelength
$(\unicode[STIX]{x1D706}_{max})$
can be predicted from POD temporal mode frequency spectra. The most unstable wavelength
 $\unicode[STIX]{x1D706}_{max}$
and frequency
$\unicode[STIX]{x1D706}_{max}$
and frequency
 $f$
are related as
$f$
are related as
 $f_{KH}\approx U_{i}/\unicode[STIX]{x1D706}_{max}$
, where
$f_{KH}\approx U_{i}/\unicode[STIX]{x1D706}_{max}$
, where
 $U_{i}$
is the interfacial velocity.
$U_{i}$
is the interfacial velocity.
The frequency signatures derived using POD analysis for only the gas phase (
 $A$
) and for the combined liquid–gas phase (
$A$
) and for the combined liquid–gas phase (
 $C$
) are graphically shown in figure 19. Here, the results are presented as a function of the time-averaged Weber number
$C$
) are graphically shown in figure 19. Here, the results are presented as a function of the time-averaged Weber number
 $(\overline{We})$
. For low airflow rates
$(\overline{We})$
. For low airflow rates
 $(\overline{We}<\overline{We}_{c})$
, the frequency signature between
$(\overline{We}<\overline{We}_{c})$
, the frequency signature between
 $A$
and
$A$
and
 $C$
exhibits a decoupling effect i.e. less dominance of gas phase instabilities (region I). It is to be noted that high frequency values are observed for the liquid phase (
$C$
exhibits a decoupling effect i.e. less dominance of gas phase instabilities (region I). It is to be noted that high frequency values are observed for the liquid phase (
 ${\sim}800{-}1200~\text{Hz}$
); this may be due to the small-scale disturbances imposed due to the dominance of the surface tension
${\sim}800{-}1200~\text{Hz}$
); this may be due to the small-scale disturbances imposed due to the dominance of the surface tension
 $\unicode[STIX]{x1D70E}$
(Squire Reference Squire1953; Marmottant & Villermaux Reference Marmottant and Villermaux2004). Beyond
$\unicode[STIX]{x1D70E}$
(Squire Reference Squire1953; Marmottant & Villermaux Reference Marmottant and Villermaux2004). Beyond
 $\overline{We}\geqslant \overline{We}_{c}$
(i.e. region III), the dominance of the gas phase results in frequency values closer to the gas phase instability modes. In particular, the gas phase shear modes are completely synchronized with the droplet breakup process,
$\overline{We}\geqslant \overline{We}_{c}$
(i.e. region III), the dominance of the gas phase results in frequency values closer to the gas phase instability modes. In particular, the gas phase shear modes are completely synchronized with the droplet breakup process,
 $f_{A1,A2}\approx f_{C1,C2}$
. The lower magnitude of the frequency values observed in regions II and III is due to the long waves (Lasheras & Hopfinger Reference Lasheras and Hopfinger2000) induced by KH instabilities
$f_{A1,A2}\approx f_{C1,C2}$
. The lower magnitude of the frequency values observed in regions II and III is due to the long waves (Lasheras & Hopfinger Reference Lasheras and Hopfinger2000) induced by KH instabilities
 $(\unicode[STIX]{x1D706}_{max}\sim \unicode[STIX]{x1D706}_{KH})$
present in the swirling gas flow field.
$(\unicode[STIX]{x1D706}_{max}\sim \unicode[STIX]{x1D706}_{KH})$
present in the swirling gas flow field.
In the KH dominated wave region, the speed of propagation of the interface/shear layer (
 $U_{i}$
) induced by the most dominant wave can be related to the Dimotakis speed (Cebeci & Bradshaw Reference Cebeci and Bradshaw1977; Dimotakis Reference Dimotakis1986).
$U_{i}$
) induced by the most dominant wave can be related to the Dimotakis speed (Cebeci & Bradshaw Reference Cebeci and Bradshaw1977; Dimotakis Reference Dimotakis1986).

Figure 19. Modal frequency signature comparison between the swirling gas phase flow field (
 $A$
) and the high-speed instantaneous shadow images (
$A$
) and the high-speed instantaneous shadow images (
 $C$
) of the droplets.
$C$
) of the droplets.
The theoretical expression involves balance of dynamic pressure of the two fluid streams (liquid and gas phases) across the shear layer,
 $$\begin{eqnarray}\displaystyle & \displaystyle \unicode[STIX]{x1D70C}_{l}(V_{i}-\overline{V_{d}})_{l}^{2}=\unicode[STIX]{x1D70C}_{a}(\overline{V_{\unicode[STIX]{x1D714}}}-V_{i})_{g}^{2}, & \displaystyle\end{eqnarray}$$
 $$\begin{eqnarray}\displaystyle & \displaystyle V_{i}\sim \frac{\sqrt{\unicode[STIX]{x1D70C}_{a}}\overline{V_{\unicode[STIX]{x1D714}}}+\sqrt{\unicode[STIX]{x1D70C}_{l}}\overline{V_{d}}}{\sqrt{\unicode[STIX]{x1D70C}_{a}}+\sqrt{\unicode[STIX]{x1D70C}_{l}}}, & \displaystyle\end{eqnarray}$$
where
 $\overline{V_{d}}$
and
$\overline{V_{d}}$
and
 $\overline{V_{\unicode[STIX]{x1D714}}}$
are the time-averaged velocities of the droplets and vortices;
$\overline{V_{\unicode[STIX]{x1D714}}}$
are the time-averaged velocities of the droplets and vortices;
 $\overline{V_{\unicode[STIX]{x1D714}}}=\overline{\unicode[STIX]{x1D6E4}}/2\unicode[STIX]{x03C0}r$
. This condition will hold true only when the gas phase is extremely turbulent and the liquid flow is laminar (
$\overline{V_{\unicode[STIX]{x1D714}}}=\overline{\unicode[STIX]{x1D6E4}}/2\unicode[STIX]{x03C0}r$
. This condition will hold true only when the gas phase is extremely turbulent and the liquid flow is laminar (
 $\overline{V_{\unicode[STIX]{x1D714}}}\gg \overline{V_{d}}$
or
$\overline{V_{\unicode[STIX]{x1D714}}}\gg \overline{V_{d}}$
or
 $V_{i}>\overline{V_{d}}$
). The time scale
$V_{i}>\overline{V_{d}}$
). The time scale
 $(\unicode[STIX]{x1D70F}=1/f_{KH})$
pertaining to a cyclic event of the two-phase interaction observed from high-speed shadow images suggests an inline behaviour with Dimotakis speed (6.5). This implies that the acceleration of the interface is predominantly governed by KH waves.
$(\unicode[STIX]{x1D70F}=1/f_{KH})$
pertaining to a cyclic event of the two-phase interaction observed from high-speed shadow images suggests an inline behaviour with Dimotakis speed (6.5). This implies that the acceleration of the interface is predominantly governed by KH waves.
In summary, the primary breakup process is mostly dominated by counter-rotating vortices rather than shedding vortices. However, the shedding vortices may contribute towards further breakup of ligaments/droplets pinched off from the initial droplets during the primary interaction.
The corresponding
 $MR$
values for the aforementioned time-averaged Weber number regimes (I, II, III) are as follows:
$MR$
values for the aforementioned time-averaged Weber number regimes (I, II, III) are as follows:
-
(I)
$\overline{We}<\overline{We}_{c}\rightarrow 0\leqslant MR<450$
, two-way GL–LG regime (movie 6); -
(II)
$\overline{We}\approx \overline{We}_{c}\rightarrow 450<MR\leqslant 1920$
, transition to one-way G–L regime (movie 7); -
(III)
$\overline{We}\geqslant \overline{We}_{c}\rightarrow 3720\leqslant MR\leqslant 8164$
, strong one-way GL regime (movie 8).


7 Spatial dispersion of droplets in the swirling gas flow field
In liquid-fuelled combustors, important aspects like the mixing field and the dispersed phase homogenization are governed by the interaction dynamics (Moin & Apte Reference Moin and Apte2006; Wang et al.
Reference Wang, Yang, Hsiao, Hsieh and Mongia2007). In this section, we begin by presenting results to showcase the mechanism of inhomogeneous dispersion of droplets in the given flow field across the LG–GL and GL interaction conditions. This is more detailed and insightful than the single-parameter dispersion angle analysis (§ 4) from global and local viewpoints. Dispersion of droplets in a given flow field is governed by the Stokes number (
 $St$
) (Crowe, Troutt & Chung Reference Crowe, Troutt and Chung1996), which is defined as the ratio between the droplet response time scale
$St$
) (Crowe, Troutt & Chung Reference Crowe, Troutt and Chung1996), which is defined as the ratio between the droplet response time scale
 $(\unicode[STIX]{x1D70F}_{D})$
and the flow time scale
$(\unicode[STIX]{x1D70F}_{D})$
and the flow time scale
 $(\unicode[STIX]{x1D70F}_{f})$
,
$(\unicode[STIX]{x1D70F}_{f})$
,
 $$\begin{eqnarray}\displaystyle St\sim \frac{\unicode[STIX]{x1D70F}_{D}}{\unicode[STIX]{x1D70F}_{f}}. & & \displaystyle\end{eqnarray}$$
The droplet time scale is a strong function of its diameter (
 $d_{o}$
) and can be expressed as
$d_{o}$
) and can be expressed as
 $$\begin{eqnarray}\displaystyle \unicode[STIX]{x1D70F}_{D}\sim \frac{\unicode[STIX]{x1D70C}_{l}d^{2}}{18\unicode[STIX]{x1D707}}. & & \displaystyle\end{eqnarray}$$
The flow time scale can be expressed as a function of the velocity and the characteristic length scale (
 $L$
) as follows:
$L$
) as follows:
 $$\begin{eqnarray}\displaystyle \unicode[STIX]{x1D70F}_{f}\sim \frac{L}{U}. & & \displaystyle\end{eqnarray}$$
Lazaro & Lasheras (Reference Lazaro and Lasheras1992) and Longmire & Eaton (Reference Longmire and Eaton1992) have shown that in highly turbulent shear flows, the time scale
 $\unicode[STIX]{x1D70F}_{f}$
is governed by time scales associated with vortical structures induced by instability modes present in the flow field. In particular, the large-scale coherent structures are identified as the prime sources that govern
$\unicode[STIX]{x1D70F}_{f}$
is governed by time scales associated with vortical structures induced by instability modes present in the flow field. In particular, the large-scale coherent structures are identified as the prime sources that govern
 $\unicode[STIX]{x1D70F}_{f}$
(Crowe, Chung & Troutt Reference Crowe, Chung and Troutt1988; Hishida, Ando & Maeda Reference Hishida, Ando and Maeda1992). In turbulent shear layers, Aggarwal (Reference Aggarwal1994) has shown that
$\unicode[STIX]{x1D70F}_{f}$
(Crowe, Chung & Troutt Reference Crowe, Chung and Troutt1988; Hishida, Ando & Maeda Reference Hishida, Ando and Maeda1992). In turbulent shear layers, Aggarwal (Reference Aggarwal1994) has shown that
 $\unicode[STIX]{x1D70F}_{f}$
can be derived from the fundamental frequency of the dominant instability mode. Since, in this study, the KH mode is identified as the dominant instability mechanism,
$\unicode[STIX]{x1D70F}_{f}$
can be derived from the fundamental frequency of the dominant instability mode. Since, in this study, the KH mode is identified as the dominant instability mechanism,
 $\unicode[STIX]{x1D70F}_{f}$
is defined as
$\unicode[STIX]{x1D70F}_{f}$
is defined as
 $$\begin{eqnarray}\displaystyle \unicode[STIX]{x1D70F}_{f}\sim \frac{1}{f_{KH}}. & & \displaystyle\end{eqnarray}$$
From (7.2)–(7.4), the final expression is written as
 $$\begin{eqnarray}\displaystyle St\sim \frac{\unicode[STIX]{x1D70F}_{D}}{\unicode[STIX]{x1D70F}_{f}}\sim \left(\frac{\unicode[STIX]{x1D70C}_{l}d^{2}}{18\unicode[STIX]{x1D707}}\right)\ast f_{KH}. & & \displaystyle\end{eqnarray}$$
7.1 Global dispersion field
The global dispersion field is computed by tracking the individual particles/droplets present in the instantaneous flow field images (acquired with simultaneous PIV). The technique used here computes the spatial location of each droplet present in a given frame (the steps are shown in figure S9). With the computed spatial information
 $(r/R_{o}^{\prime },y/R_{o})$
on the droplets, a time-averaged dispersion map (see figure 20
a,b and figure S10a,b) is generated for the three Weber number regimes (I, II, III) as shown in figure 19. In figure 20, only two representative cases pertaining to OSL and ISL are shown, the remaining cases can be found in the supplementary material (see figure S10).
$(r/R_{o}^{\prime },y/R_{o})$
on the droplets, a time-averaged dispersion map (see figure 20
a,b and figure S10a,b) is generated for the three Weber number regimes (I, II, III) as shown in figure 19. In figure 20, only two representative cases pertaining to OSL and ISL are shown, the remaining cases can be found in the supplementary material (see figure S10).
From figure 20(a,b), it is perceived that for low Weber numbers,
 $\overline{We}<\overline{We}_{c}$
, the droplets are not widely dispersed because of low momentum transfer from the gas phase. In this regime (I, II), the breakup process (vibrational, bag) does not yield any smaller sized droplets, which in turn causes the Stokes number to be very high (
$\overline{We}<\overline{We}_{c}$
, the droplets are not widely dispersed because of low momentum transfer from the gas phase. In this regime (I, II), the breakup process (vibrational, bag) does not yield any smaller sized droplets, which in turn causes the Stokes number to be very high (
 $St\gg 1$
). The quantitative treatment of the Stokes number (
$St\gg 1$
). The quantitative treatment of the Stokes number (
 $St$
) will be elucidated in the size distribution section (see the supplementary material, § 2.5). This (
$St$
) will be elucidated in the size distribution section (see the supplementary material, § 2.5). This (
 $St\gg 1$
) prevents the droplets from dispersing effectively in the flow field. The same mechanism is observed for both OSL and ISL injections. On the contrary, in regime III, the breakup process dominated by gas phase shear instabilities yields several smaller sized droplets (see figure 16
c–e). Among these smaller sized droplets, those satisfying
$St\gg 1$
) prevents the droplets from dispersing effectively in the flow field. The same mechanism is observed for both OSL and ISL injections. On the contrary, in regime III, the breakup process dominated by gas phase shear instabilities yields several smaller sized droplets (see figure 16
c–e). Among these smaller sized droplets, those satisfying
 $St\ll 1$
follow the gas flow path effectively.
$St\ll 1$
follow the gas flow path effectively.

Figure 20. The spatial dispersion of the droplets across the three flow regimes (I, II, III): (a) OSL 1; (b) ISL 1 (
 $MR=0$
, 450, 8164).
$MR=0$
, 450, 8164).
(i) Dispersion mechanism in the OSL. In § 5, it is inferred that even for one particular flow rate, fluctuations in
 $\unicode[STIX]{x1D6E4}^{\prime }$
lead to different breakup mechanisms (bag, multimode, catastrophic). In this context, two major forms of dispersion field are observed in the OSL. First, when
$\unicode[STIX]{x1D6E4}^{\prime }$
lead to different breakup mechanisms (bag, multimode, catastrophic). In this context, two major forms of dispersion field are observed in the OSL. First, when
 $\unicode[STIX]{x1D6E4}^{\prime }<\unicode[STIX]{x1D6E4}_{c}^{\prime }$
, the injected droplets predominantly do not interact with the vortices and rather penetrate inside the vortex core (figure 21
ai). In this situation, the droplets are mostly subjected to axial shear, which results in either bag or multimode breakup. This induces very few smaller sized droplets of Stokes number
$\unicode[STIX]{x1D6E4}^{\prime }<\unicode[STIX]{x1D6E4}_{c}^{\prime }$
, the injected droplets predominantly do not interact with the vortices and rather penetrate inside the vortex core (figure 21
ai). In this situation, the droplets are mostly subjected to axial shear, which results in either bag or multimode breakup. This induces very few smaller sized droplets of Stokes number
 $St<1$
, which are entrained in the recirculation region (
$St<1$
, which are entrained in the recirculation region (
 $0.5\leqslant r/R_{o}\leqslant -0.5$
; see figure 21
ai). On the other hand, when
$0.5\leqslant r/R_{o}\leqslant -0.5$
; see figure 21
ai). On the other hand, when
 $\unicode[STIX]{x1D6E4}^{\prime }>\unicode[STIX]{x1D6E4}_{c}^{\prime }$
, on account of strong interaction with vortices, the droplets undergo catastrophic breakup, which yields a greater number of small-sized droplets. Subsequent to breakup, only the
$\unicode[STIX]{x1D6E4}^{\prime }>\unicode[STIX]{x1D6E4}_{c}^{\prime }$
, on account of strong interaction with vortices, the droplets undergo catastrophic breakup, which yields a greater number of small-sized droplets. Subsequent to breakup, only the
 $St\gg 1$
droplets stay in the OSL region (
$St\gg 1$
droplets stay in the OSL region (
 $-0.6\leqslant r/R_{o}\leqslant 1.6$
; see figure 21
aii) due to the resistance offered by high-strength vortices. Moreover, the droplets in these regions tend to disperse radially outwards due to the transfer of gas phase swirl momentum to the droplets. The small-sized droplets (
$-0.6\leqslant r/R_{o}\leqslant 1.6$
; see figure 21
aii) due to the resistance offered by high-strength vortices. Moreover, the droplets in these regions tend to disperse radially outwards due to the transfer of gas phase swirl momentum to the droplets. The small-sized droplets (
 $St<1$
) are entrained in the recirculation region; few droplets of
$St<1$
) are entrained in the recirculation region; few droplets of
 $St\sim 1$
are found to penetrate inside.
$St\sim 1$
are found to penetrate inside.

Figure 21. The qualitative dispersion mechanisms of the injected droplets in the swirling gas flow field as a function of the Stokes number (
 $St$
),
$St$
),
 $MR=8164$
: (a) OSL 1; (b) ISL 1.
$MR=8164$
: (a) OSL 1; (b) ISL 1.
(ii) Dispersion mechanism in the ISL. The fundamental difference observed in the dispersion among the ISL and OSL injections is the formation of droplet clusters within the VCC in the ISL region (shown as dotted circles in figures 20
b and S10b). Further, here the droplets are first deflected upwards from the point of injection before they interact with the vortices. In the ISL, as already elucidated in the global flow field section, the vortex strength is not disturbed by injected droplets. This implies that at high airflow rates, the droplets in the ISL are predominantly subjected to shear breakup, which ultimately leads to much smaller droplet sizes. The droplets with Stokes numbers of order
 $O(\ll 1)$
are trapped inside the recirculation zone (see figure 21
b). Further downstream of the VCC, the droplets with
$O(\ll 1)$
are trapped inside the recirculation zone (see figure 21
b). Further downstream of the VCC, the droplets with
 $St<1$
are entrained by recirculated flow (indicated as a blue line in figure 21
b). In addition to the spatial clustering observed with counter-rotating eddies, the shedding eddies contribute to droplet cluster formation (particularly for downstream injections
$St<1$
are entrained by recirculated flow (indicated as a blue line in figure 21
b). In addition to the spatial clustering observed with counter-rotating eddies, the shedding eddies contribute to droplet cluster formation (particularly for downstream injections
 $y/R_{o}=1$
, 1.5 in figure S10b). The remaining droplets
$y/R_{o}=1$
, 1.5 in figure S10b). The remaining droplets
 $(St\gg 1)$
stay in the outside region
$(St\gg 1)$
stay in the outside region
 $(-2\leqslant r/R_{o}\leqslant -3)$
. This clustering of droplets with large-scale eddies creates spatial non-uniformity in the dispersion process. This phenomenon can be viewed as a result of inertial clustering due to the response between the carrier phase and the dispersed phase (Fessler, Kulick & Eaton Reference Fessler, Kulick and Eaton1994; Kulick et al.
Reference Kulick, Fessler and Eaton1994).
$(-2\leqslant r/R_{o}\leqslant -3)$
. This clustering of droplets with large-scale eddies creates spatial non-uniformity in the dispersion process. This phenomenon can be viewed as a result of inertial clustering due to the response between the carrier phase and the dispersed phase (Fessler, Kulick & Eaton Reference Fessler, Kulick and Eaton1994; Kulick et al.
Reference Kulick, Fessler and Eaton1994).
In addition, the more qualitative nature of the droplet dispersion/response with respect to the swirling gas flow field can be understood from the flow field induced by the droplets. To do this, vector postprocessing is implemented on PIV raw images considering only droplets in the flow field (i.e. without seeding the gas flow). It is well known that in PIV, the flow field can be delineated only if the injected particle response has a linear relationship with the flow time scale (Raffel et al. Reference Raffel, Willert, Wereley and Kompenhans2013). The vector field reconstructed by considering only droplets in the flow field is shown in the supplementary material (see figure S11) for brevity.
The qualitative view of the spatial dispersion of the droplets in the swirling gas phase flow field is presented in § 7, where the global picture is elucidated as a function of the Stokes number. The more quantitative information in terms of the size distribution is presented in supplementary § 2.5 (figure S12). In figure S12, the droplet size distribution pertaining to region III (i.e.
 $\overline{We}>\overline{We}_{c}$
) is subdivided into three regimes in terms of the Stokes number (figure S12b,c). For higher
$\overline{We}>\overline{We}_{c}$
) is subdivided into three regimes in terms of the Stokes number (figure S12b,c). For higher
 $We$
(
$We$
(
 $We>500$
), the diameter distribution shows polydisperse characteristics in two predominant ranges of
$We>500$
), the diameter distribution shows polydisperse characteristics in two predominant ranges of
 ${\sim}10{-}20~\unicode[STIX]{x03BC}\text{m}$
(
${\sim}10{-}20~\unicode[STIX]{x03BC}\text{m}$
(
 $St<1$
; see figure S12b,c) and
$St<1$
; see figure S12b,c) and
 ${\sim}50{-}60~\unicode[STIX]{x03BC}\text{m}$
(
${\sim}50{-}60~\unicode[STIX]{x03BC}\text{m}$
(
 $St>1$
) for both ISL and OSL injections. The droplet size corresponding to
$St>1$
) for both ISL and OSL injections. The droplet size corresponding to
 $St<1$
is identified as the critical diameter (
$St<1$
is identified as the critical diameter (
 $D_{critical}$
). It should be noted that ISL injection exhibits a greater number of
$D_{critical}$
). It should be noted that ISL injection exhibits a greater number of
 $St\ll 1$
droplets than OSL injection (see figure S12b,c).
$St\ll 1$
droplets than OSL injection (see figure S12b,c).
8 Spatial homogeneity index
The qualitative treatment of droplet dispersion in the swirling gas flow field is outlined in § 7. Now, we resort to quantitative analysis (i.e. droplet number density in the spatial field), as shown in this section. A parameter called the homogeneity index
 $\unicode[STIX]{x1D702}$
is proposed to quantify droplet dispersion in the flow field. Furthermore, the way in which the cyclic fluctuations of
$\unicode[STIX]{x1D702}$
is proposed to quantify droplet dispersion in the flow field. Furthermore, the way in which the cyclic fluctuations of
 $We^{\prime }$
(circulation strength) result in an instantaneous inhomogeneous dispersion of droplets is elucidated with the phase-averaged dispersion angle.
$We^{\prime }$
(circulation strength) result in an instantaneous inhomogeneous dispersion of droplets is elucidated with the phase-averaged dispersion angle.
Garncarek (Reference Garncarek1993) and Czainski, Garncarek & Piasecki (Reference Czainski, Garncarek and Piasecki1994) proposed a statistical tool to identify the homogeneity in the distribution of chosen parameters in a given spatial field. Later, Hayakawa, Okajima & Tokuoka (Reference Hayakawa, Okajima and Tokuoka2008) implemented this approach to evaluate the spatial inhomogeneity in unimodal and bimodal spray interaction processes. Basically, this approach involves discretization of a given spatial field into
 $i$
windows. Subsequently, one has to define the number of quantities (parameters of interest) present in each window. Mathematically, the inhomogeneity index
$i$
windows. Subsequently, one has to define the number of quantities (parameters of interest) present in each window. Mathematically, the inhomogeneity index
 $\unicode[STIX]{x1D702}$
is defined as
$\unicode[STIX]{x1D702}$
is defined as
 $$\begin{eqnarray}\displaystyle \unicode[STIX]{x1D702}=\mathop{\sum }_{i=1}^{j}\left(n_{i}-\frac{N}{j}\right)^{2},\quad 0\leqslant \unicode[STIX]{x1D702}\leqslant 1. & & \displaystyle\end{eqnarray}$$
Here,
 $n_{i}$
is the number of quantities present in each
$n_{i}$
is the number of quantities present in each
 $i$
th box,
$i$
th box,
 $N$
is the sum of all
$N$
is the sum of all
 $n_{i}$
values and
$n_{i}$
values and
 $j$
is the total number of boxes. The quantity
$j$
is the total number of boxes. The quantity
 $n_{i}$
can be either dimensional or non-dimensional. Here, we treat it as non-dimensional by dividing it by the total sum (i.e.
$n_{i}$
can be either dimensional or non-dimensional. Here, we treat it as non-dimensional by dividing it by the total sum (i.e.
 $n_{i}=N_{i}/N$
). This process is carried out for each instantaneous image
$n_{i}=N_{i}/N$
). This process is carried out for each instantaneous image
 $(\unicode[STIX]{x1D702}_{i})$
and summed over all of the images to obtain the time-averaged homogeneity index
$(\unicode[STIX]{x1D702}_{i})$
and summed over all of the images to obtain the time-averaged homogeneity index
 $\unicode[STIX]{x1D702}$
.
$\unicode[STIX]{x1D702}$
.
Essentially, the value of
 $\unicode[STIX]{x1D702}$
varies from 0 to 1; the smaller the value is, the higher the dispersion of the droplets is in a given flow field. The spatial flow field is divided into 16 equal-sized windows
$\unicode[STIX]{x1D702}$
varies from 0 to 1; the smaller the value is, the higher the dispersion of the droplets is in a given flow field. The spatial flow field is divided into 16 equal-sized windows
 $(j=16)$
and the number of droplets present in each box is calculated. The 3D spatial inhomogeneity index map is constructed as a function of the Weber number across three axial injection positions (see figure 22). It is seen that
$(j=16)$
and the number of droplets present in each box is calculated. The 3D spatial inhomogeneity index map is constructed as a function of the Weber number across three axial injection positions (see figure 22). It is seen that
 $\unicode[STIX]{x1D702}$
exhibits a monotonic behaviour (decreases linearly) with the Weber number
$\unicode[STIX]{x1D702}$
exhibits a monotonic behaviour (decreases linearly) with the Weber number
 $(\overline{We})$
. The obtained results are consistent with the spatial dispersion map shown in figures 20(a,b) and S10(a,b).
$(\overline{We})$
. The obtained results are consistent with the spatial dispersion map shown in figures 20(a,b) and S10(a,b).
8.1 Dispersion-governing parameters
The instantaneous droplet dispersion and spatial homogeneity may exhibit higher or lower values than the ones shown here in the time-averaged map. The major parameter that governs this process is the local/global Stokes number, which in turn is a function of the fluctuations in the vortex strength induced by gas phase instabilities and the cyclic behaviour of the Weber number in the temporal domain, as already illustrated in figure 17.

Figure 22. Illustration of the spatial inhomogeneity of the droplet dispersion in the swirling gas flow field: (a) OSL; (b) ISL.
In addition, other variables like droplet–droplet and droplet–gas velocity correlations and turbulence modulations are also shown to be parameters responsible for the spatial dispersion (Mashayek Reference Mashayek1998; Balachandar & Eaton Reference Balachandar and Eaton2010; Sahu, Hardalupas & Taylor Reference Sahu, Hardalupas and Taylor2014). These effects are not explicitly considered in this study.
In § 4, it is shown that any perturbation applied to
 $\unicode[STIX]{x1D6E4}^{\prime }$
is reflected in the droplet response
$\unicode[STIX]{x1D6E4}^{\prime }$
is reflected in the droplet response
 $\unicode[STIX]{x1D703}^{\prime }$
. In a given set of time series images, the droplet responses may vary (i.e. phase). For instance, the cyclic behaviour of the Weber number shown in figure 17 exhibits orderly repetitiveness over the time period (see figure 23
a). To illustrate this phenomenon, the phase-averaged dispersion angle
$\unicode[STIX]{x1D703}^{\prime }$
. In a given set of time series images, the droplet responses may vary (i.e. phase). For instance, the cyclic behaviour of the Weber number shown in figure 17 exhibits orderly repetitiveness over the time period (see figure 23
a). To illustrate this phenomenon, the phase-averaged dispersion angle
 $\overline{\unicode[STIX]{x1D703}}_{\emptyset }=\sum _{i=1}^{n}(((\unicode[STIX]{x1D703}_{\emptyset }^{\prime })_{1}+\cdots +(\unicode[STIX]{x1D703}_{\emptyset }^{\prime })_{n})/N)$
is evaluated from the given set of time series images (see figure 23). The dispersion angle corresponding to the peak value observed in each cycle is considered as instantaneous,
$\overline{\unicode[STIX]{x1D703}}_{\emptyset }=\sum _{i=1}^{n}(((\unicode[STIX]{x1D703}_{\emptyset }^{\prime })_{1}+\cdots +(\unicode[STIX]{x1D703}_{\emptyset }^{\prime })_{n})/N)$
is evaluated from the given set of time series images (see figure 23). The dispersion angle corresponding to the peak value observed in each cycle is considered as instantaneous,
 $\unicode[STIX]{x1D703}_{\emptyset }^{\prime }$
. The steps involved in the calculation of
$\unicode[STIX]{x1D703}_{\emptyset }^{\prime }$
. The steps involved in the calculation of
 $\overline{\unicode[STIX]{x1D703}}_{\emptyset }$
are shown in figure 23(a). The graph suggests that the phase-averaged dispersion angle
$\overline{\unicode[STIX]{x1D703}}_{\emptyset }$
are shown in figure 23(a). The graph suggests that the phase-averaged dispersion angle
 $\overline{\unicode[STIX]{x1D703}}_{\emptyset }$
differs by a factor of
$\overline{\unicode[STIX]{x1D703}}_{\emptyset }$
differs by a factor of
 ${\sim}10^{\circ }{-}15^{\circ }$
in GL interaction regimes (III) compared with the time-averaged dispersion angle
${\sim}10^{\circ }{-}15^{\circ }$
in GL interaction regimes (III) compared with the time-averaged dispersion angle
 $\overline{\unicode[STIX]{x1D703}}$
. Another influencing parameter is the choice of spatial injection location. Again, both axial and radial positions yield considerable change in the dispersion field. The dispersion of the droplets injected in the near field
$\overline{\unicode[STIX]{x1D703}}$
. Another influencing parameter is the choice of spatial injection location. Again, both axial and radial positions yield considerable change in the dispersion field. The dispersion of the droplets injected in the near field
 $(y/R_{o}\leqslant 1;\text{OSL }1,2;\text{ISL }1,2)$
is predominantly governed by counter-rotating eddies. On the other hand, the shedding vortices play a significant role in the case of droplets injected at downstream positions
$(y/R_{o}\leqslant 1;\text{OSL }1,2;\text{ISL }1,2)$
is predominantly governed by counter-rotating eddies. On the other hand, the shedding vortices play a significant role in the case of droplets injected at downstream positions
 $(y/R_{o}>1;\text{OSL }3;\text{ISL }3)$
.
$(y/R_{o}>1;\text{OSL }3;\text{ISL }3)$
.

Figure 23. (a) The steps involved in extraction of the phase-averaged dispersion angle
 $(\overline{\unicode[STIX]{x1D703}}_{\emptyset })$
are shown over three cycles. (b,c) Comparison of the time-averaged droplet response
$(\overline{\unicode[STIX]{x1D703}}_{\emptyset })$
are shown over three cycles. (b,c) Comparison of the time-averaged droplet response
 $(\overline{\unicode[STIX]{x1D703}})$
with the phase-averaged
$(\overline{\unicode[STIX]{x1D703}})$
with the phase-averaged
 $(\overline{\unicode[STIX]{x1D703}}_{\emptyset })$
response for (b) OSL 2 and (c) ISL 2.
$(\overline{\unicode[STIX]{x1D703}}_{\emptyset })$
response for (b) OSL 2 and (c) ISL 2.
9 Summary and conclusions
The dispersion mechanisms and the breakup of droplets on interaction with large-scale coherent eddies in a swirling gas flow field have been meticulously analysed using time-resolved optical diagnostic tools. In particular, we have reported how the spatial location of the droplet injection influences the flow–droplet coupling and the dispersion mechanism. In this study, droplets were injected as monodispersed streams at certain preselected spatial locations corresponding to the swirl flow field. These positions were chosen near the vortex breakdown bubble and the OSLs, as laid out in figures 2(a) and 6. Global flow field characterization (§ 3) was carried out with and without the presence of droplets using time-resolved PIV to establish the momentum coupling process between the gas phase and the droplets. The dynamic pressure
 $(\unicode[STIX]{x1D709})$
and the momentum ratio (
$(\unicode[STIX]{x1D709})$
and the momentum ratio (
 $MR$
) were used as important global governing parameters to quantify the coupling process. For instance, two-way coupling (LG–GL) was observed for low airflow rates
$MR$
) were used as important global governing parameters to quantify the coupling process. For instance, two-way coupling (LG–GL) was observed for low airflow rates
 $(0\leqslant MR<450)$
and transition from two-way LG–GL to one-way GL coupling was observed with progressive increase in the airflow rate
$(0\leqslant MR<450)$
and transition from two-way LG–GL to one-way GL coupling was observed with progressive increase in the airflow rate
 $(450\leqslant MR<8164)$
. The airflow rate pertaining to this transition was delineated as the critical momentum ratio
$(450\leqslant MR<8164)$
. The airflow rate pertaining to this transition was delineated as the critical momentum ratio
 $MR_{c}$
. The abovementioned observations are pictorially illustrated in figure 24. In addition, the local disruption of the vortex core with respect to the injection location is also delineated using the time-averaged flow field.
$MR_{c}$
. The abovementioned observations are pictorially illustrated in figure 24. In addition, the local disruption of the vortex core with respect to the injection location is also delineated using the time-averaged flow field.
Subsequently, coherence analysis was carried out to reveal the dynamic correlation between the circulation strength
 $(\unicode[STIX]{x1D6E4}^{\prime })$
of the vortices and the droplet dispersion angle
$(\unicode[STIX]{x1D6E4}^{\prime })$
of the vortices and the droplet dispersion angle
 $\unicode[STIX]{x1D703}^{\prime }$
. The results revealed that the droplets injected at both the OSL and the ISL predominantly exhibited high coherence values
$\unicode[STIX]{x1D703}^{\prime }$
. The results revealed that the droplets injected at both the OSL and the ISL predominantly exhibited high coherence values
 $\{C_{\unicode[STIX]{x1D6E4}^{\prime }\unicode[STIX]{x1D703}^{\prime }}(f)\sim 0.9\}$
around
$\{C_{\unicode[STIX]{x1D6E4}^{\prime }\unicode[STIX]{x1D703}^{\prime }}(f)\sim 0.9\}$
around
 ${\sim}$
80–100 Hz. However, in addition, droplets at OSL 2, 3 showed intermediate coherence values (
${\sim}$
80–100 Hz. However, in addition, droplets at OSL 2, 3 showed intermediate coherence values (
 ${\sim}$
0.5) at 400–700 Hz. To understand this behaviour, POD was implemented over the instantaneous flow field to extract the contribution of the principal energetic coherent structures of the gas flow. The TKE spectra (eigenmodes) from the POD exhibited dominance of the KH mode (
${\sim}$
0.5) at 400–700 Hz. To understand this behaviour, POD was implemented over the instantaneous flow field to extract the contribution of the principal energetic coherent structures of the gas flow. The TKE spectra (eigenmodes) from the POD exhibited dominance of the KH mode (
 ${\sim}$
80 % of total energy) in ISL 1–3 and OSL 1, and combined action of the KH mode and the shedding mode was observed in OSL 2, 3 (see figure 24). In addition, the coherence analysis carried out between the POD temporal modes and
${\sim}$
80 % of total energy) in ISL 1–3 and OSL 1, and combined action of the KH mode and the shedding mode was observed in OSL 2, 3 (see figure 24). In addition, the coherence analysis carried out between the POD temporal modes and
 $\unicode[STIX]{x1D703}^{\prime }$
revealed the physical mechanism of modal coupling between the flow circulation and the dispersion at multiple frequencies.
$\unicode[STIX]{x1D703}^{\prime }$
revealed the physical mechanism of modal coupling between the flow circulation and the dispersion at multiple frequencies.
Next, the droplet breakup dynamics was visualized using a high-speed shadow imaging technique. The results were presented as a function of the Weber number defined based on instantaneous and time-averaged circulation strengths,
 $\unicode[STIX]{x1D6E4}^{\prime }$
and
$\unicode[STIX]{x1D6E4}^{\prime }$
and
 $\overline{\unicode[STIX]{x1D6E4}}$
. No significant breakup was observed in the LG–GL coupling regime; rather, droplets were subjected to shape oscillation/deformation. For critical airflow rates
$\overline{\unicode[STIX]{x1D6E4}}$
. No significant breakup was observed in the LG–GL coupling regime; rather, droplets were subjected to shape oscillation/deformation. For critical airflow rates
 $(MR_{c};16<\overline{We}\leqslant 57)$
, the bag breakup process was witnessed. The Weber number corresponding to this condition is delineated as
$(MR_{c};16<\overline{We}\leqslant 57)$
, the bag breakup process was witnessed. The Weber number corresponding to this condition is delineated as
 $\overline{We}_{c}$
. Beyond
$\overline{We}_{c}$
. Beyond
 $\overline{We}_{c}$
, the droplets predominantly showed sheet thinning
$\overline{We}_{c}$
, the droplets predominantly showed sheet thinning
 $(95<\overline{We}\leqslant 335)$
and catastrophic breakup (
$(95<\overline{We}\leqslant 335)$
and catastrophic breakup (
 $335<\overline{We}\leqslant 500$
) processes. For the first time, it has been showcased that the temporal oscillations of the Weber number
$335<\overline{We}\leqslant 500$
) processes. For the first time, it has been showcased that the temporal oscillations of the Weber number
 $We^{\prime }$
lead to different breakup mechanisms even for fixed airflow rates (fixed
$We^{\prime }$
lead to different breakup mechanisms even for fixed airflow rates (fixed
 $MR$
).
$MR$
).

Figure 24. Illustration of the key processes involved in droplet–vortex interaction in a swirling gas flow field.
Finally, the global dispersion map and the mechanisms of dispersion across the ISL and the OSL were delineated as a function of the Stokes number (
 $St$
). During GL coupling, the droplet dispersion retraces the swirling gas flow path. This is due to the attenuation of long KH waves in the breakup dynamics. For low
$St$
). During GL coupling, the droplet dispersion retraces the swirling gas flow path. This is due to the attenuation of long KH waves in the breakup dynamics. For low
 $MR$
values, the droplet response time scales are not correlated with the flow time scale during LG–GL conditions. In particular, two different key observations were made in the OSL and the ISL.
$MR$
values, the droplet response time scales are not correlated with the flow time scale during LG–GL conditions. In particular, two different key observations were made in the OSL and the ISL.
-
(i) In ISL injection, the droplets undergo breakup before they reaches the rotating eddies. This pre-breakup of droplets induces a drastic reduction in size, which ultimately leads to lower local Stokes number. Due to this event, the extremely small-sized droplets are trapped in the vortex core (figures S8b and 20 b).
-
(ii) The same is not observed with OSL injection, where the droplets are deflected away from the vortices.
Acknowledgements
Financial support from the DST under the Swarnajayanti Fellowship (DST/SJF/ETA-02/2013-14) scheme and the National Centre for Combustion Research and Development (NCCRD) is gratefully acknowledged.
Supplementary movies
Supplementary movies are available at https://doi.org/10.1017/jfm.2017.495.


