


1. Introduction
Energetic materials can produce high-enthalpy gas and chemical compounds in a useful form, which helps us achieve the modern life. By means of the physical effect, the high pressure generated by detonating energetic materials can blast hard rock for the construction of dams, tunnels, roads, etc., and can be used for a new propulsion system, such as a rotating detonation engine. Energetic materials are widely used in several technologies while controlling them and ensuring safety. However, an accidental explosion would produce a blast wave affecting humans and residential areas. In August 2020 a series of explosions occurred in the Port of Beirut. A large quantity of ammonium nitrate (approximately 2750 tons) exploded in a warehouse, causing approximately 200 deaths and over 6000 injuries (Rigby et al. Reference Rigby, Lodge, Alotaibi, Barr, Clarke, Langdon and Tyas2020). Rigby et al. (Reference Rigby, Lodge, Alotaibi, Barr, Clarke, Langdon and Tyas2020) estimated that this explosive yield was approximately 1000 tons TNT. The severity of injuries is strongly dependent on the blast parameters, that is, peak overpressure and impulse (Lees Reference Lees2012). A more severe damage is received at locations nearer the initiation point.
The protection of humans and residential areas against a blast wave is one of the major concerns of researchers, engineers and policymakers. Various methods have been developed to absorb the energy released by an explosion and ultimately reduce the physical hazard from a blast wave when it reaches an intended target to protect. Many researchers have investigated some blast wave mitigation technologies, such as allowing liquid (Shin et al. Reference Shin, Lee, Lam and Yeo1998; Cheng, Hung & Chong Reference Cheng, Hung and Chong2005; Homae et al. Reference Homae, Wakabayashi, Matsumura and Nakayama2006; Sugiyama et al. Reference Sugiyama, Homae, Wakabayashi, Matsumura and Nakayama2014; Pontalier et al. Reference Pontalier, Loiseau, Goroshin and Frost2018a,Reference Pontalier, Lhoumeau, Milne, Longbottom and Frostb; Tamba et al. Reference Tamba, Sugiyama, Ohtani and Wakabayashi2021) or a granular material (Zhang et al. Reference Zhang, Frost, Thibault and Murray2001; Homae et al. Reference Homae, Wakabayashi, Matsumura and Nakayama2007; Goroshin et al. Reference Goroshin, Frost, Ripley and Zhang2016; Pontalier et al. Reference Pontalier, Loiseau, Goroshin and Frost2018a,Reference Pontalier, Lhoumeau, Milne, Longbottom and Frostb; Sugiyama et al. Reference Sugiyama, Homae, Matsumura and Wakabayashi2020) to encircle the high explosive. These studies have confirmed significant reductions in the peak overpressure and positive impulse. The peak overpressure reduction is primarily dependent on the mitigant-to-explosive charge mass ratio (Pontalier et al. Reference Pontalier, Loiseau, Goroshin and Frost2018a,Reference Pontalier, Lhoumeau, Milne, Longbottom and Frostb). When water encircles the high explosive, the blast wave strength is determined by the sum of the kinetic energies of the detonation products and water because the piston effect they cause is an important factor in generating blast waves in the air (Sugiyama et al. Reference Sugiyama, Homae, Wakabayashi, Matsumura and Nakayama2014). In the case of the particle layer encircling the high explosive, we computed the transferred energies caused by the drag and the heat transfer between the particles and the shocked air (Sugiyama et al. Reference Sugiyama, Homae, Matsumura and Wakabayashi2020). Increasing the amount of particles caused a larger transferred energy from the shocked air to the particles and further mitigated the blast wave, as shown by Pontalier et al. (Reference Pontalier, Loiseau, Goroshin and Frost2018a,Reference Pontalier, Lhoumeau, Milne, Longbottom and Frostb). This method is very simple and useful for the energetic material disposal. However, when we use some materials to reduce the physical hazard of an accidental explosion, it is difficult to apply the method in the case of not only storage, but also daily use. It is desirable that the material does not interfere with the industrial operation. We have also been studying the mitigation effect of the blast wave in the case where a material was simply put in the high explosive vicinity.
Homae et al. (Reference Homae, Sugiyama, Wakabayashi, Matsumura and Nakayama2016, Reference Homae, Sugiyama, Wakabayashi, Matsumura and Nakayama2018, Reference Homae, Shimura, Sugiyama, Wakabayashi, Matsumura and Nakayama2020) and Sugiyama et al. (Reference Sugiyama, Tanaka, Matsuo, Homae, Wakabayashi, Matsumura and Nakayama2016, Reference Sugiyama, Homae, Wakabayashi, Matsumura and Nakayama2018, Reference Sugiyama, Homae, Matsumura and Wakabayashi2021) conducted experiments and numerical simulations involving the detonation of a high explosive inside a partially confined geometry, that is, a subsurface magazine model and a straight tube model. In these studies, sand, glass particles or water was used to fill the model and did not initially contact with the high explosive. After the high explosive initiation, the shock wave propagated along the material layer, and the mitigation effect of the blast wave outside the model was dependent on the material filling inside the partially confined geometry. The water location is an important factor when discussing the blast wave mitigation effect, and the water in the immediate vicinity of a high explosive strongly affects the blast wave mitigation (Homae et al. Reference Homae, Sugiyama, Wakabayashi, Matsumura and Nakayama2018). In the case of glass particles (Homae et al. Reference Homae, Shimura, Sugiyama, Wakabayashi, Matsumura and Nakayama2020), the blast wave mitigation is dependent on the length of the glass particle layer: a longer layer further mitigates the blast wave. Numerical simulations have shown that water and the particle layer absorb the energy mainly by heat transfer (Sugiyama et al. Reference Sugiyama, Homae, Wakabayashi, Matsumura and Nakayama2018, Reference Sugiyama, Homae, Matsumura and Wakabayashi2021). The interaction of the material surface and the high-temperature gas promotes energy transfer to reduce the blast wave outside. Therefore, the blast wave could be mitigated when the material is simply put near the high explosive in a partially confined geometry, which is suitable for industrial operations without efficiency reduction.
Heat transfer is one of the important mechanisms for absorbing the energy released from the high explosive to a material; hence, the interface area between the air and the material is considered an important factor for determining the blast wave mitigation efficiency. However, in the case of water and the particle layer, they would be accumulated near the floor by gravity, and the interface area may not be significantly increased by increasing the amount of the material used. We noticed an open-cell solid foam that can stably stand alone. It is an attractive material characterized as being composed of many air bubbles with an interconnected network of solid matrices. Albeit the high porosity and the low mass of solid, an open-cell solid foam has a large surface-area-to-volume ratio. Foams are widely used in several industrial applications like heat exchangers and thermal energy absorbers because of their high thermal properties. Porous foam is also considered as a shock absorber. The adiabatic process of the shock wave induces the high-velocity, high-temperature and high-pressure gas behind it. As the shocked gas interacts with the porous foam, the drag and the heat transfer are activated and might mitigate the shock wave. Homae et al. (Reference Homae, Sugiyama, Matsumura and Wakabayashi2021) subsequently conducted experiments with a rigid porous nickel (Ni) foam installed in a straight tube. Two cases were investigated: (a) the porous foam plate was placed only the floor, and (b) the porous foam plates were placed on the floor, sidewalls and ceiling in a straight tube. The experiments showed that the mitigation effect by a porous foam plate was similar to that by water and glass particles, and these materials were able to reduce the peak overpressure outside the straight tube by several tens of percent. The porous foam plates on each interior surface of the tube demonstrated a remarkable mitigation effect of the blast wave. This study found a technology for reducing the physical hazard on humans and structures in the case of an accidental explosion inside a partially confined geometry. Porous foams can easily increase the interface area to interact with the shocked air and mitigate the blast wave.
The interaction with gas/solid foam is one of the fundamental research topics in shock dynamics. Some researchers (Monti Reference Monti1970; Gvozdeva, Faresov & Fokeev Reference Gvozdeva, Faresov and Fokeev1985; Skews Reference Skews1991; Skews, Atkins & Seitz Reference Skews, Atkins and Seitz1993; Yasuhara et al. Reference Yasuhara, Watanabe, Kitagawa, Yasue and Mizutani1996; Kitagawa, Jyonouchi & Yasuhara Reference Kitagawa, Jyonouchi and Yasuhara2001; Kitagawa, Takayama & Yasuhara Reference Kitagawa, Takayama and Yasuhara2006; Seitz & Skews Reference Seitz and Skews2006) have conducted detailed experimental studies of the flow processes occurring when a one-dimensional shock wave interacts with a flexible porous foam inside a shock tube. In the case where a foam initially contacted with the end wall of the shock tube, the pressure gradually increased by time, and the overall stress acting on the wall could amplify the pressure on the wall and be greater than the theoretical reflected shock pressure at a certain time. The drag from the shocked air to the flexible porous foam induced its deformation, and the visualization results by Skews et al. (Reference Skews, Atkins and Seitz1993) showed that the porous foam was deformed by up to approximately 80 %. The deformation caused its internal stress, and the end wall pressure was considered as a function of both the shock compression of the air and the deformation behaviour of a flexible porous foam. The transmitted shock wave was greatly mitigated when a flexible foam was glued on the shock tube sidewall, and the foam end surface was far from the shock tube end wall (Kitagawa et al. Reference Kitagawa, Takayama and Yasuhara2006). In this case, the flexible foam did not allow its deformation and movement, playing a role for a momentum and energy absorber from the shocked air. The drag also greatly affected the mitigation of the shock wave passing through the porous foam.
Meanwhile, a rigid porous foam was not deformed, and a shock wave propagating through the rigid porous foam was weakened (Levy et al. Reference Levy, Ben-Dor, Skews and Sorek1993; Levy, Ben-Dor & Sorek Reference Levy, Ben-Dor and Sorek1996, Reference Levy, Ben-Dor and Sorek1998; Levy et al. Reference Levy, Levy-Hevroni, Sorek and Ben-Dor1999; Torrens & Wrobel Reference Torrens and Wrobel2003; Kazemi-Kamyab, Subramaniam & Andreopoulos Reference Kazemi-Kamyab, Subramaniam and Andreopoulos2011; Ram & Sadot Reference Ram and Sadot2013). The filtration process by the rigid porous foam caused a gradual increase of the pressure on the wall without amplification unlike the flexible porous foam located at the end wall. The previous studies indicated that a porous foam could weaken the blast wave and reduce the physical hazard in the case of an accidental explosion.
Detailed data are required to discuss the shock-foam interaction dynamics. The numerical simulation can quantitatively analyse the interaction behaviours, including heat transfer, drag and deformation, which induce an exchange of momentum and energy between the shocked air and the porous foam. Although some studies conducted a direct numerical simulation considering the random microstructure of a foam (Wehinger, Heitmann & Kraume Reference Wehinger, Heitmann and Kraume2016; Das et al. Reference Das, Sneijders, Deen and Kuipers2018), it is computationally expensive to discuss the propagation and the mitigation of the blast wave that propagates for approximately 1 m for the laboratory scale and 1 km for the real scale. A realistic solution for discussing the blast wave/porous foam interaction is a multiphase macroscopic approach that determines the averaged quantities of mass, momentum and energy for both gas and porous foam phases. The volume fraction determines the portion of a material and the material interface. Thus, the conservation equations for the mass, momentum and energy can be solved for each phase with introducing drag and heat transfer effects instead of considering the complex three-dimensional microstructure of the foam. In this approach, momentum and energy transfer models are responsible for the interaction between the shock wave and the porous foam.
Bear et al. (Reference Bear, Sorek, Ben-Dor and Mazor1992), Levy et al. (Reference Levy, Ben-Dor and Sorek1996, Reference Levy, Ben-Dor and Sorek1998), Levy et al. (Reference Levy, Levy-Hevroni, Sorek and Ben-Dor1999), Sorek et al. (Reference Sorek, Levy, Ben-Dor and Smeulders1999), Torrens & Wrobel (Reference Torrens and Wrobel2002) and Levi-Hevroni et al. (Reference Levi-Hevroni, Levy, Ben-Dor and Sorek2002) developed macroscopic balance equations with the energy and momentum transfer between air and porous foam. In these studies, the foam was considered incompressible. This provided the macroscopic theoretical basis for wave motion in multiphase deformable porous media. Their studies properly predicted the shock wave propagation inside the flexible and rigid porous foam.
When considering the interaction of a porous foam and a strong shock wave caused by a high explosive detonation, the extremely high pressure could act on the porous foam. We try herein to apply multiphase compressible flows for a gas and solid to discuss the interaction of the porous foam and the shock wave with a wide range of strength. The Baer and Nunziato-type model is a useful numerical approach for multiphase compressible flows when solving the interaction problem with a material and the extremely high pressure caused by the detonation of the condensed-phase explosive (Baer & Nunziato Reference Baer and Nunziato1986; Saurel & LeMetayer Reference Saurel and LeMetayer2001; Schoch et al. Reference Schoch, Nikiforakis, Lee and Saurel2013; Saurel et al. Reference Saurel, Martelot, Tosello and Lapébie2014; Sugiyama et al. Reference Sugiyama, Homae, Matsumura and Wakabayashi2020, Reference Sugiyama, Homae, Matsumura and Wakabayashi2021) and with a compressible foam and a weak shock wave (Baer Reference Baer1992). This method is based on a seven-equation model (mass, momentum and energy of the two phases, and volume fraction of a phase when two materials only are considered). They were composed of averaged flux terms together with integrals of the exchange flux terms between the materials. In the present study, we adopted the Baer and Nunziato-type model of Saurel & LeMetayer (Reference Saurel and LeMetayer2001) to present a quantitative analysis of the blast wave mitigation by a porous foam. A numerical simulation was performed for the quantitative estimations of the effects of drag and heat transfer between the air and the porous foam.
Section 2 presents a numerical model based on the hyperbolic multiphase flow model of Saurel & LeMetayer (Reference Saurel and LeMetayer2001). The ideal gas equation of state is applied for the air, whereas a porous foam is modelled using the Mie–Grüneisen and Murnaghan equations of state switched by the porous foam density. For momentum balance equations of a solid, the stress by the material deformation is considered for the governing equations as the diffusive flux of momentum and energy for the solid phase, and Hooke's law for an isotropic material is used to describe the constitutive relation for the Cauchy stress tensor. Section 3 provides the numerical results validating the capability of the present model, which properly estimates the pressure–time and total stress–time histories of the shock wave after interaction with a flexible and rigid porous foam and the deformation behaviour of a flexible porous foam. In § 4 the mitigation effect of the rigid porous foam layer on the blast wave is quantitatively analysed. The location of the rigid porous foam layer inside a straight tube is the considered parameter. The numerical results show that the blast wave is further mitigated by increasing the interface area of the air/porous foam layer. Finally, § 5 provides the main generalizations of this study.
2. Numerical method
2.1. Governing equations
The two-phase compressible flow model proposed by Saurel & LeMetayer (Reference Saurel and LeMetayer2001) was utilized to model the porous foam and air. We applied the Cauchy stress (Levy et al. Reference Levy, Ben-Dor and Sorek1996, Reference Levy, Ben-Dor and Sorek1998; Levi-Hevroni et al. Reference Levi-Hevroni, Levy, Ben-Dor and Sorek2002) into this method and showed the numerical results of the interaction of the shock/blast waves and flexible/rigid porous foams. The numerical simulation was governed by the seven-equation-type model defining the mass, momentum and total energy for each phase in (2.1) and (2.2) and the volume fraction for the solid phase in (2.3). Here, subscripts 1, 2 and I denote the solid, gas and interfacial phases, respectively, as
 \begin{gather} \left. \begin{gathered} \frac{\partial\left(\alpha\rho\right)_1}{\partial t}+\boldsymbol{\nabla}\boldsymbol{\cdot}\left(\alpha\rho\boldsymbol{u}\right)_1=0,\\ \frac{\partial\left(\alpha\rho\boldsymbol{u}\right)_1}{\partial t}+\boldsymbol{\nabla}\boldsymbol{\cdot}\left(\alpha\rho\boldsymbol{uu}\right)_1+\boldsymbol{\nabla}\left(\alpha p\right)_1={-}\boldsymbol{F}+p_I\boldsymbol{\nabla}\alpha_1+\boldsymbol{\nabla}(\alpha_1\boldsymbol{\sigma}),\\ \frac{\partial\left(\alpha\rho E\right)_1}{\partial t}+\boldsymbol{\nabla}\boldsymbol{\cdot}\left(\alpha\left(\rho E+p\right)\boldsymbol{u}\right)_1={-}\boldsymbol{F}\boldsymbol{\cdot}\boldsymbol{u}_1-Q+p_I\boldsymbol{u}_I\boldsymbol{\cdot}\left(\boldsymbol{\nabla}\alpha_1\right)\\ \hspace{-10pc}-\,\theta p_I^\prime\left(p_1-p_2\right)+\boldsymbol{\nabla}\left(\alpha_1\boldsymbol{\sigma}\boldsymbol{u}_1\right), \end{gathered} \right\} \end{gather}
 \begin{gather} \left. \begin{gathered} \frac{\partial\left(\alpha\rho\right)_2}{\partial t}+\boldsymbol{\nabla}\boldsymbol{\cdot}\left(\alpha\rho\boldsymbol{u}\right)_2=0,\\ \frac{\partial\left(\alpha\rho\boldsymbol{u}\right)_2}{\partial t}+\boldsymbol{\nabla}\boldsymbol{\cdot}\left(\alpha\rho\boldsymbol{uu}\right)_2+\boldsymbol{\nabla}\left(\alpha p\right)_1={+}\boldsymbol{F}+p_I\boldsymbol{\nabla}\alpha_2,\\ \frac{\partial\left(\alpha\rho E\right)_2}{\partial t}+\boldsymbol{\nabla}\boldsymbol{\cdot}\left(\alpha\left(\rho E+p\right)\boldsymbol{u}\right)_2={+}\boldsymbol{F}\boldsymbol{\cdot}\boldsymbol{u}_1+Q+p_I\boldsymbol{u}_I\boldsymbol{\cdot}\left(\boldsymbol{\nabla}\alpha_2\right)+\theta p_I^\prime\left(p_1-p_2\right), \end{gathered} \right\} \end{gather}
 \begin{gather} \frac{\partial\alpha_1}{\partial t}+\boldsymbol{u}_I\boldsymbol{\cdot}\left(\boldsymbol{\nabla}\alpha_1\right)={+}\theta\left(p_1-p_2\right), \end{gather}
where  $\alpha _k$,
  $\rho _k$,
  $\boldsymbol {u}_k$,
  $p_k$ and
  $E_k$ are the volume fraction, density, velocity vector (
 $u$,
$u$,  $v$ and
  $w$) in the
  $x$-,
$x$-,  $y$- and
  $z$-directions, pressure and total energy per unit mass of the
  $k$th material, respectively;
  $p_I$ and
  $\boldsymbol {u}_I$ denote interfacial pressure and velocity vector, respectively;
  $\boldsymbol {\sigma }$ denotes the Cauchy stress tensor whose component is described as
  $\sigma _{ij}$ (
 $1 \le i \le 3$,
  $1 \le j \le 3$) considered in (2.1) for the porous foam. The sum of the volume fractions is unity, as
  $\alpha _1+\alpha _2 = 1$. Here,
  $\boldsymbol {F}$ and
  $Q$ represent the drag force vector and the heat transfer rate, respectively. The term with
  $p_I$ defines the nozzling term, while that with
  $\theta$ is called a pressure relaxation term, which controls the rate at which this equilibrium (
 $p_1$ =
  $p_2$) will be reached. Additionally,
  $p_I^\prime$ expresses the transport pressure and is defined as (Saurel et al. Reference Saurel, Martelot, Tosello and Lapébie2014)
 \begin{equation} p_I^\prime=\frac{Z_2p_1+Z_1p_2}{Z_1+Z_2} \end{equation}
with  $Z_k$ =
  $\rho _kc_k$ being the acoustic impedance (
 $c_k$; sound speed of the
  $k$th material).
Accordingly, the pressure can be obtained using Mie–Grüneisen and Murnaghan equations of state (Miller & Puckett Reference Miller and Puckett1996) in (2.5)–(2.7), which were switched by density  $\rho _1$ for porous foams, as well as by applying the ideal gas equation of state for the gas phase (2.8) as
 \begin{gather} p_1=p_{H1}+\rho_{10}\varGamma_0\left(\varepsilon_1-\varepsilon_{H1}\right), \end{gather}
 \begin{gather} \left. \begin{gathered} p_{H1}=p_{10}+\frac{c_{10}^2(1/{\rho_{10}}-1/{\rho_1})}{[1/{\rho_{10}}-s(1/{\rho_{10}}-1/{\rho_1})]^2},\\ \varepsilon_{H1}= C_{v1}T_{10}+\frac{p_{10}+p_{H1}}{2}(1/{\rho_{10}}-1/{\rho_1}), \end{gathered} \right\} \quad \text{for}\ \rho_{10}\le\rho_1, \end{gather}
 \begin{gather} \left. \begin{gathered} p_{H1}=(p_{10}+\frac{\rho_{10}c_{10}^2}{4s-1})\left(\frac{\rho_{10}}{\rho_{1}}\right)^{4s-1}-\frac{\rho_{10}c_{10}^2}{4s-1},\\ \varepsilon_{H1}= C_{v1}T_{10}+\int_{\rho_{10}}^{\rho_1}\frac{p_{H1}}{\rho_1^2}\,{\rm d}\rho_1, \end{gathered} \right\} \quad \text{for }\ \rho_1 \le \rho_{10} \end{gather}
 \begin{gather} p_2=(\gamma_2-1)\rho_2\varepsilon_2, \end{gather}
where  $\varepsilon _k$,
  $\varGamma _0$,
  $s$ and
  $C_{v1}$ are the specific energy of the
  $k$th material, the Grüneisen parameter, the material parameter and the specific heat at constant volume of the solid, respectively. Here,
  $s$ is the slope gradient in the relationship between the shock and particle velocities. For the gas phase, the air was modelled with the specific heat ratio of
  $\gamma _2$ = 1.4 and a molar mass of 28.9
  $\textrm {g}\,\textrm {mol}^{-1}$. Here
  $p_{10}$,
  $\rho _{10}$,
  $T_{10}$ and
  $c_{10}$ define the initial pressure, density, temperature and sound speed of the porous foams, respectively. Table 1 presents the respective parameters for modelling flexible polyurethane (FPU), silicon carbide (SiC) and Ni used in the present study. For the FPU,
  $\varGamma _0$ is estimated as
  $2s-1$ (Meyers Reference Meyers1994). In this model, the system of the governing equations was solved using an operator splitting approach that involves two steps, namely a hyperbolic step utilizing the heat transfer, drag, stress and nozzling terms and a pressure relaxation step utilizing only the pressure relaxation term. In the hyperbolic step the non-equilibrium pressure model without the pressure relaxation term is advanced in time.
Table 1. Parameters of the equations of state for the porous materials in the present study:  $^{a}$Marsh (Reference Marsh1980),
  $^{b}$Gibson & Ashby (Reference Gibson and Ashby1997),
  $^{c}$Park & Fahrenthold (Reference Park and Fahrenthold2006),
  $^{d}$Meyers (Reference Meyers1994),
  $^{e}\varGamma _0=2s-1$ (Meyers Reference Meyers1994).

We applied herein the Harten–Lax–van Leer-contact (HLLC) (Toro, Spruce & Speares Reference Toro, Spruce and Speares1994) type Riemann solver that considers the Riemann fan emerging from the initial discontinuity at the interface to estimate the numerical flux. Liu, Cheng & Liu (Reference Liu, Cheng and Liu2019) and Cheng et al. (Reference Cheng, Liu, Jiang, Yu and Liu2020) proposed the multi-material HLLC Riemann solver considering the characteristic speed of the elastic and plastic waves by the deviatoric stress. Meanwhile, in the present study we treated the stress term as the source term and computed the compressible Euler equations with an HLLC-type Riemann solver by Furfaro & Saurel (Reference Furfaro and Saurel2015) without the characteristic speed of the elastic and plastic waves. The sound speed from the equations of state in (2.5)–(2.8) was treated as the characteristic speed of the governing equations. The Riemann problem for a given phase (subscript,  $k$) was decoupled to the problem of the other phase; thus, for a given phase, the Riemann problem was based on each set of partial differential equation systems. Figure 1 denotes an example of the HLLC-type Riemann solver by Furfaro & Saurel (Reference Furfaro and Saurel2015). Here
  $W$ represents the set of primitive variables of the governing equations;
  $x = 0$ denotes the cell interface. The lower scripts L and R are the left and right states of the cell interface, respectively. The Riemann problem solution depends only on initial states, L and R. A third-order monotonic upstream-centred scheme for the conservation law (MUSCL) interpolation with a linear scaling limiter (Zhang & Shu Reference Zhang and Shu2011) was used to compute
  $W_{L,k}$ and
  $W_{R,k}$ at the cell interface in figure 1. Here, the seven-equation-type model involves four waves per phase, that is, three conventional right-facing (
 $S_{R,k}$) and left-facing (
 $S_{L,k}$) and contact waves (
 $S_{M,k}$) and an interfacial wave (
 $u_I$) between the two materials. The jump relations across each wave determine the
  $W_{L,k}^\ast$,
  $W_k^{\ast \ast }$ and
  $W_{R,k}^\ast$ values. The interfacial wave speed
  $u_I$ and the interfacial pressure
  $p_I$ are a function only of the initial states L and R at the phase contacts. The details of the numerical flux across the waves for (2.1)–(2.3) have been described in Furfaro & Saurel (Reference Furfaro and Saurel2015). The three-stage total variation diminishing Runge–Kutta method (Shu & Osher Reference Shu and Osher1988) was adopted for the time integrations. The present numerical method calculates the sound speed for each phase to preserve the hyperbolicity of the governing equations; therefore, it was impossible to treat a zero-volume fraction. For the initial condition of the air region, the volume fraction of the solid was set to
  $10^{-8}$.

Figure 1. Two configurations considered in the HLLC Riemann solver by Furfaro & Saurel (Reference Furfaro and Saurel2015): (a)  $S_{M,k} < u_I$, (b)
  $u_I < S_{M,k}$.
After the hyperbolic step, mass  $(\alpha \rho )_k$, momentum (
 $\alpha \rho \boldsymbol {u})_k$ and total energy (
 $\alpha \rho E)_k$ were used to estimate the pressure
  $p_k$ for the
  $k$th material, which are generally in a non-equilibrium state between two materials. In the pressure relaxation step, the pressures between the two materials were assumed to instantaneously achieve equilibrium, such that
  $\theta$ could be set to infinity, and the mass and the momentum are assumed to be constant. Solving the ordinary differential equations (2.9) with the Newton–Raphson method modifies the volume fraction
  $\alpha _k^\ast$ and density
  $\rho _k^\ast$ of the
  $k$th material to achieve the pressure equilibrium condition (
 $p_1=p_2$) as
 \begin{equation} \left. \begin{gathered} \displaystyle\frac{\partial (\alpha\rho E)_1}{\partial t}={-}\theta p_I^\prime(p_1-p_2),\\ \displaystyle\frac{\partial (\alpha\rho E)_2}{\partial t}=\theta p_I^\prime(p_1-p_2),\\ \displaystyle\frac{\partial \alpha_1}{\partial t}=\theta (p_1-p_2). \end{gathered} \right\} \end{equation}
The details of the Newton–Raphson method can be found in Saurel & LeMetayer (Reference Saurel and LeMetayer2001).
2.2. Stress modelling for the porous foam
Hooke's law for an isotropic material describes the constitutive relation for the Cauchy stress tensor (Levy et al. Reference Levy, Ben-Dor and Sorek1996; Levi-Hevroni et al. Reference Levi-Hevroni, Levy, Ben-Dor and Sorek2002). It is expressed in terms of the stress rate  $\dot {\boldsymbol {\sigma }}$ dependence, as shown in (2.10)–(2.12), and the time integral computes the stress
  $\boldsymbol {\sigma }$,
 \begin{gather} \dot{\boldsymbol{\sigma}}=2\mu\dot{\boldsymbol{\varepsilon}}+\lambda\left(\boldsymbol{\nabla}\boldsymbol{\cdot}\boldsymbol{u}_1\right)\boldsymbol{I}-\eta\frac{\partial T_1}{\partial t}\boldsymbol{I}, \end{gather}
 \begin{gather} {\dot{\sigma}}_{ij}=\frac{\partial\sigma_{ij}}{\partial t}+\boldsymbol{u}_1\boldsymbol{\cdot}\boldsymbol{\nabla}\sigma_{ij}, \end{gather}
 \begin{gather} \dot{\boldsymbol{\varepsilon}}=\tfrac{1}{2}\left[\boldsymbol{\nabla}\boldsymbol{u}_1+\left(\boldsymbol{\nabla}\boldsymbol{u}_1\right)^{\rm T}\right],\end{gather}
where  $T_1$ and
  $\boldsymbol {I}$ denote the temperature of the solid matrix and the unit tensor;
  $\dot {\boldsymbol {\varepsilon }}$ is the strain rate tensor for the solid matrix;
  $\mu$,
  $\lambda$ and
  $\eta$ are known as the Lamé constants of the solid and estimated with the Poisson's ratio
  $\nu$, Young modulus
  $E$ and coefficient of thermal expansion
  $\beta$,
 \begin{equation} \mu=\frac{E}{2\left(1+\nu\right)},\quad \lambda=\frac{E\nu}{\left(1+\nu\right)\left(1-2\nu\right)},\quad \eta=\frac{E}{1-2\nu}\beta. \end{equation}
 We used six components of (2.10)–(2.12) in the case of  $i \le j$ to reduce the computational cost considering the symmetricity of the Cauchy stress tensor (
 $\sigma _{ij}$ =
  $\sigma _{ji}$). The second-order central differential method was used for the stress term in (2.1).
The open-cell porous foams were based on those by Gibson & Ashby (Reference Gibson and Ashby1997). They provided the macroscopic Young modulus  $E$, which is a function of the bulk density (
 $\alpha _1\rho _1$) and the constant Poisson's ratio
  $\nu$,
 \begin{equation} \frac{E}{E_s}=\left(\frac{\alpha_1\rho_1}{\rho_{10}}\right)^2,\quad \nu=\frac{1}{3}, \end{equation}
where  $E_s$ is the Young modulus of the solid. We considered an elastomeric foam, an elastic–plastic foam and an elastic–brittle foam for modelling the FPU, Ni and SiC open-cell foams, respectively. In the compression state, the linear elasticity was limited to small strains. By increasing the strain, the stress–strain curve generally showed a plateau at an elastic collapse stress
  $\sigma _{el}^\ast$, a plastic collapse strength
  $\sigma _{pl}^\ast$ and a brittle crushing stress
  $\sigma _{cr}^\ast$ for the elastomeric, elastic–plastic and elastic–brittle foams, respectively. Gibson & Ashby (Reference Gibson and Ashby1997) showed that they are a function of the bulk density (
 $\alpha _1\rho _1$). They will be described at each section in which FPU, Ni and SiC will be used. For further compression of the foam, the stress–strain curve exhibits a rapid increase in the stress. To model this behaviour, the effective stress
  $\tilde {\sigma }$ and a limit stress
  $\sigma ^\ast$ depending on the material considered were as follows:
 \begin{gather} \tilde{\sigma}=\sqrt{\tfrac{1}{2}\left[\left(\sigma_{11}-\sigma_{22}\right)^2+\left(\sigma_{22}-\sigma_{33}\right)^2+\left(\sigma_{33}-\sigma_{11}\right)^2+6\left(\sigma_{12}^2+\sigma_{23}^2+\sigma_{31}^2\right)\right]}, \end{gather}
 \begin{gather} \sigma^\ast{=} \left\{ \begin{array}{@{}ll} \sigma_{el}^\ast & \text{for FPU},\\ \sigma_{pl}^\ast & \text{for Ni},\\ \sigma_{cr}^\ast & \text{for SiC}. \end{array} \right. \end{gather}
By checking the large and small relationship between the effective stress  $\tilde {\sigma }$ and limit stress
  $\sigma ^\ast$, each stress term component
  $\sigma _{ij}$ is modified as
 \begin{equation} \sigma_{ij}^{new}=\sigma_{ij}\boldsymbol{\cdot}\frac{\min(\tilde{\sigma}, \sigma^\ast)}{\tilde{\sigma}}. \end{equation}
In this case, the porous foam was allowed to deform under a constant stress equal to the value that satisfies (2.17). In the subsequent unloading process, once  $\sigma ^\ast$ is used to modify each stress term component
  $\sigma _{ij}$, the unloading path for the stress–strain shows a different behaviour from the loading path. Table 2 presents the material properties for stress modelling in the present study. Here
  $\sigma _{ys}$ and
  $\sigma _{fs}$ are the yield stress and the fracture stress, respectively.
Table 2. Material properties for the thermo elastic–plastic modelling in the present study:  $^{a}$Ben-Dor et al. (Reference Ben-Dor, Mazor, Igra, Sorek and Onodera1994),
  $^{b}$Gibson & Ashby (Reference Gibson and Ashby1997).

2.3. Modelling of the drag and heat transfer between air and porous foam
The open-cell foam has a complex network of random polyhedrons. Because of its large surface-area-to-volume ratio, the high performance on thermal properties is very attractive for heat exchangers, shock absorbers, etc. The foam's efficiency is strongly dependent on the number of pores (i.e. pores per inch (PPI) and pore diameter  $d_{pore}$). Rather than the porous foam modelled by considering its microstructure, the drag and the heat transfer were simply modelled with the dimensionless numbers of fluid dynamics, such as the Reynolds and Nusselt numbers. Previous numerical methods by Sorek et al. (Reference Sorek, Levy, Ben-Dor and Smeulders1999), Levy et al. (Reference Levy, Ben-Dor and Sorek1996) and Levi-Hevroni et al. (Reference Levi-Hevroni, Levy, Ben-Dor and Sorek2002) used the Forchheimer term for the macroscopic momentum transfer, and numerical results agreed well with the experimental data for the head-on collision of planar shock waves with flexible foams and rigid foams. Levy et al. (Reference Levy, Ben-Dor and Sorek1998) validated the Forchheimer factor and tortuosity for the macroscopic momentum balance equation for solid and fluid phases. In the present study we used the hydraulic pore diameter
  $d_{pore}$ and converted it to an equivalent spherical diameter
  $d_p$ (Innocentini et al. Reference Innocentini, Salvini, Macedo and Pandolfelli1999; Ripperger et al. Reference Ripperger, Gösele, Alt and Loewe2013; Kennedy et al. Reference Kennedy, Zhang, Fritzsch, Akhtar, Bakken and Aune2013) defined as follows and applied the equivalent spherical diameter into the drag and heat transfer models:
 \begin{equation} d_{pore}=4\frac{\alpha_{20}}{\left(1-\alpha_{20}\right)S_p}. \end{equation}
Here  $S_p$ denotes the surface-area-to-volume ratio of the sphere,
 \begin{equation} S_p=\frac{6}{d_p}. \end{equation}
The equivalent spherical diameter is estimated as
 \begin{equation} d_p=\frac{3}{2}\frac{\left(1-\alpha_{20}\right)}{\alpha_{20}}d_{pore}. \end{equation}
The hydraulic pore diameter  $d_{pore}$ was estimated by the quotient of 1 in. (
 $25.4\times 10^{-3}$ (m)) and the PPI value. The equivalent spherical diameter
  $d_p$ was computed with the initial porosity
  $\alpha _{20}$, as shown in (2.20).
We used herein the drag and heat transfer models often used for the spherical particle beds. A piecewise equation based on Ergun (Reference Ergun1952), Di Felice (Reference Di Felice1994) and Crowe et al. (Reference Crowe, Schwarzkopf, Sommerfeld and Tsuji2011) was employed for the drag force vector estimates  $\boldsymbol {F}$. This method was used by Sugiyama et al. (Reference Sugiyama, Homae, Matsumura and Wakabayashi2020, Reference Sugiyama, Homae, Matsumura and Wakabayashi2021) and McGrath, Clair & Balachandar (Reference McGrath, Clair and Balachandar2016). The drag factor is given as
 \begin{equation} \boldsymbol{F}=18\frac{\alpha_1\mu_2f_{drag}}{d_p^2}\left(\boldsymbol{u}_1-\boldsymbol{u}_2\right), \end{equation}
where
 \begin{gather} f_{drag}= \left\{ \begin{array}{@{}ll} 8.33\dfrac{\alpha_1}{\alpha_2}+0.0972{\mbox{{Re}}_p} & \text{for}\ \alpha_2 < 0.8, \\ f_{base}\left(\alpha_2^{-\eta}\right) & \text{for}\ \alpha_2 \ge 0.8, \end{array}\right. \end{gather}
 \begin{gather} \eta=3.7-0.65\exp\left[-\tfrac{1}{2}\left(1.5-\log_{10}{{\mbox{{Re}}}_p}\right)^2\right], \end{gather}
and
 \begin{equation} f_{base}= \left\{\begin{array}{@{}ll} 1+\tfrac{1}{6}{\mbox{{Re}}}_p^{0.687}, & \mbox{{Re}}_p<1000,\\ 0.0183{\mbox{{Re}}}_p, & \mbox{{Re}}_p\geq1000, \end{array}\right. \end{equation}
with  $\mbox {{Re}}_p$ defining the relative Reynolds number with air viscosity
  $\mu _2$ as
 \begin{equation} {\mbox{{Re}}}_p=\frac{\rho_2\left|\boldsymbol{u}_2-\boldsymbol{u}_1\right|d_p}{\mu_2}. \end{equation}
 The heat transfer rate  $Q$ between the porous foam and gas can be estimated using the relation
 \begin{equation} Q=6\frac{\alpha_1Nu_p\kappa_2}{d_p^2}\left(T_1-T_2\right), \end{equation}
where the Nusselt number was estimated using the correlation of Gunn (Reference Gunn1978),
 \begin{equation} Nu_p=\left(7-10\alpha_2+5\alpha_2^2\right)\left(1+0.7{\mbox{{Re}}}_p^{0.2}\mbox{{Pr}}_2^{1/3}\right)+\left(1.33-2.4\alpha_2+1.2\alpha_2^2\right){\mbox{{Re}}}_p^{0.7}\mbox{{Pr}}_2^{1/3}, \end{equation}
in which  $\mbox { {Pr}}_2$ was the Prandtl number of air,
 \begin{equation} \mbox{{Pr}}_2=\frac{C_{p2}\mu_2}{\kappa_2}, \end{equation}
where  $C_{p2}$ is the specific heat of the air at a constant pressure. The viscosity
  $\mu _2$ and the thermal conductivity
  $\kappa _2$ were estimated by the Sutherland law (White Reference White2006) as
 \begin{equation} \frac{\mu_2}{\mu_{ref}}=\left(\frac{T_2}{T_{ref}}\right)^{3/2} \frac{T_{ref}+S_\nu}{T_2+S_\nu}, \end{equation}
and
 \begin{equation} \frac{\kappa_2}{\kappa_{ref}}=\left(\frac{T_2}{T_{ref}}\right)^{3/2} \frac{T_{ref}+S_\kappa}{T_2+S_\kappa} \end{equation}
for  $T_{ref} = 273$ K,
  $\mu _{ref} = 1.716\times 10^{-5}\,\textrm {kg}\,\textrm {m}^{-1}\,\textrm {s}^{-1}$,
  $\kappa _{ref} = 0.0241\,\textrm {W}\,\textrm {K}^{-1}\,\textrm {m}^{-1}$,
  $S_\nu = 111$ K and
  $S_\kappa = 194$ K (White Reference White2006). The estimations of the heat transfer and the drag force were activated at the region for
  $\alpha _1>$
  $10^{-5}$.
3. Validation study
In this section the present numerical method is validated in terms of the interaction with a planar shock wave and a flexible or rigid porous foam. The first two are the shock tube experiments with a porous FPU foam (Skews et al. Reference Skews, Atkins and Seitz1993; Yasuhara et al. Reference Yasuhara, Watanabe, Kitagawa, Yasue and Mizutani1996; Kitagawa et al. Reference Kitagawa, Jyonouchi and Yasuhara2001, Reference Kitagawa, Takayama and Yasuhara2006). When the foam was put on the shock tube end wall, it significantly deformed up to 80 % in the longitudinal direction (Skews et al. Reference Skews, Atkins and Seitz1993), and the total stress at the end wall was strongly dependent on the deformation behaviour. Meanwhile, when the porous FPU foam was glued to the shock tube sidewall (Kitagawa et al. Reference Kitagawa, Takayama and Yasuhara2006), it simply played a role for a momentum and energy absorber from the shocked air. The transmitted shock wave was greatly mitigated. A 0.1 mm grid spacing satisfying more than 100 points within the deformed minimum FPU length was set in the validation study using FPU to maintain the grid points after the deformation.
The last one is the shock tube experiments with a porous rigid SiC foam by Ram & Sadot (Reference Ram and Sadot2013). The SiC length was fixed at 63 mm. The stand-off distance  $SOD$ between the end wall and SiC and the characteristic length defined by the PPI were the parameters. The pressure build-up on the end wall of the transmitted shock wave after passing through the rigid SiC foam was measured. They proposed a constitutive expression for the normalized pressure–time relationship at the end wall by the transmitted shock wave. A 1 mm grid spacing equivalent to 63 points in the SiC foam length was used to compute the interaction of the shock wave and the porous SiC foam. This value was 10 times greater than that for the porous FPU foam because we did not need to consider the deformation behaviour of the SiC foam.
3.1. Interaction with the FPU foam and the shock wave
We considered the Cauchy stress and the collapse stress, as shown in (2.16). We used the FPU and determined the elastic collapse stress  $\sigma _{el}^\ast$ from the previous experiments by Yasuhara et al. (Reference Yasuhara, Watanabe, Kitagawa, Yasue and Mizutani1996) in the case of
  $\alpha _{20}=0.979$ and 50 PPI. In the experiment, the compression speed was 10 mm min−1. The numerical data were obtained at the steady state at a uniaxial strain
  $\varepsilon$. Figure 2 shows the stress–strain relationship by the previous experiments and the present model whose elastic collapse stress
  $\sigma _{el}^\ast$ is defined as
 \begin{equation} \frac{\sigma_{el}^\ast}{E_s}=9\times{10}^{{-}5}\left(\frac{\alpha_1\rho_1}{\rho_{10}}\right)^{0.45}\left(1+\frac{\alpha_1\rho_1}{\rho_{10}}\right)^{10}. \end{equation}
Figure 2. Stress–strain relationship by the previous experiments (Yasuhara et al. Reference Yasuhara, Watanabe, Kitagawa, Yasue and Mizutani1996) and the present model with linear elastic stress ( $E\varepsilon$) and limit stress
  $-\sigma _{el}^\ast$.
In figure 2 the blue and red lines denote the linear elastic stress ( $E\varepsilon$) and the elastic collapse stress
  ${-\sigma }_{el}^\ast$ from (3.1), respectively. The plots present the experimental data for compression in the stress–strain relationship. The limit stress condition chose the minimum stress of the absolute values for
  $E\varepsilon$ and
  ${-\sigma }_{el}^\ast$ depicted as a solid line. Here
  $E\varepsilon$ was adopted for the stress at the region of
  $-\varepsilon<$ 0.05, which was consistent with the linear elasticity limited to small strains (i.e. typically
  $-\varepsilon <0.05$). The solid line of the minimum stress of
  $E\varepsilon$ and
  ${-\sigma }_{el}^\ast$ agreed well with the experimental data (figure 2). We used herein the elastic collapse stress
  $\sigma _{el}^\ast$ for the FPU defined in (3.1).
3.2. Porous FPU foam (Skews et al. Reference Skews, Atkins and Seitz1993)
The previous paper by Skews et al. (Reference Skews, Atkins and Seitz1993) showed the deformation behaviour and the wall pressure history. The material properties for modelling the pressure drop and the drag due to the flow through the porous foam were presented, but the characteristic length for the porous foam was not described. The present models for the drag and heat transfer, as shown in (2.18)–(2.27), required the hydraulic pore diameter  $d_{pore}$. Here, we conducted a parameter study for
  $d_{pore}$ to compute the previous experiments. Figure 3 shows the experimental set-up by Skews et al. (Reference Skews, Atkins and Seitz1993). The foam length and density were 70 mm and
  $38\,\mathrm {kg}\,\mathrm {m}^{-3}$, respectively. The initial porosity
  $\alpha _{20}$ was 0.970. The incident shock Mach number and the initial pressure of the air were 1.415 and 83 kPa, respectively. From this condition, the theoretical reflected shock pressure was 0.386 MPa. Time 0 was defined when the shock wave was located 163 mm away from the end wall (figure 3). The visualization of the deformation behaviour and the pressure–time histories on the wall were measured in the experiments.

Figure 3. Experimental set-up by Skews et al. (Reference Skews, Atkins and Seitz1993).
Figure 4 shows the time histories of the (a) position of the FPU/air interface, (b) time gradient of the air volume fraction  $\partial {\alpha _2}/\partial {t}$, (c) total stress
  $p_2-\sigma _{11}$, (d) air pressure
  $p_2$ and (e) stress
  $-\sigma _{11}$. The data in figures 4(b)–4(e) were computed at the end wall. The plots and the solid lines are of the previous experimental data and the present simulation data, respectively. The effect of
  $d_{pore}$ is described in figure 4. The graph legend in figure 4(a) is common for figures 4(b)–4(e). In the numerical simulation the FPU/air interface was defined as the isoline of the FPU volume fraction of
  $10^{-6}$. The deformation behaviour of the FPU, total stress amplification and compression of the air by the FPU were well described. The numerical results of the position of the FPU/air interface and the total stress on the end wall in the case of
  $d_{pore}$ = 0.12 mm agreed with the experimental data, as shown in figures 4(a) and 4(c). An appropriate characteristic length could give good agreements with the experimental data, as shown in figure 4. The smaller
  $d_{pore}$ at a constant porosity
  $\alpha _{20}$ caused a larger drag force, resulting in the higher speed of the FPU/air interface movement (figure 4a). The minimum FPU length was 11.7 mm, 13.8 mm and 18.0 mm, corresponding to 83.3 %, 80.3 %, and 74.3 % deformations for
  $d_{pore} = 0.12$ mm, 0.24 mm and 0.60 mm, respectively. The faster deformation behaviour increased the maximum value of
  $-\sigma _{11}$ on the wall (figure 4e). The negative value of
  $\partial {\alpha _2}/\partial {t}$ in figure 4(b) denoted that the FPU deformation compressed the air. The smaller
  $d_{pore}$ induced the higher compression rate of the air by the FPU deformation (figure 4b), resulting in the increment of the air pressure by not only the shock wave, but also by the FPU deformation (figure 4d). Therefore, the air pressure was sometimes greater than the theoretical reflected shock pressure (0.386 MPa) in figure 4(d). The air compression rate and the FPU deformation behaviour determined the air pressure
  $p_2$ and the stress
  $\sigma _{11}$, respectively; thus, the total stress
  $p_2-\sigma _{11}$ was increased by the
  $d_{pore}$ decrease. After the minimum FPU length, the FPU bounced on the wall, and the compression immediately shifted to the tension at the wall, resulting in a negative value of
  $-\sigma _{11}$ and a positive value of
  $\partial {\alpha _2}/\partial {t}$. Subsequently,
  $p_2-\sigma _{11}$ oscillated around the theoretical reflected shock pressure in figure 4(d). The characteristic length in the present drag force model is an important parameter for determining the deformation behaviour of the FPU, air compression rate and total stress–time histories on the wall.

Figure 4. Comparison with the experimental and numerical data for the time histories of the (a) position of the FPU/air interface, (b) time gradient of the air volume fraction  $\partial {\alpha _2}/\partial {t}$, (c) total stress
  $p_2-\sigma _{11}$, (d) air pressure
  $p_2$ and (e) stress
  $-\sigma _{11}$. The data in figure 4(b–e) were computed at the end wall.
3.3. Porous FPU foam (Yasuhara et al. Reference Yasuhara, Watanabe, Kitagawa, Yasue and Mizutani1996; Kitagawa et al. Reference Kitagawa, Jyonouchi and Yasuhara2001, Reference Kitagawa, Takayama and Yasuhara2006)
In § 3.2 we modelled the porous FPU foam whose characteristic length was unknown. The parameter study of the pore diameter  $d_{pore}$ could determine the appropriate value for obtaining a good agreement with the experimental data (Skews et al. Reference Skews, Atkins and Seitz1993). We now modelled experimental studies (Yasuhara et al. Reference Yasuhara, Watanabe, Kitagawa, Yasue and Mizutani1996; Kitagawa et al. Reference Kitagawa, Jyonouchi and Yasuhara2001, Reference Kitagawa, Takayama and Yasuhara2006). They chose the porous FPU foam with the characteristic length defined by the PPI. The interaction behaviour of the FPU and the shock wave was strongly dependent on the PPI. Table 3 shows the material properties for modelling the experimental studies (Yasuhara et al. Reference Yasuhara, Watanabe, Kitagawa, Yasue and Mizutani1996; Kitagawa et al. Reference Kitagawa, Jyonouchi and Yasuhara2001, Reference Kitagawa, Takayama and Yasuhara2006). Five PPI values were considered herein, and the initial porosity was approximately 0.98 for 13, 30 and 50 PPI and 0.95 for 65 and 70 PPI, respectively. The equivalent spherical diameter was calculated from (2.20) with
  $d_{pore}$ and
  $\alpha _{20}$. When the initial porosity
  $\alpha _{20}$ increased to unity, the term of
  $(1-\alpha _{20})/\alpha _{20}$ asymptotically approached zero, resulting in a small
  $d_p$ around
  $10\,\mathrm {\mu }\textrm {m}$. Figure 5 shows the experimental set-up for (a) Yasuhara et al. (Reference Yasuhara, Watanabe, Kitagawa, Yasue and Mizutani1996) and Kitagawa et al. (Reference Kitagawa, Jyonouchi and Yasuhara2001) and (b) Kitagawa et al. (Reference Kitagawa, Takayama and Yasuhara2006). Here
  $L$ denotes the FPU length, as presented in table 3. The FPU length effect on the interaction behaviour of the FPU and the shock wave was investigated for 50 PPI, while the PPI effect was investigated for all values with a constant FPU length (
 $L = 60$ mm) presented in table 3. In figure 5(a) the FPU initially contacted with the end wall, and the deformation of the FPU by the shock wave occurred, as shown by Skews et al. (Reference Skews, Atkins and Seitz1993). The shock tube used by Yasuhara et al. (Reference Yasuhara, Watanabe, Kitagawa, Yasue and Mizutani1996) and Kitagawa et al. (Reference Kitagawa, Jyonouchi and Yasuhara2001) was long enough to neglect the expansion wave from the driver section of the shock tube; hence, the steady state of the stress–time history on the wall was achieved. The air at room temperature and atmospheric pressure was filled in the driven section. The Mach number of the shock wave was constant at 1.7.
Table 3. Material properties for modelling the experimental studies (Yasuhara et al. Reference Yasuhara, Watanabe, Kitagawa, Yasue and Mizutani1996; Kitagawa et al. Reference Kitagawa, Jyonouchi and Yasuhara2001, Reference Kitagawa, Takayama and Yasuhara2006).


Figure 5. Experimental set-up for (a) Yasuhara et al. (Reference Yasuhara, Watanabe, Kitagawa, Yasue and Mizutani1996) and Kitagawa et al. (Reference Kitagawa, Jyonouchi and Yasuhara2001) and (b) Kitagawa et al. (Reference Kitagawa, Takayama and Yasuhara2006).
In figure 5(b) the porous FPU foam was placed away from the end wall and glued to the shock tube sidewall. The distance from the end wall, downstream pressure gauge  $D$ and
  $SOD$ were changed. In this case, the shock wave and the gas flow would locally deform the porous FPU foam and cause the curved porous FPU foam/air interface. This may result in a stress field inside the porous FPU foam and introduce multi-dimensional effects. We assumed herein that they were negligibly small. The comparisons of the one-dimensional calculations with the previous experiments were justified only along the shock tube centreline. The drag induced the momentum transfer from the air to the porous FPU foam. The source terms of
  $\boldsymbol {F}$ and
  $\boldsymbol {F}\boldsymbol {\cdot } \boldsymbol {u}_1$ in (2.1) were not activated because the porous FPU foam was glued to the shock tube sidewall. On the contrary, they were considered for (2.2); thus, the porous FPU foam simply played a role for the momentum and energy absorber from the shocked air. The upstream and downstream pressure gauges measured the air pressure of the reflected and transmitted shock waves off the porous FPU foam, respectively. The wall pressure gauge measured the reflected shock pressure at the wall. Within the measurement time in Kitagawa et al. (Reference Kitagawa, Takayama and Yasuhara2006), the expansion wave from the driver section reached the three pressure gauges, and the unsteady pressure–time histories were obtained. The air at room temperature and atmospheric pressure was filled in the driven section. The Mach number of the shock wave was a parameter.
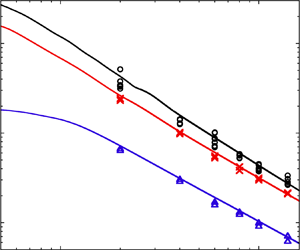
Figure 6 shows a comparison of the total stress–time histories at the end wall in the case of 50 PPI between the previous experiments (Yasuhara et al. Reference Yasuhara, Watanabe, Kitagawa, Yasue and Mizutani1996) and the present numerical study. The total stress was estimated by  $p_2-\sigma _{11}$. Figure 6 depicts the FPU length effect. The plots and the solid lines are of the previous experimental and present simulation data, respectively. The baselines for the three traces, where the total stress was an atmospheric pressure, were moved vertically. On the vertical axis of the total stress, one increment was equal to 1 MPa. Time 0 was defined when the maximum total stress was measured. The maximum total stress is denoted as 3.30 MPa, 2.55 MPa and 1.65 MPa in figure 6 and increased by the FPU length
  $L$. The total stress enhancement phenomenon at the shock tube end wall, time histories of the total stress and dependence of the maximum total stress enhancement on the FPU length were correctly computed and shown in figure 6.

Figure 6. Comparison of the total stress–time histories at the end wall in the case of 50 PPI between the previous experiments (Yasuhara et al. Reference Yasuhara, Watanabe, Kitagawa, Yasue and Mizutani1996) and the present numerical study. Here  $L$ denotes the FPU length.
Figure 7 shows a comparison of the maximum total stress on the wall in the case of  $L$ = 60 mm between the previous experiments (Kitagawa et al. Reference Kitagawa, Jyonouchi and Yasuhara2001) and the present numerical study. The dependence of the maximum total stress enhancement on the PPI value was observed. In the present method, the larger PPI caused a smaller equivalent spherical diameter. A higher velocity of the air/FPU interface was activated, resulting in a larger stress and a higher compression rate of air. The higher maximum stress was computed in the case of a larger PPI, which showed a consistency between the numerical and experimental data. However, the numerical results for 30 and 70 PPI underestimated the maximum stress, denoting the underestimated drag force for the two PPI values.

Figure 7. Comparison of the maximum total stress on the wall in the case of  $L$ = 60 mm between the previous experiments (Kitagawa et al. Reference Kitagawa, Jyonouchi and Yasuhara2001) and the present numerical study.
We now model the previous experiments (Kitagawa et al. Reference Kitagawa, Takayama and Yasuhara2006), with the experimental set-up shown in figure 5(b). The FPU was glued to the shock tube sidewall; thus, it played a role for a momentum and energy absorber from the shocked air. Figure 8 shows a comparison of the overpressure–time histories for (a) 50 PPI,  $SOD$ = 127 mm and
  $D$ = 93 mm and (b) 30 PPI,
  $SOD$ = 932 mm and
  $D$ = 903 mm between the previous experiments (Kitagawa et al. Reference Kitagawa, Takayama and Yasuhara2006) and the present numerical study. The plots and the solid lines are of the previous experimental and present simulation data, respectively. The Mach number of the incident shock wave was 1.33. In figure 8(b),
  $p_{tr}$ denotes the plateau overpressure behind the transmitted shock wave. The overpressure behaviours at the two pressure gauges were overlapped in figure 8(a) because the downstream pressure gauge was close to wall one. For 50 PPI, the three traces showed a good agreement with the numerical and experimental data. For 30 PPI,
  $p_{tr}$ was 30 kPa in the numerical simulation and 27 kPa in the experiments; thus, the equivalent values were obtained, albeit with the appearance of a 10 % overestimation. The shock wave reflection and transmission of the FPU were correlated with each other. The overpressures of the upstream pressure gauge conversely showed a 10 % underestimation from the experimental results. The overpressure of the transmitted shock wave was strongly dependent on the drag force at the FPU, denoting the underestimated drag force in the present modelling for 30 PPI (figure 7).

Figure 8. Comparison of the overpressure–time history for (a) 50 PPI,  $SOD$ = 127 mm, and
  $D$ = 93 mm and (b) 30 PPI,
  $SOD$ = 932 mm, and
  $D$ = 903 mm between the previous experiments (Kitagawa et al. Reference Kitagawa, Takayama and Yasuhara2006) and the present numerical study. The plots and the solid lines are of the previous experimental and present simulation data, respectively.
When  $SOD$ was large enough, the plateau overpressure
  $p_{tr}$ behind the transmitted shock wave was observed, as shown in figure 8(b). Figure 9 shows a comparison of the overpressures behind the transmitted and incident shock waves between the previous experiments and the present numerical study. The plots and the solid lines are of the previous experimental and present simulation data, respectively. The dashed line denotes the incident shock overpressure estimated by the shock Mach number. In the case of
  $\alpha _{20}\approx 0.98$, the FPU reduced the shock wave strength, and the increment of the PPI value was effective in mitigating the transmitted shock wave. The numerical data for 13 and 50 PPI agreed with the experimental data, whereas those for 30 PPI overestimated the experimental data. In the case of 65 PPI,
  $p_{tr}$ was the smallest of the four PPI values, but the numerical data always overestimated the experimental data. As described in this section, we need thorough validation studies to apply the drag and heat transfer models for the porous foam without considering the microstructure effects. The equivalent spherical diameter from the PPI and the initial porosity would be useful in discussing the shock/flexible foam interaction problem.

Figure 9. Comparison of the overpressures behind the transmitted and incident shock waves between the previous experiments (Kitagawa et al. Reference Kitagawa, Takayama and Yasuhara2006) and the present numerical study.
3.4. Rigid SiC foam (Ram & Sadot Reference Ram and Sadot2013)
The validation study on the shock wave mitigation by a rigid porous foam is conducted in this section. The weak shock wave transmission in a rigid porous foam could reduce the momentum and the energy of the shocked air without its deformation, resulting in the shock wave mitigation. We modelled the experiments by Ram & Sadot (Reference Ram and Sadot2013), who investigated the parameters governing the pressure build-up on the wall. Figure 10 shows the experimental set-up inside the shock tube. The porous SiC foam was fixed at the spacer. The porous foam with three characteristic lengths (i.e. 10 PPI, 20 PPI and 30 PPI) were tested. The  $SOD$ was also a parameter: 0 mm, 17 mm, 38 mm and 59 mm. The porosity was experimentally estimated as
  $0.85\pm 0.05$. The air at room temperature and atmospheric pressure was filled in the driven section. The incident shock Mach number and the overpressure behind it were 1.56 and 169 kPa, respectively. The shock tube was long enough to neglect the expansion wave from the driver section of the shock tube; thus, the overpressure was almost converged to the theoretical reflected shock overpressure of 535 kPa.

Figure 10. Experimental set-up by Ram & Sadot (Reference Ram and Sadot2013). The porous layer was fixed by the spacer. Here  $SOD$ denotes the stand-off distance from the end wall.
In the present numerical simulation the initial porosity was fixed at  $\alpha _{20} = 0.85$, and the drag induced the momentum transfer between the air and the porous material. The source terms of
  $\boldsymbol {F}$ and
  $\boldsymbol {F}\boldsymbol {\cdot } \boldsymbol {u}_1$ in (2.1) were not activated because the spacer did not allow the movement of the SiC foam. In contrast, they were activated for (2.2) to consider the momentum and the energy loss of the air by the porous SiC foam. We used (3.2) for the brittle foams (Gibson & Ashby Reference Gibson and Ashby1997) to determine the limit stress as
 \begin{equation} \frac{\sigma_{cr}^\ast}{\sigma_{fs}}=0.2\left(\frac{\alpha_1\rho_1} {\rho_{10}}\right)^{3/2}, \end{equation}
where  $\sigma _{fs}$ is the fracture strength of the solid listed in table 2.
Figure 11 illustrates the  $x-t$ diagram of the air pressure
  $p_2$ for
  $SOD$ = 59 mm in the case of 10 PPI. The grey lines denote the air/SiC interface. Figure 12 shows the overpressure histories for (a) 10 PPI and (b) 20 PPI at the end wall. The solid lines and the plots depict the numerical and experimental data, respectively. Time 0 in figures 11 and 12 was defined when the transmitted shock wave reached the end wall. The reflected and transmitted shock waves appeared as the shock wave interacted with the SiC foam. The overpressure behind the transmitted shock wave decreased to approximately 50 kPa, which was equivalent to 30 % of the overpressure behind the initial incident shock wave, showing the potential of the rigid porous foam for the mitigation of the blast wave passing through it, as well as the flexible porous foam in §§ 3.2 and 3.3. Apparently, a consistent agreement can be found in the present numerical results and the previous experimental data in figure 12. When the rigid porous foam was put near the end wall of the shock tube, the first overpressure jump at 0 ms was smaller than the theoretical one, and the gradual pressure increases were observed in figure 12. A larger PPI showed a more gradual increase of the pressure in time. The drag at the SiC foam reduced the momentum of the shocked air, resulting in the shock wave mitigation. After the transmitted shock wave reflected the end wall, the shock wave propagated back and forth between the end wall and the air/SiC interface, and the air pressure continued to increase near the end wall. In the case of
  $SOD = 59$ mm (figure 11), the shock wave reached the end wall several times, resulting in pressure jumps caused by the second and third reflections shown in figure 11 and as arrows in figure 12(a). The arrival time of the shock waves on the end wall and the overpressure behaviour also agreed well with those in the experiments.

Figure 11. The  $x-t$ diagram of the overpressure for
  $SOD = 59$ mm in the case of 10 PPI. The grey lines denote the air/SiC interface.

Figure 12. Overpressure–time histories at the end wall in the case of (a) 10 PPI and (b) 20 PPI. Time 0 is defined when the transmitted shock wave reaches the end wall. The solid lines and the plots depict the numerical and experimental data (Ram & Sadot Reference Ram and Sadot2013), respectively. The arrows show the discontinuous increase of the overpressure in the case of 10 PPI and  $SOD = 59$ mm.
Ram & Sadot (Reference Ram and Sadot2013) proposed the normalized pressure–time ( $p^\ast -\tau ^\ast$) history as
 \begin{gather} \left. \begin{gathered} p^\ast =1-e^{-\tau^\ast},\\ \tau^\ast =\frac{\omega t}{\left(SOD+L_{eff}\right)^{\gamma_2}}, \end{gathered} \right\} \end{gather}
where  $\omega$ is a property that encapsulates the macro properties of the porous sample. The values were
  $11.385\times 10^5$,
  $7.181\times 10^5$ and
  $5.515\times 10^5\,\textrm {mm}^{\gamma _2}\,\textrm {s}^{-1}$, for 10, 20 and 30 PPI, respectively (Ram & Sadot Reference Ram and Sadot2013). The effective length
  $L_{eff}$ of the porous sample was calculated by multiplying the air porosity in the porous sample (0.85) by the sample length (63 mm). The pressure was normalized by the theoretical reflected shock overpressure (535 kPa). Figure 13 shows the normalized pressure–time histories for all the calculated data. The plots are depicted from (3.3). As illustrated by the experimental study, Ram & Sadot (Reference Ram and Sadot2013) showed that all normalized pressure–time histories successfully collapsed into a single curve that was independent of the porous sample properties. The present numerical method properly computed the properties of the transmitted shock wave after passing through the rigid SiC foam.

Figure 13. Normalized pressure–time history for all calculated data and comparison with (3.3) by Ram & Sadot (Reference Ram and Sadot2013).
4. Mitigation effect of a rigid porous Ni on a blast wave (Homae et al. Reference Homae, Sugiyama, Matsumura and Wakabayashi2021)
We previously conducted numerical simulations with water (Sugiyama et al. Reference Sugiyama, Homae, Wakabayashi, Matsumura and Nakayama2018) and glass particles (Sugiyama et al. Reference Sugiyama, Homae, Matsumura and Wakabayashi2021) for a potential material filled inside a partially confined geometry to mitigate the blast wave. Homae et al. (Reference Homae, Sugiyama, Matsumura and Wakabayashi2021) presented experiments using the porous Ni foam. In this study, we conducted the numerical simulations to quantitatively discuss the mitigation mechanism of the blast wave using the porous Ni foam in the present numerical method and to show the advantage of using the porous foam that can stably stand alone. Water and glass particles might be accumulated on the tube floor because of gravity, whereas the rigid porous Ni foam could be placed on both the floor and the sidewalls and ceiling of a tube.
Homae et al. (Reference Homae, Sugiyama, Matsumura and Wakabayashi2021) used a rigid porous Ni foam with a bulk density and an initial porosity of  $5\times 10^2\,\textrm {kg}\,\textrm {m}^{-3}$ and 0.943, respectively. Table 4 shows the calculation conditions. Case 1 without the porous Ni foam provided the standard data for estimating the blast wave mitigation efficiency of cases 2 and 3. We will discuss the effect of the location of the porous Ni foam for cases 2 and 3 herein. Figure 14 shows the calculation target. The square tube was 330 mm long and 30 mm on each side, denoting a configuration similar to that in the previous studies for the mitigation effect of water and glass particles. The porous Ni foam was placed on the floor for case 2 (figure 14a,b) and on the floor, sidewalls and ceiling for case 3 (figure 14c). In this study, the origin (‘O’) was defined at the centre of the tube exit on the ground. A constant grid spacing was set in the region
  $-350 \le x \le 1650\,(\textrm {mm})$,
  $0 \le y \le 80\, (\textrm {mm})$ and
  $0\le z \le 100\,(\textrm {mm})$. In other regions, the grid spacing was gradually increased, and the full computational domain covered
  $-670 \le x \le 1650$ (mm),
  $0\le y \le 1140$ (mm) and
  $0 \le z \le 1130$ (mm). The calculations were symmetric; therefore, a mirror boundary condition was adopted at
  $y = 0$ (mm). Rigid adiabatic walls were used as the inner and outer walls of the tube. An explosion occurred 10 mm away from the end wall on the centre of the cross-section described as a high explosive in figure 14(a), where the high explosive was modelled as a cylinder of the high-energy air of 130 J (100 mg, 1.3
  $\textrm {MJ}\,\textrm {kg}^{-1}$), and the detonation process was neglected. Both the high explosive diameter and length were set to 3.0 mm. The porous Ni foam height and the pore diameter were fixed to 5 mm and 25 PPI, respectively. We obtained peak overpressures outside the tube on the
  $x$-axis and compared the numerical and experimental data for validation purposes. We used (4.1) for the elastic–plastic foams (Gibson & Ashby Reference Gibson and Ashby1997) to determine the limit stress
 \begin{equation} \frac{\sigma_{pl}^\ast}{\sigma_{ys}}=0.23\left(\frac{\alpha_1\rho_1}{\rho_{10}}\right)^{3/2}\left(1+\left(\frac{\alpha_1\rho_1}{\rho_{10}}\right)^{1/2}\right), \end{equation}
where  $\sigma _{ys}$ is the yield strength of the solid presented in table 2.

Figure 14. Calculation target for Homae et al. (Reference Homae, Sugiyama, Matsumura and Wakabayashi2021). The porous Ni foam was put on (a,b) the floor for case 2 and on (c) the floor, sidewalls and ceiling for case 3.
Table 4. Calculation conditions.

4.1. Grid convergence study
First, we conducted a grid resolution study for case 2 with three grid resolutions of 0.25 mm, 0.50 mm and 1 mm following the same procedure in the previous study for the mitigation mechanism by the glass particles (Sugiyama et al. Reference Sugiyama, Homae, Matsumura and Wakabayashi2021). Figures 15(a) and 15(b) present the time histories of the total transferred energy from air to the porous Ni foam and the peak overpressure distribution along the  $x$-axis, respectively, for case 2. The graph legend is common in figures 15(a) and 15(b). The data in figure 15(a) are the sums of the energies transferred by heat transfer, drag and the nozzling term. The maximum value of the vertical axis (130 J) denotes the released energy of the high explosive. The time history of the transferred energy was not significantly affected by the grid resolution. In figure 15(b) the peak overpressure with 1.0 mm grid spacing was 6 % less than 0.5 mm and 0.25 mm. The peak overpressure distribution converged well when the grid size was less than 0.5 mm, corresponding to 10 points within the height of the porous Ni foam. We will use the 0.50 mm grid resolution hereinafter.

Figure 15. Grid size effect for case 2. (a) Total transferred energy. (b) Peak overpressure.
4.2. Blast wave mitigation by the porous Ni foam
Figure 16 shows comparisons of the previous experiments (Homae et al. Reference Homae, Sugiyama, Matsumura and Wakabayashi2021) and the present numerical results for the peak overpressure distribution outside the tube along the  $x$-axis. The lines and the plots represent the data for the present numerical simulations and the previous experiments, respectively. The peak overpressures in this study agreed well with those in the experiments. The 0.5 mm grid resolution was enough to discuss the mitigation mechanism of the blast wave by the porous Ni foam. Case 1 was considered as the standard condition. The peak overpressures reduced by approximately 35 % and 80 % for cases 2 and 3, respectively. The increase of the interface area between the air and the porous Ni foam greatly affected the blast wave mitigation. The shock wave adiabatically compressed and accelerated the air. The drag from the velocity difference and the heat transfer from the temperature difference between the shocked air and the porous Ni foam were promoted more by increasing the interface area. We will discuss the quantitative data later.

Figure 16. Comparisons between the previous experiments (Homae et al. Reference Homae, Sugiyama, Matsumura and Wakabayashi2021) and the present numerical results for the peak overpressure distribution along the  $x$-axis.
4.3. Flow characteristics in the straight tube and quantitative analysis of the energy transfer
To understand the flow patterns inside the straight tube, figures 17, 18 and 19 depict the flow structures inside the straight tube for cases 1, 2 and 3, respectively. The flow characteristics outside the straight tube were essentially the same with those shown in the previous study (Sugiyama et al. Reference Sugiyama, Homae, Matsumura and Wakabayashi2021). We only show the flow patterns in the straight tube herein. Figure 17 presents instantaneous images of the air pressure for case 1 on the  $zx$ plane, while figures 18 and 19 illustrate those of the air pressure (upper images) and the porous Ni foam temperature (lower images) for cases 2 and 3, respectively, on the
  $zx$ plane. The black lines for figures 18 and 19 define the porous Ni foam/air interface obtained from the isolines of
  $\alpha _2 = 0.995$. Here, we defined the edge point where the porous Ni foam at the interface becomes 294 K (1 K-increase point from the initial temperature). The times for the subfigures were selected at the following moments: (a) the initial spherical shock wave reflected off the end wall, floor and ceiling; (b) the shock wave propagated 110 mm from the end wall; (c) the shock wave propagated 220 mm from the end wall; and (d) the shock wave reached the exit. For the initial condition of the high explosive, the solid volume fraction was set to
  $10^{-8}$, and the porous Ni foam temperature could be estimated at the air region. In figures 18 and 19 the high-temperature region near the high explosive could be observed, but its solid volume fraction, mass, momentum and total energy were too small to affect the propagation behaviour of the shock wave and the energy transfer between the air and the porous Ni foam.

Figure 17. Instantaneous images of the air pressure for case 1 on the  $zx$ plane inside the straight tube. Results are shown for (a) 8.6
  $\mathrm {\mu }$s, (b) 90.3
  $\mathrm {\mu }$s, (c) 210.6
  $\mathrm {\mu }$s, (d) 350.6
  $\mathrm {\mu }$s.

Figure 18. Instantaneous images of the air pressure (upper images) and the porous Ni foam temperature (lower images) for case 2 on the  $zx$ plane inside the straight tube. Results are shown for (a) 10.8
  $\mathrm {\mu }$s, (b) 91.8
  $\mathrm {\mu }$s, (c) 246.4
  $\mathrm {\mu }$s, (d) 414.4
  $\mathrm {\mu }$s.

Figure 19. Instantaneous images of the air pressure (upper images) and the porous Ni foam temperature (lower images) for case 3 on the  $zx$ plane inside the straight tube. Results are shown for (a) 10.8
  $\mathrm {\mu }$s, (b) 118.2
  $\mathrm {\mu }$s, (c) 334.8
  $\mathrm {\mu }$s, (d) 604.9
  $\mathrm {\mu }$s.
In the case without the porous Ni foam (figure 17), the shock wave reflected off the inner walls several times, becoming a planar front inside the tube after 90.3  $\mathrm {\mu }$s in figure 17(b). In the case with the porous Ni foam, the shock wave within its layer was decelerated by the drag, resulting in the curved shock wave steadily propagating inside the straight tube (figures 18 and 19). Although the drag from the shocked air was activated, the porous Ni foam hardly moved, and the kinetic energy obtained from the drag would be too small to mitigate the blast wave outside the tube. When the shock wave front transmitted a rigid porous foam as in the study of Ram & Sadot (Reference Ram and Sadot2013), the drag was a primary factor in mitigating the shock wave (figures 11 and 12). In the present numerical target, the drag effect on the blast wave mitigation was not of major importance because most of the shock wave fronts propagated above the porous Ni foam layer.
The shocked high-temperature air interacted with the porous Ni foam layer, resulting in a temperature increase caused by the heat transfer. When the shock wave interacted earlier with the porous Ni foam layer, a stronger shock wave and a greater temperature difference between the shocked air and the porous Ni foam caused a larger heat transfer rate and a higher-temperature region closer to the high explosive (figures 18 and 19). The increment of the porous Ni foam temperature was reduced farther away from the high explosive position because the shock wave weakened by its propagation inside the tube. The edge point followed the shock wave front and moved downstream as the shock wave propagated inside the tube. The interaction of the shocked air and the porous Ni foam continuously absorbed the energy from the air to the porous Ni foam, denoting that the blast wave is expected to be further mitigated as the porous Ni foam layer length increases, as previously denoted for the blast mitigation mechanism by the glass particle layer (Sugiyama et al. Reference Sugiyama, Homae, Matsumura and Wakabayashi2021). Figure 19 shows that when the porous Ni foam was placed on the floor, sidewalls and ceiling, the heat transfer occurred in various regions, and the increase in the interface area greatly affected the heat transfer.
The shock velocity inside the tube strongly depended on the calculation condition. The times at which the shock wave reached the exit were 350.6  $\mathrm {\mu }$s, 414.4
  $\mathrm {\mu }$s and 604.9
  $\mathrm {\mu }$s for cases 1, 2 and 3, respectively (figures 17d, 18d and 19d). The previous studies (Kingery Reference Kingery1989; Kingery & Gion Reference Kingery and Gion1990; Sugiyama et al. Reference Sugiyama, Wakabayashi, Matsumura and Nakayama2015) denoted that the blast wave strength outside was determined by the shock wave strength at the exit. The porous Ni foam weakened the shock wave inside a partially confined geometry, which directly mitigated the blast wave outside. Even if the time at which the shock wave interacted with the porous Ni foam was within 1 ms, the blast wave outside and the shock wave inside could be mitigated as shown in figure 16.
A strong correlation of the blast wave mitigation outside the straight tube to the amount of energy transferred from the air inside the tube was previously observed (Sugiyama et al. Reference Sugiyama, Homae, Wakabayashi, Matsumura and Nakayama2018, Reference Sugiyama, Homae, Matsumura and Wakabayashi2021). Hereinafter, we estimated the energy transferred between the air and the porous Ni foam layer to quantitatively understand the mitigation mechanism of the blast wave outside the straight tube. Figure 20 shows (a) the energy transferred by the drag, heat transfer and nozzling term for case 2 and (b) the total energy transferred for cases 2 and 3. The data in figure 20(b) are the sums of the energies transferred by the three ways. Figure 20 depicts plots representing the transferred energy when the shock wave reached the tube exit. The porous Ni foam layer hardly moved inside the tube (figure 18); thus, the kinetic energy transferred by the drag was calculated as 0.29 J in case 2. The nozzling term was activated by the existence of  $\boldsymbol {\nabla }\alpha$ in (2.1) and (2.2). The porosity gradient only appeared at the air/porous Ni foam interface because the porous Ni foam layer hardly moved from its initial position. Moreover, the porosity was close to unity for the whole region. The small
  $\boldsymbol {\nabla }\alpha$ caused the transferred energy of only 0.003 J by the nozzling term in case 2. The drag and the nozzling term were not considered to contribute to the blast wave mitigation when the shock wave propagated along the porous Ni foam layer.

Figure 20. Energy transferred by heat transfer, drag and nozzling term for case 2 and (b) total transferred energy for cases 2 and 3. The plots represent the energy transferred when the shock wave reaches the tube exit.
By contrast, the energy transferred by heat transfer reached 53.3 J (figure 20a), corresponding to 41.0 % of the initial energy (130 J) of the high explosive. The temperature increase of the shocked air was theoretically determined by the Mach number of the shock wave and the shock wave decelerated by its propagation inside the straight tube. Before the shock wave reached the tube exit, the energy transfer evidently occurred while reducing the time gradient. The energy transfer no longer occurred after the shock wave expanded via the exit (figure 20b). The temperature equilibrium between the shocked air and the porous Ni foam was then instantaneously completed just behind the shock wave front. As shown in figure 20(b), the total transferred energies for cases 2 and 3 were 53.6 J and 101.2 J, which corresponded to 41.2 % and 77.8 % of the initial energy of the high explosive, respectively. When the porous Ni foam was placed on the four interior surfaces of a tube, the transferred energy increased, and the mitigation efficiency was significantly improved (figure 16). The heat transfer before the shock wave reached the exit was the dominant factor in the blast wave mitigation, which is similar to the blast wave mitigation mechanism by the glass particles (Sugiyama et al. Reference Sugiyama, Homae, Matsumura and Wakabayashi2021). The porous foam layer that can stably stand alone easily increases the interface area of the air/porous foam layer interface and is a very attractive material for reducing the blast wave caused by an explosion inside a partially confined geometry.
5. Conclusion
In this study we adopted the Baer and Nunziato-type two-phase compressible flow model with a stress term by foam deformation to present the interaction of the shock/blast waves and the flexible/rigid porous foams and quantitatively discuss the blast wave mitigation mechanism by the porous foam. Instead of modelling the porous foam by considering its microstructure, the drag and heat transfer were simply modelled with the dimensionless numbers of the fluid dynamics. We converted the hydraulic pore diameter of a foam into an equivalent spherical diameter to apply the drag and heat transfer models for the spherical particle beds into the porous foam. The present numerical model was validated through comparisons of the results with the data of the previous experiments with respect to the interactions of a planar shock wave with the flexible or rigid foam. The present numerical model could correctly estimate the deformation behaviour of the flexible foam, total stress–time and pressure–time histories for both flexible and rigid foams.
Next, we conducted numerical simulations on the mitigation effect of the porous Ni foam filling a partially confined geometry on a blast wave. Consequently, we found an open-cell solid foam that can stably stand alone. We investigated two cases: (1) the porous foam was placed only the floor; and (2) the porous foam was placed on the floor, sidewalls and ceiling of a straight tube. The increment of the interface area of the air/porous Ni foam greatly affected the blast wave mitigation. The flow structure inside the straight tube and the transferred energy were discussed in detail to quantitatively discuss the mitigation mechanism of the porous Ni foam. The shock wave adiabatically compressed and accelerated air. The drag affected the propagation behaviour of the shock wave and caused the curved shock front inside the straight tube. However, the energy transferred by the drag and the nozzling term was too small to contribute to the blast wave mitigation. The heat transfer from the shocked air increased the porous Ni foam temperature. A large amount of the released energy was transferred by the heat transfer from the shocked air to the porous Ni foam, which was a dominant factor in mitigating the blast wave outside the tube. The increase of the interface area of the air/porous foam is a simple and efficient method for increasing the impact of the blast wave mitigation. The porous foam that can stably stand alone is a very attractive material for mitigating the blast wave caused by the explosion inside the partially confined geometry.
Funding
This work was supported by JSPS KAKENHI grant number JP18K04643.
Declaration of interests
The authors report no conflict of interest.
Author contributions
Y. Sugiyama performed the simulations. All authors contributed equally to analysing data and reaching conclusions, and in writing the paper.
Data availability statement
The data that support the findings of this study are available from the corresponding author, Y. Sugiyama, upon reasonable request.


