


1. Introduction
Granular gravity-driven flows are very common in industrial and geophysical processes. These flows are generally dense and can be confined by lateral walls or levees (due to self-channelling). The scientific community has paid particular attention to these flows over the past 30 years. However, their modelling is still an open issue. The complexity comes from grain–grain interactions, which include both collisions and long-lasting frictional contacts. Identifying regions of the flow where one type of interaction prevails over the other is part of the issue to be resolved.
One of the most-studied configurations is the inclined-plane geometry, partly because it is a simple and good model for many common situations, but also because it may be seen as a rheological test with constant friction. Indeed, if sidewall friction is negligible, for steady and fully developed (SFD) flows, the tangential and normal forces on the base correspond exactly to the components of the flow weight. Their ratio, which is nothing but the apparent friction
 ${\it\mu}$
, is equal to the tangent of the angle of inclination
${\it\mu}$
, is equal to the tangent of the angle of inclination
 ${\it\theta}$
. To date, experiments and simulations have focused mainly on flows with moderate inclination, leading to fairly simple unidirectional SFD flows (GDR-MiDi 2004; Delannay et al.
Reference Delannay, Louge, Richard, Taberlet and Valance2007). However, more complex SFD flows with spanwise vortices were obtained for higher angles (Börzsönyi, Ecke & McElwaine Reference Börzsönyi, Ecke and McElwaine2009). One therefore expects that, upon further increase of the inclination angle, more and more complex flow features should emerge.
${\it\theta}$
. To date, experiments and simulations have focused mainly on flows with moderate inclination, leading to fairly simple unidirectional SFD flows (GDR-MiDi 2004; Delannay et al.
Reference Delannay, Louge, Richard, Taberlet and Valance2007). However, more complex SFD flows with spanwise vortices were obtained for higher angles (Börzsönyi, Ecke & McElwaine Reference Börzsönyi, Ecke and McElwaine2009). One therefore expects that, upon further increase of the inclination angle, more and more complex flow features should emerge.
In the case of flows running on a flat frictional base, the ratio of the tangential to the normal component of the contact force acting on a grain in contact with the base has an upper bound, the microscopic friction coefficient
 ${\it\mu}_{m}$
. Thereby, the effective friction
${\it\mu}_{m}$
. Thereby, the effective friction
 ${\it\mu}=\tan {\it\theta}$
is also bounded by
${\it\mu}=\tan {\it\theta}$
is also bounded by
 ${\it\mu}_{m}$
. For definite and realistic values of
${\it\mu}_{m}$
. For definite and realistic values of
 ${\it\mu}_{m}$
, this automatically limits the possible angles for SFD flows. In the case of a bumpy base, there is also a limit, which depends in a complex and intricate manner on the microscopic friction coefficient, the bumpiness and the coefficient of restitution
${\it\mu}_{m}$
, this automatically limits the possible angles for SFD flows. In the case of a bumpy base, there is also a limit, which depends in a complex and intricate manner on the microscopic friction coefficient, the bumpiness and the coefficient of restitution
 $e$
(GDR-MiDi 2004). In particular, a small restitution coefficient allows SFD flows at high angles of inclination. However, these flows seem to be unstable (Taberlet et al.
Reference Taberlet, Richard, Jenkins and Delannay2007), which makes them difficult to study. The easiest way to obtain SFD flows at high angles is to introduce frictional sidewalls. This is what we have done in the present work. If the grain–wall friction coefficient is high enough, one may expect that the base friction supplemented by the sidewall friction will be able to balance the driving component of the weight.
$e$
(GDR-MiDi 2004). In particular, a small restitution coefficient allows SFD flows at high angles of inclination. However, these flows seem to be unstable (Taberlet et al.
Reference Taberlet, Richard, Jenkins and Delannay2007), which makes them difficult to study. The easiest way to obtain SFD flows at high angles is to introduce frictional sidewalls. This is what we have done in the present work. If the grain–wall friction coefficient is high enough, one may expect that the base friction supplemented by the sidewall friction will be able to balance the driving component of the weight.
We have conducted simulations of granular flows down flat and steep inclines with frictional sidewalls using a discrete element model (DEM). The principle of DEM simulations is to treat each grain as a sphere (of diameter
 $D$
) subject to gravity and contact forces with both the other grains and the basal and lateral walls. These contact forces are characterized by a coefficient of restitution
$D$
) subject to gravity and contact forces with both the other grains and the basal and lateral walls. These contact forces are characterized by a coefficient of restitution
 $e_{g}=0.972$
and a coefficient of friction
$e_{g}=0.972$
and a coefficient of friction
 ${\it\mu}_{g}=0.33$
for interactions between grains, and with
${\it\mu}_{g}=0.33$
for interactions between grains, and with
 $e_{m}=0.8$
and
$e_{m}=0.8$
and
 ${\it\mu}_{m}=0.596$
for grain–wall interactions (values taken from Louge & Keast (Reference Louge and Keast2001)). Newton’s second law is applied to calculate the motion of each individual particle. This method, which has been used successfully to simulate granular flows (Cundall & Strack Reference Cundall and Strack1979; Silbert et al.
Reference Silbert, Ertas, Grest, Halsey, Levine and Plimpton2001; Luding Reference Luding2008), has been optimized to obtain three-dimensional SFD flows within a reasonable computation time.
${\it\mu}_{m}=0.596$
for grain–wall interactions (values taken from Louge & Keast (Reference Louge and Keast2001)). Newton’s second law is applied to calculate the motion of each individual particle. This method, which has been used successfully to simulate granular flows (Cundall & Strack Reference Cundall and Strack1979; Silbert et al.
Reference Silbert, Ertas, Grest, Halsey, Levine and Plimpton2001; Luding Reference Luding2008), has been optimized to obtain three-dimensional SFD flows within a reasonable computation time.

Figure 1. Geometry of the system. The grains flow on an inclined plane (length
 $L$
) and between two sidewalls separated by a gap
$L$
) and between two sidewalls separated by a gap
 $W$
. Periodic boundary conditions are used in the
$W$
. Periodic boundary conditions are used in the
 $X$
direction. The variations of the mass holdup
$X$
direction. The variations of the mass holdup
 $\tilde{H}$
and of the angle of inclination
$\tilde{H}$
and of the angle of inclination
 ${\it\theta}$
lead to the observation of new SFD flow regimes.
${\it\theta}$
lead to the observation of new SFD flow regimes.
We used periodic boundary conditions in the streamwise direction, while walls constrain the flow in lateral directions (see figure 1). The periodic cell had a length
 $L=20D$
and width
$L=20D$
and width
 $W=68D$
. We used a relative large cell width to allow for the development of transverse instabilities (Börzsönyi et al.
Reference Börzsönyi, Ecke and McElwaine2009). It is worth mentioning that most simulations in the literature used lateral periodic boundary conditions with a small width (typically
$W=68D$
. We used a relative large cell width to allow for the development of transverse instabilities (Börzsönyi et al.
Reference Börzsönyi, Ecke and McElwaine2009). It is worth mentioning that most simulations in the literature used lateral periodic boundary conditions with a small width (typically
 $W=20D$
), preventing three-dimensional patterns from developing.
$W=20D$
), preventing three-dimensional patterns from developing.
The mass holdup is a measure of the mass of particles per unit basal surface within the simulation cell:
 $\tilde{m}=\sum _{g}m_{g}/A$
, where
$\tilde{m}=\sum _{g}m_{g}/A$
, where
 $m_{g}$
is the mass of a grain
$m_{g}$
is the mass of a grain
 $g$
and
$g$
and
 $A=L\times W$
is the basal area of the cell. For ease of interpretation, we choose to express the mass holdup in terms of an equivalent grain height
$A=L\times W$
is the basal area of the cell. For ease of interpretation, we choose to express the mass holdup in terms of an equivalent grain height
 $\tilde{H}$
by dividing
$\tilde{H}$
by dividing
 $\tilde{m}$
by the particle density
$\tilde{m}$
by the particle density
 ${\it\rho}$
:
${\it\rho}$
:
 $\tilde{H}=\tilde{m}/({\it\rho}D)$
. Thus
$\tilde{H}=\tilde{m}/({\it\rho}D)$
. Thus
 $\tilde{H}$
is the height of a dense block with the same volume as the grains. This quantity is a control parameter, which simply specifies the number of particles within the system, irrespective of their spatial repartition. For each value of the control parameters
$\tilde{H}$
is the height of a dense block with the same volume as the grains. This quantity is a control parameter, which simply specifies the number of particles within the system, irrespective of their spatial repartition. For each value of the control parameters
 ${\it\theta}$
and
${\it\theta}$
and
 $\tilde{H}$
, the simulations were run up to a stabilization of the total kinetic energy of the system – see Brodu, Richard & Delannay (Reference Brodu, Richard and Delannay2013) for details, as we reused the same configuration and simulation parameters. We obtained SFD flows for all the flow configurations we have investigated, varying extensively the inclination angle
$\tilde{H}$
, the simulations were run up to a stabilization of the total kinetic energy of the system – see Brodu, Richard & Delannay (Reference Brodu, Richard and Delannay2013) for details, as we reused the same configuration and simulation parameters. We obtained SFD flows for all the flow configurations we have investigated, varying extensively the inclination angle
 ${\it\theta}$
between
${\it\theta}$
between
 $0^{\circ }$
and
$0^{\circ }$
and
 $50^{\circ }$
and the mass holdup
$50^{\circ }$
and the mass holdup
 $\tilde{H}$
between
$\tilde{H}$
between
 $0$
and
$0$
and
 $20$
. We also tested much larger values of the angle of inclination (see supplementary figure 2 available at http://dx.doi.org/10.1017/jfm.2015.109), but we always reached SFD flows after a transient, the duration of which increases with the angle.
$20$
. We also tested much larger values of the angle of inclination (see supplementary figure 2 available at http://dx.doi.org/10.1017/jfm.2015.109), but we always reached SFD flows after a transient, the duration of which increases with the angle.
Our simulations reveal the existence of many SFD regimes that have very different characteristics: coexistence of order and disorder phases, symmetry breaking, oscillations, intermittency, stacked granular ‘convection’ rolls, polyphasic flows, etc. These new regimes emerge from the destabilization of SFD unidirectional flows upon increase of the mass holdup and the slope. In a previous work (Brodu et al.
Reference Brodu, Richard and Delannay2013), flows corresponding to
 $\tilde{H}=4$
and
$\tilde{H}=4$
and
 ${\it\theta}<23^{\circ }$
were studied. We thus focus more specifically here on large inclination flows (
${\it\theta}<23^{\circ }$
were studied. We thus focus more specifically here on large inclination flows (
 ${\it\theta}>30^{\circ }$
) and on the effect produced by an increasing mass holdup. The next section gives details of supported regimes, observed for
${\it\theta}>30^{\circ }$
) and on the effect produced by an increasing mass holdup. The next section gives details of supported regimes, observed for
 ${\it\theta}>30^{\circ }$
. Section 3 gives an overview of the different regimes we obtained by exploring the parameter space, and reports their domain of existence. Section 4 reveals that, despite the very different characteristics of the observed regimes, they show common features. Concluding remarks are given in § 5.
${\it\theta}>30^{\circ }$
. Section 3 gives an overview of the different regimes we obtained by exploring the parameter space, and reports their domain of existence. Section 4 reveals that, despite the very different characteristics of the observed regimes, they show common features. Concluding remarks are given in § 5.
2. Supported regimes
We identified at high angle (
 ${\it\theta}>30^{\circ }$
) a new flow regime, referred to as ‘supported flows’. This regime is drastically different from those reported in the literature and, in particular, from the ‘rolls’ regime investigated in several recent work (Forterre & Pouliquen Reference Forterre and Pouliquen2002; Börzsönyi et al.
Reference Börzsönyi, Ecke and McElwaine2009; Brodu et al.
Reference Brodu, Richard and Delannay2013). Dense unidirectional flows destabilize upon increase of the inclination angle (typically between
${\it\theta}>30^{\circ }$
) a new flow regime, referred to as ‘supported flows’. This regime is drastically different from those reported in the literature and, in particular, from the ‘rolls’ regime investigated in several recent work (Forterre & Pouliquen Reference Forterre and Pouliquen2002; Börzsönyi et al.
Reference Börzsönyi, Ecke and McElwaine2009; Brodu et al.
Reference Brodu, Richard and Delannay2013). Dense unidirectional flows destabilize upon increase of the inclination angle (typically between
 $20^{\circ }$
and
$20^{\circ }$
and
 $30^{\circ }$
) and then exhibit longitudinal rolls. The above references provide evidence that, with these rolls, the particle volume fraction becomes lower at the base than in the midst of the flow. Density inverted profiles are also predicted by the granular kinetic theory (Jenkins & Askari Reference Jenkins and Askari1999). However, in these regimes with rolls, the depletion of particles is moderate and located at the flow base. The geometric structure remains that of a slab of grains occupying the whole width of the channel, together with the associated secondary circulation pattern. Upon further increase of the angle,
$30^{\circ }$
) and then exhibit longitudinal rolls. The above references provide evidence that, with these rolls, the particle volume fraction becomes lower at the base than in the midst of the flow. Density inverted profiles are also predicted by the granular kinetic theory (Jenkins & Askari Reference Jenkins and Askari1999). However, in these regimes with rolls, the depletion of particles is moderate and located at the flow base. The geometric structure remains that of a slab of grains occupying the whole width of the channel, together with the associated secondary circulation pattern. Upon further increase of the angle,
 ${\it\theta}>30^{\circ }$
, a strongly sheared, dilute and agitated layer spontaneously appears at the base of the flow (see figure 2).
${\it\theta}>30^{\circ }$
, a strongly sheared, dilute and agitated layer spontaneously appears at the base of the flow (see figure 2).

Figure 2. Map of the granular ‘temperature’ for
 $\tilde{H}=5$
and
$\tilde{H}=5$
and
 ${\it\theta}=33^{\circ }$
, the same situation as for the bottom-right snapshot in figure 3. This clearly shows a much less agitated dense core than the surrounding ‘hot’ basal and side layers of gas.
${\it\theta}=33^{\circ }$
, the same situation as for the bottom-right snapshot in figure 3. This clearly shows a much less agitated dense core than the surrounding ‘hot’ basal and side layers of gas.

Figure 3. Phase diagram in the mass holdup–angle of inclination space. Regimes: Ⓤ, unidirectional flows; Ⓡ, flows with rolls; Ⓒ, flows with dense core (i.e. supported flows); Ⓐ, supported flows with asymmetric core; Ⓢ, flows with superposed rolls; Ⓑ, flows with a basal ordered layer topped by rolls. The 385 grey dots are the sampling points in the phase space where we performed a simulation (also visible in figure 6). The phase diagram is supplemented with two-dimensional maps representing the velocity in the transverse direction (left panels) and the particle volume fraction (middle and right panels). These data are averaged over the periodic direction
 $X$
and over
$X$
and over
 $500\sqrt{D/g}$
time units, which is much larger than a typical oscillation in regime Ⓐ. The snapshot on the right is thus averaged only in
$500\sqrt{D/g}$
time units, which is much larger than a typical oscillation in regime Ⓐ. The snapshot on the right is thus averaged only in
 $X$
and taken at a single time
$X$
and taken at a single time
 $t=2000\sqrt{D/g}$
. The transition regions in the phase diagram are conservatively defined from the structure of the flow (e.g. bottom right middle snapshot) as well as from the evolution of the kinetic energy over time (e.g. oscillations).
$t=2000\sqrt{D/g}$
. The transition regions in the phase diagram are conservatively defined from the structure of the flow (e.g. bottom right middle snapshot) as well as from the evolution of the kinetic energy over time (e.g. oscillations).
Such a layer is able to support a dense packing of grains moving as a whole. Additional granular gas layers separate that dense core from the sidewalls. This geometric structure is clearly distinct from that of the dense slab with secondary rolls, as can be seen on the bottom line of snapshots of figure 3 (see also supplementary figure 2), which also shows their transition. In particular, the packing fraction in the core of the supported regimes is higher than within the dense slab with the secondary rolls. This high unexpected volume fraction is not seen in density inverted profiles obtained from the kinetic theory of granular gas (Jenkins & Askari Reference Jenkins and Askari1999). These supported regimes have already been mentioned in the literature as a possible explanation for the unexpected high mobility of granular avalanches. Campbell (Reference Campbell1989) indeed suggested that the existence of a layer of highly agitated particles at low concentration beneath a densely packed main body could reduce the apparent basal friction and allow the flow to reach long runouts. However, DEM simulations have been unable up to now to reproduce these flow regimes as steady and stable states. They were only observed as transient states in decelerated flows (Campbell Reference Campbell1989) or as a steady but unstable state at a unique value of the inclination angle (Taberlet et al. Reference Taberlet, Richard, Jenkins and Delannay2007). In contrast, the supported regimes reported here are SFD, stable and, thanks to sidewall friction, were obtained within a large range of inclination angles.
The existence of a stabilized dense core within a very agitated and dilute region is probably a direct consequence of the clustering instability occurring in granular gas (McNamara & Young Reference McNamara and Young1994). It is also worth noting that this flow regime bears a strong resemblance with that observed experimentally by Holyoake & McElwaine (Reference Holyoake and McElwaine2012) on steep slopes with a ‘depletion layer’ at the walls. The structure of supported flows may also bear some resemblance to vibrated beds (Eshuis et al. Reference Eshuis, Van der Weele, Alam, Van Gerner, Van Der Hoef, Kuipers, Luding, Van Der Meer and Lohse2013). Gravity-driven flows can be seen as the superposition of two effects: a shearing, induced by gravity; and collisions with the boundaries, which can be seen as either energy sources or sinks depending on their nature (e.g. loose base comprising other mobile grains). In our situation, the base behaves as an energy source, which resembles the situation for vibrated media. Motion along the flow, mainly driven by gravity, could be more or less independent from motion in the transverse direction, which, according to this hypothesis, would be mainly driven by the interactions of the grains with the boundaries. This would explain a similarity with some regimes observed in vibrated media. However, even if similarities may occur, a major difference is that in our case there is a volumetric source of momentum, which induces shearing, while in the vibrated case, momentum is only transferred to the granular medium through the boundaries. It would nevertheless be interesting to use a hydrodynamic-like model (Eshuis et al. Reference Eshuis, Van der Weele, Alam, Van Gerner, Van Der Hoef, Kuipers, Luding, Van Der Meer and Lohse2013) to study the stability of the usual unidirectional flow when the control parameters increase, and the patterns that could result from the destabilization.
Figure 4 shows the typical volume fraction and velocity profiles for SFD supported regimes in the vertical (
 $x,z$
) symmetry plane. They present a dense core, moving at a fast and almost uniform speed, floating above a highly agitated granular gaseous phase, and topped by a dilute ‘atmosphere’ that spans a great distance over the dense core. Owing to this heterogeneous mass distribution, the centre of mass is located just on top of the core. The median of mass is unaffected by the distance of small contributions high in the dilute ‘atmosphere’. By definition, the median separates half of the mass beneath and half above, so it arguably better corresponds to the intuition for where is the ‘middle’ of the flow. We plot both quantities in figure 4. When the mass holdup increases, the core lifts up and becomes denser (see figure 4
a). Its lateral width decreases with increasing
$x,z$
) symmetry plane. They present a dense core, moving at a fast and almost uniform speed, floating above a highly agitated granular gaseous phase, and topped by a dilute ‘atmosphere’ that spans a great distance over the dense core. Owing to this heterogeneous mass distribution, the centre of mass is located just on top of the core. The median of mass is unaffected by the distance of small contributions high in the dilute ‘atmosphere’. By definition, the median separates half of the mass beneath and half above, so it arguably better corresponds to the intuition for where is the ‘middle’ of the flow. We plot both quantities in figure 4. When the mass holdup increases, the core lifts up and becomes denser (see figure 4
a). Its lateral width decreases with increasing
 $\tilde{H}$
because the lateral pressure pushes the grains towards the central core (see figure 3). This core can reach very high values of the volume fraction up to
$\tilde{H}$
because the lateral pressure pushes the grains towards the central core (see figure 3). This core can reach very high values of the volume fraction up to
 $0.6$
at large mass holdup, while the volume fraction in the supporting basal gaseous layer is below
$0.6$
at large mass holdup, while the volume fraction in the supporting basal gaseous layer is below
 $0.2$
.
$0.2$
.
Above the dense core, the volume fraction is well described by a decreasing exponential,
 ${\it\nu}(z)\propto \exp (-z/H_{C})$
, where
${\it\nu}(z)\propto \exp (-z/H_{C})$
, where
 $H_{C}$
represents the characteristic height of the atmosphere (see supplementary figure 1). The core slowly ‘evaporates’ as the angle increases for a gradual transition to granular gas at larger angles (see supplementary figures 2 and 3). Surprisingly, when the angle
$H_{C}$
represents the characteristic height of the atmosphere (see supplementary figure 1). The core slowly ‘evaporates’ as the angle increases for a gradual transition to granular gas at larger angles (see supplementary figures 2 and 3). Surprisingly, when the angle
 ${\it\theta}$
increases, the altitude of the core remains nearly constant (see figure 4
b). However, the centre of mass of the flow lifts up and the core thickness decreases as a non-negligible part of the material is transferred into the top granular gaseous phase. The vertical expansion of the flow is necessary to increase its friction on the lateral boundaries and to balance the driving force, which increases with the inclination angle. The basal friction cannot exceed
${\it\theta}$
increases, the altitude of the core remains nearly constant (see figure 4
b). However, the centre of mass of the flow lifts up and the core thickness decreases as a non-negligible part of the material is transferred into the top granular gaseous phase. The vertical expansion of the flow is necessary to increase its friction on the lateral boundaries and to balance the driving force, which increases with the inclination angle. The basal friction cannot exceed
 ${\it\mu}_{m}Mg\cos {\it\theta}$
, where
${\it\mu}_{m}Mg\cos {\it\theta}$
, where
 ${\it\mu}_{m}=0.596$
is the microscopic friction value used in the simulations (Brodu et al.
Reference Brodu, Richard and Delannay2013) and
${\it\mu}_{m}=0.596$
is the microscopic friction value used in the simulations (Brodu et al.
Reference Brodu, Richard and Delannay2013) and
 $M$
is the mass of the grains. Thus, for large angles, a large part of the friction comes from the lateral walls, as discussed in more detail below.
$M$
is the mass of the grains. Thus, for large angles, a large part of the friction comes from the lateral walls, as discussed in more detail below.

Figure 4. Vertical profiles of (a,b) the volume fraction of the flow and (c,d) the velocity in the main flow direction
 $X$
. All quantities are measured at the centre of the channel and are averaged over
$X$
. All quantities are measured at the centre of the channel and are averaged over
 $10D$
in the transverse direction
$10D$
in the transverse direction
 $Y$
. The curves reported in the right column are for a fixed mass holdup
$Y$
. The curves reported in the right column are for a fixed mass holdup
 $\tilde{H}=8$
and for different angles of inclination. Those reported in the left column are for a fixed angle of inclination
$\tilde{H}=8$
and for different angles of inclination. Those reported in the left column are for a fixed angle of inclination
 ${\it\theta}=42^{\circ }$
and for different values of mass holdup. Circles and triangles, respectively, indicate the vertical position of the median and centre of mass, which increases with both the mass holdup and the angle of inclination.
${\it\theta}=42^{\circ }$
and for different values of mass holdup. Circles and triangles, respectively, indicate the vertical position of the median and centre of mass, which increases with both the mass holdup and the angle of inclination.
The effective friction coefficients at the base
 ${\it\mu}_{b}$
and at the walls
${\it\mu}_{b}$
and at the walls
 ${\it\mu}_{w}$
respectively are computed as the ratio of tangential to normal stresses. Figure 5(a) shows the dependence of
${\it\mu}_{w}$
respectively are computed as the ratio of tangential to normal stresses. Figure 5(a) shows the dependence of
 ${\it\mu}_{b}$
and
${\it\mu}_{b}$
and
 ${\it\mu}_{w}$
on
${\it\mu}_{w}$
on
 ${\it\theta}$
and
${\it\theta}$
and
 $\tilde{H}$
. Both coefficients increase and saturate at high inclination angles, as they are upper-bounded by
$\tilde{H}$
. Both coefficients increase and saturate at high inclination angles, as they are upper-bounded by
 ${\it\mu}_{m}$
. In contrast, they decrease with the mass holdup: for a given angle, the basal friction reduces as more matter is added to the flow. This reduction of basal friction with increasing mass holdup has never been reported before and may be a clue for explaining the long runout for large rock avalanches (Campbell Reference Campbell1989).
${\it\mu}_{m}$
. In contrast, they decrease with the mass holdup: for a given angle, the basal friction reduces as more matter is added to the flow. This reduction of basal friction with increasing mass holdup has never been reported before and may be a clue for explaining the long runout for large rock avalanches (Campbell Reference Campbell1989).
In the vertical direction, however, friction on the walls does not significantly contribute to supporting the weight of the grains. As the centre of mass lifts up (figures 4 and 5 b), the normal component of the integrated stress on the lateral walls is increased. The zone below the core then reaches a high pressure, as it must sustain the flow weight. We have computed the ratio between the vertical component of the force exerted by the grains on the walls, and the vertical component of the force exerted by the grains on the base. This ratio is below 1.3 % in the non-supported regimes, with negative values in the supported ones (see figure 6). Indeed, in these cases, grains escaping the high-pressure gaseous region below the core rebound upwards on the wall. Grains circulate slowly downwards within the dense core to compensate. The very weak Janssen effect that is observed in the non-supported regimes is thus negated by the convection in the supported ones.

Figure 5. (a) Effective friction coefficients on the base
 ${\it\mu}_{b}$
and the wall
${\it\mu}_{b}$
and the wall
 ${\it\mu}_{w}$
(inset) as a function of the inclination angle
${\it\mu}_{w}$
(inset) as a function of the inclination angle
 ${\it\theta}$
. Both coefficients increase with
${\it\theta}$
. Both coefficients increase with
 ${\it\theta}$
but show a reduction for increasing mass holdup. (b) Altitude of the centre of mass
${\it\theta}$
but show a reduction for increasing mass holdup. (b) Altitude of the centre of mass
 $C_{M}$
as a function of
$C_{M}$
as a function of
 ${\it\theta}$
for various mass holdups. Markers indicate the states corresponding to the supported flow regimes for which
${\it\theta}$
for various mass holdups. Markers indicate the states corresponding to the supported flow regimes for which
 $C_{M}$
exhibits a linear increase with
$C_{M}$
exhibits a linear increase with
 $\tan {\it\theta}$
. Labels Ⓤ, Ⓡ, Ⓒ, Ⓐ, Ⓢ and Ⓑ refer to the different flow regimes defined in figure 3.
$\tan {\it\theta}$
. Labels Ⓤ, Ⓡ, Ⓒ, Ⓐ, Ⓢ and Ⓑ refer to the different flow regimes defined in figure 3.
At the same time, the presence of a granular gas at the base lowers the friction compared to the dense regimes; hence larger velocities are reached in steady state. These large velocities are partially due to large sliding velocities and, for the rest, to large gradients, at the base (see figure 4
c,d). The top layer of gas only contributes marginally to this picture, as it does not go faster than the core. However, as mentioned earlier, the vertical extent of the flow is a key feature to understand the balance between the gravitational driving force and sidewall friction. The position
 $C_{M}$
of the centre of mass of the flow is a simple and interesting indicator, which is shown in figure 5(b). For the supported flows (indicated by black dots in the figure),
$C_{M}$
of the centre of mass of the flow is a simple and interesting indicator, which is shown in figure 5(b). For the supported flows (indicated by black dots in the figure),
 $C_{M}$
increases linearly with
$C_{M}$
increases linearly with
 $\tan {\it\theta}$
according to
$\tan {\it\theta}$
according to
 $C_{M}=a\tan {\it\theta}+b$
, where the slope
$C_{M}=a\tan {\it\theta}+b$
, where the slope
 $a=54.6D$
is independent of the mass holdup. Using a simple force balance, it can be shown that the slope is simply given by
$a=54.6D$
is independent of the mass holdup. Using a simple force balance, it can be shown that the slope is simply given by
 $a\approx W/2{\it\mu}_{m}$
(see Appendix). In contrast, the parameter
$a\approx W/2{\it\mu}_{m}$
(see Appendix). In contrast, the parameter
 $b$
increases with mass holdup and reflects the corresponding increase of the core thickness with
$b$
increases with mass holdup and reflects the corresponding increase of the core thickness with
 $\tilde{H}$
described in figure 4(a).
$\tilde{H}$
described in figure 4(a).
3. Phase diagram
In addition to the supported flows, we have discovered other new regimes by exploring extensively and systematically the parameter space
 $({\it\theta},\tilde{H})$
. We report in figure 3 the domains of existence of the different regimes. These were identified using a combination of the flow structure (i.e. the concentration and the velocity fields) together with the evolution of the kinetic energy over time. We have decided to use large greyed-out transition bands for intermediate situations, together with dashed lines for transitions that appear sharp at our resolution, but which may not be so at a lower resolution. Some transitions are also visible in figure 6. The regime identifiers are labelled by circled letters and are briefly described below:
$({\it\theta},\tilde{H})$
. We report in figure 3 the domains of existence of the different regimes. These were identified using a combination of the flow structure (i.e. the concentration and the velocity fields) together with the evolution of the kinetic energy over time. We have decided to use large greyed-out transition bands for intermediate situations, together with dashed lines for transitions that appear sharp at our resolution, but which may not be so at a lower resolution. Some transitions are also visible in figure 6. The regime identifiers are labelled by circled letters and are briefly described below:

Figure 6. Proportion of the effective weight retained by sidewalls. Positive values of the ratio are when the walls push up the grains, or equivalently when the grains push down on the sidewalls, since the base always pushes up. This is the case for the non-supported regimes (on the left of the figure), a Janssen effect that disappears in the supported regimes (on the right of the figure).

Figure 7. (a) Typical temporal evolution of the mean flow velocity, for
 $\tilde{H}=5$
and
$\tilde{H}=5$
and
 ${\it\theta}=12^{\circ }$
to
${\it\theta}=12^{\circ }$
to
 $48$
° every 3°. All the flows reach a steady state via an exponential saturation. We ran the simulations up to
$48$
° every 3°. All the flows reach a steady state via an exponential saturation. We ran the simulations up to
 $2000\sqrt{D/g}$
time units. (b) Rescaled steady-state velocity
$2000\sqrt{D/g}$
time units. (b) Rescaled steady-state velocity
 $V_{L}/\tilde{H}^{1/4}$
as a function of
$V_{L}/\tilde{H}^{1/4}$
as a function of
 $\sin {\it\theta}$
for various mass holdups. The collapse is remarkable given the wide diversity of regimes. The scaling law simply reads:
$\sin {\it\theta}$
for various mass holdups. The collapse is remarkable given the wide diversity of regimes. The scaling law simply reads:
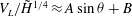 $V_{L}/\tilde{H}^{1/4}\approx A\sin {\it\theta}+B$
, with
$V_{L}/\tilde{H}^{1/4}\approx A\sin {\it\theta}+B$
, with
 $A\approx 122$
and
$A\approx 122$
and
 $B\approx -37$
. These parameters may or not depend on the channel width
$B\approx -37$
. These parameters may or not depend on the channel width
 $W$
, the coefficients of friction and elasticity, etc.
$W$
, the coefficients of friction and elasticity, etc.
-
(a) Regime Ⓤ corresponds to classical unidirectional dense flows.
-
(b) Regime Ⓡ corresponds to flows with rolls reported in previous experimental and numerical work (Forterre & Pouliquen Reference Forterre and Pouliquen2002; Börzsönyi et al. Reference Börzsönyi, Ecke and McElwaine2009; Brodu et al. Reference Brodu, Richard and Delannay2013).
-
(c) Regime Ⓒ stands for the supported regime described in § 2.
-
(d) Regime Ⓢ corresponds to the superposed rolls and appears at larger mass holdups
 $\tilde{H}$
than regime Ⓡ. An example is shown in the snapshots of figure 3.
$\tilde{H}$
than regime Ⓡ. An example is shown in the snapshots of figure 3. -
(e) Regime Ⓑ is characterized by the presence of a basal layered structure. The observed order (see snapshots of figure 3) is dynamically maintained by collisions and cage effects. The layers are sheared and not static. Rolls are present in the disordered zone on the top of the basal layers and are localized close to the lateral walls.

All these regimes have distributions of mass and of velocities that are symmetric relative to the central vertical plane,
 $Y=W/2$
. At large inclination angles, this symmetry is broken as the mass holdup increases.
$Y=W/2$
. At large inclination angles, this symmetry is broken as the mass holdup increases.
-
(f) Regime Ⓐ denotes the supported regime with asymmetric core. The dense core swings back and forth from left to right. For larger
$\tilde{H}$
and
${\it\theta}$
, a plume eventually forms on top of the core, as shown in the snapshots of figure 3. The symmetry is recovered when averaging over one oscillation cycle, and this average is stationary.


These different flow regimes open many perspectives to test the relevance of granular rheological models. For example, our results may be interpreted in the framework of the second-order fluid model proposed in (McElwaine, Takagi & Huppert Reference McElwaine, Takagi and Huppert2012), which predicts that shallow flows develop curved surface, as seen for regimes Ⓑ and Ⓒ.
4. Scaling behaviour
Although these flow regimes exhibit marked difference in terms of structural organization, they surprisingly show common features. First, the transient regime necessary to reach the steady state is well described by a simple exponential saturation for any value of the inclination angle and mass holdup:
 $V(t)=V_{L}-(V_{L}-V_{0})\exp (-t/{\it\tau})$
, where
$V(t)=V_{L}-(V_{L}-V_{0})\exp (-t/{\it\tau})$
, where
 $V(t)$
is the average streamwise flow velocity at time
$V(t)$
is the average streamwise flow velocity at time
 $t$
,
$t$
,
 $V_{0}$
is the initial flow velocity and
$V_{0}$
is the initial flow velocity and
 $V_{L}$
is the limit velocity (see figure 7
a). The characteristic time
$V_{L}$
is the limit velocity (see figure 7
a). The characteristic time
 ${\it\tau}$
is an increasing function of the mass holdup and has a non-monotonic variation with the inclination angle (see supplementary figure 4a). This exponential velocity saturation, observed in all the regimes, suggests that the flow experiences a viscous-like drag force proportional to the velocity (see supplementary figure 4b).
${\it\tau}$
is an increasing function of the mass holdup and has a non-monotonic variation with the inclination angle (see supplementary figure 4a). This exponential velocity saturation, observed in all the regimes, suggests that the flow experiences a viscous-like drag force proportional to the velocity (see supplementary figure 4b).
Second, we identify a simple dependence of the limit velocity on the mass holdup and inclination angle. At any fixed angle, the velocity follows a power law
 $\tilde{H}^{{\it\alpha}}$
, with an exponent
$\tilde{H}^{{\it\alpha}}$
, with an exponent
 ${\it\alpha}$
weakly dependent on
${\it\alpha}$
weakly dependent on
 ${\it\theta}$
but close to 0.25. Figure 7(b) reports the limit velocity
${\it\theta}$
but close to 0.25. Figure 7(b) reports the limit velocity
 $V_{L}$
rescaled by
$V_{L}$
rescaled by
 $\tilde{H}^{1/4}$
versus the inclination angle
$\tilde{H}^{1/4}$
versus the inclination angle
 ${\it\theta}$
for various mass holdups. The observed collapse is remarkable given the large diversity of the flow regimes. In steady state, the mass flow rate is simply given by
${\it\theta}$
for various mass holdups. The observed collapse is remarkable given the large diversity of the flow regimes. In steady state, the mass flow rate is simply given by
 $Q=V_{L}\tilde{H}$
such that
$Q=V_{L}\tilde{H}$
such that
 $Q\propto \tilde{H}^{5/4}$
. In the configuration of regime Ⓤ, Louge & Keast (Reference Louge and Keast2001) have experimentally measured an exponent
$Q\propto \tilde{H}^{5/4}$
. In the configuration of regime Ⓤ, Louge & Keast (Reference Louge and Keast2001) have experimentally measured an exponent
 $Q\propto \tilde{H}^{3/2}$
, which is within the range of exponents shown in figure 7(b).
$Q\propto \tilde{H}^{3/2}$
, which is within the range of exponents shown in figure 7(b).
5. Conclusion
Using a simple flow configuration with flat lateral and basal boundaries, we have discovered, by increasing the inclination angle and mass holdup, SFD regimes that present non-trivial features, including heterogeneous volume fraction, secondary flows, symmetry breaking and dynamically maintained order. Despite the diversity of the features of these states, we have highlighted that the mass flow rate obeys a scaling law in terms of
 $\tilde{H}$
. Explaining these regularities is a challenging issue, as they suggest a unified underlying model.
$\tilde{H}$
. Explaining these regularities is a challenging issue, as they suggest a unified underlying model.
A crucial question is the extent to which these regimes and their features are specific to the material parameters and the confined geometry that we have considered. Additional simulations, where we have varied the material parameters (friction and restitution coefficient) and the basal conditions (flat or bumpy), lead to similar regimes as long as grain–wall friction prevails over grain–grain friction. Sidewalls, of course, play an important role regarding the friction and allow SFD flows for any value of the chute inclination. Without sidewalls, at least for flat bases, flows at large angle would not be steady but accelerated. Despite this, analogue flow regimes appear but as a transient state (see supplementary figure 5).
These results provide a unique set of very complex granular flow regimes for testing theoretical and rheological models. These regimes surprisingly appear in a configuration, the inclined channel, that was previously considered boring and well studied. However, we have only explored a small portion of the full high-dimensional phase diagram consisting of the variations of all influential parameters. It is thus very likely that more regimes exist, especially in the wide range of conditions found in nature and in industry. We hope that our study will encourage such investigations of granular flows, in particular for wider channels and higher mass holdup values.
Acknowledgements
This work was partly financed by the RISC-E RTR and Région Bretagne (CREATE Sampleo grant). We thank M. Louge, J. McElwaine, J. Jenkins, A. Mangeney and O. Roche for helpful discussions and comments on our work.
Supplementary data
Supplementary data are available at http://dx.doi.org/10.1017/jfm.2015.109.
Appendix. Derivation of the position of the centre of mass of the flow as a function of the inclination angle
The linear variation of the centre of mass
 $C_{M}$
of the flow as a function of the tangent of the inclination angle can be interpreted by considering a simple force balance. In a stationary regime, we have
$C_{M}$
of the flow as a function of the tangent of the inclination angle can be interpreted by considering a simple force balance. In a stationary regime, we have
 $Mg\sin {\it\theta}=2{\it\mu}_{w}L\int _{0}^{\infty }N_{w}(z)\text{d}z+{\it\mu}_{b}N_{b}WL$
, with
$Mg\sin {\it\theta}=2{\it\mu}_{w}L\int _{0}^{\infty }N_{w}(z)\text{d}z+{\it\mu}_{b}N_{b}WL$
, with
 $N_{w}(z)$
and
$N_{w}(z)$
and
 $N_{b}$
the normal stress at the sidewalls and the base, respectively. The first term on the right-hand side is the friction of the wall on the flow, and the second one is the friction at the base. Both
$N_{b}$
the normal stress at the sidewalls and the base, respectively. The first term on the right-hand side is the friction of the wall on the flow, and the second one is the friction at the base. Both
 ${\it\mu}_{w}$
and
${\it\mu}_{w}$
and
 ${\it\mu}_{b}$
saturate in the supported regimes (see figure 4
a), so they can be considered as constant in a first-order approximation. Using the fact that
${\it\mu}_{b}$
saturate in the supported regimes (see figure 4
a), so they can be considered as constant in a first-order approximation. Using the fact that
 $Mg\cos {\it\theta}=N_{b}WL$
, we end up with
$Mg\cos {\it\theta}=N_{b}WL$
, we end up with
 $2\int _{0}^{\infty }N_{w}(z)\text{d}z/N_{b}=(W/{\it\mu}_{w})(\tan {\it\theta}-{\it\mu}_{b})$
. The term on the right-hand side represents a characteristic height of the flow, denoted later on by
$2\int _{0}^{\infty }N_{w}(z)\text{d}z/N_{b}=(W/{\it\mu}_{w})(\tan {\it\theta}-{\it\mu}_{b})$
. The term on the right-hand side represents a characteristic height of the flow, denoted later on by
 $H_{p}$
(if the pressure was purely hydrostatic,
$H_{p}$
(if the pressure was purely hydrostatic,
 $H_{p}$
would correspond exactly to the height of the flow). The derived relation expresses the fact that the characteristic height of the flow
$H_{p}$
would correspond exactly to the height of the flow). The derived relation expresses the fact that the characteristic height of the flow
 $H_{p}$
varies linearly with
$H_{p}$
varies linearly with
 $\tan {\it\theta}$
. This explains why the position
$\tan {\it\theta}$
. This explains why the position
 $C_{M}$
of the centre of mass, which is of the order of half the characteristic height of the flow, evolves linearly with
$C_{M}$
of the centre of mass, which is of the order of half the characteristic height of the flow, evolves linearly with
 $\tan {\it\theta}$
. Remarkably, we find here a slope
$\tan {\it\theta}$
. Remarkably, we find here a slope
 $a\approx W/(2{\it\mu}_{m})$
in agreement with the hypothesis that
$a\approx W/(2{\it\mu}_{m})$
in agreement with the hypothesis that
 $C_{M}\approx H_{p}/2$
. We also find that the ‘atmospheric height’
$C_{M}\approx H_{p}/2$
. We also find that the ‘atmospheric height’
 $H_{C}$
increases linearly with
$H_{C}$
increases linearly with
 $\tan {\it\theta}$
in the supported regimes. The slope here is about two-thirds of
$\tan {\it\theta}$
in the supported regimes. The slope here is about two-thirds of
 $W/{\it\mu}_{w}$
, corresponding to
$W/{\it\mu}_{w}$
, corresponding to
 $H_{c}\approx 3H_{p}/2$
.
$H_{c}\approx 3H_{p}/2$
.


