


1. Introduction
Particle-laden turbulent flows in various environmental processes, such as wind-blown sand/dust storms in the atmosphere and sediment transport in river and coastal systems, are two-phase flows that take place on a granular, erodible bed with typical wall-turbulence friction Reynolds numbers in the range of approximately  $10^{3}\text{--}10^{5}$. It is characterized by a splashing process, that is, a saltating particle rebounds and ejects other particles when it reaches the bed again owing to gravitational settling. More often than not, the interactions between particles and the fluid not only form various turbulence-induced spatial distributions of particles in the flow, but also modify the turbulence statistics and structures, which is called turbulence modulation (Gore & Crowe Reference Gore and Crowe1991). Although turbulence modulation is ubiquitous in a two-phase flow, the gravitational settling of particles and the bed erodibility further complicate the dynamics of momentum exchange among the turbulence, particles and bed. Because the large-scale motions (LSMs) and very large-scale motions (VLSMs) contribute significantly to the transport of mass and momentum (Marusic et al. Reference Marusic, Mckeon, Monkewitz, Nagib, Smiths and Sreenivasan2010; Zheng et al. Reference Zheng, Zhang, Wang, Liu and Zhu2013), an investigation of turbulence modulation will be helpful to understand the characteristics of turbulence and effectively predict particle transport based on actual, particle-modified turbulence.
Many investigations on particle-laden flows have been conducted using experimental techniques. Through experimental data obtained in a wind tunnel and a water channel with a rigid wall, it has been widely accepted that turbulence modulation is influenced by many non-dimensional parameters, such as the ratio of particle diameter to an integral flow length scale (Tsuji & Morikawa Reference Tsuji and Morikawa1982; Liljegren & Vlachos Reference Liljegren and Vlachos1990; Rashidi, Hetsroni & Banerjee Reference Rashidi, Hetsroni and Banerjee1990; Kulick, Fessler & Eaton Reference Kulick, Fessler and Eaton1994), particle Reynolds number (Hetsroni Reference Hetsroni1989), particle Stokes number (Kulick et al. Reference Kulick, Fessler and Eaton1994), particle momentum number (Tanaka & Eaton Reference Tanaka and Eaton2008) and particle volume fraction or mass loading (Tsuji & Morikawa Reference Tsuji and Morikawa1982; Roger & Eaton Reference Roger and Eaton1991). One can refer to the notable review papers of Hetsroni (Reference Hetsroni1989), Gore & Crowe (Reference Gore and Crowe1991) and Balachandar & Eaton (Reference Balachandar and Eaton2010) for details. In horizontal flows, the modifications of turbulence statistics by particles usually display a stratification pattern in the vertical direction owing to the effects of particle gravity settling and particle-wall collision (Kaftori, Hetsroni & Banerjee Reference Kaftori, Hetsroni and Banerjee1998; Kiger & Pan Reference Kiger and Pan2002; Righetti & Romano Reference Righetti and Romano2004; Li et al. Reference Li, Wang, Liu, Chen and Zheng2012). For example, the experiments of Righetti & Romano (Reference Righetti and Romano2004) in a water channel and Li et al. (Reference Li, Wang, Liu, Chen and Zheng2012) in a wind tunnel both revealed that the streamwise mean velocity and turbulence intensities of a fluid are reduced in the outer layer but are increased in the vicinity of the bottom wall, when compared with their particle-free partners. Particle-induced modifications of the turbulent coherent structures have also received attention recently because the behaviour of solid particles is closely associated with the dynamics of these structures. Li et al. (Reference Li, Wang, Liu, Chen and Zheng2012) found a reduction in both streamwise structure and spanwise vortex scale of the near-wall streak in a particle-laden flow under the intensified crossing-trajectory effects owing to particle saltation near the bottom wall. Tay, Kuhn & Tachie (Reference Tay, Kuhn and Tachie2015) reported larger outer-region structures in the presence of suspended particles than in a particle-free flow. Zhu et al. (Reference Zhu, Pan, Wang, Liang and Ji2019) observed that the presence of sand particles in a wind tunnel does not change the strength and coherence of LSMs, but the length scales of small-scale coherent motions in the near-wall region are distinctly reduced. However, so far, only a few experiments focusing on turbulence modulation over an erodible bed have been carried out. Zhang, Wang & Lee (Reference Zhang, Wang and Lee2008) and Li & McKenna Neuman (Reference Li and McKenna Neuman2012) conducted experiments in a horizontal wind tunnel on a sandy surface bed. Their data indicated that aeolian saltating particles reduce the mean fluid velocity, and increase the turbulence intensities and Reynolds stress. Relative to a particle-free flow, particles were demonstrated to increase the magnitude but not the frequency of burst-sweep events. Based on experiments on the near-bed turbulence in a water channel with bed-load sediment transport, Revil-Baudard et al. (Reference Revil-Baudard, Chauchat, Hurther and Eiiff2016) claimed an increase of turbulent kinetic energy across the boundary layer in addition to the decrease of mean fluid velocity. It is worth pointing out that for a particle-laden flow on an erodible bed, the majority of particles move and accumulate near the bed, which forms a high-particle-concentration layer. The extreme challenges in precisely measuring both velocity and concentration across the near-bed region make it difficult to investigate the turbulence modulation there.
Substantial advancements of our understanding on turbulence modulation by particles with a variety of parameters and flow configurations have been achieved with numerical approaches, especially those based on the direct numerical simulation (DNS) of wall turbulence coupled with a Lagrangian point-force tracking of particles. For instance, Pan & Banerjee (Reference Pan and Banerjee1996) carried out two-way coupled simulations in an open channel and observed a suppression of the sweeps, owing to the smaller particles, but an enhanced sweep activity in the presence of larger particles. Li et al. (Reference Li, Mclaughlin, Kontomaris and Portela2001) performed DNS of vertical channel flows. The effects of density ratio, mass loading and particle inertia were discussed. Under similar conditions, Dritselis & Vlachos (Reference Dritselis and Vlachos2008, Reference Dritselis and Vlachos2011a) found that particles create a torque of opposite sign to the rotation of the mean vortex, and increase the diameter and the streamwise extent of the mean vortices through the momentum exchange between particles and fluid. Zhao, Andersson & Gillissen (Reference Zhao, Andersson and Gillissen2010, Reference Zhao, Andersson and Gillissen2013) conducted DNS of horizontal turbulent channel flow and showed that fluid velocity fluctuations in the vertical and spanwise directions and Reynolds shear stress were increasingly damped while the streamwise fluid velocity fluctuations were increasingly enhanced as the particle Stokes number and volume fraction increased. They also analysed the energy transfer between particles and fluid in different regions. The effects of particle Stokes number on turbulence modification were investigated by Lee & Lee (Reference Lee and Lee2015) within a relatively early period during which particles drift towards the wall from their initial, homogeneous release over the computational domain. In a turbulent Couette flow, Richter & Sullivan (Reference Richter and Sullivan2013, Reference Richter and Sullivan2014) found that particles tend to weaken the near-wall vertical activity and this trend is enhanced with increasing Reynolds number. Li, Luo & Fan (Reference Li, Luo and Fan2016) further showed analogous turbulence modulation to Zhao et al. (Reference Zhao, Andersson and Gillissen2010, Reference Zhao, Andersson and Gillissen2013) in a spatially developing turbulent boundary layer over a flat plate. They also revealed that the diameter and mean spacing of streamwise vortices are increased by large inertia particles. Wang & Richter (Reference Wang and Richter2019) recently reported the non-monotonic effects of particle inertia on the VLSMs through DNS of open channel flows. They found that low- and high-inertia particles strengthen the VLSMs through an indirect and direct route, respectively, whereas moderate- and very high-inertia particles have little influence. In addition, Lee & Lee (Reference Lee and Lee2019) found that in a horizontal channel, the settling particles demonstrate neither strong accumulation in low-speed streaks nor enhancement of the streamwise fluid velocity fluctuations when deposited on the wall in the presence of vertical gravity, in contrast to the case of non-sedimenting particles. However, unfortunately, few numerical simulations concerning turbulence modulation have been carried out on an erodible surface. Ji et al. (Reference Ji, Munjiza, Avital, Xu and Williams2014) performed fully resolved numerical simulations of a particle-laden turbulent flow in a horizontal channel flow having a rough bed consisting of two to three layers of densely packed spheres. The total number of resolved particles was 6355. In their results, the near-wall peak of the streamwise fluid velocity fluctuations decreased slightly in magnitude and shifted downward compared with that of a particle-free flow, whereas the vertical fluid velocity fluctuations showed a perceivable increase owing to the high-speed particles in the outer region landing on and colliding with the bed, and introducing small-scale vortices in the near-wall region. The quasi-streamwise-aligned streaky structures disappear in the near-wall region, owing to the rough-bed effects and particle interferences, and recover in the outer flow region. Almost at the same time, Vowinckel, Kempe & Fröhlich (Reference Vowinckel, Kempe and Fröhlich2014) simulated the transport of particles over a rough bed consisting of 27 000 immobile and mobile particles. The presence of mobile particles alters the flow field, substantially enhancing turbulence fluctuations, Reynolds stress and interacting with the size of the different coherent particle structures. Apparently, these phenomena are different from those observed in the particle-laden flow on a rigid wall, with or without gravitational settling.
It is worth noting that the initiation and maintenance of heavy particle motion on an erodible bed require the friction velocity  $u_\tau$ of the fluid to be higher than a threshold (derived from a force balance, and/or torque balance, between fluid forces and resisting forces acting on a representative particle resting on the bed), accompanied by a high Reynolds number of turbulence (usually,
  ${Re_{\tau }}$ must be higher than 2000–3000 even in laboratory experiments, where
  $Re_{\tau }$ is the friction Reynolds number defined as the ratio of the outer length scale
  $\delta$ to the viscous length scale
  $\delta _{\nu }=\nu /u_\tau$, where
  $\nu$ is the kinematic viscosity of fluid). However, the vast majority of numerical studies on particle-laden wall turbulence are limited to low Reynolds numbers of
  $Re_\tau < 1000$, typically in the range
  $Re_\tau = 100\text{--}300$. To capture the LSMs/VLSMs in high-Reynolds-number wall turbulence, the first requirement is a sufficiently large simulation domain that allows the flow to develop with negligible velocity correlation over the domain length and width, and the second is a sufficient grid resolution that accurately resolves the smallest turbulent vortex. The resolution requirement for DNS of wall turbulence is itself approximately
  $Re^{37/14}$ or more (Choi & Moin Reference Choi and Moin2012; Yang & Griffin Reference Yang and Griffin2021). As for fully resolved particles, a discretization of each particle with
  ${O(10)}$ points per diameter is necessary, which gives rise to an increase in the grid number by at least two orders of magnitude. Consequently, it is an intractable task at this stage to simulate a high-Reynolds-number particle-laden flow on an erodible bed using DNS or a fully resolved simulation.
Large-eddy simulation can predict a turbulent flow field that is qualitatively consistent with and quantitatively close to that obtained by DNS (Schlatter et al. Reference Schlatter, Li, Brethouwer, Johansson and Henningson2010; Eitel-Amor, Örlü & Schlatter Reference Eitel-Amor, Örlü and Schlatter2014). However, the computational effort for LES is considerably lower than for DNS. It is believed that LES, together with the point-force method, is the most effective way to survey the turbulence modulation by particles and the underpinning mechanisms on an erodible bed at relatively high Reynolds number. In fact, Dritselis & Vlachos (Reference Dritselis and Vlachos2011b) showed that LES adequately predicts the particle-induced changes in the mean streamwise velocity and Reynolds stresses of DNS. Mallouppas & Van Wachem (Reference Mallouppas and Van Wachem2013) also reported the consistency between LES and experiments (Kussin & Sommerfeld Reference Kussin and Sommerfeld2002) on a suspending particle-laden flow in a horizontal channel. In this study, particle-laden flows at  $Re_b =8.7\times 10^{4}$ and
  $1.0\times 10^{5}$ are simulated using LES and the point-force approach to discuss the turbulence modulation over an erodible bed. Section 2 describes how the fluid phase is calculated and how the equation of motion for each particle is solved. The numerical models are validated according to DNS of particle-free turbulence and the wind tunnel experiments of a particle-laden flow in this section. Then, we present the effects of particles on the turbulence statistics and structures, and explain the physical mechanism of turbulence modulation in §§ 3 and 4, respectively. Section 5 summarizes the main conclusions of this work.
2. Numerical method
We simulate a horizontal open channel flow in the same way as Pan & Banerjee (Reference Pan and Banerjee1996) and Wang & Richter (Reference Wang and Richter2019) because it is characterized by features of a closed channel flow, while also exhibiting the signatures of VLSMs at half the computation cost of a channel. In this section, we will first introduce the numerical method, which includes equations and models for LES of wall turbulence, the Lagrangian point particle approach, a detailed description of the initial and boundary condition of particle motion, and a two-way interaction between the turbulence and particles. Then, the models and codes will be validated by comparing the simulated results with the DNS results of a particle-free flow and the wind tunnel experiments of a particle-laden flow, respectively.
2.1. Governing equations of a fluid flow
In the LES approach, the instantaneous turbulent fluid velocity is decomposed into components of the resolved large scales and unresolved small scales of the turbulent flow. The filtered continuity and momentum equations for the incompressible fluid can be written as
 \begin{gather} \frac{\partial \bar{u}_i}{\partial x_{i}}=0, \end{gather}
 \begin{gather}\frac{\partial \bar{u}_i}{\partial t}+\frac{\partial (\bar{u}_i\bar{u}_j)}{\partial x_j}={-}\frac{\partial \bar{p}}{\rho \partial x_i}+\nu \frac{\partial^2\bar{u}_i}{\partial x_j \partial x_j}-\frac{\partial \tau_{ij}}{\partial x_j} +f_i, \end{gather}
in which  $\bar {u}_i,\bar {p}$ are the filtered fluid velocity and pressure. Here,
  $x_i$ refers to the streamwise
  $(x)$, vertical
  $(y)$ and spanwise
  $(z)$ directions for
  $i=1,2$ and 3, respectively. Additionally,
  $t$ is the time and
  $\rho$ is the fluid density. Furthermore,
  $\tau _{ij}=\overline {u_i u_j}-\bar {u}_i \bar {u}_j$ is the subgrid-scale (SGS) stress representing the influence of the SGS motions on the resolved grid-scale fluid velocities, which can be modelled as
  $\tau _{ij}=-2C_S \overline {{\triangle} }^{2}\arrowvert \bar {S}\rvert \bar {{\mathsf{S}}_{{\mathsf{ij}}}}+\delta _{ij}\tau _{kk}/3$ if the effect of particles on SGS stress is neglected. The Kronecker delta is
  $\delta _{ij}$. The resolved strain-rate tensor and its magnitude are
  $\bar {{\mathsf{S}}_{{\mathsf{ij}}}}=(\partial \bar {u}_i/{\partial x_j}+\partial \bar {u}_j/{\partial x_i})/2$ and
  $\arrowvert \bar {S} \rvert =(2 \bar {{\mathsf{S}}_{{\mathsf{ij}}}} \bar {{\mathsf{S}}_{{\mathsf{ij}}}})^{1/2}$, respectively. The characteristic length is
  $\overline { {\triangle} }=({\triangle} _x {\triangle} _y{\triangle} _z)^{1/3}$ where
  ${{\triangle} _x},{{\triangle} _y}$ and
  ${{\triangle} _z}$ are the grid spacings in the
  $x$,
$x$,  $y$ and
  $z$ directions. The Smagorinsky coefficient
  $C_s$ is dynamically determined according to procedure proposed by Germano et al. (Reference Germano, Piomelli, Moin and Cabot1991) with the modification of Lilly (Reference Lilly1992), and averaged over time along the fluid pathline (Meneveau, Lund & Cabot Reference Meneveau, Lund and Cabot1996). The particle feedback force is given as
  ${\,f_{i}}$.
The fluid velocity satisfies periodic boundary conditions in the streamwise and spanwise directions and the free-slip condition on the upper surface. The surface bed is assumed to be hydraulically smooth if the bed deformation is not taken into account. Therefore, the no-slip condition is imposed at the lower boundary. The governing (2.1) and (2.2) are integrated in time using the fractional step method with the implicit velocity decoupling procedure proposed by Kim, Baek & Sung (Reference Kim, Baek and Sung2002). The equations are advanced in time by the Crank–Nicholson scheme. Fluid mass continuity is enforced by solving a Poisson equation for the pseudo-pressure with fast Fourier transform (FFT) in the periodic directions and tridiagonal matrix inversion in the vertical direction. All spatial derivative terms are approximated by a second-order central difference scheme on a staggered grid. The mean flow driven by a streamwise pressure gradient is adjusted dynamically in time to maintain a constant mass flux. The turbulent flows are fully developed after approximately 200 time units ( $T=200\delta /U_\delta$, where
  $U_\delta$ is the mean streamwise velocity at half the channel height of
  $\delta$) from a initial laminar velocity field.
2.2. Governing equations of particle motion
The trajectories of pointwise rigid, spherical particles with density  $\rho _p$, diameter
  $D_p$ and mass
  $m_p (={\rm \pi} \rho _p D_p^3/6)$ are determined by the drag
  $F_{Di}$ and the gravity force
  $F_G$. Other forces, such as buoyancy, pressure-gradient, Basset and virtual-mass forces, are ignored because the particles are much heavier (sand in air) than the fluid (Armenio & Fiorotto Reference Armenio and Fiorotto2001). The flow considered is a dilute gas–solid flow and the interactions between particles are neglected. Thus, the position
  $x_{p}$ and velocity
  $u_{pi}$ of a particle can be obtained from the following equations of motion
 \begin{equation} \frac{\textrm{d}^2 x_{pi}}{\textrm{d} t^2}=\frac{\textrm{d} u_{pi}}{\textrm{d} t}= \frac{F_{Di}}{m_p}+ \frac{F_G}{m_p}=\frac{3}{4} \frac{\rho}{\rho_p} \frac{C_D}{D_p}\arrowvert \tilde{\boldsymbol{u}}_{@p}-\boldsymbol{u}_p \rvert (\tilde{u}_{@pi}-u_{pi})+g\delta_{i2}, \end{equation}
where  $g$ is the acceleration arising from the gravity in the vertical direction. Here,
  $\tilde {u}_{@p}$ is the undisturbed fluid velocity at the particle position and is obtained by the trilinear interpolation method. The empirical relation for the drag coefficient
  $C_D={24}/{Re_p} (1+0.15Re_p^{0.687})$ by Schiller & Nauman (Reference Schiller and Nauman1933) is employed, which corrects for inertial effects at non-negligible values of the particle Reynolds number
  $Re_p =\arrowvert \tilde {\boldsymbol {u}}_{@p}-\boldsymbol {u}_p \rvert D_p /\nu$.
A total of 60 000 particles are randomly released into the flow field with no-slip velocities at their released positions after the turbulent flows are fully developed. The fluid entrainment (Zheng, Jin & Wang Reference Zheng, Jin and Wang2020) of particles is neglected because we simulate the developed stage of a particle-laden flow over an erodible surface. The mean shear stress is sufficiently high to sustain continuous saltation of particles and impact entrainment is dominant (Pähtz et al. Reference Pähtz, Clark, Valyrakis and Durán2020). The released particles are tracked individually in time by the third-order Runge–Kutta scheme through the integration of the Lagrangian equation (2.3). The particles exiting the channel through the planes normal to the downstream and spanwise periodic directions are reintroduced into the flow domain from the corresponding opposite boundary plane with their exiting velocities. We remark here that the particles do not collect at the free surface in this study. An important process of particle saltation motion on an erodible bed is the bouncing interaction that occurs at the end of a particle trajectory, that is, it rebounds and ejects other particles at the surface bed with which they are in contact. If the bed is not resolved, this process can be described by splashing models, which are usually obtained by wind tunnel experiments (Rice, Willetts & Mcewan Reference Rice, Willetts and Mcewan1995), discrete element simulation (Anderson & Haff Reference Anderson and Haff1991) and collision theory (Zheng, Cheng & Xie Reference Zheng, Cheng and Xie2008; Lämmel et al. Reference Lämmel, Dzikowski, Oger and Valance2017). We deploy the splashing models used in Dupont et al. (Reference Dupont, Bergametti, Marticorena and Simoëns2013) and Wang et al. (Reference Wang, Feng, Zheng and Sung2019) to involve the splashing process in the simulations. Briefly, the probability that a particle rebounds is approximated by a negative exponential function of
 \begin{equation} P_{reb}=0.95(1-\exp({-}V_{imp}/V_{e})), \end{equation}
where  $V_{imp}$ is the particle impacting velocity and
  $V_{e}=0.5$ m s
 $^{-1}$ is an empirical constant. The velocities of the rebounding particles follow a normal distribution with a mean of
  $0.6 V_{imp}$ and standard deviation of
  $0.25 V_{imp}$. The number of ejected particles at each impact with velocity
  $V_{imp}$ is
 \begin{equation} N_{ej}=0.02V_{imp}/\surd{gD_{p}} \end{equation}
and the velocities of the ejected particles  $V_{eje}$ follow an exponential distribution of
 \begin{equation} P_{eje}(V_{eje})=(1/\bar{V}_{eje})[1-\exp({-}V_{eje}/\bar{V}_{eje})] \end{equation}
with a mean of  $\bar {V}_{eje}=0.08 V_{imp}$. The rebound and ejection angles follow a normal distribution with different mean values of
  $30^{\circ },60^{\circ }$ and the same standard deviation of
  $15^{\circ }$ in the vertical plane along the streamwise direction. They both follow a normal distribution with a mean of
  $0^{\circ }$ and standard deviation of
  $10^{\circ }$ in the vertical plane perpendicular to the streamwise direction. Note that the simulation results may be quantitatively influenced by different splashing models.
The feedback force on the fluid from  $N_{cell}$ particles within a given cell volume
  $V_{cell}$ can be summed to give the body force in (2.2) by
 \begin{equation} \,f_{i}={-}\frac{1}{V_{cell}}\sum^{N_{cell}}_{n=1}F_{Di}\rvert_{n}, \end{equation}
where  $F_{Di}\rvert _{n}$ represents the drag force acting on the nth particle depicted in (2.3). This classical point-force method has been extensively used in two-way coupled DNS of a particle-laden flow (Squires & Eaton Reference Squires and Eaton1990; Li et al. Reference Li, Mclaughlin, Kontomaris and Portela2001; Dritselis & Vlachos Reference Dritselis and Vlachos2008; Zhao et al. Reference Zhao, Andersson and Gillissen2010, Reference Zhao, Andersson and Gillissen2013). Then, the particle number will gradually increase owing to the splashing process and the two-phase flow will evolve to a statistical steady-state because of the two-way coupling.
2.3. Computational details
To investigate the interaction between particles and turbulent structures, the computational domain is set to be  $L_{x}\times L_{y}\times L_{z} =6{\rm \pi} \delta \times \delta \times 2{\rm \pi} \delta$ because the VLSMs are
  $> 6\text{--}10\delta$ in length and
  $0.3\text{--}0.5\delta$ in width (Hutchins & Marusic Reference Hutchins and Marusic2007; Marusic et al. Reference Marusic, Mckeon, Monkewitz, Nagib, Smiths and Sreenivasan2010; Smits, Mckeon & Marusic Reference Smits, Mckeon and Marusic2011). With this domain size, we observe the appearance of a bimodal energy spectrum in the spanwise direction, as will be shown in figure 14. It is also sufficiently large to get correct low-order statistics of the turbulence and particles according to Lozano-Durán & Jiménez (Reference Lozano-Durán and Jiménez2014) and Wang, Park & Richter (Reference Wang, Park and Richter2020). Here,
  $\delta$ is 0.3 m to compare the simulated results of the particle-laden flow with the wind tunnel experiments of Creyssels et al. (Reference Creyssels, Dupont, El Moctar, Valance, Cantat, Jenkins, Pasini and Rasmussen2009). Note that although their wind tunnel is 0.9 m high, the height of the saltation sand particles layer in air is just
  $0.05\text{--}0.1$ m (Zheng Reference Zheng2009). Two particle-free simulations are first performed with the friction velocities of
  $u_\tau =0.1865$ and 0.21 m s
 $^{-1}$, which give rise to the friction Reynolds numbers of
  $Re_{\tau }=3730$ and
  $4200$ based on a kinematic viscosity of
  $\nu =1.5\times 10^{-5}\ \textrm {m}^{2}\ \textrm {s}^{-1}$. The number of grid points for both turbulence simulations is
  $N_{x}\times N_{y}\times N_{z} =1536\times 196\times 1024$ and the total grid number is approximately 300 million. The grid sizes in the streamwise and spanwise directions are uniform with a resolution of
  ${\triangle} x^{+}={\triangle} x\cdot u_{\tau }/\nu \approx 45.8,51.5$ and
  ${\triangle} z^{+}\approx 22.9,25.8$, respectively. The vertical grid size changes from
  ${\triangle} y^{+}_{min}\approx 1$ clustered near the bottom boundary to
  ${\triangle} y^{+}_{max}\approx 42,47.9$ near the top boundary based on a hyperbolic tangent function. There are 23 grid points within the vertical range of
  $y^{+} <100$.
The mass flow rate is held constant between unladen and laden simulations, because laden and unladen results are usually compared with the same bulk Reynolds number in experiments over an erodible surface (Li & McKenna Neuman Reference Li and McKenna Neuman2012; Revil-Baudard et al. Reference Revil-Baudard, Chauchat, Hurther and Eiiff2016). The particles considered are sand with a diameter of  $D_p=0.1$ mm, for which the dimensionless diameter is
  $D_p^{+}=D_pu_{\tau }/\nu =1.25$ and
  $1.41$ based on the flow parameters of the particle-free simulations. In all simulations, the ratio of particle diameter to the smallest resolved length scale is sufficiently small,
  ${\sim } O(10^{-1})$, which makes the Lagrangian point-particle approach applicable (Balachandar & Eaton Reference Balachandar and Eaton2010). The particle–fluid density ratio is
  $\rho _p/\rho =2200$, a typical aeolian sand flow. The Stokes numbers
  $St^{+}= (\tau _pu_{\tau }^{2}/v)$, based on a particle-free inner viscous time scale
  $\nu /u_{\tau }^{2}$, are
  $190$ and
  $244.5$ for the two particle-laden simulations, which correspond to
  $St_{out}(=\tau _p U_{\delta }/\delta )$ of 4.2 and 6.1 based on the outer flow time scale
  $\delta /U_{\delta }$, where
  $\tau _{p}=D_{p}^{2}\rho _{p}/(18\rho \nu )$ is the particle response time scale. In addition, the subgrid Stokes numbers (
 $St_{SGS}$) of the particles are higher than 5 and 10 for the two particle-laden simulations. Therefore, particle segregation is almost unaffected by subgrid turbulence (Marchioli Reference Marchioli2017).
The non-dimensional time step for calculation of fluid motion and for particle motion free from collisions is  ${\triangle} t U_{\delta }/\delta =0.002$ in outer units, which corresponds to wall units of
  ${\triangle} t^{+}=0.214$ and
  $0.235$ for the two simulations. This time step is confirmed by the simulated results to be sufficiently small that particles and fluid elements could not pass through a grid cell per iterative step.
Detailed parameters of the simulated particle-free (SF1 and SF2) and particle-laden (SL1 and SL2) flows are presented in Table 1. It will take approximately  $T=100\delta /U_{\delta }$ for the change in the particle concentration and the mean fluid velocity averaged over time and homogeneous directions to be less than
  $0.1\,\%$, which indicates a well-established statistically quasi-steady state. Statistics are then collected for another
  $T=200\delta /U_{\delta }$. At this stage, the numbers of tracked particles in each time step are
  $18.0\times 10^{6}$ and
  $49.4\times 10^{6}$ for the two simulations. The original code is paralleled in OpenMP and MPI. All calculations are carried out on China's Tianhe-2 supercomputer at China's National Supercomputer Center in Guangzhou.
Table 1. Parameters of numerical simulations. The bulk Reynolds number ( $Re_{b}=U_{b}\delta /{\nu }$, where
  $U_{b}$ is the mean bulk velocity), the friction Reynolds number
  $Re_{\tau }=u_{\tau }\delta /{\nu }$, the grid numbers, the time step
  ${\triangle} t$, the particle diameter scaled by wall units of a particle-free flow
  $D_{p}^{+}$, the Stokes number scaled by wall units (
 $St^{+}$) and outer scale (
 $St_{out}$) of the particle-free flow, and the tracked particle number
  $N_{p}$ within a particle-laden flow at statistical steady-state.

2.4. Model evaluations
To validate the models, we compare the results of the particle-free flow with DNS and experimental data from previous studies. Figure 1 shows the mean streamwise velocity  $U^{+}$ (
 $=\langle \bar {u}_1\rangle /u_\tau$, where
  $\langle \cdotp\! \rangle$ indicates average over time and homogeneous directions), turbulence intensities
  $\langle u'^{+}_1u'^{+}_1 \rangle ^{1/2}$,
 $\langle u'^{+}_2u'^{+}_2 \rangle ^{1/2}$ ,
 $\langle u'^{+}_{3}u'^{+}_{3} \rangle ^{1/2}$ and Reynolds stress
  $\langle u'^{+}_1u'^{+}_2 \rangle ^{1/2}$ in wall coordinate,
  $y^{+} (=u_{\tau } y/\nu$), from the simulation of
  $Re_{\tau }=4200$, where
  $u'_{i}=\bar {u}_i-\langle \bar {u}_i \rangle$. The DNS results reported by Lozano-Durán & Jiménez (Reference Lozano-Durán and Jiménez2014) at
  $Re_{\tau }=4179$ and the wind tunnel experimental results by Schultz & Flack (Reference Schultz and Flack2013) at
  $Re_{\tau }=4048$ are also plotted. The simulated mean velocity profile agrees quite well with the DNS and experimental data, as shown in figure 1(a). Examining the turbulence intensities and Reynolds stress (figure 1b), it is obvious that the LES results are also qualitatively consistent with previous DNS and experimental data, with the maximum difference between LES and DNS in the inner
  $\langle u'^{+}_1u'^{+}_1 \rangle ^{1/2}$ peak of approximately
  $12\,\%$. This can be attributed to the insufficient near-wall resolution, which has been a persistent problem for LES (Chin et al. Reference Chin, Ng, Blackburn, Monty and Ooi2015; Bae et al. Reference Bae, Lozano-Durán, Bose and Moin2018).

Figure 1. The results predicted by LES of a particle-free flow  $Re_{\tau }=4200$ (SF2). (a) Mean streamwise fluid velocity and (b) turbulence intensities and Reynolds stress, compared with previous DNS and experimental data.
For particle-laden cases, the models are validated by comparing the predicted mass flux profiles of  $q(y)=m_{p}<u_{p}(y)>$ with wind tunnel experiments on a sandy bed reported by Creyssels et al. (Reference Creyssels, Dupont, El Moctar, Valance, Cantat, Jenkins, Pasini and Rasmussen2009), as shown in figure 2. The results are presented in actual units because the boundary layer thickness in experiments is unknown. In figure 2,
  $u_{*eff}$ is the effective friction velocity obtained, as reported by Creyssels et al. (Reference Creyssels, Dupont, El Moctar, Valance, Cantat, Jenkins, Pasini and Rasmussen2009), by fitting the measured wind velocity at different heights from 2 to 20 cm above the sandy bed with the classical logarithmic law,
  $U(y)= (u_{*eff}/\kappa )\ln (y/y_{0})$, where
  $\kappa$ is the von Kármán constant (
 $\kappa =0.41)$ and
  $y_{0}$ is the aerodynamic roughness height. It is seen that LES can reproduce the wind tunnel measurements in quality on the variations of
  $q$ with
  $y$ and
  $u_{*eff}$. Significant discrepancies are observed in the cases of similar
  $u_{*eff}$ because the experiments were carried out using sieved sand grains having a median diameter of 0.25 mm. The inset of figure 2 shows the profiles of the particle volume fraction
  $\varPhi _{V}$ at different Reynolds numbers in a log-linear plot, which displays a clear increase of
  $\varPhi _{V}$ with regard to the vertical height
  $y/\delta$ and indicates that the majority of particles (
 $>99.5\,\%$) are transported within a layer of
  $0.03\text{--}0.06$ m (
 $0.1\text{--}0.2\delta$) high. The average height of saltating particles is higher than approximately 100
 $D_{p}$. The maximum particle volume fraction
  $\varPhi _{V}$ is
  $5.6 \times 10^{-4}$ in the close vicinity of the bed surface. Although particle–particle collisions may play a role at this volume fraction (Li et al. Reference Li, Mclaughlin, Kontomaris and Portela2001; Yamamoto et al. Reference Yamamoto, Potthoff, Tanaka, Kajishima and Tsuji2001; Caraman, Borée & Simonin Reference Caraman, Borée and Simonin2003; Kuerten & Vreman Reference Kuerten and Vreman2015; Johnson Reference Johnson2020), we neglect collisions between particles in simulations because we found that the probability of particle–particle collision within the maximum concentration grid is smaller than
  $2\%$, while the extra computational cost for collision searching is rather high. Furthermore, the results of Li et al. (Reference Li, Mclaughlin, Kontomaris and Portela2001) and Yamamoto et al. (Reference Yamamoto, Potthoff, Tanaka, Kajishima and Tsuji2001) suggested that collisions do not change the qualitative trends of turbulence modulation.

Figure 2. Mass flux profiles  $q(y)$ for different Reynolds numbers, compared against the wind tunnel experiments of Creyssels et al. (Reference Creyssels, Dupont, El Moctar, Valance, Cantat, Jenkins, Pasini and Rasmussen2009). The inset presents the variation of the particle volume fraction
  $\varPhi _{V}$ versus the vertical height
  $y/\delta$.
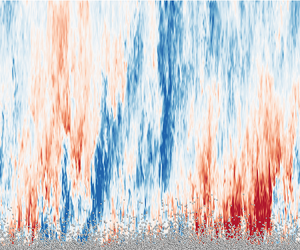
Figures 3(a) and 3(b) show simultaneous snapshots of the particle distributions at the height of  $y/\delta =0.06$ for
  $T=360 \delta /U_{\delta }$ and
  $T=400 \delta /U_{\delta }$, respectively. Particles are organized to have an active, streaky distribution. The time evolution of the particle streaks shows that during the time period of
  $T=40 \delta /U_{\delta }$, particles travel downstream with a very large change in their organized forms. We further examine the correlation
  $R_{uc}$ between the particle concentration fluctuation
  $c'$ (
 $=c-\langle c \rangle$, where
  $c$ is the particle concentration and
  $\langle c \rangle$ is the ensemble average of
  $c$) and the wind velocity fluctuation
  $u'_{1}$, see figure 3(c). The negative correlation (
 $R_{uc}<0$) in the range of
  $y/\delta <0.06\text{--}0.07$ (
 $y^{+}<230\text{--}300$), which is consistent with the previous observations (Pan & Banerjee Reference Pan and Banerjee1996; Marchioli & Soldati Reference Marchioli and Soldati2002; Zhao et al. Reference Zhao, Andersson and Gillissen2013), indicates that particles preferentially accumulate in low-speed regions. Far from the bed, where the particle-bed interaction has a negligible influence on particle transport by turbulence,
  $R_{uc}$ is slightly larger than zero. This high-speed-region distribution of particles in the outer flow region was also reported by Wang & Richter (Reference Wang and Richter2019). Note that the value of
  $R_{uc}$ is rather low owing to the combined effect of very high inertia, gravitational settling and splashing process of the simulated particles.

Figure 3. Instantaneous distributions of particles at the height of  $y/\delta =0.06$ for (a)
  $T=360 \delta /U_{\delta }$ and (b)
  $T=400 \delta /U_{\delta }$ from the simulation of SL2. (c) The profiles of correlation
  $R_{uc}$ between the particle concentration and the streamwise fluid velocity fluctuation.
3. Particle modulation of turbulence statistics
This section provides an overview of the effects of particles on the turbulence statistics. Before presenting the results, the mean streamwise momentum balance in the presence of particles is investigated. The total stress  $\tau _{*}$ can be given by the integral of the streamwise mean momentum equation from y to
  $\delta$,
 \begin{equation} \tau_{*}=\rho\nu\frac{\partial \left\langle \overline{u}_1\right\rangle}{\partial y}-\rho \left\langle {u'_1 u'_2} \right\rangle + \rho \int_\delta^{y} \,f_{1}(y')\,\mathrm{d}y'. \end{equation}
It can be written as  $\tau =\tau _{f}+\tau _{p}$, where
  $\tau _{f}= \rho \nu \ {\partial \langle \overline{u}_1\rangle }/{\partial y}-\rho \langle {u'_1 u'_2} \rangle$ is the fluid stress and
  $\tau _{p}= \rho \int _\delta ^{y} \,f_{1}(y')\,\mathrm {d}y'$ is the particle stress. It is seen from figure 4 (in actual units) that
  $\tau _{*}$ for the particle-free case shows a linear profile with a slope
  $-{1/{\delta }}$, while the profile of
  $\tau _{*}$ for the particle-laden flow deviates from the linear profile in the near-surface region because of particle momentum loss (
 $0.0553\ \textrm {m}^{-2}\ \textrm {s}^{-2}$, the momentum difference between impacting particles and rebound/ejected particles) during the splashing process. Because the mass flow rate is held constant between unladen and laden simulations,
  $\tau _{*}$ for the particle-laden flow is larger than for the particle-free flow, but nonetheless,
  $\tau _{f}$ for the laden simulation is smaller than that for the unladen simulation because of the momentum extraction by particles. It is because of these differences that all statistics presented in this paper are scaled with the wall units of the particle-free flow.

Figure 4. The streamwise mean momentum of fluid and particles in SF2 and SL2. The inset shows the log-linear plot.
3.1. Mean velocity statistics
Figure 5 shows the mean streamwise velocity profiles  $U^{+}_{1pf}$ in a particle-free flow and
  $U^{+}_{1pl}$ in a particle-laden flow for the fluid phase plotted versus the inner wall coordinate
  $y^{+}$. The results of the particle phase,
  $U^{+}_{p}$, are also included for comparison. The inset presents the results of the wind tunnel experiments of Li & McKenna Neuman (Reference Li and McKenna Neuman2012). It can be observed that the presence of the particles decreases the mean velocity within and above the particle layer, which is in good agreement with previous wind tunnel experiments (Li & McKenna Neuman Reference Li and McKenna Neuman2012) and fully resolved numerical simulation of a particle-laden flow in a horizontal channel (Ji et al. Reference Ji, Munjiza, Avital, Xu and Williams2014) over an erodible particle bed. Meanwhile, the more rapid decrease of the mean streamwise fluid velocity toward the bed than in a particle-free flow also manifests as an increase of the
  $x$-intercept of the profiles in the regions of
  $y^{+}>30$ and
  $y/\delta <0.2$ (the logarithmic region in a particle-free flow), which confirms the analytical model of saltation-formed roughness elements (Owen Reference Owen1964; Pähtz, Kok & Herrmann Reference Pähtz, Kok and Herrmann2011). The mean streamwise velocities of the particle phase are consistently smaller than that of the fluid phase, except very close to the bed (
 $y^{+}<3$). Such a velocity lag is well documented in the research on a particle-laden flow on a rigid wall (Kaftori et al. Reference Kaftori, Hetsroni and Banerjee1998; Kiger & Pan Reference Kiger and Pan2002; Shao, Wu & Yu Reference Shao, Wu and Yu2012) and that on an erodible bed (Creyssels et al. Reference Creyssels, Dupont, El Moctar, Valance, Cantat, Jenkins, Pasini and Rasmussen2009; Ji et al. Reference Ji, Munjiza, Avital, Xu and Williams2014).

Figure 5. Mean streamwise velocity profiles of turbulent flow in particle-free (SF1, SF2) and particle-laden (SL1, SL2) flows. The inset shows the corresponding results from the wind tunnel experiments of Li & McKenna Neuman (Reference Li and McKenna Neuman2012) at  $Re_{\tau }=3320$. The mean streamwise velocity profiles
  $U^{+}_{p}$ of particles are also presented for comparison.
The decrease of the mean streamwise velocity of turbulence can be explained by the increased drag on the flow. As a moving particle impacts on the bed under the act of gravity, a significant part of its momentum and energy is transferred to the bed and several resting particles are entrained at a lower speed, see § 2.2. Fluid accelerates these low-speed heavy particles, which in turn results in the reduction of the turbulence mean velocity by particle drag. It is observed from figure 5 that, figuratively, the convex shape of the mean velocity profiles of turbulence is flattened by the concave profiles of mean particle velocity. In addition, the effects of particles on mean fluid velocity become more pronounced at higher Reynolds number in the parameter range studied.
Because the particle volume fractions  $\varPhi _{V}$ decrease rapidly with respect to
  $y$, as shown in the inset of figure 2, the mean streamwise velocity profile of turbulence in a particle-laden flow begins to recover beyond where the entrained particles rarely visit (
 $y^{+}>600\text{--}760$ or
  $y/\delta >0.14\text{--}0.18$). While far from the bed (that is,
  $y^{+}>1300$),
  $U^{+}_{1pl}> U^{+}_{1pf}$ owing to the constant flow flux condition in turbulence simulations. The phenomenon where the velocity profile shifts closer to the laminar profile in the particle-laden case has also been reported by Shao et al. (Reference Shao, Wu and Yu2012) and Vowinckel et al. (Reference Vowinckel, Kempe and Fröhlich2014). In addition, because particles are obliquely rebounded and entrained in line with the employed splashing model, it is not surprising that
  $U^{+}_{p}$ is higher than
  $U^{+}_{1pl}$ below
  $y^{+}=3$, which should be zero at the bed in our simulations owing to the no-slip condition. Note that the mean streamwise velocities of particles at the bed is approximately
  $0.4\ \textrm {m}\ \textrm {s}^{-1}$ in our two simulations, which is smaller than
  $0.8{-}1\ \textrm {m}\ \textrm {s}^{-1}$ that was obtained from the wind tunnel experiments (Ho et al. Reference Ho, Walance, Dupont and Ould El Moctar2011) and discrete element simulations (Pähtz & Durán Reference Pähtz and Durán2017).
3.2. Second-order statistics
Figure 6 shows the comparisons of turbulence intensities and Reynolds stress between particle-free and particle-laden flows. The insets display the numerical results (dark lines) of Lee & Lee (Reference Lee and Lee2019) and wind tunnel experiments (pink lines) of Li & McKenna Neuman (Reference Li and McKenna Neuman2012). Note that the Reynolds number of Lee & Lee (Reference Lee and Lee2019) is  $Re_{\tau } =180$ and turbulence in the near surface layer (
 $y^{+}<60$) was not measured by Li & McKenna Neuman (Reference Li and McKenna Neuman2012). It can be found that the presence of particles suppresses the streamwise turbulence intensity
  $\langle u'^{+}_1u'^{+}_1 \rangle ^{1/2}$ and Reynolds stress
  $\langle u'^{+}_1u'^{+}_2 \rangle$ in the near-bed region but noticeably enhances them in the region away from the bed as compared with the particle-free cases. The turbulence intensities in the vertical,
  $\langle u'^{+}_2u'^{+}_2 \rangle ^{1/2}$, and spanwise,
  $\langle u'^{+}_3u'^{+}_3 \rangle ^{1/2}$, directions are substantially increased across the entire boundary layer.

Figure 6. Comparisons of turbulence intensities and Reynolds stress between particle-free and particle-laden flows. (a) Streamwise turbulence intensity  $\langle u'^{+}_1u'^{+}_1 \rangle ^{1/2}$; (b) vertical turbulence intensity
  $\langle u'^{+}_2u'^{+}_2 \rangle ^{1/2}$; (c) spanwise turbulence intensity
  $\langle u'^{+}_3u'^{+}_3 \rangle ^{1/2}$; (d) Reynolds stress
  $\langle u'^{+}_1u'^{+}_2 \rangle$. The insets show the DNS results (dark lines) of Lee & Lee (Reference Lee and Lee2019) and the wind tunnel experiments (pink lines) of Li & McKenna Neuman (Reference Li and McKenna Neuman2012), in which solid and dashed lines denote particle-free and particle-laden cases, respectively.
In the near-bed region, the suppression of  $\langle u'^{+}_1u'^{+}_1 \rangle ^{1/2}$ is consistent with the DNS studies of Lee & Lee (Reference Lee and Lee2019) in the presence of particle gravity settling. The enhancement of
  $\langle u'^{+}_2u'^{+}_2 \rangle ^{1/2}$ and
  $\langle u'^{+}_3u'^{+}_3\rangle ^{1/2}$ is opposite to not only Lee & Lee (Reference Lee and Lee2019) but the DNS results for inertial particles (Li et al. Reference Li, Mclaughlin, Kontomaris and Portela2001; Dritselis & Vlachos Reference Dritselis and Vlachos2008; Zhao et al. Reference Zhao, Andersson and Gillissen2013; Lee & Lee Reference Lee and Lee2015; Li et al. Reference Li, Luo and Fan2016) over a rigid wall. Meanwhile, the differences in turbulence intensities and Reynolds stress between a particle-laden flow and their corresponding particle-free partners are more pronounced at higher Reynolds number.
Further, the production term  ${{\mathsf{P}}_{{\mathsf{ij}}}}$, velocity pressure gradient term
  $\varPhi _{ij}$, turbulent diffusion term
  ${{\mathsf{D}}_{{\mathsf{ij}}}}$, dissipation term
  $\varepsilon _{ij}$ and particle-fluid interaction term
  ${{\mathsf{B}}_{{\mathsf{ij}}}}$ of the transport equation of Reynolds stress are shown in figure 7 with regard to
  $y^{+}$, where
 \begin{gather} {{\mathsf{P}}_{{\mathsf{ij}}}}={-}\left\langle u'_{i}u'_{k} \right\rangle\partial\left\langle \overline{u}_j \right\rangle/\partial x_k -\left\langle u'_{j}u'_{k} \right\rangle\partial \left\langle \overline{u}_i \right\rangle/\partial x_k, \end{gather}
 \begin{gather}\varPhi_{ij}= \left\langle u'_{i}\partial p'/ \partial x_j \right\rangle +\left\langle u'_{j}\partial p' /\partial x_i \right\rangle, \end{gather}
 \begin{gather}{{\mathsf{D}}_{{\mathsf{ij}}}}=\partial^{2} \left\langle u'_iu'_j \right\rangle/\partial x_k \partial x_k -\partial \left\langle u'_iu'_ju'_k \right\rangle/\partial x_k, \end{gather}
 \begin{gather}\varepsilon_{ij}={-}2 \left\langle \nu _{eff} \partial u'_i/ \partial x_k \cdotp \partial u'_j /\partial x_k\right\rangle, \end{gather}
 \begin{gather}{{\mathsf{B}}_{{\mathsf{ij}}}}={-}\left\langle u'_if'_j \right\rangle-\left\langle u'_jf'_i \right\rangle. \end{gather}
Here  $\nu _{eff}$ is the effective viscosity expressed as
  $\nu _{eff}=\nu +\nu _{SGS}$ and
  $\nu _{SGS}$ is the SGS turbulent viscosity. For comparison purposes, the results for the particle-free flow of SF2 (the results for SF1 are very close to those for SF2, thus are not presented here) are also shown. All terms in the budget equations of a particle-laden flow are made non-dimensional with
  $u^{4}_{\tau ,pf}/\nu$ and
  $u_{\tau ,pf}$ is the wall friction velocity of particle-free turbulence. It is seen from figure 7(a) that
  $P^{+}_{11}$,
 $D^{+}_{11}$ and
  $\varepsilon ^{+}_{11}$ for a particle-laden flow are significantly decreased in the near bed region by particles when compared with the particle-free case. One can also observe from figure 7(e) that all non-zero components of
  ${\mathsf{B}}^{+}_{{\mathsf{ij}}}$ are negative across the entire particle layer, thus act as sink terms in their respective budget equations, and
  $B^{+}_{11}$ dominates the others in magnitude. The appearance of an extra sink term and the reduction of the production term are likely to reduce
  $\langle u'^{+}_1u'^{+}_1 \rangle ^{1/2}$ in a particle-laden flow because these terms are believed to play dominating roles in the Reynolds stress budgets. The same is true for
  $\langle u'^{+}_1u'^{+}_2 \rangle$. For the zero gravity case, Lee & Lee (Reference Lee and Lee2015) found that larger numbers of particles will accumulate in the low-speed streaks for a long time and may produce a positive streamwise feedback force. Dritselis & Vlachos (Reference Dritselis and Vlachos2008) claimed that particles damp low-speed streaks and may affect the perturbation growth on a streak velocity distribution, thus, reduce the production of enstrophy and turbulent kinetic energy. Furthermore, a large terminal fall velocity owing to the gravity is responsible for the effect of crossing trajectories, which indicates that heavy particles dampen the near-wall turbulence more efficiently during their settling through it (Lee & Lee Reference Lee and Lee2019). Therefore, we emphasise that the reduction of
  $\langle u'^{+}_1u'^{+}_1 \rangle ^{1/2}$ can be ascribed to both particle inertia and gravity.

Figure 7. (a–d) Budgets of  $\langle u'^{+}_1u'^{+}_1 \rangle ^{1/2}$,
 $\langle u'^{+}_2u'^{+}_2 \rangle ^{1/2}$,
  $\langle u'^{+}_3u'^{+}_3 \rangle ^{1/2}$ and
  $\langle u'^{+}_1u'^{+}_2 \rangle$ for particle-laden and particle-free flows, (e) particle-fluid interaction term
  ${{\mathsf{B}}_{{\mathsf{ij}}}}$.
However, the combined effect of sink terms and gravity settling, which should attenuate the turbulence intensity in all three directions, as suggested in Lee & Lee (Reference Lee and Lee2019), does not lead to the suppression of  $\langle u'^{+}_2u'^{+}_2 \rangle ^{1/2}$ and
  $\langle u'^{+}_3u'^{+}_3 \rangle ^{1/2}$ in the near-surface region, see figures 6(b) and 6(c). On the contrary,
  $\langle u'^{+}_2u'^{+}_2 \rangle ^{1/2}$ and
  $\langle u'^{+}_3u'^{+}_3 \rangle ^{1/2}$ are slightly enhanced. This can be first explained by figure 7. Because the corresponding production terms
  $P^{+}_{22},P^{+}_{33}$ are zero in the vertical and spanwise components of the budget equation, the quantities
  $\varPhi ^{+}_{22}, \varPhi ^{+}_{33}$ may be thought of as pseudo-production terms. From figures 7(b) and 7(c), it is seen that both
  $\varPhi ^{+}_{22}$ and
  $\varPhi ^{+}_{33}$ increase in magnitude in the particle-laden case as compared with the particle-free case. Although the vertical and spanwise components of the particle-fluid interaction term
  $B^{+}_{22}$ and
  $B^{+}_{33}$ are also negative, a close look at figure 7(e) shows that they are smaller than the magnitude change of
  $\varPhi ^{+}_{22}$ and
  $\varPhi ^{+}_{33}$ (especially the latter). This will give rise to the slight enhancement of
  $\langle u'^{+}_2u'^{+}_2 \rangle ^{1/2}$ and
  $\langle u'^{+}_3u'^{+}_3 \rangle ^{1/2}$ that we have already observed. This is, essentially, the result of the splashing process on the erodible bed, which is absent in the simulations of a particle-laden flow on a rigid wall with and without particle gravity. To further elucidate the effects of the splashing process on turbulence modulation, the near-bed fluid velocities are conditionally sampled based on the ascending (
 $u_{p2}>0$) and descending (
 $u_{p2}<0$) particles. The conditionally averaged spanwise and vertical velocities at a reference vertical height of
  $y^{+}=15$ are depicted in figure 8. Apparently, the range and strength of the positive and negative spanwise velocity
  $u'_3$ (counter-rotating streamwise vortices) for
  $u_{p2}>0$ is much larger than that for
  $u_{p2}<0$ by comparing figure 8(a) with 8(b). This indicates that the enhancement of turbulence that particles educed during ascending process is more significant than the suppression educed during descending process. The modulation of vertical velocity
  $u'_2$ by ascending and descending particles is very close in the ranges of
  $y/\delta <0.1$ and
  $-0.005<{\triangle} z/\delta <0.005$, as seen in figures 8(c) and 8(d), thus the change of
  $\langle u'^{+}_2u'^{+}_2 \rangle ^{1/2}$ in figure 6(b) is indistinct. Note that the ascending motion of particles takes place when a high-speed fluid sweeps down to the surface (
 $u'_2<0$), which induces an upward ejection of local fluid, and vice versa. Nevertheless, the splashing process of heavy particles from the erodible bed plays a crucial role in modifying the near-bed turbulence. That is, the rebound and ejected particles help to redistribute the kinetic energy from the streamwise to vertical and spanwise directions, which causes the suppression of
  $\langle u'^{+}_1u'^{+}_1 \rangle ^{1/2}$ and the enhancement of
  $\langle u'^{+}_2u'^{+}_2 \rangle ^{1/2}$ and
  $\langle u'^{+}_3u'^{+}_3 \rangle ^{1/2}$, and increases the spanwise size of turbulence streaks owing to their outward motion in the spanwise direction. In this paper, this is referred to as the ‘splashing effect’ of turbulence modulation by particles – one of the most important features of a particle-laden flow over an erodible bed.

Figure 8. Visualization of conditionally sampled flow field in the  $z$–
$z$– $y$ plane at a reference height of
  $y^{+}=15$ for SL2. Contours show (a) the spanwise velocity
  $u'^{+}_3$ seen by ascending particles,
  $u_{p2}>0$; (b) the spanwise velocity
  $u'^{+}_3$ seen by descending particles,
  $u_{p2}<0$; (c) the vertical velocity
  $u'^{+}_2$ seen by ascending particles,
  $u_{p2}>0$ and (d) the vertical velocity
  $u'^{+}_2$ seen by descending particles,
  $u_{p2}<0$. The black dot in each panel indicates the conditioning location of
  $y^{+}=15$.
In the region far from the bed, that is,  $y^{+}>40\text{--}50$, the turbulence intensities and Reynolds stress are all enhanced until the top of the boundary layer is reached in particle-laden flows. These results are consistent with the findings of previous wind tunnel studies (Zhang et al. Reference Zhang, Wang and Lee2008; Li & McKenna Neuman Reference Li and McKenna Neuman2012) on an erodible bed, but opposite to the numerical simulations of a particle-laden flow over a rigid wall with vertical particle gravity settling. In spite of the negative or zero
  ${{\mathsf{B}}_{{\mathsf{ij}}}}$, the production terms
  $P^{+}_{11}$,
  $P^{+}_{12}$ and velocity pressure gradient terms
  $\varPhi ^{+}_{22}$,
  $\varPhi ^{+}_{33}$ are significantly enhanced in this region by the presence of particles and thereby
  $\langle u'^{+}_1u'^{+}_1 \rangle ^{1/2}$,
  $\langle u'^{+}_2u'^{+}_2 \rangle ^{1/2}$,
  $\langle u'^{+}_3u'^{+}_3 \rangle ^{1/2}$ and
  $\langle u'^{+}_1u'^{+}_2 \rangle$ are increased there. At the height where the entrained particles rarely visit, turbulence begins to recover, that is, the turbulence intensities and Reynolds stress gradually recover to the unladen state. Figure 9 shows the distribution of the production of the total turbulent kinetic energy, normalized by the dissipation terms of the respective particle-free flow. The most noticeable feature of particle-free flow SF2 (
 $Re_{\tau }= 4200$) in figure 9 is the second lower peak in the outer layer at
  $y^{+}\approx 900$ and a not-well-defined plateau in between the inner and outer peaks. From a physical standpoint, this implies that the excess turbulent kinetic energy will be transferred to the underlying layers through turbulent diffusion from the outer layer (Bernardini, Pirozzoli & Orlandi Reference Bernardini, Pirozzoli and Orlandi2014). For a particle-laden flow, the elevated plateau extends from
  $y^{+}\sim 40$ to
  $y^{+}>1000$ and the outer-layer peak disappears, which implies that the turbulent kinetic energy is mainly transferred from the inner to the outer layer. This finding further confirms the crucial role of the splashing process in enhancing the second-order statistics in the outer layer of the wall turbulence. The effect of the moving particles on the fluid outside the region to which saltation is confined is similar to that of active, random roughness elements of mean height comparable to the depth of the saltation layer. On average, the particle layer caused by the settling and splashing heavy particles in the near-bed region reduce the mean streamwise velocity here, see figure 5. This is equivalent to the lifting of the bed or the increase of the surface roughness height, as suggested by Owen (Reference Owen1964). Here, ‘active’ refers to the dynamics process of an impact-splash movement of heavy particles near the bed and also the mobility of the streaky particle distribution. The mean roughness height
  $H_{p},$ estimated according to the particle volume fraction
  $\varPhi _{V}$ higher than
  $10^{-6}$ (figure 2), is
  $H_{p}/\delta \approx 0.13$ and
  $0.17$. In this case, the variations in the surface roughness significantly affect the high-order statistics in the outer layer (Krogstad & Antonia Reference Krogstad and Antonia1999; Jiménez Reference Jiménez2004; Lee & Sung Reference Lee and Sung2007). Overall, turbulence modulation by particles in the outer region can also be attributed to the ‘splashing effect’.

Figure 9. The ratio of the production term  $P_k(=P_{ii})$ to the dissipation term
  $\varepsilon _k(=\varepsilon _{ii})$ of the turbulent kinetic energy budget.
It is worth mentioning that the amplitude increase of turbulence intensities and Reynolds stress in the wind tunnels of Li & McKenna Neuman (Reference Li and McKenna Neuman2012) is smaller than that in the present simulations, as shown in figure 6, likely because a much larger particle ( $500\ \mathrm {\mu }$m) was used in the experimental studies. In addition, the transition point where streamwise turbulence intensities decrease and increase is closer to the bed surface for SL2 than SL1 because the particle volume fraction and roughness height increase with Reynolds number.
4. Particle modulation of turbulence structures
Figure 10 presents instantaneous snapshots of the normalized streamwise fluctuating velocity in the horizontal plane at  $y/\delta =0.06$ and
  $y^{+}=15$ for the particle-free (SF2) and particle-laden (SL2) flows. The alternating high- and low-speed streaks are clearly visible in both inner (figure 10d) and outer regions (figure 10b) throughout the simulation domain in the particle-laden flow. However, these streaks are clearly shorter and narrower than those in a particle-free flow. The very long low/high-speed contours in figures 10(a) and 10(b) are quite similar to those in figures 10(c) and 10(d). The large-scale outer features have superimposed footprints in the inner small-scale structures, which implies that small-scale motions near the wall are strongly influenced by large-scale motions from above. Because the qualitative characteristics of the velocity distributions and coherent structures are independent of Reynolds number, the following analysis will be based mainly on the simulated results from SF2 and SL2.

Figure 10. Distribution of instantaneous streamwise fluctuating velocity in the horizontal planes at heights of  $y/\delta =0.06$ and
  $y^{+}=15$ for SF2 (a,c) and SL2 (b,d).
In wall-bounded flows, the spatial two-point correlations of velocity fluctuations are usually employed to estimate the averaged length scales of typical structures. To gain the quantitative effects of particles on turbulent coherent structures, the streamwise and spanwise two-point correlations of the streamwise fluctuating velocity
 \begin{equation} \left.\begin{gathered} R_{uu}({\triangle} x)=\frac{\left\langle u'_1(x,y,z,t)u'_1(x+{\triangle} x,y,z,t)\right\rangle }{\left\langle u'_1(x,y,z,t)u'_1(x,y,z,t)\right\rangle}\\ R_{uu}({\triangle} z)=\frac{\left\langle u'_1(x,y,z,t)u'_1(x,y,z+{\triangle} z,t)\right\rangle }{\left\langle u'_1(x,y,z,t)u'_1(x,y,z,t)\right\rangle} \end{gathered}\right\} \end{equation}
at different vertical positions for the particle-free and particle-laden flows are calculated and depicted in figure 11. For a particle-free flow, the minimum of the spanwise correlation  $R_{uu}({\triangle} z)$ at
  $y/\delta =0.06$ occurs at
  ${\triangle} z/\delta \approx 0.75$, which corresponds to a mean spacing of
  $1.5\delta$ of the outer structures. With the addition of particles,
  $R_{uu}({\triangle} z)$ reaches the minimum at
  ${\triangle} z/ \delta =0.67$, that is, the mean spanwise spacing of the outer structures is reduced by approximately
  $11\,\%$. In the vertical range of
  ${\triangle} z /\delta <0.9$,
  $R_{uu}({\triangle} z)$ in a particle-laden flow is smaller than that in a particle-free flow, which confirms that particles narrow down the outer structures. In the inner layer at
  $y^{+}=15$, there are two minimum values of
  $R_{uu}({\triangle} z)$ at
  ${\triangle} z /\delta \approx 0.02$ and
  ${\triangle} z/\delta \approx 0.7$. The former, which corresponds to the inner-scale characteristic length of
  ${\triangle} ^{+}_z\approx 80$, features a streak spacing of
  $\lambda ^{+}_z\approx 160$, while the latter is comparable to the scale of the outer structures and thus can be identified as their ‘footprints’. Moreover,
  $R_{uu}({\triangle} z)$ in a particle-laden flow is smaller and larger than that in a particle-free flow for
  ${\triangle} z/\delta >0.17$ and
  ${\triangle} z/\delta <0.17$, respectively. This trend is also observed for
  $R_{uu}({\triangle} x)$ in figure 11(b) with the transition point of
  ${\triangle} x/\delta \approx 2.3$. The phenomenon that particles with a larger Stokes number increase the size of near-wall streaks is consistent with previous studies (Vreman Reference Vreman2007; Dritselis & Vlachos Reference Dritselis and Vlachos2008; Li et al. Reference Li, Luo and Fan2016). However, the decrease of the size of the large-scale turbulence structure in the outer region by particles is in contrast to the experiments with sedimenting particles (Tay et al. Reference Tay, Kuhn and Tachie2015).

Figure 11. Two-point correlations of the streamwise velocity fluctuations in (a) spanwise and (b) streamwise directions for SF2 and SL2.
The length  $L_{sx}$ and width
  $L_{sz}$ of the mean turbulence structures for
  $R_{uu}({\triangle} x) =0.2$ and
  $R_{uu}({\triangle} z)=0.2$ are extracted and depicted in figure 12 with respect to vertical height. As expected,
  $L_{sx}$ and
  $L_{sz}$ increase with increasing distance from the bed in both particle-free and particle-laden flows. Taking the streamwise correlation length in a particle-laden flow as an example,
  $L_{sx}$ increases from
  ${\sim }0.3\delta$ (1260 in viscous units) in the near-wall region, via
  ${>}3\delta$ in the height range of
  $y/\delta >0.015$, to
  ${\sim }10\delta$ away from the bed and remains nearly constant there. Wang & Richter (Reference Wang and Richter2019) detected VLSMs in their simulations of open-channel turbulence with inertial particles at
  $Re_{\tau }=550$ and 950. They revealed the non-monotonic effects of particle inertia on VLSMs based on the premultiplied and two-dimensional energy spectra of the streamwise fluctuating velocity. However, they did not report the changes in the scale of the turbulence structures. In addition, it can be seen from figure 12 that the correlation scales of
  $u'_1$ increased more gently with
  $y$ in a particle-laden flow when compared with the undulate variation in the particle-free case. Increasing and decreasing of the correlation scales in the spanwise and streamwise directions switched almost at the same height of
  $(y/\delta )_{c} \approx 0.011$ (
 $y^{+}\approx 45$) for the given threshold value.

Figure 12. The correlation scales in streamwise ( $L_{sx}$) and spanwise (
 $L_{sz}$) directions extracted from the simulations for
  $R_{uu}(\triangle x)=0.2$ and
  $R_{uu}(\triangle z)=0.2$ for SF2 and SL2.
The increase of the correlation scales in the near-surface region can be attributed to the proposed ‘splashing effect’. Specifically, the ranges of outward motion of the fluid educed by rebound and ejected particles during the splashing process are much larger than that during the gravity settling process, which results in an outward stretching of the near-bed turbulence streaks on average. One should refer to figures 8(a) and 8(b) for the comparison in the spanwise direction. The same is true for that in the streamwise direction, though not shown here. As discussed above, the modulation of the turbulence intensities and Reynolds stress by particles in the outer region can also be attributed to the ‘splashing effect’. Accordingly, the modulation of turbulence structures should be closely related to the underlying splashing process. To further this discussion, the fluctuating velocities are conditionally sampled via a high-concentration event of  $c'(y^{+}=1)>0$ for a particle-laden flow and are depicted in figure 13(a–c). It can be seen from figures 13(a) and 13(b) that the large-scale high-speed fluid sweeps (
 $u'_1>0,u'_2<0$) in the range of
  ${\triangle} x/\delta >2$, while low-speed fluid ejects (
 $u'_1<0,u'_2>0$) in the range of
  ${\triangle} x/\delta <2$, especially within
  ${\triangle} x/\delta =0\sim 2$. The high-concentration event around
  ${\triangle} x/\delta =0$, which leads to the sweep of fluid on one side and the ejection on the other side of the event, figuratively, cuts off the mean outer turbulent structure from its tail. Note that the cut-off effect of the turbulence structure in the outer region extends to where the entrained particles rarely visit, but becomes subtle as the particle concentration goes to zero along with the vertical height. In addition, the changes of the outer flow can also be observed from the spanwise velocity downstream and upstream of the high-concentration region. Figure 13(c) shows several slices of conditionally averaged
  $u'_3$ within the range of
  $-1\delta <{\triangle} x<4\delta ,\ -0.2\delta <{\triangle} x<0.2\delta$, together with the transparent isosurface of three-dimensional spatial correlation of particle concentration
  $R_{cc}$ in grey. This clearly shows an opposite distribution of
  $u'_3$ upstream and downstream of the high-concentration region. For example,
  $u'_3>0$ when
  ${\triangle} z/\delta >0$ and
  $u'_3<0$ when
  ${\triangle} z/\delta <0$ in the slice at
  ${\triangle} x=4\delta$, while
  $u'_3<0$ when
  ${\triangle} z/\delta >0$ and
  $u'_3>0$ when
  ${\triangle} z/\delta <0$ in the slices within the high-concentration region. Meanwhile, the scales of spanwise high-speed (
 $u'_3>0$) and low-speed (
 $u'_3<0$) region are both reduced, which indicate that particles rebound and ejected near
  ${\triangle} x=0,{\triangle} z=0$ will tighten the outer structures in the spanwise direction.

Figure 13. Conditionally averaged results for (a) streamwise and (b) vertical fluctuating velocities for  $c'(y^{+}=1)>0$ in the
  $x$–
$x$– $y$ plane and (c) spanwise fluctuating velocity in various
  $y$–
$y$– $z$ slices.
Finally, the energy spectra of the streamwise fluctuating velocity and particle concentration are used to examine the statistical properties of turbulence within different spectral portions of the eddy scales, as well as the indirect modulation of turbulence in the outer region by the splashing particles. Figure 14(a–c) shows the one-dimensional energy spectra of  $u'_1$ in a particle-free flow, a particle-laden flow and their difference, respectively. Here, the spectral densities shown in the logarithmic plot have been premultiplied by the streamwise wavenumber
  $k_{x}$ to show the integral contribution per log
  $k_{x}$. Figure 14(d–f) are the same plots for spanwise direction and premultiplied by the spanwise wavenumber
  $k_{z}$. The premultiplied energy spectra of the particle concentration in the streamwise and spanwise directions, scaled by the mean particle concentration within the first vertical grid
  $C^{2}_{m,y_{1}}$, are depicted in figures 14(c) and 14(f), see the shaded area. Two distinct (inner and outer) energy peaks are seen in figure 14(d) that correspond to the inner/outer scale separation in high-Reynolds-number turbulence. The outer peak located at the scale
  $\lambda _z^{+}\approx 6000$ (
 $\lambda _z/\delta \approx 1.43$), which represents the turbulent VLSMs in the outer region, is similar to that in a previous numerical simulation of fully developed turbulent channel flows,
  $\lambda _z/\delta \approx 1.2\text{--}1.6$ (Abe, Kawamura & Cho Reference Abe, Kawamura and Cho2004). This inner/outer scale separation is also implicit in figure 14(a) though the length of the simulation domain is not sufficiently long to capture the second, outer peak. We can clearly identify the suppression of the inner small-scale turbulence and the enhancement of the outer large-scale turbulence in a particle-laden flow. Noteworthily, the inner peaks move to the right by the presence of particles. For instance, the spanwise wavenumber, which corresponds to the spanwise inner energy peak, increases from
  $\lambda _z^{+}=137$ in a particle-free flow (figure 14d) to
  $\lambda _z^{+}=178$ in a particle-laden flow (figure 14e). The outer peaks move to the left as the streamwise second peak tends to be visible in figure 14(b) when compared with figure 14(a). We found, for the first time, that the streamwise turbulent kinetic energy increases across a wide range of wavelengths, from medium to large and very large. Most importantly, the transitions of turbulence modification from suppression to enhancement in spectral space (black lines in figures 14(c) and 14(f)) are almost coincident with the contour lines of
  $k_{z}E_{cc}/C^{2}_{m,y1}\approx 0$ and
  $k_{x}E_{cc}/C^{2}_{m,y1}\approx 0$, respectively. This coincidence further demonstrates that the increase of the streamwise turbulent kinetic energy beyond the saltation layer is not the direct result of particle feedback, but the bottom-up effect of the splashing process.

Figure 14. Contour maps showing the variation of one-dimensional streamwise premultiplied spectra with vertical position for (a) particle-free, (b) particle-laden flows and (c) their difference from the simulation for SL2. (d,e) and (f) are those in the spanwise direction. The premultiplied energy spectra of particle concentration in the streamwise and spanwise directions are also depicted in (c,f).
5. Conclusions
In this paper, we have simulated particle-laden flows on an erodible bed, the wind-blown sand as a typical example. Of importance is the splashing process when heavy particles impact the bed at the end of their trajectory. The simulation domain of  $L_{x}=6{\rm \pi} \delta ,L_{z}=2{\rm \pi} \delta ,\delta =0.3$ m and credibly high Reynolds number of
  $Re_{b}=8.7 \times 10^{4}$,
  $1.0 \times 10^{5}$ (
 $Re_{\tau }=3730$ and 4200 for particle-free flows) provide a rewarding foundation for capturing the LSMs/VLSMs in wall turbulence and maintaining a super-threshold particle saltation. Fluid motion is calculated by directly solving the filtered Navier–Stokes and continuity equations. Particles are tracked in a Lagrangian way through the action of forces imposed by the fluid and gravity. Particle–particle interactions are not considered. The total numbers tracked in each step are
  $18\times 10^{6}$ and
  $49.4\times 10^{6}$ for two particle-laden simulations. Particle-free and particle-laden simulations are compared with DNS and experimental results to examine the reliability of the numerical method and the deployed models. On this basis, the modulation of turbulence statistics and structures by the presence of heavy particles and the underlying dynamical mechanisms are discussed.
The results indicate that the mean particle velocity is lower than the fluid velocity except in the immediate vicinity of the bed ( $y^{+}<3$), therefore leading to a decrease of the mean streamwise fluid velocity owing to the particle drag. The turbulence intensities and Reynolds stress are significantly augmented in the outer layer by the presence of heavy particles. We also report several new findings as follows. First, the streamwise turbulence intensity and Reynolds stress are evidently attenuated whereas the spanwise and vertical turbulence intensities are slightly augmented in the near-bed region. Second, the spanwise and streamwise correlation sizes of the turbulence structures decrease in the outer layer but increase in the near-bed region and finally, the streamwise turbulent kinetic energy is increased in a wide range of wavelengths in spectral space.
We proposed the ‘splashing effect’ of turbulence modulation by heavy particles over an erodible bed through analysing the Reynolds stress budget and conditionally sampled flow field. That is, the range and degree of turbulence enhancement by ascending particles in the near-bed region are much larger than the turbulence attenuation by descending particles, which leads to the enhancement of  $\langle u'^{+}_2u'^{+}_2 \rangle ^{1/2}$ and
  $\langle u'^{+}_3u'^{+}_3 \rangle ^{1/2}$ and the suppression of
  $\langle u'^{+}_1u'^{+}_1 \rangle ^{1/2}$ owing to the redistribution of the turbulent kinetic energy from the streamwise to the vertical and spanwise directions. Meanwhile, the saltating particles form randomly distributed, active roughness elements seen by the outer fluid, which results in the transfer of the turbulent kinetic energy from the inner to the outer layer in a particle-laden flow. This enhances not only the second-order statistics but also the streamwise turbulent kinetic energy from medium to large wavelengths in the outer region. In a statistical sense, the settling and splashing process of heavy particles form the mean high-concentration region and cuts off the mean outer turbulent structure. This is the reason why LSMs/VLSMs are reduced in size.
Owing to the limit of the computational cost, splashing models are used in the simulations of the particle-laden flows. The shear-driven lift force (Barati, Neyshabouri & Ahmadi Reference Barati, Neyshabouri and Ahmadi2019) may be very influential in the flow because of the sharp gradients near the bed. The grid resolution of LES is inadequate in the near-surface region. The effect of particle–particle collisions is potentially important, especially for high mean shear stress and in the regions of particle accumulation, and therefore should be the subject of further research. In addition, sand transport in reality may occur in the wave bottom boundary resulting from aeolian sand ripple under certain conditions (Zheng Reference Zheng2009). All these effects deserve to be studied further. With the increase of computing power in the future, it is necessary to rely on numerical approaches that allow for full resolution of particles and the bed, rather than approaches that require significant modelling.
Funding
This research is supported by National Natural Science Foundation of China (no. 92052202, 12072138) and National Numerical Wind Tunnel project.
Declaration of interests
The authors report no conflict of interest.


