


1 Introduction
In bubbly flows, hydrodynamical interactions modify transfer of mass, momentum and energy at the bubbles’ surface. They may also lead to self-induced clustering, and may promote coalescence thus varying bubble size distribution. Several questions related to the interaction of two bubbles consequently emerge: in which conditions do two bubbles attract or repel each other, and why? Does a relative equilibrium position exist? What are the rates of separation or of attraction? Can a drift be observed? What is the role of bubble deformation during interaction? What are the kinematical conditions driving coalescence? These questions stimulated intense research, essentially devoted to the identification of basic mechanisms for Reynolds numbers varying from viscous to potential flow. However, most studies were limited to quasi-static configurations where the induced flow was stable.
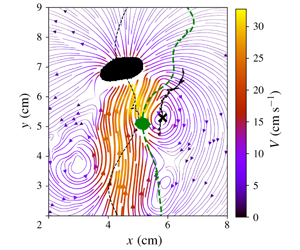
In seminal contributions, Kok (Reference Kok1993a) and van Wijngaarden (Reference van Wijngaarden1993) developed a theoretical analysis in the irrotational flow approximation of the interaction of two identical spherical bubbles free to move. In particular, Kok (Reference Kok1993a) obtained inertial Lagrange equations for the motion of the centre of mass of the bubbles from the velocity potential for two spheres moving in an unbounded perfect fluid. This model included drag forces derived from the rate of viscous dissipation in the irrotational flow. It highlighted that, when the line between the centres of the bubbles makes an angle  $\unicode[STIX]{x1D703}$ with respect to the vertical direction in the range
  $\unicode[STIX]{x1D703}_{c}<\unicode[STIX]{x1D703}<180^{\circ }-\unicode[STIX]{x1D703}_{c}$ where
  $\unicode[STIX]{x1D703}_{c}$ is a critical angle, the bubbles attract each other, whereas they repel one another when nearer to in-line alignment. The angle
  $\unicode[STIX]{x1D703}_{c}$ varies with the separation distance of the bubbles between
  $35^{\circ }$, when they are in contact, and
  $54^{\circ }$ when they are far away. A small drift of the centre of mass was also shown to be possible, depending on the ascending bubbles relative orientation, in relation with the variation of added mass coefficients during interaction. Well-controlled experiments were performed in this asymptotic regime and proved, in particular, that bubbles always rotate towards a cross-stream orientation of the line joining their centres of mass (Kok Reference Kok1993b) as predicted by the model. The characteristic time for this relative motion was, however, underestimated by the theory and moderate bubble deformation was put forward as a possible reason for the difference. At the same time, van Wijngaarden (Reference van Wijngaarden1993) showed that a pair of rising bubbles tends to adopt a stable position when they come to contact in the side-by-side configuration.
Direct numerical simulations (DNS) were necessary to clearly describe the forces acting on a pair of inertial spherical bubbles because at large, but finite, Reynolds numbers the assumption of irrotational flow is no longer relevant. The role of vorticity generated at the bubble surface, transported and diffused in the wake, was proved to be essential in understanding dynamical behaviours of bubbles (Mougin & Magnaudet Reference Mougin and Magnaudet2001, Reference Mougin and Magnaudet2006). Direct numerical simulations considered fixed pairs of bubbles of spherical shapes with stable flows, either in-line (Yuan & Prosperetti Reference Yuan and Prosperetti1994), side-by-side (Legendre, Magnaudet & Mougin Reference Legendre, Magnaudet and Mougin2003) or in more general relative positioning (Hallez & Legendre Reference Hallez and Legendre2011). Yuan & Prosperetti (Reference Yuan and Prosperetti1994) performed DNS for two bubbles positioned in-line for moderate Reynolds number (around 200). They showed that a position of equilibrium between the two bubbles exists and corresponds to a vertical alignment with a separation distance that depends on the Reynolds number. This equilibrium results from the balance between an attractive effect associated with the vertical entrainment of the trailing bubble in the wake of the leading one and the inertial repulsion predicted by potential flow theory. In the case of bubbles positioned side-by-side and separated by a normalized distance  $S$, Legendre et al. (Reference Legendre, Magnaudet and Mougin2003) showed that for Reynolds numbers larger than a critical value,
  $Re_{c}(S)$, that depends on the separation distance, attraction takes place in agreement with the asymptotic behaviour predicted by potential theory that consists of a Venturi-like effect. Below
  $Re_{c}(S)$, the repulsive effect of the vortical flow generated by the bubbles dominates, and bubbles repel one another. The key point for this change of behaviour is associated with the spreading of vorticity generated at the bubble surface. When vorticity remains confined in a boundary layer of thickness smaller than the distance between the two bubbles, the interaction is dominated by the irrotational mechanism that results in an attractive transverse force. In contrast, when viscous effects are sufficiently large, the vorticity field about each bubble interacts with that existing about the other bubble, resulting in a repulsive transverse force. The intensity of the attraction is weaker than predicted by potential flow, in particular at small distances, so that the finite Reynolds number could explain the slowness of the motion towards equilibrium registered in the experiments of Kok (Reference Kok1993b). Hallez & Legendre (Reference Hallez and Legendre2011) further determined the forces exerted on fixed bubble pairs in more general conditions where the separation distance, the angular positioning of the bubbles and the Reynolds number are varied. They provided extended scaling laws of the drag and lift coefficients for both bubbles. These laws reproduce the combined contributions of the potential flow, of its viscous correction adapted from Harper (Reference Harper1997) when bubbles are close together, and of the rotational flow due to the diffusive development of the wake. They also described repulsion and attraction as well as drift conditions, and found that the only stable position for a pair of spherical bubbles corresponds to the side-by-side configuration due to the strong effect of the wake that destabilizes in-line positioning.
In parallel, the existence of an equilibrium position was debated by experiments. Katz & Meneveau (Reference Katz and Meneveau1996) considered a train of spherical rising bubbles with steady wakes when they are isolated ( $Re\leqslant$ 35), and showed that, in any case, bubbles were attracted. The origin of the discrepancy between their experimental observation and the simulations of Yuan & Prosperetti (Reference Yuan and Prosperetti1994) motivated further experimental research. In particular, Duineveld (Reference Duineveld1998) investigated the relative motions of two high-
 $Re$ bubbles when they come close together and explored bouncing and coalescence conditions, using ultra-pure water or dilute solutions of surfactants. The difference in behaviour due to a tiny amount of electrolyte in the solution of Katz & Meneveau (Reference Katz and Meneveau1996) was suggested as a plausible explanation for the absence of equilibrium positions in their experiments. As surfactants accumulate and rigidify a small surface cap at the rear of the bubbles, their presence is expected to enforce the wake attractive effect with respect to the repulsive potential effect. Sanada, Watanabe & Fukano (Reference Sanada, Watanabe and Fukano2006) performed remarkably controlled experiments in silicon oil on interactions of bubbles rising in-line with stable wakes for
  $Re\leqslant 54$. They confirmed in this case the existence of an equilibrium distance for bubbles rising in line, but found a larger value than predicted by Yuan & Prosperetti (Reference Yuan and Prosperetti1994). They observed, moreover, that this distance is sensitive to the initial release distance of the bubbles, revealing the importance of the approach period. They also noticed that, at larger Reynolds numbers (
 $Re=145$) still corresponding to a stationary wake, the relative equilibrium was less stable than predicted by numerical simulations for fixed spheres, the trailing bubble escaping the in-line positioning while strongly deforming. A comparison with axisymmetric numerical simulations taking into account bubble deformation further indicated that deformation cannot explain the deviation between experimental and numerical predictions of the equilibrium distance for intermediate Reynolds numbers (lower than 150) (Watanabe & Sanada Reference Watanabe and Sanada2006). Kusuno & Sanada (Reference Kusuno and Sanada2015) performed experiments to check the validity range of the numerical results by Hallez & Legendre (Reference Hallez and Legendre2011). A focus was provided on the transverse motion for high-
 $Re$ bubbles (up to
  $Re=300$) initially released in-line, associated with the escape of the trailing bubble from the wake of the leading one, leading further to various types of interactions classified as separation, approach, coalescence and overtaking. From the kinematics and a model for the added mass and mean drag forces based on the isolated bubble laws, forces specifically introduced by the interaction were determined. A comparison of the azimuthal distribution of their averaged values with the relations provided by Hallez & Legendre (Reference Hallez and Legendre2011) was then proposed, yielding consistent results. The effect of the separation distance on force values was, however, not reported, and a question still remains about the respective contributions to the average values of the forces exerted by the steady wake of the leading bubble and by its released vortices possibly occurring for some explored Reynolds numbers. Sanada and co-workers also investigated experimentally the interaction between two ellipsoidal high-
 $Re$ bubbles rising side-by-side in a quiescent liquid. In the continuity of the work by Duineveld (Reference Duineveld1998), they provided qualitative evidence of the coupled roles of shape oscillations and intensity of the relative velocity of the bubbles in the determination of the bouncing or coalescence behaviours at contact, coalescence being favoured for low velocities before contact (Sanada et al. Reference Sanada, Watanabe and Fukano2006). Sanada et al. (Reference Sanada, Sato, Shirota and Watanabe2009) further explored for various liquids a criteria based on the Weber number for the transition from coalescence to bouncing. Three remarkable relative trajectories also observed by Duineveld (Reference Duineveld1998) were highlighted: an approach leading to the coalescence of the two bubbles, a simple bounce or a series of periodic bouncing, the last two behaviours being observed for bubbles with an unstable wake. They pointed out the successive phases of bouncing corresponding to rapid self-induced motions due to vortex release associated with distortion of the flow in-between the bubbles, and slower modifications of the bubbles’ motion when they are farther away. While DNS of pairs of high-
 $Re$ spherical bubbles highlighted generic mechanisms involved in hydrodynamical interactions, they were mainly limited to stationary flows and to fixed non-deformable bubbles, hence relying on a quasi-static approximation for the extrapolation to freely moving bubbles. In parallel, remarkable experiments facing bubbles’ injection and interface contamination difficulties, addressed more realistic configurations, but could not access the liquid flow field that drives the bubbles’ behaviour. Now, in the range of high-
 $Re$ bubbles, widespread realistic flow configurations involve deformable bubbles with unstable wakes. Such complexities are not easy to take into account to study interactions, yet they are expected to contribute significantly to them. While progress has been achieved in numerical simulations to handle them (Smolianski, Haari & Luukka Reference Smolianski, Haari and Luukka2005; Cheng, Hua & Lou Reference Cheng, Hua and Lou2010; Chen et al. Reference Chen, Tian, Su, Qiu, Ishiwatari and Oka2010; Yu, Yang & Fan Reference Yu, Yang and Fan2011; Gumulya et al. Reference Gumulya, Utikar, Evans, Joshi and Pareek2017; Tripathi et al. Reference Tripathi, Premlata, Sahu and Govindarajan2017), it remains that a conceptual global framework aiming at capturing generic mechanisms during the interaction of two unstable bubbles, free to move and deform, is still lacking. Studying the interaction between two freely rising bubbles which exhibit oscillatory motion and develop a complex wake when isolated is a very challenging problem. Interaction of oscillating bubbles is the result of competing unsteady mechanisms, the effects and the controlling parameters of which are difficult to classify and have not been studied so far. The leading bubble may drag a closed wake and an unstable open wake consisting of a slowly varying upward mean flow and of rapidly evolving released vortices. The trailing bubble will thus react differently depending on the temporal sequence during which it enters this unsteady flow, depending also on the temporal phase of its own vortex releases that exert supplementary unsteady loads on it. The bubbles may, moreover, deform and change their orientation during interaction.
Despite the complexity of the problem, an experimental approach is proposed in the present study focusing on the interaction of confined oscillating high- $Re$ bubbles. The confinement imposes an in-plane motion of the bubbles, limits their shape deformation to in-plane ones and strongly controls the perturbation generated around the bubbles in the liquid phase. The interaction is, however, complex as bubbles are deformable and free to move, and have an unsteady wake with periodic release of vortices (Roig et al. Reference Roig, Roudet, Risso and Billet2012; Filella, Ern & Roig Reference Filella, Ern and Roig2015). Furthermore, thanks to the confined-cell configuration, access to the liquid velocity field surrounding the bubbles is possible through volumetric time-resolved particle image velocimetry. We can thus analyse in this configuration the kinematics of the bubbles during their interaction in relation with the liquid flow field induced by their motion and governing their behaviour. We investigate in particular how the kinematics of a bubble, already submitted to the intrinsic instability of its path and wake, is modified by the interaction, i.e. by the presence of a liquid flow field generated by the companion bubble. Two main effects are highlighted: a slowly varying vertical entrainment of the trailing bubble due to the ascending flow generated by the leading bubble and to its spatial evolution; and localized horizontal motions induced by the vortices released by a leading bubble on a bubble in line or in oblique positioning. In turn, we analyse the effect of a bubble’s passage on the liquid flow field generated by the companion bubble, highlighting the reinforcement or destruction of vortices. We show in particular that this can occur without a significant impact on the bubble kinematics. As the analysis is built on the knowledge of the behaviour of isolated bubbles, which is used both for comparison to characterize the effect of the interaction as well as for modelling purposes, the next section recalls the major results concerning isolated confined bubbles, after a presentation of the experimental set-up and of the measuring techniques.
2 Experimental conditions and preliminary considerations
2.1 Experimental techniques
We consider the hydrodynamical interaction of two bubbles injected at the bottom of a vertical planar thin-gap cell filled with distilled water at rest. The glass cell dimensions ( $40~\text{cm}\times 80~\text{cm}\times 3.1~\text{mm}$) impose a strong flattening of the bubbles that have a typical size always greater than the gap width
  $h=3.1\pm 0.2~\text{mm}$. As
  $h$ is approximately the capillary length, the main deformation of the bubbles is an in-plane one. No dewetting at the glass walls was observed so that a thin liquid film always exists between the bubbles and the walls. Changing the distilled water regularly, we did not observe any change in the kinematics of the isolated bubble. As indicated in Roig et al. (Reference Roig, Roudet, Risso and Billet2012), negligible contamination of the bubble surface is assumed, as the liquid films do not contribute to the scaling law of the terminal velocity. Moreover, inspection of the few tracers that could be followed in the films indicate they had a zero velocity. The confinement also induces a planar motion of the bubbles and favours hydrodynamical interactions. The flow generated in the liquid phase, far enough from the curved interfaces, is also planar and has been characterized by the velocity averaged through the gap
  $\langle \boldsymbol{u}\rangle (x,y,t)=\langle u_{x}\rangle \boldsymbol{e}_{\boldsymbol{x}}+\langle u_{y}\rangle \boldsymbol{e}_{\boldsymbol{y}}$. Experiments were performed with two air bubbles injected at the bottom of the cell either from the same capillary tube or from two different ones separated in the horizontal direction by a distance varying up to 2 cm. Several trials of injection systems proved that injection made by hand with Hamilton syringes and capillary tubes was technically feasible and efficient. The volume of the bubbles at injection is however determined afterwards from the bubble images. As shown in figure 1(a), the leading bubble B1 corresponds to the first bubble entering the field of observation and the second bubble B2 always corresponds to the trailing bubble. The bubbles are separated by a horizontal (respectively, vertical) distance denoted
  $\unicode[STIX]{x0394}x(t)=x_{1}(t)-x_{2}(t)$ (respectively,
  $\unicode[STIX]{x0394}y(t)=y_{1}(t)-y_{2}(t)$), where
  $x_{i}(t)$ and
  $y_{i}(t)$ denote the centre of mass coordinates of bubble B
 $i$,
$i$,  $i\in \{1,2\}$.

Figure 1. (a) Sketch of the studied configuration. (b) Cartography in the  $(Ar_{1},Ar_{2})$ plane of the investigated runs of interacting bubbles; small open (filled grey) circles correspond to shadowgraphy (particle image velocimetry) measurements.
As the physical properties of the fluids were not varied, the interaction experiments are mainly characterized by the Archimedes numbers  $Ar_{i}=\sqrt{gd_{i}^{3}}/\unicode[STIX]{x1D708}$ of both bubbles, where
  $d_{i}$ is the equivalent diameter of bubble
  $i$ defined from the bubble in-plane projected area
  ${\mathcal{A}}_{i}$ by
  $d_{i}=\sqrt{4{\mathcal{A}}_{i}/\unicode[STIX]{x03C0}}$,
  $g$ is the gravitational acceleration and
  $\unicode[STIX]{x1D708}$ is the kinematic viscosity of water. The pairs of Archimedes numbers (
 $Ar_{1},Ar_{2}$) considered are plotted in figure 1(b). They spread over a large range, typically (500–5000), for which different regimes of oscillating bubble motions are observed in the case of single bubbles (Filella et al. Reference Filella, Ern and Roig2015). Most of the interactions observed here involve a leading bubble B1 larger than the trailing bubble B2, but some runs involve a smaller leading bubble. Except in one case, we will discuss runs with Archimedes numbers greater than 800. In such cases, the bubble has a diameter varying between 4 and 14 mm, which is large enough to avoid its motion and deformation inside the gap. The Bond number
  $Bo_{i}=\unicode[STIX]{x1D70C}gd_{i}^{2}/\unicode[STIX]{x1D70E}$ (
 $\unicode[STIX]{x1D70C}$ and
  $\unicode[STIX]{x1D70E}$ being the density of water and the surface tension) increases with the bubble size in the range (2–25) (the Weber number increases from 1 to 9), and the confinement ratio
  $\unicode[STIX]{x1D6E4}_{i}=h/d_{i}$ decreases from
  $0.7$ to
  $0.2$. These parameters are not independent of
  $Ar_{i}$ as we vary the size of the bubbles.
The experimental techniques used to describe the bubbles’ motions and the velocity in the liquid phase  $\langle \boldsymbol{u}\rangle (x,y,t)$ are those presented in Filella et al. (Reference Filella, Ern and Roig2015), but some values indicated here are corrected. Two high-speed cameras are combined to observe the bubbles’ kinematics during interaction on a large field of view and, for specific cases, to perform velocity measurements in both phases simultaneously on a smaller region. Using information from two cameras, bubble kinematics are recorded in a window of observation of dimensions 11 cm and 30 cm in
  $x$-horizontal and
  $y$-vertical directions, and located at approximately 20 cm from the injection. A PCO dimax camera is used for time-resolved particle image velocimetry (TR PIV) and images a
  $121~\text{cm}^{2}$ field of view. It is synchronized with a
  $2\times 20~\text{mJ}$ Darwin laser emitting 527 nm light at 1 kHz. Poly(methyl methacrylate)-encapsulated particles of rhodamine B, whose fluorescence is maximum at
  $580$ nm, are used as tracers. The camera is equipped with a low-pass filter with a cutoff wavelength of 600 nm, and a high-pass filter with a cutoff of
  $540$ nm in order to avoid laser reflections on the bubble surface. From the images provided by this camera it was possible to perform PIV measurements and to track the bubbles simultaneously. In order to follow the bubbles’ motion over a longer distance of approximately
  $30~\text{cm}$, a second camera (Photron RS 3000) is located at the top of the first one with an overlap region of approximately 1 cm. To track the bubble motion in this region, the cell is uniformly illuminated with a red backlight (with light around
  $625\pm 15$ nm). A high-pass filter with a cutoff frequency of
  $600$ nm is placed in front of the second camera to avoid reflections of laser light or tracer emission on the images devoted only to bubble tracking. Due to heavy data storage and processing, PIV measurements were mainly restricted to
  $Ar_{2}$ lower or equal to
  $1000$, as can be seen in figure 1(b), while shadowgraphy experiments were carried out for a larger range of pairs
  $(Ar_{1},Ar_{2})$.

Figure 2. Illustration of the liquid velocity around a single bubble at  $Ar=4380$. (a) Potential flow in front of the bubble; comparison between the velocity field measured by PIV around a single bubble (red arrows) with the potential flow around the blue circle of radius
  $r=d\sqrt{\unicode[STIX]{x1D712}}/2$ centred in
  $y-y_{b}=d/(2\sqrt{\unicode[STIX]{x1D712}})-r$ (black arrows). (b) Comparison between the vertical velocity profiles along the vertical direction measured by PIV and predicted by potential flow at
  $x=x_{b}$. (c) Streamlines in the wake behind a single bubble obtained by PIV measurements; the dashed grey line corresponds to the path of the bubble. The crosses correspond to the centres of the vortices present in the velocity field at the time of measurement. The black (respectively, blue) line indicates the path of a vortex released in (respectively, just before the bubble entered) the measurement window. Thick lines show the paths of the two vortices remaining after vortex pairing. (d) Transverse profiles of the normalized longitudinal velocity in the wake of the bubble; dots: PIV measurements of either the vertical component
  $V_{y}$ or of the norm
  $V$ (normalized with their maximum values); blue line: Gaussian profile
  $U_{f1\infty }/V_{max}$ from (2.3) and (2.4).
We performed 233 experimental runs for which the trajectories of the bubbles were recorded. A percentage of around 75 % of the observations showed a relative motion of the bubbles ending up in close positions. For 31 % of the tests we observed that, after entry and entrainment in the wake of the leading bubble, the trailing one finally was ejected from the wake and eventually bypassed the leading one. Coalescence was the ultimate result of observed interactions for 44 % of the cases. Bubbles have fewer degrees of freedom to move far from each other than in unconfined geometry. They can only bypass each other in the cell plane. Coalescence is thus undoubtedly favoured by this configuration. The investigation of coalescence is, however, not within the scope of the present paper, as the ultimate stage of liquid film drainage would require a specific investigation with a much higher sampling frequency.
2.2 Salient properties of the flow induced by isolated confined bubbles rising at moderate to high Reynolds numbers in a fluid at rest
The kinematics of isolated bubbles and the velocity perturbations induced by the bubble motion in the liquid phase are useful ingredients to discuss bubble interaction for similar  $Ar$. The motion and wake of confined inertial isolated bubbles have been precisely characterized in previous research (Filella et al. Reference Filella, Ern and Roig2015), in particular their mean velocity
  $V_{b}$, the amplitudes and frequency of their sinusoidal motions and deformations. In the explored range of Archimedes numbers, bubble mean shape is ellipsoidal for smaller
  $Ar$ and loses the fore–aft symmetry for the largest
  $Ar$; for intermediate values of
  $Ar$, the bubble displays a sinusoidal path with more or less pronounced shape oscillations. Their orientation angle relative to the vertical direction also oscillates (amplitude
  $\unicode[STIX]{x1D6FD}_{n}$). Mean shape can be characterized by the aspect ratio
  $\unicode[STIX]{x1D712}$ defined as the ratio between major and minor axes of the equivalent ellipse. More specifically, for Archimedes numbers from 1800 to 5000, scaling laws describing the bubble motion were provided in Filella et al. (Reference Filella, Ern and Roig2015) showing a strong coupling between the mean deformation of the bubble and the characteristics of its oscillatory motion: the mean vertical velocity scales as
  $V_{b}\approx 0.75(h/d)^{1/6}\sqrt{gd}$, the aspect ratio can be estimated by
  $\unicode[STIX]{x1D712}\simeq 1.12\,We^{1/2}$ where
  $We=\unicode[STIX]{x1D70C}V_{b}^{2}d/\unicode[STIX]{x1D70E}$ is the Weber number; the frequency of the oscillations is provided by
  $St=f\,d/V_{b}\approx 0.09\unicode[STIX]{x1D712}$, the amplitude of the rotation rate by
  $2\unicode[STIX]{x03C0}f\,\unicode[STIX]{x1D6FD}_{n}\,d/V_{b}\approx 0.75$ and amplitudes of the oscillatory motion may be retrieved from figures 5(b) and 7 in Filella et al. (Reference Filella, Ern and Roig2015).
Knowledge of liquid velocity about a freely rising isolated bubble is also useful in discussing bubble interaction. We may consider that this velocity field includes a potential flow region preceding the bubble and an unstable wake behind it. Particle image velocimetry measurements showed that the velocity field at the front can be modelled in a first approximation as the potential flow around a circular bubble with a radius  $r$ equal to half of the major axis
  $d\sqrt{\unicode[STIX]{x1D712}}/2$ moving at the mean velocity
  $V_{b}$ and centred at position
  $O_{C}$ (
 $x_{b}$,
  $y_{b}-r+d/(2\sqrt{\unicode[STIX]{x1D712}})$) where (
 $x_{b},y_{b}$) are the coordinates of the centre of mass of the bubble. This is illustrated in figure 2(a) for
  $Ar=4380$. We therefore consider that in the region in front of the bubble, the flow can be described in the coordinate system (
 $O_{C},x^{\prime },y^{\prime }$) moving with the circle by
 $$\begin{eqnarray}\displaystyle & \displaystyle u_{PF}={\displaystyle \frac{2V_{b}r^{2}x^{\prime }y^{\prime }}{({x^{\prime }}^{2}+{y^{\prime }}^{2})^{2}}}, & \displaystyle\end{eqnarray}$$
 $$\begin{eqnarray}\displaystyle & \displaystyle v_{PF}={\displaystyle \frac{V_{b}r^{2}({y^{\prime }}^{2}-{x^{\prime }}^{2})}{({x^{\prime }}^{2}+{y^{\prime }}^{2})^{2}}}. & \displaystyle\end{eqnarray}$$
 A comparison between the vertical velocity profile along the vertical direction at  $x=x_{b}$ obtained by PIV and with relation (2.2) is provided in figure 2(b).
For a better understanding of the wake dynamics of these oscillating single bubbles, an instantaneous velocity field behind the same bubble is presented in figure 2(c). The path of the bubble is shown with a grey dashed line and its area is shown in black for the bubble location at the time of PIV measurement and in grey at previous times along the path. This figure illustrates the oscillations of the path, of the inclination and of the shape of the bubble. Looking at the velocity field in the wake of the bubble, we can notice the intense ascending flux centred behind the bubble. It is, however, rapidly dampened due to the confinement that imposes large shear stresses at the walls. The strength of this ascending flow and its spatial evolution will be used in § 3 to quantify the vertical entrainment effect experienced by bubbles rising in line. Vortices periodically released in the wake are the other important feature of the flow perturbation induced by these oscillating bubbles. They can be expected to induce strong local perturbations on the path of an interacting bubble, as investigated in § 4. A detailed characterization of both the ascending flow and the vortices generated by an isolated bubble was provided by Filella et al. (Reference Filella, Ern and Roig2015). The ascending flow was characterized by determining, at each vertical position of the measurement window, the maximal value of the norm of the liquid velocity, as well as the corresponding inclination and horizontal coordinate. An average value  $V_{max}$ that depends on the distance to the bubble was then defined by averaging the values obtained at different times and different vertical positions. At a vertical distance
  $\unicode[STIX]{x1D6FF}y$ from the bubble, the velocity
  $V_{max}$ in the wake of a confined isolated bubble can be estimated with the relation
 $$\begin{eqnarray}V_{max}\left(\unicode[STIX]{x1D6FF}y\right)=\left\{\begin{array}{@{}ll@{}}\sqrt{gd}\exp \left(-0.6{\displaystyle \frac{\unicode[STIX]{x1D6FF}y}{V_{b}T_{x}}}\right)\quad & \text{if}~\unicode[STIX]{x1D6FF}y\leqslant 3T_{x}V_{b},\\[10.0pt] \sqrt{gd}\exp \left(-1.8-2.5\left({\displaystyle \frac{\unicode[STIX]{x1D6FF}y-3T_{x}V_{b}}{V_{b}\unicode[STIX]{x1D70F}_{\unicode[STIX]{x1D708}}}}\right)\right)\quad & \text{otherwise,}\end{array}\right.\end{eqnarray}$$
 where  $T_{x}=1/f$ is the period of the oscillation, and
  $\unicode[STIX]{x1D70F}_{\unicode[STIX]{x1D708}}=h^{2}/(4\unicode[STIX]{x1D708})$ the viscous time (Filella et al. Reference Filella, Ern and Roig2015). Note that this relation reproduces the contrast of decrease in magnitude of the flow perturbation induced by the bubble between the very first periods of oscillation corresponding to liquid velocities in a region close to the bubble, and larger times corresponding to positions further away from the bubble, for which shear stress at the wall has become predominant. In the latter region, temporal oscillations have been dampened and the remaining nearly frozen spatial oscillation is filtered out in the spatial reconstruction and averaging used for the definition of velocity
  $V_{max}\left(\unicode[STIX]{x1D6FF}y\right)$. Near the bubble, the wake pattern is transported at the bubble velocity and the strength of
  $V_{max}\left(\unicode[STIX]{x1D6FF}y\right)$ is influenced by the vortex formation and release associated with the oscillatory motion. Furthermore, the wake of the isolated bubble is characterized by negligible in-plane momentum diffusion. Horizontal profiles of the vertical velocity are plotted in figure 2(d) at several positions downstream in the wake. They gather on a unique curve when normalized by
  $V_{max}$ showing that attenuation of momentum is not due to diffusion. As a first approximation, for further modelling purposes, these profiles may be fitted by a Gaussian curve with a characteristic width
  $1.1d$. In the range of explored Archimedes numbers, the vertical velocity in the wake of a bubble
  $U_{f1\infty }(\unicode[STIX]{x1D6FF}y,x)$ at a vertical distance
  $\unicode[STIX]{x1D6FF}y$ from it, can thus be approximated by
 $$\begin{eqnarray}U_{f1\infty }(\unicode[STIX]{x1D6FF}y,x)\approx 0.9V_{max}(\unicode[STIX]{x1D6FF}y)\exp \left(-\left({\displaystyle \frac{x}{1.1d}}\right)^{2}\right).\end{eqnarray}$$
 In figure 2(c) we indicate by black crosses the centres of three vortices at the time of PIV measurement corresponding to the release of the upper left vortex. Filella et al. (Reference Filella, Ern and Roig2015) achieved, for  $1800\leqslant Ar\leqslant 4000$, a detailed description of the temporal evolution of the vortices. Vorticity at release can be estimated by
  $\unicode[STIX]{x1D6FA}_{0}\approx V_{b}\unicode[STIX]{x1D712}^{3/2}d^{-1}$, and the distance of the vortex centre to the bubble centre of gravity is around one diameter. The time of release along the bubble path appears to correspond to a maximum transverse velocity of the bubble. The temporal evolution of the periodic array of vortices has also been characterized and shows generic behaviours. In particular, vorticity decreases rapidly in approximately one to two periods
  $T_{x}$ during which vortices move outward of the wake and in the upward direction. For this time period, the generic decrease in time from the instant of release
  $t_{0}$ of the vorticity can be fitted by the following law:
 $$\begin{eqnarray}\unicode[STIX]{x1D6FA}(t)=\unicode[STIX]{x1D6FA}_{0}\exp \left(-0.6{\displaystyle \frac{(t-t_{0})}{T_{x}}}\right).\end{eqnarray}$$
 Then, in the approximate time interval from  $2T_{x}$ to
  $5T_{x}$ the vortex street undergoes a strong rearrangement in which vortex pairing occurs, so that, at larger times the wake consists in a periodic array with a wavelength equal to twice the initial one. In this region of the wake, that can be termed far wake, the vortices stand rather at the same place and their vorticity as well as the near-standing liquid motions decay exponentially due to friction at the walls. In the far wake, vortices look like inclined ellipses with their major axis parallel to the
  $V_{max}$ line having a length
  $D_{//}$ that is around one wavelength
  $\unicode[STIX]{x1D706}_{w}=V_{b}/T_{x}$, while the length of their minor axis is
  $D_{\bot }\approx 2.5d$. This structure of the far wake is illustrated in figure 11 of Filella et al. (Reference Filella, Ern and Roig2015).
Discussion of the interactions between two bubbles will thus be based on observations of their relative trajectories, with special attention to cases that were explored with simultaneous measurements of the velocity in the liquid phase. The analysis will recurrently be based on the knowledge of the salient features of the kinematics and wakes of isolated bubbles rising in a confined cell and will be developed along two lines. In the first one, the entrainment effect associated with the strong ascending flow generated by the leading bubble will be quantified and modelled (§ 3). In the second, the effect of the vortices shed by the leading bubble will be associated with the significant horizontal deviations experienced by the trailing bubble, giving rise to ejections or re-alignment of the trailing bubble in the wake of the leading bubble (§ 4). In turn, the effect of a second bubble passing through a vortex street will be discussed, and the phenomena of vortex destruction or reinforcement will be outlined (§ 5).
3 Vertical entrainment of interacting bubbles
3.1 Kinematics of bubbles rising in line
Considering two bubbles vertically aligned, when the trailing bubble is trapped in the ascending flux generated by the leading one, it experiences a vertical entrainment which can lead to the coalescence or to the lateral separation of the two bubbles. In a confined geometry, this has been observed by Hosokawa & Tomiyama (Reference Hosokawa and Tomiyama2006) and Huisman, Ern & Roig (Reference Huisman, Ern and Roig2012). Well-known experiments on hemispherical cap bubble pairs rising in-line at moderate Reynolds numbers ( $10<Re<90$) and high Morton number showed that the axial acceleration of the trailing bubble can be related to the velocity in the viscous laminar wake of the leading bubble (Crabtree & Bridgwater Reference Crabtree and Bridgwater1971; Narayanan, Goosens & Kossen Reference Narayanan, Goosens and Kossen1974; Bhaga & Weber Reference Bhaga and Weber1980; Komasawa, Otake & Kamojima Reference Komasawa, Otake and Kamojima1980; Katz & Meneveau Reference Katz and Meneveau1996). The proposed models, based on the asymptotic velocity induced by the leading bubble on the axis of its laminar wake, over-predicted the observed velocity of the trailing bubble. The sensitivity of the rate of entrainment to the diameter of the trailing bubble was observed but, however, not clearly captured. The effect of relative sizes on entrainment for two bodies interacting in tandem was since clarified as related not only to pressure repulsion due to potential flow but also to the transverse inhomogeneity of the wake of the leading body (Brosse & Ern Reference Brosse and Ern2014). Bhaga & Weber (Reference Bhaga and Weber1980) and Komasawa et al. (Reference Komasawa, Otake and Kamojima1980) also reported some unstable paths of the leading bubble in the transitional wake regime (
 $90<Re<250$) or in the turbulent one (
 $Re>500$) due to vortex shedding, and noticed the related erratic motions of the trailing bubble that could adopt helix-like paths and break before reaching the leading one. The entrainment rate was considerably reduced in this regime and proved to be efficient only at short distances from the leading one (lower than 5–6 diameters). Observations also indicated that the leading bubble is unaffected by the interaction except for the coalescence stage, and that the trailing one adapts its shape becoming strongly deformed when it enters the closed wake of the leading bubble. Similar observations were reported for hemicylindrical bubbles rising in a thin-gap cell by Huisman et al. (Reference Huisman, Ern and Roig2012), indicating that for large deformable bubbles rising with a steady wake a meaningful cross-comparison between confined and unconfined bubbles can be performed. Considering close interaction of small deformable bubbles, Duineveld (Reference Duineveld1998) pointed out that, just before coalescence, the trailing bubble decelerates due to the pressure increase in the thinning liquid film separating the bubbles, and that the trailing bubble adapts its velocity to that of the leading one. In such very close interactions, the strong shape oscillations of the trailing bubble cannot be ignored during interaction. It must be noticed also that this work pointed out the possible important role of released vorticity in the initialization of repulsion between bubbles after contact.

Figure 3. Vertical entrainment and coalescence of two interacting bubbles with  $Ar_{1}=3820$ and
  $Ar_{2}=1525$. (a) Relative distance between the two bubbles as a function of time. (b) Vertical velocity of the bubbles before and after coalescence. (c) Horizontal velocity of the bubbles. (d) Aspect ratio of the bubbles. Black, green and purple lines and contours correspond to the leading bubble, the trailing bubble and the resulting bubble after coalescence, respectively. The dashed lines correspond to the terminal velocity in (b) and to the aspect ratio in (d), for a single bubble of equivalent size. The continuous coloured lines correspond to average quantities over the recorded time. In figure (d) the limits of the oscillations of the aspect ratio for a single bubble are indicated with dash–dotted segments.
We here present detailed quantitative measurements of the kinematics of two oscillating bubbles during the entrainment process, as well as a model in § 3.2. The phenomenon is illustrated by figure 3 for a pair of bubbles with Archimedes numbers  $Ar_{1}=3820$ and
  $Ar_{2}=1525$, separated by a distance
  $\unicode[STIX]{x0394}y$. Figure 3(a) shows how the second bubble catches up with the leading bubble until they coalesce. Time
  $t=0$ corresponds to the moment the trailing bubble enters the observation window. As time increases, the vertical distance between the two bodies, initially equal to
  $6d_{1}$, decreases while the two bubbles remain mainly vertically aligned during this process. Their relative horizontal position
  $\unicode[STIX]{x0394}x$ oscillates due to the instability of the motions but with an amplitude lower than
  $d_{1}$, which is the transverse extension of the ascending flow in the wake of the leading bubble. They eventually coalesce and a new single bubble is formed. The evolution of the vertical velocity of each bubble is presented in figure 3(b). The terminal velocities,
  $V_{bi\infty }$, of the isolated bubbles having same control parameters are plotted for comparison with dashed lines. The figure shows that the vertical velocity of the leading bubble (in black) is not significantly modified by the interaction. The difference between the terminal velocity,
  $V_{b1\infty }$, and the velocity averaged over the observed sequence (straight continuous line) is in fact negligible. On the other hand, the velocity of the trailing bubble shows a global continuous increase as it comes closer to the leading bubble, eventually reaching values at least twice its terminal velocity,
  $V_{b2\infty }$, in the isolated case. This clearly illustrates the vertical entrainment experienced by the trailing bubble, which is accelerated by the wake of the leading one. In figures 3(c) and 3(d) we can notice that the horizontal velocities and shapes of both bubbles oscillate during the interaction. The leading bubble displays quite regular oscillations of horizontal velocity with amplitudes and frequency similar to the values for an equivalent isolated bubble. But the trailing bubble, even if it keeps velocity oscillations of amplitude similar to that of the isolated case, adopts a more random motion. The frequency of the oscillating path of the isolated bubble of diameter
  $d_{2}$,
  $T_{2x\infty }=0.25~\text{s}$, is still clearly present in the horizontal motion, but complex modulations also appear due to the motion of the bubble across the wake of the leading one. The oscillations of shape of B1 (figure 3d) are similar to those of an isolated bubble of equivalent size. Reciprocally, the hydrodynamical interaction does not produce significant effects that could be quantified on the mean aspect ratio and shape oscillations of B2. It oscillates around an elliptical shape with moderate amplitudes because its Weber number is low (approximately 2). The flow perturbations due to the interaction are probably not strong enough to change drastically the self-induced perturbation governing its shape dynamics. Nevertheless the trailing ellipsoidal bubble is stretched horizontally in the very close wake and eventually adapts its shape and velocity to that of the leading bubble just before coalescence.
The bubble resulting from coalescence adopts kinematics characteristics that are close to those of the equivalent isolated bubble. In figure 3(a–d), the bubble resulting from coalescence has not already recovered precisely its mean stationary shape, neither its terminal velocity. The regime is still a transient one, corresponding to a finite time of observation of approximately 1.5 times its natural period of oscillation.
We reported in figure 3, experimental results in one case where the bubbles stay in line on average within  $\unicode[STIX]{x0394}x/d_{1}\leqslant 1$. In the following discussion of entrainment, we will consider only such cases. Most often the leading bubble is greater than the trailing one, so that the major question to be discussed is that of the intensity of entrainment induced by the wake of the leading bubble. But sometimes
  $Ar_{2}\geqslant Ar_{1}$, and a small acceleration of the leading bubble induced by the flow perturbation generated by the trailing one may also occur when the bubbles come to sufficiently close positions. This effect is therefore also considered in the model.
3.2 Model for entrainment experienced by bubbles rising in line
The wake of the leading bubble B1 is at the origin of the entrainment experienced by bubble B2. In order to model this phenomenon, PIV measurements were carried out during bubble interactions and compared with the wake of the isolated bubble. Figure 4(a) shows an instantaneous velocity field during the interaction of two bubbles with similar Archimedes numbers ( $Ar_{1}=1090$ and
  $Ar_{2}=915$). The line of instantaneous vectors corresponding to the maximum velocity
  $V_{max}$ is also shown on this figure with orange arrows. In the region separating the bubbles, when this velocity is plotted as a function of the distance to the leading bubble (figure 4b), it appears that this unsteady decrease of the wake compares satisfactorily on average with the mean decrease of the velocity
  $V_{max}$ at the rear of an isolated bubble described by relation (2.3). We can thus consider that the characterization by
  $V_{max}$ of the wake of an isolated bubble is representative of the wake generated by the leading bubble and we can adopt relation (2.3) as a model. The flow generated by the trailing bubble leads to an increase of
  $V_{max}$ in a region of limited extension in front of B2. The motion of the trailing bubble also reinforces the ascending flux behind B2 (figure 4b).

Figure 4. Illustration of the liquid velocity field around two bubbles rising in line at  $Ar_{1}=1090$ and
  $Ar_{2}=915$. (a) Velocity field measured by PIV and distribution of
  $V_{max}$ vectors behind the bubbles (orange arrows) (the rectangular region at the top left position is excluded from measurements due to insufficient lighting). (b) Comparison between the spatial decrease of the maximal value of the norm of the velocity measured at a given instant by PIV for the two interacting bubbles (orange curve) and that of
  $V_{max}$ at the rear of a single bubble equivalent to B1 (black curve). The dashed green line indicates the location of the trailing bubble at the time of the PIV measurement.
The velocity of the trailing bubble during entrainment is often assumed to result from a superposition of its terminal velocity in the isolated case with the velocity in the wake of the leading bubble, as considered in the work of Bhaga & Weber (Reference Bhaga and Weber1980) for unconfined spherical cap bubbles. Figure 5(a) shows the overspeed  $V_{b2}-V_{b2\infty }$ for the trailing bubble during several cases of interactions of two bubbles having equivalent sizes (
 $Ar_{1}\approx Ar_{2}\approx 1000$). The velocity difference
  $V_{b2}-V_{b2\infty }$ is normalized by the gravitational velocity
  $\sqrt{gd_{1}}$ of the leading bubble and plotted as a function of the vertical separation distance normalized by the diameter of the first bubble. On figure 5(a) grey dots represent the 33 records performed and the green curve one of them in particular. It shows oscillations with an apparent increase of the wavelength when B2 gets closer to B1. This could be a signature of the self-induced oscillations of the bubble locked at a constant frequency but transported at higher velocity when B2 moves towards B1. The orange curve is proportional to the normalized velocity in the wake of an isolated bubble
  $V_{max}/\sqrt{gd_{1}}$ obtained from relation (2.3), but multiplied by the prefactor
  $\unicode[STIX]{x1D705}=0.65$ to match the overspeed of the trailing bubble. The overspeed can then be written as follows:
 $$\begin{eqnarray}{\displaystyle \frac{V_{b2}-V_{b2\infty }}{\sqrt{gd_{1}}}}=\unicode[STIX]{x1D705}{\displaystyle \frac{V_{max}}{\sqrt{gd_{1}}}},\end{eqnarray}$$
 where  $\unicode[STIX]{x1D705}=0.65$ for
 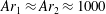 $Ar_{1}\approx Ar_{2}\approx 1000$. On average, with this crude quasi-static approach, the velocity of the trailing bubble can be seen as the sum of its terminal velocity and of a velocity proportional to the maximum velocity in the wake of an isolated bubble equivalent to the leading bubble. However, the mechanism determining the value of
  $\unicode[STIX]{x1D705}$ has to be identified, and generalization of this parameter to other pairs of bubble sizes must be provided. The correcting parameter
  $\unicode[STIX]{x1D705}$, which attenuates the global acceleration as compared to that present in the wake of an isolated bubble, could come partly from an oscillatory horizontal sampling of the wake by the trailing bubble that oscillates in the horizontal direction. An indication of this can be found in some events at zero overspeed on figure 5(a). In fact, with such scenario, the overspeed should oscillate between zero and increasing maxima as the bubbles come closer. But looking at the specific record plotted in green on this figure one can notice that all the oscillations of the overspeed do not behave like this. The amplitude of the vertical overspeed oscillation is of the order of magnitude of that of the oscillatory motion of an isolated bubble. It seems that the bubble moves with an average acceleration linked to the average acceleration in the wake of B1 and oscillations primarily influenced by its intrinsic instability. Such a bubble, even if it shall be centred in the wake, is clearly not entrained at the maximum velocity. The value of
  $\unicode[STIX]{x1D705}$ lower than 1 can thus be related to a filtering effect due to both finite horizontal extension of the wake and trailing bubble size. Figure 5(b) shows in the
  $(Ar_{1},Ar_{2})$ map the location of the various investigated pairs of interacting bubbles presenting a noticeable acceleration phase during vertical entrainment. This is observed over a large range of size of bubbles corresponding to
  $600\leqslant Ar_{i}\leqslant 6000$,
  $i\in \{1,2\}$. For all these sequences, the value for the coefficient
  $\unicode[STIX]{x1D705}$ which best fits the results for the acceleration of the trailing bubble was determined. The values of this coefficient are reported with a colour scale on figure 5(b). In most cases the best value for
  $\unicode[STIX]{x1D705}$ is around 0.7 (yellow dots), but we can remark that when the bubbles’ sizes are significantly different, the
  $\unicode[STIX]{x1D705}$ value is also different. In the case of a leading bubble much larger than the trailing bubble, the entrainment is stronger and
  $\unicode[STIX]{x1D705}\approx 0.9$ (red dots). On the contrary, when the second bubble is larger than the first one, the entrainment is weaker with
  $\unicode[STIX]{x1D705}\approx 0.6$ (white dots). This trend suggests investigating the effect of the ratio between the sizes of the bubbles,
  $d_{1}/d_{2}$, on the rate of vertical entrainment of the trailing bubble. In fact, even if the trailing bubble remains in the central part of the wake, the action of the wake upon the body is better represented by a flow perturbation averaged over the bubble size.

Figure 5. Vertical entrainment of the trailing bubble for  $Ar_{1}\approx Ar_{2}\approx 1000$. (a) Normalized vertical overspeed of the trailing bubble as a function of the vertical distance between the two bubbles. The grey dots correspond to the entrainment phase of 33 sequences measured by shadowgraphy. The green curve corresponds to a PIV sequence. The orange thick line corresponds to the term on the right-hand side of (3.1) with
  $\unicode[STIX]{x1D705}=0.65$ and
  $V_{max}$ taken from a PIV measurement of an equivalent isolated bubble. (b) Values of the coefficient
  $\unicode[STIX]{x1D705}$ for various pairs of bubbles sizes (red:
  $\unicode[STIX]{x1D705}\geqslant 0.85$, yellow:
  $\unicode[STIX]{x1D705}=0.7$ and white:
  $\unicode[STIX]{x1D705}=0.6$). The background colourmap corresponds instead to the prediction using
  $\unicode[STIX]{x1D705}\approx (\sqrt{\unicode[STIX]{x03C0}}d_{1}/2d_{2})\text{erf}(d_{2}/1.1d_{1})$.
Following Brosse & Ern (Reference Brosse and Ern2014), a one-dimensional model is built along the vertical axis  $y$ to predict the vertical velocity of each bubble,
  $V_{1}$ and
  $V_{2}$. In this simplified model, we assume that
(i) the velocity in the wake of the leading bubble has an impact on the vertical velocity of the trailing bubble through a deficit in the drag,
(ii) the spatial evolution of the velocity in the leading bubble wake induces an additional inertial force, and
(iii) the velocity perturbation generated at the front of the trailing bubble induces a deficit in the drag on the leading bubble.
The velocity of the fluid affecting the trailing bubble B2 is generated by bubble B1, and thus denoted  $U_{f1}$. At a given distance
  $\unicode[STIX]{x0394}y$ of the leading bubble, it is taken as the integral of the horizontal profile of the vertical velocity in the wake of the leading bubble over two diameters of the trailing bubble. We found in fact that a general satisfactory prediction is obtained when integrating from
  $x=-d_{2}$ to
  $x=d_{2}$. This extension encompasses the amplitude of horizontal oscillating displacements of the trailing bubble
  $\tilde{X}_{2}$ and its average flatness
  $\unicode[STIX]{x1D712}_{2}$ which can be estimated from the kinematics of an isolated bubble (Filella et al. Reference Filella, Ern and Roig2015). From the amplitude of the horizontal velocity
  $\tilde{V}_{x2}$ and frequency
  $\unicode[STIX]{x1D714}_{2}$ of B2, we get
  $\tilde{X}_{2}=\tilde{V}_{x2}/\unicode[STIX]{x1D714}_{2}$ that is in the range
  $0.3d_{2}$–
 $0.7d_{2}$; the elongation ratio is always between 1 and 2 for the considered bubbles B2. Integrating over two diameters is thus reasonable. Note also that the tortuous instantaneous position of
  $V_{max}(y)$ spans
  $\pm d_{1}$ as a maximum in the horizontal direction, as can be seen in figure 4(a). Selecting bubbles interacting in line with
  $\unicode[STIX]{x0394}x\leqslant d_{1}$ ensures that the trailing bubble is submitted, for a great part of its motion, to entrainment by
  $V_{max}$. Velocity
  $U_{f1}$ is also assumed to instantaneously adapt to the motion of B1 at velocity
  $V_{1}(t)$. It is written as
 $$\begin{eqnarray}U_{f1}(\unicode[STIX]{x0394}y,t)={\displaystyle \frac{V_{1}(t)}{2d_{2}V_{b1\infty }}}\int _{-d_{2}}^{d_{2}}U_{f1\infty }(x,\unicode[STIX]{x0394}y)\,\text{d}x\approx {\displaystyle \frac{\sqrt{\unicode[STIX]{x03C0}}d_{1}}{2d_{2}}}\text{erf}\left({\displaystyle \frac{d_{2}}{1.1d_{1}}}\right){\displaystyle \frac{V_{1}(t)}{V_{b1\infty }}}V_{max}(\unicode[STIX]{x0394}y).\end{eqnarray}$$
 This velocity thus includes an effect of  $d_{1}/d_{2}$ that will affect the rate of entrainment. The velocity in front of the trailing bubble is similarly denoted
  $U_{f2}$ and is assumed to correspond to the vertical potential velocity along the longitudinal profile (equivalent to
  $x^{\prime }=0$ in (2.2)) at a separation distance
  $\unicode[STIX]{x0394}y$. Assuming it instantaneously adapts to the motion of bubble B2 at velocity
  $V_{2}(t)$, it is written as
 $$\begin{eqnarray}U_{f2}(\unicode[STIX]{x0394}y)={\displaystyle \frac{V_{2}(t)\left(d_{2}\sqrt{\unicode[STIX]{x1D712}_{2}}/2\right)^{2}}{\left(\unicode[STIX]{x0394}y+d_{2}\sqrt{\unicode[STIX]{x1D712}_{2}}/2-d_{2}/(2\sqrt{\unicode[STIX]{x1D712}_{2}})\right)^{2}}}.\end{eqnarray}$$
With the previous assumptions, the evolution of the vertical velocity of both bubbles is the solution of the following equations:
 $$\begin{eqnarray}\displaystyle & \displaystyle m_{a1}{\displaystyle \frac{\text{d}V_{1}}{\text{d}t}}={\displaystyle \frac{1}{2}}C_{D1}\unicode[STIX]{x1D70C}S_{1}\Vert U_{f2}-V_{1}\Vert (U_{f2}-V_{1})+m_{f1}g, & \displaystyle\end{eqnarray}$$
 $$\begin{eqnarray}\displaystyle & \displaystyle m_{a2}{\displaystyle \frac{\text{d}V_{2}}{\text{d}t}}={\displaystyle \frac{1}{2}}C_{D2}\unicode[STIX]{x1D70C}S_{2}\Vert U_{f1}-V_{2}\Vert (U_{f1}-V_{2})+(m_{f2}+m_{a2}){\displaystyle \frac{\text{D}U_{f1}}{\text{D}t}}+m_{f2}g, & \displaystyle\end{eqnarray}$$
 where  $m_{fi}=\unicode[STIX]{x1D70C}{\mathcal{V}}_{i}$ and the volume of the bubble
  $i$ is
  ${\mathcal{V}}_{i}=\unicode[STIX]{x03C0}d_{i}^{2}h/4$, the surface
  $S_{i}=d_{i}h$,
  $m_{ai}=\unicode[STIX]{x1D712}_{i}\unicode[STIX]{x1D70C}{\mathcal{V}}_{i}$ corresponds to the added mass of an ellipse of aspect ratio
  $\unicode[STIX]{x1D712}_{i}$ along its minor axis, and
  $C_{Di}$ is the drag coefficient of the equivalent isolated bubble (Filella et al. Reference Filella, Ern and Roig2015).
Note that in the absence of acceleration, the balance equation (3.5) reduces to  $V_{b2}-V_{b2\infty }=U_{f1}(\unicode[STIX]{x0394}y)$ instead of
  $\unicode[STIX]{x1D705}V_{max}(\unicode[STIX]{x0394}y)$ in (3.1), providing a value for
  $\unicode[STIX]{x1D705}\approx \sqrt{\unicode[STIX]{x03C0}}d_{1}/2d_{2}\text{erf}(d_{2}/1.1d_{1})$ assuming
  $V_{1}=V_{b1\infty }$. The values for this expression are plotted in a colour scale in the background of figure 5(b). The modelled values follow the same gradual fading of colour as the fitted values from the kinematics measurements, indicating that the relative size effect is predominant to explain the correcting factor
  $\unicode[STIX]{x1D705}$. However, as
  $\text{erf}(x)\sim 2x/\sqrt{\unicode[STIX]{x03C0}}$ for
  $x<0.5$, the effect of
  $d_{1}/d_{2}$ vanishes for contrasted bubbles sizes with
  $d_{2}<1.1d_{1}/2$, the prefactor
  $\unicode[STIX]{x1D705}$ being then close to 0.9, as observed previously.

Figure 6. Comparison between experiments and the prediction of the entrainment model. Upper figures (a,b): vertical velocity as a function of the separation distance between the two bubbles; Central figures (c,d): elongation ratio; Lower figures (e,f): horizontal velocities. The symbols correspond to two experiments for  $Ar_{1}\approx 4000,Ar_{2}\approx 1500$ on the left-hand side (crosses report the same case as in figure 3 with
  $Ar_{1}=3820,Ar_{2}=1525$) in (a,c,e); and to three experiments for
  $Ar_{1}\approx 1500,Ar_{2}\approx 2000$ on the right-hand side in (b,d,f). Purple (respectively, green) symbols correspond to the leading (respectively, trailing) bubble. Purple (respectively, green) vertical bars are representative of the amplitude of the oscillations for isolated bubbles with diameters close to the leading (respectively, trailing) bubble. The solid lines correspond to the predictions of the model (relations (3.4) and (3.5)) with continuous blue line: model with all terms; red dashed line: model without inertial terms (initial conditions are given at
  $\unicode[STIX]{x0394}y/d_{1}=10$ where both bubbles have their terminal velocity). The black continuous line corresponds to the fluid velocity generated by the other bubble (
 $1+U_{fi}/V_{bj\infty }$ with
  $i\neq j$). The insert in the upper figures (a and b) shows the relative positions of the bubbles during the interaction.
Two contrasted cases of interaction of bubbles in tandem leading to vertical entrainment have been especially examined and compared with the model. The main quantities useful for their discussion are plotted on figure 6. On the left column (a,c,e), two runs are reported when the leading bubble is larger than the trailing one with  $Ar_{1}\approx 4000$ and
  $Ar_{2}\approx 1500$, and, on the right column (b,d,f), three runs are reported with a reverse ratio of sizes associated with
  $Ar_{1}\approx 1500$ and
  $Ar_{2}\approx 2000$. The runs have been selected because the bubbles, except for one case, are particularly well aligned in the vertical direction during their motion,
  $\unicode[STIX]{x0394}x/d_{1}$ being lower than 1 when they come close to each other (inserts in figure 6a,b). A general view of the motions during interaction is provided by the examination of the experimental measurements of the vertical velocities, aspect ratios and horizontal velocities (figure 6a–f). They are plotted as a function of the normalized vertical separation distance
  $\unicode[STIX]{x0394}y/d_{1}$ to enable comparison with the model. Bubble motions are quite complex, with strong oscillations that do not appear periodic in this representation partly because
  $\unicode[STIX]{x0394}y/d_{1}$ is nonlinearly transformed with respect to time. On (a,c,e), one case is the same as in figure 3. It is thus possible to check on the bubble motion plotted versus time the general property that for
  $\unicode[STIX]{x0394}y>d_{1}$ the leading bubble at
  $Ar_{1}\approx 4000$ mainly keeps its periodic oscillatory motion as if it were isolated. Concerning the trailing bubble at
  $Ar_{2}\approx 1500$, its vertical velocity globally increases when it gets closer to bubble B1, but it also presents complex oscillations around this drift. The model that we discuss intends to predict the global drift but will be of course unable to predict such oscillations produced either by the intrinsic instability of the bubble or by non-quasi-static hydrodynamical interactions. The aspect ratio and the horizontal velocity of bubble B2 oscillate with amplitudes comparable to those of the isolated bubble. The same complexity of oscillatory motions is present for both interacting bubbles when
  $Ar_{1}\approx 1500$ and
  $Ar_{2}\approx 2000$ (figure 6b,d,f). The vertical entrainment of B2 is less pronounced than for the case discussed before because the leading bubble is smaller while the trailing bubble size is comparable.
The comparison of the acceleration of the bubbles observed experimentally with the results of the model is presented in figure 6(a,b). The vertical velocities of the bubbles are normalized with their terminal velocity. In both cases, we can observe a good agreement between the global entrainment observed in the experiments (symbols) and the model (continuous blue line). When the trailing bubble is smaller than the leading bubble (figure 6a), the vertical velocity of the first body is not significantly modified compared to the isolated case. As observed previously, the velocity of the leading bubble oscillates around its terminal velocity when  $Ar_{1}>Ar_{2}$. However, the second bubble is clearly entrained in the wake of the leading one. Looking more precisely at figure 6(a), we can observe that the model slightly overestimates the velocity of the entrained body. It is worth noticing that the velocity of the fluid affecting the motion of the trailing bubble is calculated by integrating a model for the ascending flux behind the leading bubble over a transverse distance equal to
  $2d_{2}$. This fluid velocity might be larger than the velocity around the trailing bubble mostly because it has been calculated without taking into account the unsteady transverse deformation of the ascending flux relative to the path of B2. In the case where the second bubble is larger than the first one, the acceleration of the trailing bubble is more accurately determined with the model as shown in figure 6(b). In the latter case, the leading body is also strongly accelerated. However, bubble at
  $Ar=1500$ can reach
  $1.3V_{b1\infty }$ when it is the leading one compared to
  $2.5V_{b2\infty }$ when it is the trailing one. The marked difference between experimental and predicted velocities of the two bodies for distances
  $\unicode[STIX]{x0394}y/d_{1}<1.5$ in one of the runs of figure 6(b) is due to a marked deviation of the relative position of the bubbles with the tandem alignment (see insert). It is interesting to note that in the two cases considered in figure 6, simply superposing the terminal velocity of the bubble with the vertical velocity of the fluid averaged at the bubble scale (equations 3.2 or 3.3) evaluated at the same position (black continuous lines) also provides a satisfactory prediction of the entrainment. The reason is that the inertial forces are less important than drag forces modified by the wake and by the potential flow introduced here. In fact we also report with red dashed lines on figure 6(a) and figure 6(b) numerical results obtained when solving equations (3.4) and (3.5) without inertial terms, which nearly superpose within graphical accuracy with the results obtained when inertial forces are taken into account (blue continuous lines).
Comparison between experimental results and model predictions for a large number of runs when bubbles are aligned is in most cases very satisfactory, though sometimes slightly over-estimating entrainment of B2. In particular, interactions of bubbles of equal diameters with an Archimedes number in the range (2500–4500) are well-predicted. Runs with  $Ar_{2}=2500$ and
  $1500<Ar_{1}<2000$ or with
  $Ar_{2}=4000$ and
  $1450<Ar_{1}<3500$ show also a good agreement. For runs with
  $Ar_{1}>Ar_{2}$ in the regime where the model for the wake velocity is valid (that is for
  $1800<Ar_{1}<5000$) we also checked that a considerable number of runs were accurately predicted (with contrasted values of the pairs (
 $Ar_{1}$–
 $Ar_{2}$) as (3000–2500), (4000–1000) or (5000–2000), etc
 $\ldots$).
4 Modification of the path of the trailing bubble by the vortex street generated by the leading bubble
In this section, we investigate the strong horizontal accelerations often observed during the interaction between two bubbles in vertical or oblique relative positioning when the trailing bubble is smaller than the leading one. We show that specific phases of horizontal relative motion are due to the action of vortices released by bubble B1. They consist in rapid attractions towards the wake centre line or in rapid ejections away from it. These behaviours have to be distinguished from self-induced loads exerted on the trailing bubble that continuously drive its motion. We report PIV measurements showing that vortices are responsible for such strong accelerations, and suggest a criteria for the bubble–vortex interaction based on experimental data. We also show that a regular succession of ejections and re-alignments events may take place. Finally, we discuss the possibility for regular oscillations of the bubble path to develop, as the bubble passes through the vortex street generated by a comparable bubble.

Figure 7. Ejection of the trailing bubble for  $Ar_{1}=3510,Ar_{2}=880$. (a) Streamlines of the velocity field at the time of ejection
  $t_{ej}$ with the contours of the bubbles. The black (respectively, green) dashed line corresponds to the path of the leading (respectively, trailing) bubble. The black line corresponds to the path of the vortex which interacts with the trailing bubble. The black cross indicates the centre of this vortex at the time
  $t_{ej}$. (b) Velocity components of the bubbles (in black for bubble B1 and in turquoise for bubble B2). Thick (respectively, thin) lines indicates the horizontal (respectively, vertical) velocity. The vertical purple dashed line indicates the time of ejection
  $t_{ej}$. The horizontal dashed lines correspond to the terminal velocity of the equivalent isolated bubbles.
4.1 Elementary scenarios for ejection from or centring in the vortex street
Depending on the size of the trailing bubble, on its position in the wake of B1 and on the intensity of the vortices it encounters, more or less significant modifications of the path of B2 can occur. Two main scenarios are identified: a horizontal deviation of the trailing bubble towards the wake centre line (centring in the wake) or away from it (ejection from the wake).
A case of ejection of the second bubble out of the vortex street is presented in figure 7. The leading bubble is much larger than the trailing bubble ( $Ar_{1}=3510,Ar_{2}=880$) and the ejection is happening when the bubbles are close to each other. The path of B2 is shown in figure 7(a) with a green dashed line. Looking at the streamlines, it is easy to relate the deviation of B2 to the interaction with the nearest vortex whose centre at the time plotted is indicated with a black cross. The path of the vortex is drawn with a black solid line. It shows a deviation towards the outer region of the vortex street in a similar way to the drift of B2. The temporal evolutions of the components of the bubble’s velocity are shown in figure 7(b). The motion of the leading bubble is not strongly modified by the second bubble in this case. Ejection is characterized by a drift of the second bubble, towards the right in this case. The time of ejection of B2 is defined by an increase of
  $V_{x2}$ after this time, as indicated with a purple vertical dotted line in figure 7(b). We can see that it is also associated with a sudden decay of
  $V_{y2}$. The bubble then recovers its terminal velocity (dashed horizontal line in figure 7b).
To quantify this kind of interaction between a bubble and a vortex, it is interesting to look at the intensity of the vortex at the moment of ejection  $\unicode[STIX]{x1D6FA}(t_{ej})$. Magnaudet & Eames (Reference Magnaudet and Eames2000) reported some studies existing on the dynamics of bubbles in vortical flows and introduced parameters characterizing the potential of a vortex to trap a bubble. Such parameters are:
  $\unicode[STIX]{x1D6F1}=\unicode[STIX]{x1D6FA}^{2}a/g$ which compares the inertial force driving bubbles towards the vortex core to buoyancy (with
  $a$ the radius of the vortex, in the present case
  $a\approx d_{1}$) and
  $Sr=a\unicode[STIX]{x1D6FA}/V_{b2\infty }$ which compares the velocity induced by the vortex to the terminal velocity of the bubble. In the present study we choose to use
  $Sr$, which takes into account the effect of both sizes
  $d_{1}$ and
  $d_{2}$. Furthermore, note that in this case we can consider that
  $\unicode[STIX]{x1D6F1}\sim Sr^{2}d_{2}/d_{1}$. Most of the studies about interaction of bubbles with vortices concern small bubbles compared to the size of the vortex core (Sene, Hunt & Thomas (Reference Sene, Hunt and Thomas1994) among others). In the present configuration, the bubbles are as large as the vortices. Moreover, the vorticity decreases rapidly making the interpretation of the path of the trailing bubble even more difficult. However, the
  $Sr$ parameter can be estimated in the case of an ejection to give an idea of the potential of the vortex to act on bubble B2. The terminal velocity of B2 in the case presented in figure 7 is
  $V_{b2\infty }\simeq 13~\text{cm}~\text{s}^{-1}$ and the measured vorticity
  $\unicode[STIX]{x1D6FA}(t_{ej})\simeq 38~\text{rad}~\text{s}^{-1}$, the trapping parameter is then
  $Sr\simeq 3.18$. This value is much greater than 1 indicating that the horizontal velocity induced by the vortex is sufficient when compared to the terminal velocity of the bubble to induce an important modification of its path.

Figure 8.  $Re$-alignment or centring of the trailing bubble in the wake of the leading one for
  $Ar_{1}=3900,Ar_{2}=1160$. Same legend as figure 7, the vertical purple dashed line indicating here the time of recentring,
  $t_{rec}$. The oblique purple dotted line shows the mean horizontal drift experienced by B2.
In the same way, a trailing bubble can be attracted towards the centre line of a vortex street. This mechanism is illustrated in figure 8. The leading bubble is again larger than the trailing bubble ( $Ar_{1}=3900,Ar_{2}=1160$). Also, B2 is initially slightly out of the vortex street as illustrated in figure 8(a) with the blue dashed line and contours. We remark that it progressively enters the vortex street. A drift is also observed on the horizontal component of the velocity of B2 (oblique purple dotted line in figure 8b). At the time
  $t_{rec}$ where recentring is considered to begin (vertical purple dotted line in figure 8b), the leading bubble is no longer in the measurement window, the separation distance between the bubbles being large in this case (
 $\unicode[STIX]{x0394}y\approx 6d_{1}$). The path of the vortex as well as its position at
  $t_{rec}$ upstream of the trailing bubble are plotted with a solid black line and a cross in figure 8(a). This vortex has been released a ‘long’ time before the trailing bubble entered the measurement window, its vorticity is therefore small at that time
  $\unicode[STIX]{x1D6FA}(t_{rec})\simeq 10~\text{rad}~\text{s}^{-1}$ (measured from the PIV velocity field). The value of the trapping parameter is smaller than in the previous case:
  $Sr\simeq 0.82$. The vorticity of the vortex being small, it could be not strong enough to drag by itself the bubble towards its centre. For instance, the realignment of B2 could be initiated by a self-induced vortex released on its left. The trailing bubble nevertheless follows the counter-clockwise rotational motion of the vortex heading towards the higher velocities in the ascending flux. The centring of B2 is a progressive process, it slowly drifts towards the centre of the vortex street. Quantitatively explaining the horizontal velocity of B2 is difficult since one should separate its own dynamics from the effect of the vortex and the effect induced by the velocity gradient associated with its location at the border of the ascending flux. However, from this PIV case, it is clear that the path of B2 was modified by the vortex towards which it was heading.

Figure 9. Conditions for rapid ejection or centring of B2 in the wake due to the vortices of B1. (a) Positions and normalized velocities of B2 provided by the shadowgraphy observations (velocities are normalized by  $\sqrt{gd_{2}}$), (b) limit between observations of ejections or centring of B2 in the wake and observations of no effect on B2 in (
 $Ar_{2},Sr$) diagram. The insert provides the values of
  $Ar_{1}$ and
  $Ar_{2}$ in the cases for which
  $Sr$ was directly measured by PIV or estimated from the shadowgraphy observations.
4.2 Tentative classification of the effect of vortices released by B1 on the path of B2
From the kinematics of oscillating bubbles measured by the shadowgraphy method, ejections of B2 from the wake of B1 can be detected from discontinuous motions in the horizontal direction displayed by B2. In figure 9(a) the positions and velocities of the trailing bubble at the moment of ejection are plotted for various pairs of Archimedes numbers. Most of these positions can be correlated with the expected trajectory of a vortex released from B1 confirming its role in ejection. This can be obtained from Filella et al. (Reference Filella, Ern and Roig2015). It is difficult to estimate precisely conditions characterizing the ability of vortices released by the leading bubble to strongly influence the path of the trailing bubble. When such influence consists in rapid entrance in the wake or ejection from it, it is, however, possible to detect relative positions of such events. It is then also possible to estimate the involved vorticity at these instants. It was either directly measured by PIV or estimated from the temporal evolution of the vorticity in the case of isolated bubbles (Filella et al. Reference Filella, Ern and Roig2015). An approximate frontier can be defined in the ( $Ar_{2},Sr$) map between cases where a strong deviation was observed and cases for which no noticeable changes of the path of B2 happened while PIV measurements confirmed there were interactions in the flow between B2 and a vortex released by B1 (figure 9b). Most ejection and centring cases have an
  $Sr$ value greater than 1 and most cases where the path of bubble B2 is not modified have an
  $Sr$ value lower than
  $0.5$. An approximate empirical limit of
  $Sr\approx 0.6$ can be defined. It concerns cases in a limited range of Archimedes numbers (see insert in figure 9b), so that more observations would be necessary to define more precisely this frontier. It may in particular be blurred by the coupling between vortex-induced transverse accelerations with self-induced unsteady loads of B2. Note also that lateral expulsions can be caused by the flow generated at the front of B1 as shown by the relative positions that are positive in figure 9(a), when this happens.

Figure 10. Trailing bubble excited in a series of entrainment, re-alignment and ejection events  $Ar_{1}=2600,Ar_{2}=415$ (
 $d_{1}=8.21$ mm,
  $d_{2}=2.38$ mm). (a) The thin black (respectively, green) line represents the path of the leading (respectively, trailing) bubble. Circle symbols label particular times of the trailing bubble path: extremal horizontal positions in yellow and grey, maximal positive or negative horizontal velocities in blue and red. Cross symbols are reported for the same times on the leading bubble path. (b) Temporal records of the bubble positions (in black for the leading one, in green for the trailing one) and path of the relative motion as an insert. (c) Temporal record of the horizontal velocities. (d) Temporal record of the vertical velocities. (e) Temporal record of the bubble inclinations. (f) Temporal record of the aspect ratios.
4.3 Cyclic behaviour alternating ejections and centrings
A regular succession of ejections and re-alignments of B2 in the wake of B1 was observed when bubble B2 was clearly smaller than B1 and stayed on average at a small distance from it (approximately  $1.5d_{1}$ and
  $2d_{1}$ in the horizontal and vertical directions). No PIV measurements were performed for this case but kinematics reveals the underlying periodic action of vortices released by bubble B1. This cyclic behaviour is illustrated on figure 10(a,b) for
  $Ar_{1}=2600$ and
  $Ar_{2}=415$. The trailing bubble has a diameter smaller than the gap width (
 $d_{2}=2.4~\text{mm}$). Despite their difference in size, both bubbles, if they were isolated, would have similar mean vertical velocities but contrasted periods of oscillation (
 $T_{x1\infty }=0.24~\text{s}$ and
  $T_{x2\infty }=0.11~\text{s}$). The paths of both bubbles are plotted on figure 10(a). The path of bubble B1 is not influenced by the presence of the second bubble. It oscillates and keeps the mean velocity, the mean shape and the periodic motion it has when it is isolated (figure 10a–f). A strong modification of the motion of the trailing bubble, more precisely of its horizontal motion showing a periodic behaviour at the same frequency than the leading bubble, is observed (figure 10c). Bubble B2 is ejected from the wake, stays for a while at its border and then re-enters the wake regularly. Both bubbles are quite close, their relative distance oscillating in the range
  $1<\unicode[STIX]{x0394}x/d_{1}<1.5$ and
  $2<\unicode[STIX]{x0394}y/d_{1}<2.5$ (figure 10b and insert), so that B2 is expected to strongly interact with the vortices shed by B1. The temporal evolution of the horizontal velocities shows that the motion of B2 is controlled by the unsteady wake of the leading bubble B1. In fact, both bubbles globally oscillate in phase in time and the trailing bubble B2 adopts the period of oscillation of B1 which is noticeably different from the value it would have if it were isolated (figure 10b,c). Four coloured points have been plotted for each period to indicate particular instants during the interaction. They can help understanding the scenario of the motion of the trailing bubble induced by the wake of B1. Grey and yellow dots point out the instants where the trailing bubble is at its extremal horizontal positions. They are indeed associated with negligible horizontal velocities of B2 (figure 10c). As shown on figure 10(d), the vertical velocities
  $V_{y}$ for the grey points are similar to the terminal velocity of bubble B2, because the bubble is out of the entrainment region at these instants. On the contrary, for the yellow points,
  $V_{y}$ is maximum and far enhanced as compared to
  $V_{b2\infty }$ because bubble B2 is strongly dragged by the wake as it is more centred in the wake of B1 at these instants. Blue and red dots are associated with maximum positive and negative values of the horizontal velocity
  $V_{x}$ of B2, respectively. The motions towards the wake centre line happens when time goes from grey to yellow points and, on the opposite way, the motion is from the wake centre line to the external region during the time delay separating yellow and grey points. Both motions towards and away from the wake, respectively, involve two sequences of contrasted time scales because the motions both include a vortex-driven phase (blue–yellow for centring and yellow–red for ejection) and a longer phase where the bubble is more distant from the central region of the wake (grey–blue and red–grey, respectively). The global sequence from times blue to red includes centring and ejection events with high induced
  $V_{x}$ or
  $V_{y}$ velocities indicating that B2 is either captured by the vortex or at least strongly deviated by it. It is thus a rapid sequence where the motion of B2 is dominated by the vortex influence and its time scale is approximately 0.05 s which corresponds approximately to
  $d_{1}/V_{b1\infty }$. The complementary sequence from times red to blue takes place during a time delay nearly equal to
  $T_{x1}$. During this phase, corresponding to the time necessary for the formation of a vortex of B1, bubble B2 changes direction more progressively when passing from a vortex to the following one and its vertical velocity does not evolve significantly. The intensity of the vortex interacting with the bubble can be estimated from its initial value at release (Filella et al. Reference Filella, Ern and Roig2015). This leads to
  $Sr=\unicode[STIX]{x1D6FA}d_{1}/V_{b2\infty }\approx 5.6$ which is large enough to explain the ability of this vortex to deeply influence the motion of the small trailing bubble. From the temporal records of
  $\unicode[STIX]{x1D6FD}_{n}$ and
  $\unicode[STIX]{x1D712}$ we can see that the trailing bubble adapts its inclination and shape during its cyclic motion. In particular, despite the poor resolution of
  $\unicode[STIX]{x1D712}$ for this small bubble, it appears that it enters the wake (blue mark) with a more elongated shape.
4.4 Oscillations induced by the vortex street

Figure 11. Modification of the path of the trailing bubble by the far wake of the leading bubble for  $Ar_{1}=3900,Ar_{2}=1990$. (a) Horizontal and vertical relative distances between bubbles during interaction; (b) illustration of the path of the bubbles (black line for the leading bubble and red arrows for the norm of the velocity of the trailing bubble) and of the path of the vortices released by the leading bubble. The filled markers correspond to the initial position of the centre of the vortices released by the leading bubble. The dotted lines indicate the path of the vortices. Coloured disks illustrate the vortices remaining after vortex pairing (their size was chosen as
  $d_{1}$, their real shape and orientation are not sketched). Grey circles and crosses indicate vortices coming from the bottom of the measurement window. (c) Horizontal velocity (black line B1, coloured dots B2); (d) vertical velocity (black line B1, coloured dots B2, straight lines: continuous for terminal velocity and dashed dotted for the average velocity during the experiment); (e) inclination of the bubbles; (f) elongation ratio
  $\unicode[STIX]{x1D712}$ (averaged values over the temporal window are plotted in straight lines and are equal to 2.71 and 1.75, respectively). For isolated bubbles with
  $d_{1}\approx 1.1~\text{cm}$ and
  $d_{2}\approx 0.7~\text{cm}$, terminal velocities are
  $V_{b1\infty }\approx 20.5~\text{cm}~\text{s}^{-1}$ and
  $V_{b2\infty }\approx 16.4~\text{cm}~\text{s}^{-1}$; periods are
  $T_{x1\infty }\approx 0.21$ s and
  $T_{x2\infty }\approx 0.26$ s; mean elongation ratios are
  $\unicode[STIX]{x1D712}_{1\infty }\approx 2.8$ and
  $\unicode[STIX]{x1D712}_{2\infty }\approx 1.8$; amplitudes of elongation ratios are
  $\tilde{\unicode[STIX]{x1D712}}_{1\infty }\approx 0.55{-}0.7$,
  $\tilde{\unicode[STIX]{x1D712}}_{2\infty }\approx 0.25{-}0.35$; amplitudes of horizontal velocity oscillations are
  $\tilde{V}_{x1\infty }\approx 0.7V_{b1\infty }\approx 12~\text{cm}~\text{s}^{-1}$,
  $\tilde{V}_{x2\infty }\approx 0.4V_{b2\infty }\approx 6~\text{cm}~\text{s}^{-1}$; inclinations are
  $\unicode[STIX]{x1D6FD}_{n1\infty }\approx 25^{\circ }$,
  $\unicode[STIX]{x1D6FD}_{n2\infty }\approx 40{-}45^{\circ }$.
We now consider the case of two vertically aligned bubbles with  $Ar_{1}=3900$ and
  $Ar_{2}=1990$, which is presented in figure 11. The vertical separation distance is around
  $8d_{1}\approx 8.6~\text{cm}$ which means that the leading bubble is sufficiently far from the trailing bubble so that vertical entrainment is weak (figure 11a). The characteristics of the motion of B1 are similar to those of an isolated bubble of equivalent size: its path plotted with a black line on figure 11(b) is periodic, its velocity and shape oscillations as well as its inclination
  $\unicode[STIX]{x1D6FD}_{n}$ are those of an isolated confined bubble (figure 11c–f). On the contrary, a strong modification of the motion of the trailing bubble, more precisely of its horizontal motion showing a periodic behaviour at a different frequency than in the isolated case, is observed (figure 11c). The shape, amplitude and frequency of the signal of horizontal velocity do not correspond to the self-induced oscillations of the bubble that would be sinusoidal with an amplitude
  $\tilde{V}_{x2\infty }\approx 0.06~\text{m}~\text{s}^{-1}$ and a period
  $T_{x2\infty }\approx 0.26~\text{s}$ in the isolated case. As discussed hereafter, this behaviour is due to the interaction of the bubble with the vortex array generated by the leading bubble.
Figure 11(b) shows that the path of B2 (red arrows) presents a wavelength which is twice the wavelength of the leading bubble whose path is plotted with a black line. The signature of this double wavelength is also observed in the horizontal component of the velocity of B2 (figure 11c) which presents two plateaus of small positive velocity. The period of the horizontal component of the velocity of B2 corresponds to double the period of oscillation of B1. As shown in Filella et al. (Reference Filella, Ern and Roig2015), the vortex street generated by a bubble undergoes a rearrangement after a time period of the order of two oscillations,  $2T_{x1}$. During this phase, vortex pairing occurs for two vortices on the same side of the vortex street which eventually presents a wavelength two times larger. Considering that during two oscillation periods the vortices are also displaced by approximately
  $2d_{1}$ in their vanishing upward motions, the rearrangement time of the vortex street converted in distance corresponds to
  $\unicode[STIX]{x0394}y\approx 2T_{x1}V_{b1\infty }-2d_{1}\approx 6d_{1}$. Beyond this distance, vortex pairing occurs. The second bubble being distant by
  $8d_{1}$ from B1 is therefore passing through a rearranged vortex street of twice its initial wavelength. In agreement with the observations presented in § 3, the vertical velocity of B2 is higher than its terminal velocity (dashed dotted and continuous lines in figure 11d) traducing a vertical entrainment by the ascending flux generated by B1. The difference between the mean vertical velocity of B2 and its velocity in the isolated case is approximately
  $3.8~\text{cm}~\text{s}^{-1}$. This value is lower than expected with relation (3.1) because the trailing bubble is also slightly displaced off-centre in the horizontal direction as compared to the leading one. However, the most striking effect in this case is the change in the oscillatory motion of B2 induced by the rearranged vortex street of B1.
While only the kinematics of both bubbles was measured in the present case, we can build a clarifying estimation of the position and size of the vortices released by the leading bubble in the present case using the detailed exploration by TR PIV of the wake of a single bubble at an Archimedes number similar to  $Ar_{1}$ reported in Filella et al. (Reference Filella, Ern and Roig2015) (for
  $Ar\approx 4380$). This study showed that the moment of release of the vortices corresponds to a maximal transverse velocity (i.e. a maximal velocity component along the major axis of the bubble). By taking the times at which this component of the velocity is maximal for B1 we get the times of release of the vortices in the wake of B1. The initial position of the centre of the vortices at release is approximately at
  $0.41d_{1}\sqrt{\unicode[STIX]{x1D712}_{1}}$ from the centre of the bubble in the horizontal direction and
  $1.3d_{1}/\sqrt{\unicode[STIX]{x1D712}_{1}}$ in the vertical direction. These initial positions are reported in figure 11(b) with the filled green markers. Once released the vortices move towards the outer part of the vortex street laterally and upwards. These paths are known and are schematically reported with the dotted lines. The vortex street also undergoes a vortex pairing phase during which two vortices on the same side of the vortex street merge before the structure of the wake becomes nearly frozen for times that are typically larger than
  $h^{2}/4\unicode[STIX]{x1D708}$. The sizes of the vortices then also tend towards approximately
  $d_{1}$. An estimation of the pairing and of the size of the vortices is provided in figure 11(b). In this scheme, for the sake of simplicity, the shape of the remaining vortices is represented as circular although it is not. From the released vortices, two final structures of the wake would be possible: either the first vortices (released in the bottom of the measurement window on each side of the path of B1) merged with the vortices released above, or they merged with the ones released beneath. By plotting circles of radius
  $d_{1}$ in each final position of all the vortices to represent the vortices in the plane and analysing the path of the second bubble, it clearly appears that the final structure of the wake corresponds to the first possibility of pairing as it is the one that can explain the curvature of the path of the trailing bubble. It is this structure that is plotted in figure 11(b). The vortices merging and coming from the bottom of the measurement window are also sketched in grey in this figure. With the estimated vortices represented in the figure, a credible scenario explains that the second bubble is passing between the vortices remaining after the rearrangement of the vortex street. The velocity of the trailing bubble is also maximal when it is located between the two vortices released by the leading bubble as shown in figure 11(b) which is consistent with the amplification of the velocity of the fluid between the two vortices. Even if the velocity components show that the second bubble is for a large part dragged by the remaining fluid motion in the vortex street, some traces of its own dynamics remain. In particular, this effect is observed on the inclination angle of the bubble plotted in figure 11(e). The frequency and amplitude of oscillations of
  $\unicode[STIX]{x1D6FD}_{n2}$ are similar to the values it would have if it were isolated. Some modulations of the signal are, however, observed, maximal velocity corresponding to bright red parts of the curve in figure 11(d). This case clearly demonstrates the necessity to characterize precisely the evolution of the structure of the wake of a single bubble to interpret the path of the second bubble.
5 Destruction/reinforcement of vortices by the passage of the second bubble
In the previous section, the modification of the path of the trailing bubble by the wake of the leading one was analysed, but modification of the wake induced in turn by the trailing bubble was not discussed. In this section, we consider different cases that illustrate the ability of the trailing bubble to impact the liquid flow field generated by B1 while its kinematics does not show strong deviation from the one it would have if it were isolated. Two cases are presented for which the sizes of bubbles B1 and B2 are equivalent ( $Ar_{1}\approx Ar_{2}\approx 1000$).

Figure 12. Interaction of two bubbles with  $Ar_{1}=1015,Ar_{2}=1090$ (
 $d_{1}=4.52~\text{mm}$,
  $d_{2}=4.74~\text{mm}$). (a) Evolution of the components of the velocities of the bubbles (same colours as figure 7). (b) Path (dashed lines) and contours of the bubbles at the moment of release of the vortices. The solid lines correspond to the path of the vortices. The red lines indicate the vortices released by the leading bubble and destroyed by the trailing bubble. (c,d,e) Streamlines of the velocity field around the bubbles at times
  $t=(0.396,0.431,0.466~\text{s})$; the cross indicates the centre of the disappearing vortex. (f,g) Horizontal and vertical positions of the bubbles and of the vortices released as a function of time. (h) Temporal evolution of the normalized vorticity of the vortices released by B1 and B2.
5.1 Vortex destruction for a stable relative positioning of the bubbles
In the first case of this section, bubbles are not vertically aligned but they are close to each other. The trailing bubble is on the right side of the vortex street generated by the leading bubble as illustrated in figure 12. This case is particularly interesting since the motions of the bubbles are not significantly modified by the interaction despite a strong interaction of B2 with the vortices. The horizontal and vertical components of the velocities of both bubbles are similar to those in the isolated case (figure 12a). The horizontal spacing between the bubbles is approximately  $2d_{1}$ and the vertical separation distance approximately
  $5d_{1}$ (figure 12c–e), both quantities remaining almost constant except for very weak periodic oscillations with a period close to those of both bubbles (0.17 and 0.18 s), the observation time of the recording lasting at least 2 s. The trailing bubble is rising in a complex liquid velocity field, however, at variance with the previous cases, its kinematics does not seem to be affected by the surrounding liquid velocities. This allows us to consider this case as a nearly stable arrangement of two oscillating bubbles.
Though the path of the trailing bubble is not significantly affected by the wake, the vortices released by B1 are affected by the second bubble. The paths of the vortices released by the leading bubble are plotted with black and red solid lines in figure 12(b). We can observe that the red paths are shorter than the black ones. The lifetime of these vortices is in fact far shorter, not greater than 0.1–0.2 s (figure 12f,g). They disappear when the second bubble passes through (dashed blue line in figure 12g).
The destruction of a vortex by the passage of B2 is illustrated with the evolution of the velocity field in figure 12(c–e). In the velocity field at  $t=0.396~\text{s}$, we can see the relative positioning of the two bubbles and that a vortex has been released by the leading one. The trailing bubble is headed straight towards this vortex whose centre is indicated with a black cross. The velocities in the liquid surrounding B2 are of same order of magnitude as the velocities near the vortex. In the velocity field at
  $t=0.431~\text{s}$, velocities around the vortex vanish and its size reduces as B2 approaches. Finally, the vortex disappears and B2 releases a vortex of opposite vorticity. The interaction of the vortex with the velocity field generated in front of B2 has led to the destruction of the vortex. We can note that the leading bubble is forming a new vortex; the cycle is then repeated.
The detection method described in Filella et al. (Reference Filella, Ern and Roig2015) allowed us to detect vorticity released in the space limited by both bubble trajectories even if the signals are slightly noisy in this region. They are attributed to each bubble depending on their circulation sign. The temporal evolutions of the normalized vorticity of each vortex is plotted in figure 12(h). It confirms at first the asymmetry of the temporal evolution of the vorticity released on each side of bubble B1. Periodic release occurs, with normalized vorticity values at release that are comparable. However, in the region between both bubbles, the vorticity decreases more rapidly before being possibly partly reinforced, but eventually disappearing in less than a period. In contrast, vortices released by both bubbles outside this region last for longer times before they are dampened.
The value of the trapping parameter that can be defined when B2 and the vortex approach, is much smaller than in the previous cases. Before disappearing, the vorticity of the vortex is  $\unicode[STIX]{x1D6FA}\approx 10~\text{rad}~\text{s}^{-1}$, so that the value of the trapping parameter,
  $Sr=0.32$, is quite low, indicating that the intensity of the vortex is not sufficient to control the motion of B2.
5.2 Vortex reinforcement by the passage of a trailing bubble

Figure 13. Interaction of two vertically aligned bubbles with  $Ar_{1}=1090,Ar_{2}=915$ resulting in strengthened vortices (
 $d_{1}=4.8~\text{mm},d_{2}=4.27~\text{mm}$). (a) The thin black (respectively, blue) line represents the path of the leading (respectively, trailing) bubble. Thick lines correspond to the path of the vortices released by the bubbles. Purple, red and yellow lines correspond to the vortices released by the leading bubble and strengthened by the trailing bubble. (b) Evolution of the normalized vorticity of the strengthened vortices as a function of the normalized vertical separation distance between B2 and the centres of the vortices (dots indicate
  $t_{i}$ and
  $t_{f}$). (c,d,e) The same as figure 12 with the path of the strengthened vortex indicated from
  $t_{i}$ to
  $t_{f}$ in purple; for
  $t=(0.753,0.778,0.803~\text{s})$.
A second case of similar interacting bubbles ( $Ar_{1}\approx Ar_{2}\approx 1000$) but in a different configuration shows a completely different interaction behaviour between the trailing bubble and the vortices. In this case, the two bubbles are vertically aligned as illustrated in figure 13(a) showing the path of the two bubbles (black and blue central curves). The trailing bubble is passing through the vortex street generated by the leading bubble. The paths of the vortices released by B1 (respectively, B2) are plotted in black (respectively, blue) in figure 13(a). When the second bubble enters the field of view, the vertical distance between the two bubbles corresponds to approximately
  $15d_{1}$. We can note that B2 releases some vortices close to the position of existing vortices released by B1. This is observed in figure 13(a) where a vortex of B2 in turquoise is detected in the vicinity of a vortex of B1 in black, for example for
  $y\approx 1.8~\text{cm}$ and
  $4~\text{cm}$ and
  $x\approx 7~\text{cm}$. These cases correspond to a substitution of the existing vortex released by B1 with a new vortex created by B2. The decay of the vorticity of these new vortices is similar to the ones released by an isolated bubble of size equivalent to that of B2. However, some vortices released by B1 are modified by the passage of B2 in a different way. This is the case for the vortices whose trajectories are plotted in blue, red and orange in figure 13(a). The passage of B2 induces a modification on these vortices on both their intensity and their path, as detailed hereafter. Figure 13(b) shows the evolution of their normalized vorticity as a function of the vertical separation distance between B2 and the centre of the vortex (normalized with
  $d_{2}$). This figure clearly shows that the vortices are reinforced by the passage of B2 in a similar way. The path of the vortices is also modified due to the presence of the trailing bubble, this phenomenon is illustrated on the path of the blue vortex between the two moments
  $t_{i}$ and
  $t_{f}$ (figure 13a). A more detailed view of the velocity field during the reinforcement is presented in figures 13(c)–13(e), for the first reinforced vortex. During this lapse of time the centre of the vortex is first attracted towards the trailing bubble, as illustrated in figure 13(c). The velocities induced by the vortex are small compared to the velocity of B2. At time
  $t=0.778~\text{s}$ in figure 13(d), the trailing bubble and the vortex are even closer. The vortex is displaced by the flow generated by B2. Figure 13(e) shows the reinforced vortex when B2 has passed beyond its centre. The path of the vortex is then similar to that of a vortex released from an isolated bubble. Similarly to the previous case (§ 5.1), the vortices do not present a strong enough vorticity, so that the path of the trailing bubble is not modified by the vortices. In this case,
  $\unicode[STIX]{x1D6FA}\approx 5~\text{rad}~\text{s}^{-1}$ and the trapping parameter is small,
  $Sr\approx 0.16$. The vortex does not seem to have an effect on B2, however, B2 strongly modifies the path and intensity of the vortices. Looking back at figure 13(b), we can see that the maximum of the reinforced vorticity is reached approximately at a vertical separation distance of
  $2d_{2}$. The maximal vorticity does not correspond to the initial vorticity of a released vortex, it is indeed lower. The increase in vorticity before and after reinforcement is
  $\unicode[STIX]{x1D6FF}\unicode[STIX]{x1D6FA}=\unicode[STIX]{x1D6FA}(t_{f})-\unicode[STIX]{x1D6FA}(t_{i})\approx 13~\text{rad}~\text{s}^{-1}$ for the three reinforced vortices. This increase seems to scale with the vorticity induced by the ascending flow behind B2:
  $\unicode[STIX]{x1D6FA}_{ind}=V_{max}(\unicode[STIX]{x0394}y_{vb_{2}}(t_{f}))/\unicode[STIX]{x0394}x_{vb_{2}}(t_{f})\approx 14~\text{rad}~\text{s}^{-1}$, where
  $\unicode[STIX]{x0394}y_{vb_{2}}$ and
  $\unicode[STIX]{x0394}x_{vb_{2}}$ are the vertical (respectively, horizontal) distances between the vortex centre and B2. It is worth noticing that this scaling is found on three successive events with
  $Ar_{1}\approx Ar_{2}\approx 1000$. It has also been observed for different pairs of interacting bubbles in a similar configuration for which the same scaling for the increased vorticity is the best match.
6 Conclusion
We presented an exploratory study on the hydrodynamical interaction between two confined zigzagging bubbles for a large range of Archimedes numbers. The analysis of experimental results, providing not only the kinematics of each bubble but also the velocity field during the interaction, was carried out using two complementary approaches. The first approach investigated how the kinematics of a bubble, already submitted to the intrinsic instability of its path and wake, is modified by the interaction, i.e. by the presence of a liquid flow field generated by the companion bubble. This brought to light a large variety of general mechanisms of interaction, associated with vertical or horizontal accelerations of the body: vertical entrainment, ejection from the wake, centring into the wake, a cyclic alternation of ejection/centring events, and induced oscillations at a frequency different from that of the isolated bubble oscillations. To characterize these behaviours, we distinguished the interaction of the trailing bubble B2 with (i) the ascending flux and (ii) the vortices generated by the companion bubble B1.
(i) The effect of the ascending flux is manifest in the vertical entrainment experienced by the trailing bubble, when the two bubbles are vertically aligned or close to vertical alignment. Using the previous extensive characterization of the wake and the motion of a single bubble (Filella et al. Reference Filella, Ern and Roig2015), we showed that the acceleration of B2 is relatively easily modelled using a quasi-static drag force deficit associated with the spatial variation of the liquid velocity in the wake of B1. The key point lies in the determination of a characteristic velocity for the ascending flow, which was obtained by integrating the velocity profiles over a distance proportional to the trailing body size. Despite quite noticeable oscillations during the interactions, we validated the model for the mean entrainment, thus generalizing the model by Brosse & Ern (Reference Brosse and Ern2014) for two disks falling in tandem. Reproducing oscillations is a deeper challenge, because even if we could think of introducing a periodic component in the velocity field to represent the effect of vortex shedding from B1 on B2, the model would also require the inclusion of the effect of the intrinsic vortex shedding of B2 on its own dynamics.
(ii) The interaction of the vortices released by B1 on a bubble rising in line or in oblique positioning results in strong localized horizontal deviations of the path of B2. Depending on the size of the trailing bubble, on its position in the wake of B1 and on the intensity of the vortices it encounters, we identified several elementary scenarios of modification of the path of B2 due to vortices released by B1. Two major mechanisms correspond to horizontal deviations of the trailing bubble towards the wake centre line (centring in the wake) or away from it (ejection from the wake). We also showed that a regular succession of ejections and re-alignment events may take place (cycle of ejections/centrings). Finally, we showed that the path of B2 can develop regular oscillations, different from the oscillations it displays in the absence of any other bubble, as it passes through the vortex street generated by a comparable bubble; the frequency and amplitude of this motion being imposed by the vortex street. Using the bubble kinematics and liquid velocity measurements, we further introduced the parameter
 $Sr=\unicode[STIX]{x1D6FA}d_{1}/V_{b2\infty }$ to characterize the interaction at a given time $t$ of bubble B2 (of characteristic velocity in the isolated case $V_{b2\infty }$) with a vortex released by B1 (of characteristic size $d_{1}$ and vorticity $\unicode[STIX]{x1D6FA}(t)$). Ejection/centring behaviours are expected to occur for large enough values of $Sr$ in order to explain the ability of the vortex to significantly influence the motion of the trailing bubble. Most ejection and centring cases observed here have an $Sr$ value greater than 1 and most cases where the path of bubble B2 is not modified have an $Sr$ value lower than $0.5$. An approximate empirical limit of $Sr=0.6$ is proposed. It concerns cases in a limited range of Archimedes numbers (see insert in figure 9b), so that more observations would be necessary to define more precisely this criteria.


The second approach followed in this paper is complementary to the first one, and focuses on the effect of a moving bubble on the liquid flow field generated by the companion bubble. Once again, the analysis is built on the knowledge of the behaviour of isolated bubbles, which is used for comparison to characterize the effect of the interaction. We showed that a strong modification of the liquid flow field can occur in the absence of a visible impact on the bubbles kinematics. This indicates that though the two bubbles do not seem to interact, the surrounding liquid velocity field can be strongly impacted by the interaction. We highlighted how the trailing bubble can destroy or reinforce vortices released by the leading bubble, and modify the vortex path. We trust that these original results will motivate further studies on the interaction of an oscillating bubble with an external vortex of similar size, or with a vortex alley.
Acknowledgements
The authors are grateful to S. Cazin, M. Marchal, G. Ehses and J.-P. Escafit for the technical support provided for the experiments.
Declaration of interests
The authors report no conflict of interest.


