


1. Introduction
Separated flows over sharp-edged, wall-mounted bluff bodies, such as prisms, has garnered increasing attention due to their relevance in various industrial applications (Goswami & Hemmati Reference Goswami and Hemmati2020, Reference Goswami and Hemmati2021a,Reference Goswami and Hemmati
b). These flows are complex and multifaceted, owing to their inherent three-dimensional nature, and are primarily attributed to end effects (Wang & Zhou Reference Wang and Zhou2009). As the oncoming flow encounters the leading edge, it decelerates and forms a boundary layer along the prism surfaces. This boundary layer subsequently separates, creating a highly disturbed region of flow known as the wake (Zdravkovich Reference Zdravkovich1997). One prominent feature of the wake is the formation of large-scale coherent structures, which contain a significant portion of the total fluctuating energy, thus playing a vital role in momentum transfer and mixing processes. The formation of these structures strongly depends on the state of the wake, which can be laminar, transitional or turbulent. Transition can occur in three key regions, commonly observed in various geometries, including both circular and rectangular cylinders: (i) within the wake, (ii) in the free-shear layers, and (iii) within the boundary layer (Zdravkovich Reference Zdravkovich1997). In the context of sharp-edged bluff body wake, such as a wall-mounted prism, transition to turbulence occurs rapidly in the free shear layers, with the wake becoming fully turbulent due to flow separation at the leading edges (Martinuzzi Reference Martinuzzi2008). Moreover, transition to turbulence is influenced by both Reynolds number (
 $Re = U_b{d}/\nu$
, where
$Re = U_b{d}/\nu$
, where
 $d$
is the width of the prism in the spanwise direction) and geometrical features of the flow, including depth ratio (
$d$
is the width of the prism in the spanwise direction) and geometrical features of the flow, including depth ratio (
 $DR = l/d$
, where
$DR = l/d$
, where
 $l$
is the length of the prism in the streamwise direction), aspect ratio (
$l$
is the length of the prism in the streamwise direction), aspect ratio (
 $AR = h/d$
, where
$AR = h/d$
, where
 $h$
is the height of the prism in flow normal direction), and free-end effects, particularly in the case of wall-mounted prisms (Zdravkovich Reference Zdravkovich1997).
$h$
is the height of the prism in flow normal direction), and free-end effects, particularly in the case of wall-mounted prisms (Zdravkovich Reference Zdravkovich1997).
At elevated Reynolds numbers (
 $Re \gt 10^3$
), it is well documented that separated shear layers have the capacity to reattach over the side and top surfaces of the prism, provided that there is a significant increase in depth ratio (Rastan et al. Reference Rastan, Shahbazi, Sohankar, Alam and Zhou2021). Further, increasing depth ratio entails enhancement of the downwash flow, which suppresses the wake unsteadiness (Goswami & Hemmati Reference Goswami and Hemmati2022). Meanwhile, aspect ratio plays a role in intensifying the upwash flow and contributing to the overall wake unsteadiness (Saha Reference Saha2013). Thus enhancement of the unsteadiness in the wake of wall-mounted prisms can be achieved by either increasing the prism aspect ratio or reducing its depth ratio. This heightened wake unsteadiness suggests that such abrupt changes in geometry may be associated with the transition to turbulence.
$Re \gt 10^3$
), it is well documented that separated shear layers have the capacity to reattach over the side and top surfaces of the prism, provided that there is a significant increase in depth ratio (Rastan et al. Reference Rastan, Shahbazi, Sohankar, Alam and Zhou2021). Further, increasing depth ratio entails enhancement of the downwash flow, which suppresses the wake unsteadiness (Goswami & Hemmati Reference Goswami and Hemmati2022). Meanwhile, aspect ratio plays a role in intensifying the upwash flow and contributing to the overall wake unsteadiness (Saha Reference Saha2013). Thus enhancement of the unsteadiness in the wake of wall-mounted prisms can be achieved by either increasing the prism aspect ratio or reducing its depth ratio. This heightened wake unsteadiness suggests that such abrupt changes in geometry may be associated with the transition to turbulence.
Goswami & Hemmati (Reference Goswami and Hemmati2022) studied the wake of small aspect ratio wall-mounted prisms with increasing depth ratio at low Reynolds numbers, and observed the suppression of spatio-temporal features with depth ratio. Previously, Rastan et al. (Reference Rastan, Shahbazi, Sohankar, Alam and Zhou2021) made similar observations at Reynolds number
 $Re = 1.2\times 10^4$
, which is within the moderate range of Reynolds numbers (
$Re = 1.2\times 10^4$
, which is within the moderate range of Reynolds numbers (
 $10^3 \ll Re\ll 10^4$
). They demonstrated that increasing the prism depth ratio led to diminished vortex shedding, which was attributed to the suppressed interactions between the separating shear layer and the wake. This suppression was linked to strengthening of the downwash flow. Zargar et al. (Reference Zargar, Tarokh and Hemmati2022) further demonstrated that increasing the Reynolds number above
$10^3 \ll Re\ll 10^4$
). They demonstrated that increasing the prism depth ratio led to diminished vortex shedding, which was attributed to the suppressed interactions between the separating shear layer and the wake. This suppression was linked to strengthening of the downwash flow. Zargar et al. (Reference Zargar, Tarokh and Hemmati2022) further demonstrated that increasing the Reynolds number above
 $750$
for a large-depth-ratio prism (
$750$
for a large-depth-ratio prism (
 $DR = 5$
) leads to an irregular (unstable) unsteady regime resembling a transitional state. The irregular shedding resulted in flow reattachment and subsequent detachment from the prism surfaces. The majority of studies on wall-mounted prisms have focused on low (
$DR = 5$
) leads to an irregular (unstable) unsteady regime resembling a transitional state. The irregular shedding resulted in flow reattachment and subsequent detachment from the prism surfaces. The majority of studies on wall-mounted prisms have focused on low (
 $10^2\leqslant Re\leqslant 10^3$
) and high (
$10^2\leqslant Re\leqslant 10^3$
) and high (
 $Re\geqslant 10^4$
) Reynolds number ranges, with limited attention given to the moderate range of Reynolds numbers. The moderate Reynolds number range (
$Re\geqslant 10^4$
) Reynolds number ranges, with limited attention given to the moderate range of Reynolds numbers. The moderate Reynolds number range (
 $10^3 \leqslant Re\leqslant 10^4$
) is associated with the onset of complex flow phenomena for wall-mounted long prisms (Zargar et al. Reference Zargar, Tarokh and Hemmati2022), including transition to turbulence in the wake, which significantly influences the wake dynamics and aerodynamic forces. Understanding these phenomena is crucial for applications involving wall-mounted prisms, as they can significantly influence the wake dynamics and consequently the aerodynamic forces and structural response (Martinuzzi Reference Martinuzzi2008; Hemmati et al. Reference Hemmati, Wood and Martinuzzi2016; Zargar et al. Reference Zargar, Tarokh and Hemmati2022). As such, it is important to investigate and characterize the wake of wall-mounted prisms in this regime.
$10^3 \leqslant Re\leqslant 10^4$
) is associated with the onset of complex flow phenomena for wall-mounted long prisms (Zargar et al. Reference Zargar, Tarokh and Hemmati2022), including transition to turbulence in the wake, which significantly influences the wake dynamics and aerodynamic forces. Understanding these phenomena is crucial for applications involving wall-mounted prisms, as they can significantly influence the wake dynamics and consequently the aerodynamic forces and structural response (Martinuzzi Reference Martinuzzi2008; Hemmati et al. Reference Hemmati, Wood and Martinuzzi2016; Zargar et al. Reference Zargar, Tarokh and Hemmati2022). As such, it is important to investigate and characterize the wake of wall-mounted prisms in this regime.
Previously, the influence of depth ratio on global unsteadiness and interactions between Kelvin–Helmholtz instability (KHI) and large-scale vortex shedding have been reported for infinite-span suspended prisms (Zhang et al. Reference Zhang, Kareem, Xu and Jiang2023). However, these interactions differ significantly compared to the case of wall-mounted prisms, due mainly to the infinite-span nature of the prisms, where the wake is bounded by free-end effects (Wang & Zhou Reference Wang and Zhou2009). Thus in the context of wall-mounted prisms, interactions between KHI and large-scale vortex shedding, influenced by depth ratio and free-end effects, have not been quantified in the past literature. The current study investigates the role of depth ratio in turbulence transition at
 $10^3\leqslant Re\leqslant 10^4$
. Specifically, this study investigates the possibility of enhanced momentum transport with increasing depth ratio as a precursor to wake transition. We hypothesize that an unsteady shear layer may enhance interactions between leading-edge shear layer instabilities and prism surfaces, particularly at large depth ratios. This enhanced interaction could elevate flow momentum and potentially contribute to the transition phenomenon.
$10^3\leqslant Re\leqslant 10^4$
. Specifically, this study investigates the possibility of enhanced momentum transport with increasing depth ratio as a precursor to wake transition. We hypothesize that an unsteady shear layer may enhance interactions between leading-edge shear layer instabilities and prism surfaces, particularly at large depth ratios. This enhanced interaction could elevate flow momentum and potentially contribute to the transition phenomenon.
Numerical investigations are performed at Reynolds numbers
 $1\times 10^3{-}5\times 10^3$
for wall-mounted prisms with aspect ratios
$1\times 10^3{-}5\times 10^3$
for wall-mounted prisms with aspect ratios
 $0.25{-}1.5$
and a range of depth ratios (
$0.25{-}1.5$
and a range of depth ratios (
 $1{-}4$
). For brevity, we focus our main analysis on the case
$1{-}4$
). For brevity, we focus our main analysis on the case
 $Re = 2.5\times 10^3$
,
$Re = 2.5\times 10^3$
,
 $AR = 1$
and
$AR = 1$
and
 $DR = 1$
and
$DR = 1$
and
 $4$
, which avails investigation of the wake at extreme geometrical settings. Observations and insights from these specific cases are then expanded across the broad parameter space considered in this study and presented later on. The results are discussed in the context of the unsteady shear layer, wake frequency signatures, and enhanced interactions using the Poisson equation. Finally, the triadic interactions are quantified using bi-spectral mode decomposition to further understand the transition phenomenon. This paper is structured as follows. Section 2 presents the problem description, followed by the results in § 3. Finally, the conclusions are presented in § 4.
$4$
, which avails investigation of the wake at extreme geometrical settings. Observations and insights from these specific cases are then expanded across the broad parameter space considered in this study and presented later on. The results are discussed in the context of the unsteady shear layer, wake frequency signatures, and enhanced interactions using the Poisson equation. Finally, the triadic interactions are quantified using bi-spectral mode decomposition to further understand the transition phenomenon. This paper is structured as follows. Section 2 presents the problem description, followed by the results in § 3. Finally, the conclusions are presented in § 4.
Table 1. Parametric space of the study.


Figure 1. Computational domain (not to scale) and spatial grid distribution for the wall-mounted thin prism with
 $DR = 4$
, presented in top view at
$DR = 4$
, presented in top view at
 $y/d = 0.5$
(top) and side view at
$y/d = 0.5$
(top) and side view at
 $z/d = 0$
(bottom).
$z/d = 0$
(bottom).

Figure 2. (a) Distribution of the time-averaged values and root mean square (r.m.s.) of the streamwise velocity (
 $\overline {u}$
and
$\overline {u}$
and
 $u^\prime$
) at the location of the leading edge of the prism at
$u^\prime$
) at the location of the leading edge of the prism at
 $Re = 2.5\times 10^3$
. (b) Distribution of the time-averaged streamwise velocity (
$Re = 2.5\times 10^3$
. (b) Distribution of the time-averaged streamwise velocity (
 $\overline {u}$
) at the location of the leading edge of the prism at
$\overline {u}$
) at the location of the leading edge of the prism at
 $Re = 1\times 10^3, 2.5\times 10^3, 5\times 10^3$
. Measurements were performed in the absence of the prism. The dashed line shows the boundary layer thickness (
$Re = 1\times 10^3, 2.5\times 10^3, 5\times 10^3$
. Measurements were performed in the absence of the prism. The dashed line shows the boundary layer thickness (
 $\delta /d$
).
$\delta /d$
).
2. Problem description
Large-eddy simulations (LES) with the dynamic Smagorinsky sub-grid scale model (Durbin & Reif Reference Durbin and Reif2011) within OpenFOAM were utilized to study the wake. The computational domain consisted of a rectangular prism with aspect ratios
 $AR = h/d=0.25, 0.5, 1, 1.5$
and depth ratios
$AR = h/d=0.25, 0.5, 1, 1.5$
and depth ratios
 $DR = l/d=1,2,3,4$
mounted on the base of the domain with dimensions
$DR = l/d=1,2,3,4$
mounted on the base of the domain with dimensions
 $L_u = 10d$
,
$L_u = 10d$
,
 $L_d = 20d$
,
$L_d = 20d$
,
 $H = 6d$
and
$H = 6d$
and
 $W = 12d$
. Numerical simulations were performed at Reynolds numbers
$W = 12d$
. Numerical simulations were performed at Reynolds numbers
 $Re = U_bd/\nu = 1\times 10^3 {-}5\times 10^3$
, with increments of
$Re = U_bd/\nu = 1\times 10^3 {-}5\times 10^3$
, with increments of
 $0.5\times 10^3$
, where
$0.5\times 10^3$
, where
 $U_b$
is the bulk velocity,
$U_b$
is the bulk velocity,
 $d$
is the width of the prism, and
$d$
is the width of the prism, and
 $\nu$
is the kinematic viscosity. The parametric space of the study is presented in table 1. A non-homogeneous structured grid consisting of
$\nu$
is the kinematic viscosity. The parametric space of the study is presented in table 1. A non-homogeneous structured grid consisting of
 $25\times 10^6$
and
$25\times 10^6$
and
 $40\times 10^6$
elements, depending on the depth ratio, was developed for this study. Domain and grid for the case
$40\times 10^6$
elements, depending on the depth ratio, was developed for this study. Domain and grid for the case
 $DR = 4$
are presented in figure 1. The inlet boundary conditions were set to uniform flow (
$DR = 4$
are presented in figure 1. The inlet boundary conditions were set to uniform flow (
 $u = U_b, v = w = 0$
), with an outflow boundary condition (
$u = U_b, v = w = 0$
), with an outflow boundary condition (
 $\partial u/\partial n = \partial p/\partial n = 0$
) applied at the outlet. Ceiling and lateral boundaries were modelled as free-slip, while a no-slip wall condition was imposed on the ground and the prism. This computational set-up closely resembled that of Goswami & Hemmati (Reference Goswami and Hemmati2022, Reference Goswami and Hemmati2023). The natural boundary layer thickness (
$\partial u/\partial n = \partial p/\partial n = 0$
) applied at the outlet. Ceiling and lateral boundaries were modelled as free-slip, while a no-slip wall condition was imposed on the ground and the prism. This computational set-up closely resembled that of Goswami & Hemmati (Reference Goswami and Hemmati2022, Reference Goswami and Hemmati2023). The natural boundary layer thickness (
 $\delta$
) varied between
$\delta$
) varied between
 $\delta /d\approx 1.5$
and
$\delta /d\approx 1.5$
and
 $\delta /d\approx 1$
for
$\delta /d\approx 1$
for
 $Re = 1\times 10^3$
and
$Re = 1\times 10^3$
and
 $5\times 10^3$
, respectively, when simulating the flow without placing the prism in the domain. Boundary layer thickness was determined as the distance from the wall to the location where the streamwise mean velocity reaches
$5\times 10^3$
, respectively, when simulating the flow without placing the prism in the domain. Boundary layer thickness was determined as the distance from the wall to the location where the streamwise mean velocity reaches
 $99\,\%$
of the free-stream velocity. As an example, the boundary-layer thickness at
$99\,\%$
of the free-stream velocity. As an example, the boundary-layer thickness at
 $Re = 2.5\times 10^3$
was
$Re = 2.5\times 10^3$
was
 $\delta /d\approx 1.2$
, as shown in figure 2(a). Since the boundary layer thickness changes with Reynolds number (see figure 2
b), implications of boundary layer thickness and dynamics on the wake topology is naturally incorporated in the current analysis. As noted by Behera & Saha (Reference Behera and Saha2019), the implications of boundary layer thickness on the wake are negligible considering a small (
$\delta /d\approx 1.2$
, as shown in figure 2(a). Since the boundary layer thickness changes with Reynolds number (see figure 2
b), implications of boundary layer thickness and dynamics on the wake topology is naturally incorporated in the current analysis. As noted by Behera & Saha (Reference Behera and Saha2019), the implications of boundary layer thickness on the wake are negligible considering a small (
 $\sim 10\,\%$
) variation in
$\sim 10\,\%$
) variation in
 $\delta$
. In the current study, the change in
$\delta$
. In the current study, the change in
 $\delta$
is
$\delta$
is
 $\sim 8\,\%$
. A thick boundary layer (
$\sim 8\,\%$
. A thick boundary layer (
 $\delta /h\geqslant 1$
, fully submerged body) is considered in the current study, which means that the oncoming flow over the prism length plays a significant role in dictating the wake characteristics through variations in the strength of the separated vortex sheet over the prism length (Bourgeois et al. Reference Bourgeois, Sattari and Martinuzzi2011).
$\delta /h\geqslant 1$
, fully submerged body) is considered in the current study, which means that the oncoming flow over the prism length plays a significant role in dictating the wake characteristics through variations in the strength of the separated vortex sheet over the prism length (Bourgeois et al. Reference Bourgeois, Sattari and Martinuzzi2011).
Table 2. Domain and grid sensitivity analysis results for wall mounted prism with
 $DR = 4$
at
$DR = 4$
at
 $Re = 2.5\times 10^3$
. The relative error is calculated with respect to domain 2 and grid 4, respectively.
$Re = 2.5\times 10^3$
. The relative error is calculated with respect to domain 2 and grid 4, respectively.

Second-order implicit backward Euler numerical schemes were used for temporal discretization, and the diffusive and convective fluxes were approximated using central difference schemes. The discretized equations were then solved using a pressure implicit with splitting operator (PISO) algorithm (Goswami & Hemmati Reference Goswami and Hemmati2024). Time-marching simulations were performed by adjusting the temporal grid to maintain a maximum Courant number below
 $0.8$
. Moreover, the time step size (
$0.8$
. Moreover, the time step size (
 $\Delta t^* = \Delta t\, U_b/d = 0.001$
) was selected such that the ratio of eddy turnover time (
$\Delta t^* = \Delta t\, U_b/d = 0.001$
) was selected such that the ratio of eddy turnover time (
 $\tau _\eta$
) to
$\tau _\eta$
) to
 $\Delta t$
for the smallest dissipative eddy (Pope Reference Pope2001) yields at least 50 time steps. All simulations continued for
$\Delta t$
for the smallest dissipative eddy (Pope Reference Pope2001) yields at least 50 time steps. All simulations continued for
 $150$
vortex shedding cycles, while the last
$150$
vortex shedding cycles, while the last
 $100$
cycles were used for post-processing. This duration ensured that transient effects from the initial conditions had dissipated (Hemmati et al. Reference Hemmati, Wood and Martinuzzi2018). The sampling frequency of data used for spectral analysis was
$100$
cycles were used for post-processing. This duration ensured that transient effects from the initial conditions had dissipated (Hemmati et al. Reference Hemmati, Wood and Martinuzzi2018). The sampling frequency of data used for spectral analysis was
 $f_s^\ast \approx 500$
, based on the simulation time step, such that data were collected every time step. Simulations were completed on a Digital Research Alliance of Canada computing cluster, utilizing 256 Intel
$f_s^\ast \approx 500$
, based on the simulation time step, such that data were collected every time step. Simulations were completed on a Digital Research Alliance of Canada computing cluster, utilizing 256 Intel
 $E5{-}2683$
v4 Broadwell cores with 125 GB of shared memory, requiring
$E5{-}2683$
v4 Broadwell cores with 125 GB of shared memory, requiring
 $6\times 10^5$
core hours in total.
$6\times 10^5$
core hours in total.
2.1. Verification and validation
Numerical simulations were verified by evaluating the sensitivity of results to domain size and grid resolution. To start, we acknowledge that the present computational domain was designed larger than those employed in previous studies (Saha Reference Saha2013; Rastan et al. Reference Rastan, Shahbazi, Sohankar, Alam and Zhou2021). The set-up, domain and grid configuration were adopted from Goswami & Hemmati (Reference Goswami and Hemmati2022, Reference Goswami and Hemmati2023). Blockage ratio (
 $\beta$
) and domain height (
$\beta$
) and domain height (
 $H$
) were set as
$H$
) were set as
 $0.01$
and
$0.01$
and
 $6d$
, respectively. These criterion followed the practices of Sohankar et al. (Reference Sohankar, Norberg and Davidson1998) and Saha (Reference Saha2013), which suggested
$6d$
, respectively. These criterion followed the practices of Sohankar et al. (Reference Sohankar, Norberg and Davidson1998) and Saha (Reference Saha2013), which suggested
 $\beta = (d\times h)/(W\times H)\leqslant 0.05$
and
$\beta = (d\times h)/(W\times H)\leqslant 0.05$
and
 $H\geqslant h + 5d$
, to ensure negligible effects of domain on the global flow features. Comparison of mean drag (
$H\geqslant h + 5d$
, to ensure negligible effects of domain on the global flow features. Comparison of mean drag (
 $\overline {C_d}$
) and lift (
$\overline {C_d}$
) and lift (
 $\overline {C_l}$
) coefficients in table 2 indicated a negligible influence of the domain size, with domain 2 (
$\overline {C_l}$
) coefficients in table 2 indicated a negligible influence of the domain size, with domain 2 (
 $30d\times 6d\times 12d$
) being sufficient to capture the flow features of interest. Moreover, the root mean square (r.m.s.) of drag, lift and side force obtained from domains 2 and 3 are in close agreement. Domain sensitivity was further investigated in figure 3 by comparing mean and turbulent flow profiles at
$30d\times 6d\times 12d$
) being sufficient to capture the flow features of interest. Moreover, the root mean square (r.m.s.) of drag, lift and side force obtained from domains 2 and 3 are in close agreement. Domain sensitivity was further investigated in figure 3 by comparing mean and turbulent flow profiles at
 $x/d = 1$
downstream of the prism. The results in figure 3 further suggests a close agreement between domains 2 and 3, while the influnce of blockage is apparent in domain 1. As such, domain 2 is selected for the present study.
$x/d = 1$
downstream of the prism. The results in figure 3 further suggests a close agreement between domains 2 and 3, while the influnce of blockage is apparent in domain 1. As such, domain 2 is selected for the present study.

Figure 3. Effect of domain size on mean and turbulent wake characteristics at
 $x/d = 1$
and
$x/d = 1$
and
 $y/d = 1$
for prism with
$y/d = 1$
for prism with
 $DR = 4$
at
$DR = 4$
at
 $Re = 2.5\times 10^3$
. Shown are (a)
$Re = 2.5\times 10^3$
. Shown are (a)
 $\overline {u}$
and (b)
$\overline {u}$
and (b)
 $\overline {u^\prime u^\prime }$
.
$\overline {u^\prime u^\prime }$
.
Grid sensitivity was assessed using four grids that were successively refined to include
 $5.1\times 10^6$
,
$5.1\times 10^6$
,
 $15.1\times 10^6$
,
$15.1\times 10^6$
,
 $19.6\times 10^6$
and
$19.6\times 10^6$
and
 $25.2\times 10^6$
elements. Relative errors in the mean drag (
$25.2\times 10^6$
elements. Relative errors in the mean drag (
 $\overline {C_d}$
) and lift (
$\overline {C_d}$
) and lift (
 $\overline {C_l}$
) between grids 3 and 4 were below
$\overline {C_l}$
) between grids 3 and 4 were below
 $1\,\%$
, indicating grid convergence for grid 3 (details in table 2). Furthermore, the r.m.s. values of drag, lift and side force obtained from grids 3 and 4 are in close agreement. A maximum deviation
$1\,\%$
, indicating grid convergence for grid 3 (details in table 2). Furthermore, the r.m.s. values of drag, lift and side force obtained from grids 3 and 4 are in close agreement. A maximum deviation
 $\sim 0.1\,\%$
was noted for the r.m.s. of lift, while the side force coefficient remained constant at
$\sim 0.1\,\%$
was noted for the r.m.s. of lift, while the side force coefficient remained constant at
 $C_s^\prime = 0$
for all grids and domains. The side force coefficient is expected to be zero for the current set-up due to the symmetric nature of the time-averaged flow around the prism in the lateral direction. Here, drag and lift coefficients relate to mean axial (
$C_s^\prime = 0$
for all grids and domains. The side force coefficient is expected to be zero for the current set-up due to the symmetric nature of the time-averaged flow around the prism in the lateral direction. Here, drag and lift coefficients relate to mean axial (
 $\overline {F}_x$
) and normal (
$\overline {F}_x$
) and normal (
 $\overline {F}_y$
) forces, respectively. Further, the sensitivities of mean and turbulent flow to changing grid sizes are examined in figure 4 by comparing their profiles at
$\overline {F}_y$
) forces, respectively. Further, the sensitivities of mean and turbulent flow to changing grid sizes are examined in figure 4 by comparing their profiles at
 $x/d = 2$
downstream of the prism. Only one axial location is presented for brevity. Comparisons in figure 4 showed excellent agreement with
$x/d = 2$
downstream of the prism. Only one axial location is presented for brevity. Comparisons in figure 4 showed excellent agreement with
 $\lt 1\,\%$
deviation between grids 3 and 4. This suggests that the grid resolution for grid 3 is sufficient to capture the flow features of interest.
$\lt 1\,\%$
deviation between grids 3 and 4. This suggests that the grid resolution for grid 3 is sufficient to capture the flow features of interest.

Figure 4. Effect of grid size on mean and turbulent wake characteristics at
 $x/d = 2$
and
$x/d = 2$
and
 $y/d = 0.5$
for prism with
$y/d = 0.5$
for prism with
 $DR = 4$
at
$DR = 4$
at
 $Re = 2.5\times 10^3$
. Shown are (a)
$Re = 2.5\times 10^3$
. Shown are (a)
 $\overline {u}$
and (b)
$\overline {u}$
and (b)
 $\overline {u^\prime u^\prime }$
.
$\overline {u^\prime u^\prime }$
.

Figure 5. Contours of the ratio of grid size to Kolmogorov length scale (
 $\varDelta /\eta$
) at (a)
$\varDelta /\eta$
) at (a)
 $z/d = 0$
and (b)
$z/d = 0$
and (b)
 $y/d = 0.5$
, for the case
$y/d = 0.5$
, for the case
 $DR = 4$
at
$DR = 4$
at
 $Re = 2.5\times 10^3$
.
$Re = 2.5\times 10^3$
.
The present study necessitates accurate resolution of the smallest resolvable flow features, such as the leading-edge shear layer and the wake structures in the immediate vicinity of the prism. To this end, the grid size should be comparable to the Kolmogorov length scale (Moin & Mahesh Reference Moin and Mahesh1998). Therefore, we investigate the ratio of grid size (
 $\varDelta$
) to Kolmogorov length scale (
$\varDelta$
) to Kolmogorov length scale (
 $\eta$
) for further verification. Kolmogorov length scale is defined as
$\eta$
) for further verification. Kolmogorov length scale is defined as
 $\eta = (\nu ^3/\epsilon )^{1/4}$
, where
$\eta = (\nu ^3/\epsilon )^{1/4}$
, where
 $\nu$
is the kinematic viscosity,
$\nu$
is the kinematic viscosity,
 $\epsilon = 2\nu (s^\prime _{ij}s^\prime _{ij})$
is the turbulent energy dissipation rate, and
$\epsilon = 2\nu (s^\prime _{ij}s^\prime _{ij})$
is the turbulent energy dissipation rate, and
 $s^\prime _{ij}$
is the strain-rate tensor given as
$s^\prime _{ij}$
is the strain-rate tensor given as
 $s^\prime _{ij} = \tfrac {1}{2}({\partial u^\prime _j}/{\partial x_i} + {\partial u^\prime _i}/{\partial x_j})$
(Pope Reference Pope2001). The grid size is calculated as
$s^\prime _{ij} = \tfrac {1}{2}({\partial u^\prime _j}/{\partial x_i} + {\partial u^\prime _i}/{\partial x_j})$
(Pope Reference Pope2001). The grid size is calculated as
 $\varDelta = \sqrt [3]{\Delta x\times \Delta y\times \Delta z}$
. Using direct numerical simulations, Yakhot et al. (Reference Yakhot, Liu and Nikitin2006) and Saeedi et al. (Reference Saeedi, LePoudre and Wang2014) suggested
$\varDelta = \sqrt [3]{\Delta x\times \Delta y\times \Delta z}$
. Using direct numerical simulations, Yakhot et al. (Reference Yakhot, Liu and Nikitin2006) and Saeedi et al. (Reference Saeedi, LePoudre and Wang2014) suggested
 $\varDelta /\eta = 2{-}5$
in the critical regions of the wake of wall-mounted prisms. Additionally, Celik et al. (Reference Celik, Klein and Janicka2009) and Rastan et al. (Reference Rastan, Shahbazi, Sohankar, Alam and Zhou2021) recommended
$\varDelta /\eta = 2{-}5$
in the critical regions of the wake of wall-mounted prisms. Additionally, Celik et al. (Reference Celik, Klein and Janicka2009) and Rastan et al. (Reference Rastan, Shahbazi, Sohankar, Alam and Zhou2021) recommended
 $20\leqslant \varDelta /\eta \leqslant 40$
for LES. Contours of
$20\leqslant \varDelta /\eta \leqslant 40$
for LES. Contours of
 $\varDelta /\eta$
are presented in figure 5 on both the normal (
$\varDelta /\eta$
are presented in figure 5 on both the normal (
 $y/d = 0.5$
) and spanwise (
$y/d = 0.5$
) and spanwise (
 $z/d = 0$
) planes for the prism with
$z/d = 0$
) planes for the prism with
 $DR = 4$
. The results demonstrate that maximum
$DR = 4$
. The results demonstrate that maximum
 $\varDelta /\eta$
is
$\varDelta /\eta$
is
 $\sim 5$
at
$\sim 5$
at
 $x/d = 15$
, with
$x/d = 15$
, with
 $\varDelta /\eta$
between
$\varDelta /\eta$
between
 $1$
and
$1$
and
 $3$
in the immediate vicinity of the prism. This indicates that the resolution of grid 3 is sufficient to capture the critical flow features.
$3$
in the immediate vicinity of the prism. This indicates that the resolution of grid 3 is sufficient to capture the critical flow features.

Figure 6. Comparison of (a) mean axial velocity (
 $\overline {u}$
) and (b) r.m.s. velocity (
$\overline {u}$
) and (b) r.m.s. velocity (
 $u^\prime _{rms}$
) profiles obtained from LES with the experimental results of Saeedi et al. (Reference Saeedi, LePoudre and Wang2014).
$u^\prime _{rms}$
) profiles obtained from LES with the experimental results of Saeedi et al. (Reference Saeedi, LePoudre and Wang2014).
Due to a lack of existing experimental data for our specific case (prism with
 $DR = 4$
,
$DR = 4$
,
 $Re = 2.5\times 10^3$
), we adopted an alternate validation approach. We mimicked the set-up of Saeedi et al. (Reference Saeedi, LePoudre and Wang2014) for an
$Re = 2.5\times 10^3$
), we adopted an alternate validation approach. We mimicked the set-up of Saeedi et al. (Reference Saeedi, LePoudre and Wang2014) for an
 $AR = 4$
prism at
$AR = 4$
prism at
 $Re = 1.2\times 10^5$
using LES. The LES grid resolution and computational set-up mirrored the present study. Mean axial velocity profiles from the LES agreed well with Saeedi et al. (Reference Saeedi, LePoudre and Wang2014), such that we had less than
$Re = 1.2\times 10^5$
using LES. The LES grid resolution and computational set-up mirrored the present study. Mean axial velocity profiles from the LES agreed well with Saeedi et al. (Reference Saeedi, LePoudre and Wang2014), such that we had less than
 $5\,\%$
deviation (figure 6
a). Figure 6(b) further shows satisfactory agreement between LES and experimental results in capturing the r.m.s. velocity profiles. The trends at the peak and into the wake are well reproduced by the numerical simulations. This outcome validated our numerical set-up.
$5\,\%$
deviation (figure 6
a). Figure 6(b) further shows satisfactory agreement between LES and experimental results in capturing the r.m.s. velocity profiles. The trends at the peak and into the wake are well reproduced by the numerical simulations. This outcome validated our numerical set-up.
3. Results and discussion

Figure 7. (a,b) Mean streamwise velocity (
 $\overline {u}$
) and (c,d) turbulent kinetic energy (
$\overline {u}$
) and (c,d) turbulent kinetic energy (
 $k$
) contours overlaid with mean velocity streamlines for (a,c)
$k$
) contours overlaid with mean velocity streamlines for (a,c)
 $DR = 1$
and (b,d)
$DR = 1$
and (b,d)
 $DR = 4$
prisms.
$DR = 4$
prisms.
We begin by reporting the main features of the mean flow. As shown in figures 7
(a) and 7(b), streamlines highlight the presence of flow separation at the leading edge, which in case
 $DR = 1$
prolongs into the wake and reattaches at
$DR = 1$
prolongs into the wake and reattaches at
 $x/d\approx 2.12$
for
$x/d\approx 2.12$
for
 $DR = 4$
. Reattachment length is quantified by tracing the time-averaged wall shear stress across the top surface of the
$DR = 4$
. Reattachment length is quantified by tracing the time-averaged wall shear stress across the top surface of the
 $DR = 4$
prism. A large-scale recirculation region is present on the top surface of
$DR = 4$
prism. A large-scale recirculation region is present on the top surface of
 $DR = 4$
, hereby referred to as the primary recirculation (PR) region. A second recirculation bubble is present below the PR region, noted as the secondary recirculation (SR) zone. Indeed, the reverse flow induced in the near-wall region of the PR forms a boundary layer moving upstream, resulting in the formation of the SR. Following the trailing-edge separation of the flow, a tertiary recirculation region is formed, referred to as the wake recirculation (WR) region. For a short prism, the absence of PR and SR is attributed to a lack of flow reattachment on the prism surfaces. As such, only WR is noted due to shedding of the leading-edge shear layer directly into the wake. Contours of turbulent kinetic energy (
$DR = 4$
, hereby referred to as the primary recirculation (PR) region. A second recirculation bubble is present below the PR region, noted as the secondary recirculation (SR) zone. Indeed, the reverse flow induced in the near-wall region of the PR forms a boundary layer moving upstream, resulting in the formation of the SR. Following the trailing-edge separation of the flow, a tertiary recirculation region is formed, referred to as the wake recirculation (WR) region. For a short prism, the absence of PR and SR is attributed to a lack of flow reattachment on the prism surfaces. As such, only WR is noted due to shedding of the leading-edge shear layer directly into the wake. Contours of turbulent kinetic energy (
 $k = (u_i^\prime u_i^\prime )/2$
) are presented in figures 7(c) and 7(d). Initially, both prisms highlight an almost laminar state of the leading-edge shear layer. Instabilities associated with the leading-edge shear layer amplify the intensity of fluctuating velocities, initiating the transition to turbulence (Wang & Zhou Reference Wang and Zhou2009). These regions of intense fluctuations result in high turbulence intensity (
$k = (u_i^\prime u_i^\prime )/2$
) are presented in figures 7(c) and 7(d). Initially, both prisms highlight an almost laminar state of the leading-edge shear layer. Instabilities associated with the leading-edge shear layer amplify the intensity of fluctuating velocities, initiating the transition to turbulence (Wang & Zhou Reference Wang and Zhou2009). These regions of intense fluctuations result in high turbulence intensity (
 $u_i^\prime$
), thus maximizing
$u_i^\prime$
), thus maximizing
 $k$
. For the larger prisms, maximum
$k$
. For the larger prisms, maximum
 $k$
occurs on the prism top surface, while the shorter prisms experience it in the wake. The region of maximum
$k$
occurs on the prism top surface, while the shorter prisms experience it in the wake. The region of maximum
 $k$
occurs in the primary vortex shedding region.
$k$
occurs in the primary vortex shedding region.

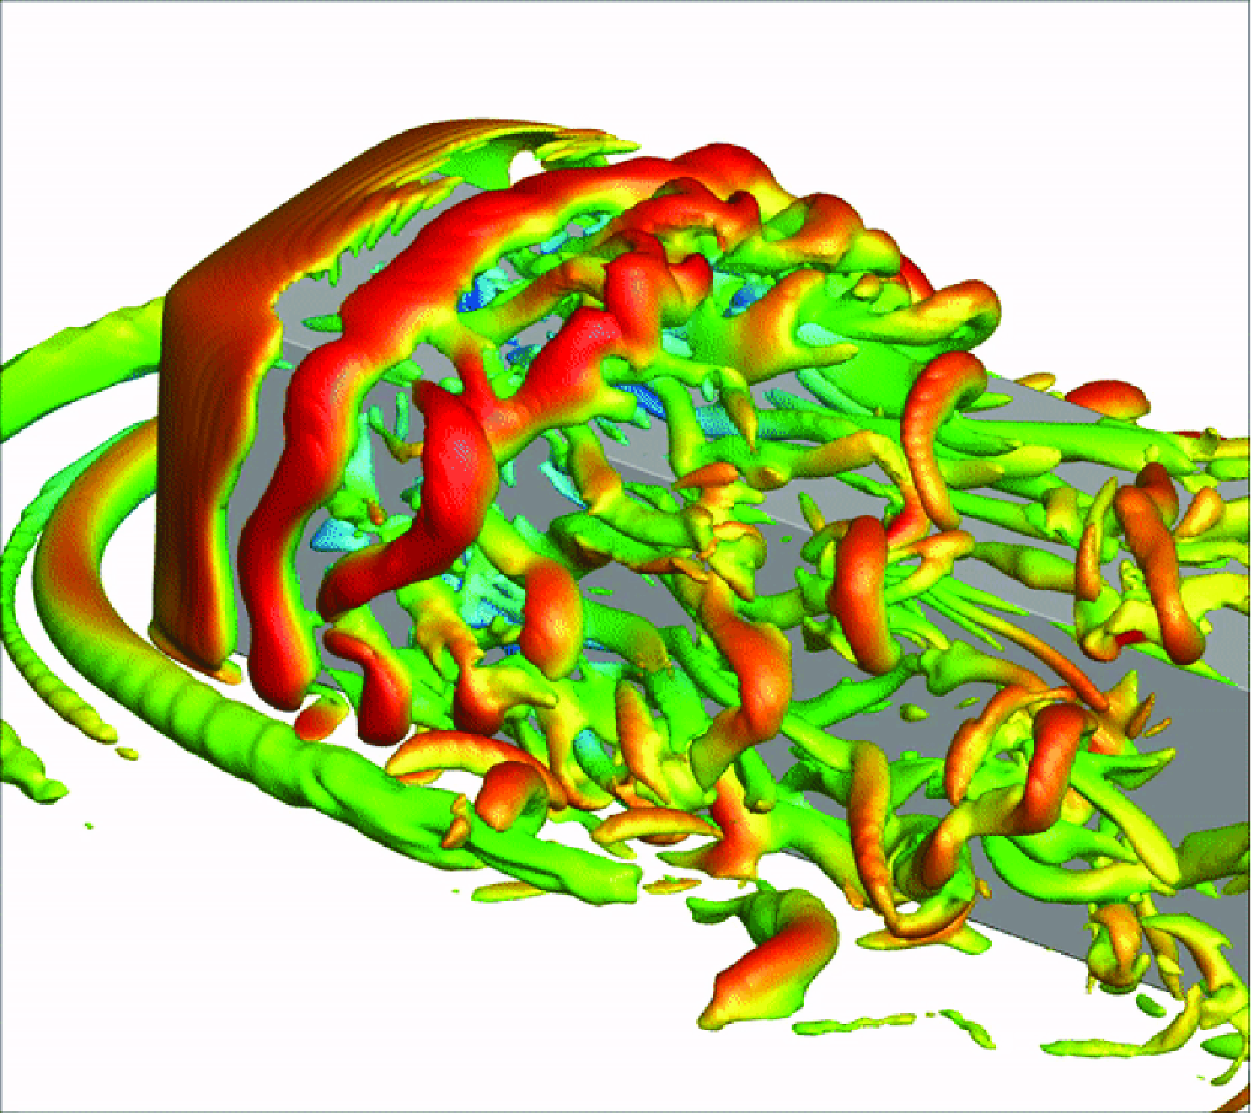
Figure 8. Instantaneous vortex structures overlaid with axial velocity (
 $u$
) contours for (a)
$u$
) contours for (a)
 $DR = 1$
and (b)
$DR = 1$
and (b)
 $DR = 4$
prisms identified using the
$DR = 4$
prisms identified using the
 $Q$
-criterion (
$Q$
-criterion (
 $Q^* = 1$
). Lateral view of the instantaneous vortex structures for (c)
$Q^* = 1$
). Lateral view of the instantaneous vortex structures for (c)
 $DR = 1$
and (d)
$DR = 1$
and (d)
 $DR = 4$
prisms.
$DR = 4$
prisms.

Figure 9. Distribution of maximum turbulent kinetic energy (
 $k_{{max} }$
) along the mid-span (
$k_{{max} }$
) along the mid-span (
 $z/d = 0$
) of both prisms at
$z/d = 0$
) of both prisms at
 $Re = 2.5\times 10^3$
.
$Re = 2.5\times 10^3$
.
Qualitative illustrations of instantaneous vortex structures for
 $DR = 1$
and
$DR = 1$
and
 $4$
are presented in figure 8. Following the leading-edge separation, the shear layer undergoes distinct stages of growth and primary instability formation (Moore et al. Reference Moore, Letchford and Amitay2019a). This triggers the formation of a KHI of the shear layer for both prisms, as evidenced by the finite spanwise vortex rollers forming near the leading edge. Such rollers are delayed and less frequent for
$4$
are presented in figure 8. Following the leading-edge separation, the shear layer undergoes distinct stages of growth and primary instability formation (Moore et al. Reference Moore, Letchford and Amitay2019a). This triggers the formation of a KHI of the shear layer for both prisms, as evidenced by the finite spanwise vortex rollers forming near the leading edge. Such rollers are delayed and less frequent for
 $DR = 1$
, and their formation occurs over a larger distance compared to
$DR = 1$
, and their formation occurs over a larger distance compared to
 $DR = 4$
. This is evident from the distrubution of maximum turbulent kinetic energy (
$DR = 4$
. This is evident from the distrubution of maximum turbulent kinetic energy (
 $k_{{max} }$
) along the mid-span (
$k_{{max} }$
) along the mid-span (
 $z/d = 0$
) of both prisms at
$z/d = 0$
) of both prisms at
 $Re = 2.5\times 10^3$
in figure 9. Previous studies (Moore et al. Reference Moore, Letchford and Amitay2019b) have used similar methods to identify the location of vortex roll-up behind sharp-edged bluff bodies. Figure 9 shows that the roll-up phenomenon, i.e. the location of maximum turbulent kinetic energy, is delayed for
$Re = 2.5\times 10^3$
in figure 9. Previous studies (Moore et al. Reference Moore, Letchford and Amitay2019b) have used similar methods to identify the location of vortex roll-up behind sharp-edged bluff bodies. Figure 9 shows that the roll-up phenomenon, i.e. the location of maximum turbulent kinetic energy, is delayed for
 $DR = 1$
compared to
$DR = 1$
compared to
 $DR = 4$
. In case
$DR = 4$
. In case
 $DR = 4$
, the roll-up occurs close to
$DR = 4$
, the roll-up occurs close to
 $x/d\approx 2$
, while it occurs at
$x/d\approx 2$
, while it occurs at
 $x/d\approx 3$
for
$x/d\approx 3$
for
 $DR = 1$
. These rollers become more prominent with increasing depth ratio. Thus there is evidence of a strong dependence on depth ratio for the generation of these instabilities. Evidence of the flow periodicity and frequency signatures is provided in § 3.2. Figures 8(c) and 8(d) presents the lateral view of the instantaneous vortex structures for
$DR = 1$
. These rollers become more prominent with increasing depth ratio. Thus there is evidence of a strong dependence on depth ratio for the generation of these instabilities. Evidence of the flow periodicity and frequency signatures is provided in § 3.2. Figures 8(c) and 8(d) presents the lateral view of the instantaneous vortex structures for
 $DR = 1$
and
$DR = 1$
and
 $4$
prisms. In case
$4$
prisms. In case
 $DR = 1$
, amplified quasi-periodic perturbations resulting from an unsteady shear layer are less frequent and delayed, whereas they are more pronounced for
$DR = 1$
, amplified quasi-periodic perturbations resulting from an unsteady shear layer are less frequent and delayed, whereas they are more pronounced for
 $DR = 4$
, and they occur more frequently, especially in the wake region (
$DR = 4$
, and they occur more frequently, especially in the wake region (
 $1\leqslant x/d\leqslant 6$
). As such, it becomes apparent that large-scale vortex shedding is more pronounced for
$1\leqslant x/d\leqslant 6$
). As such, it becomes apparent that large-scale vortex shedding is more pronounced for
 $DR = 4$
compared to
$DR = 4$
compared to
 $DR = 1$
. Following the leading-edge shear layer separation and instability development, flapping-like motion (Cimarelli et al. Reference Cimarelli, Leonforte and Angeli2018) leads to perturbations in the shear layer that amplify and propagate downstream, ultimately interacting with and influencing large-scale vortex shedding. Further evidence of shear layer flapping is presented in § 3.1, and discussion on interactions is presented in § 3.3.
$DR = 1$
. Following the leading-edge shear layer separation and instability development, flapping-like motion (Cimarelli et al. Reference Cimarelli, Leonforte and Angeli2018) leads to perturbations in the shear layer that amplify and propagate downstream, ultimately interacting with and influencing large-scale vortex shedding. Further evidence of shear layer flapping is presented in § 3.1, and discussion on interactions is presented in § 3.3.
Figure 10 present contours of spanwise vorticity (
 $\omega _z^*$
) for both prisms, superimposed with instantaneous streamlines and the isopleth of
$\omega _z^*$
) for both prisms, superimposed with instantaneous streamlines and the isopleth of
 $\overline {u} = 0$
at
$\overline {u} = 0$
at
 $z/d = 0$
. Formation of KHI rollers from the leading-edge shear layer is evident for both depth ratios. As presented in the insets, an early initiaion of KHI rollers is noted near the leading edge for
$z/d = 0$
. Formation of KHI rollers from the leading-edge shear layer is evident for both depth ratios. As presented in the insets, an early initiaion of KHI rollers is noted near the leading edge for
 $DR = 4$
compared to
$DR = 4$
compared to
 $DR = 1$
, where the instability appears in the wake at
$DR = 1$
, where the instability appears in the wake at
 $x/d\geqslant 1$
. The onset of KHI rollers is quantified by the streamwise position of the first appearance of spanwise vortices, which is at
$x/d\geqslant 1$
. The onset of KHI rollers is quantified by the streamwise position of the first appearance of spanwise vortices, which is at
 $x/d\approx 0.4$
and
$x/d\approx 0.4$
and
 $1$
for
$1$
for
 $DR = 4$
and
$DR = 4$
and
 $1$
, respectively. This indicates that depth ratio significantly influences the onset of KHI rollers in the wake of a wall-mounted prism. Furthermore, the leading-edge shear layer sheds directly into the wake for the case
$1$
, respectively. This indicates that depth ratio significantly influences the onset of KHI rollers in the wake of a wall-mounted prism. Furthermore, the leading-edge shear layer sheds directly into the wake for the case
 $DR = 1$
, while the flow reattaches on surfaces of the larger prism. The larger prism shows a prominent spanwise vortex shedding with hairpin-like vortices appearing over the prism surfaces. However, vortex shedding is suppressed by interactions between the separating shear layer and the wake in WR for the shorter prism. These observations, along with the formation of KHI rollers and their interaction with surfaces of the prism, are a precursor to the transition to turbulence in the wake of wall-mounted prisms.
$DR = 1$
, while the flow reattaches on surfaces of the larger prism. The larger prism shows a prominent spanwise vortex shedding with hairpin-like vortices appearing over the prism surfaces. However, vortex shedding is suppressed by interactions between the separating shear layer and the wake in WR for the shorter prism. These observations, along with the formation of KHI rollers and their interaction with surfaces of the prism, are a precursor to the transition to turbulence in the wake of wall-mounted prisms.

Figure 10. Contours of spanwise vorticity
 $\omega _z^*$
for (a)
$\omega _z^*$
for (a)
 $DR = 1$
and (b)
$DR = 1$
and (b)
 $DR = 4$
, superimposed with instantaneous streamlines and the isopleth of
$DR = 4$
, superimposed with instantaneous streamlines and the isopleth of
 $\overline {u} = 0$
(green line) at
$\overline {u} = 0$
(green line) at
 $z/d = 0$
.
$z/d = 0$
.
Previous studies have noted that the wake dynamics is significantly influenced by the depth ratio and aspect ratio of the prism, as well as the flow Reynolds number (Wang et al. Reference Wang, Zhou, Chan and Lam2006; Rastan et al. Reference Rastan, Shahbazi, Sohankar, Alam and Zhou2021; Zargar et al. Reference Zargar, Tarokh and Hemmati2022; Goswami & Hemmati Reference Goswami and Hemmati2022). Rastan et al. (Reference Rastan, Shahbazi, Sohankar, Alam and Zhou2021) showed that increasing depth ratio for a large-aspect-ratio prism resulted in decreased vortex shedding due to diminished interactions between the separating shear layer and the wake. This effect correlates with strengthening of the downwash flow. These results are consistent with the wake observed behind low-aspect-ratio prisms with changing depth ratio, where increasing depth ratio resulted in suppressed wake unsteadiness for
 $Re\leqslant 500$
(Goswami & Hemmati Reference Goswami and Hemmati2022). Further, Zargar et al. (Reference Zargar, Tarokh and Hemmati2022) demonstrated that increasing the Reynolds number beyond
$Re\leqslant 500$
(Goswami & Hemmati Reference Goswami and Hemmati2022). Further, Zargar et al. (Reference Zargar, Tarokh and Hemmati2022) demonstrated that increasing the Reynolds number beyond
 $750$
for a long prism (
$750$
for a long prism (
 $DR = 5$
) resulted in an irregular unsteady wake, resembling a transitional state. In summary, previous studies have indicated that increasing the depth ratio suppresses wake irregularity (Goswami & Hemmati Reference Goswami and Hemmati2022), while for a long prism, the wake evolves into an irregular unsteady wake with increasing Reynolds number (Zargar et al. Reference Zargar, Tarokh and Hemmati2022). This observation underscores the complexity of the flow dynamics around wall-mounted prisms, and suggests that multiple factors influence the interaction between the shear layer and wake structures, which results in wake transitions, such as the flow Reynolds number and prism geometry parameters. The present study portrays a novel perspective where the flow irregularity is enhanced with depth ratio. The current study focuses on the role of Reynolds number in the transition phenomenon, while investigating the influence of depth ratio on the wake dynamics. At moderate Reynolds numbers, the unsteadiness of the shear layer (Moore et al. Reference Moore, Letchford and Amitay2019a) is stronger, interacting with the prism surfaces and elevating the flow momentum in this region due to large depth ratio. This further enhances the interactions between KHI and the wake coherent structures, leading to the wake transition. Evidence of this mechanism is discussed further in this paper by first presenting the unsteady shear layer motion, followed by the wake frequency signatures, and enhanced interactions using the Poisson equation. Finally, the triadic interactions are quantified using bi-spectral mode decomposition (BMD) to further understand the transition phenomenon. Here, we look at the interactions between KHI and the large-scale vortex shedding.
$DR = 5$
) resulted in an irregular unsteady wake, resembling a transitional state. In summary, previous studies have indicated that increasing the depth ratio suppresses wake irregularity (Goswami & Hemmati Reference Goswami and Hemmati2022), while for a long prism, the wake evolves into an irregular unsteady wake with increasing Reynolds number (Zargar et al. Reference Zargar, Tarokh and Hemmati2022). This observation underscores the complexity of the flow dynamics around wall-mounted prisms, and suggests that multiple factors influence the interaction between the shear layer and wake structures, which results in wake transitions, such as the flow Reynolds number and prism geometry parameters. The present study portrays a novel perspective where the flow irregularity is enhanced with depth ratio. The current study focuses on the role of Reynolds number in the transition phenomenon, while investigating the influence of depth ratio on the wake dynamics. At moderate Reynolds numbers, the unsteadiness of the shear layer (Moore et al. Reference Moore, Letchford and Amitay2019a) is stronger, interacting with the prism surfaces and elevating the flow momentum in this region due to large depth ratio. This further enhances the interactions between KHI and the wake coherent structures, leading to the wake transition. Evidence of this mechanism is discussed further in this paper by first presenting the unsteady shear layer motion, followed by the wake frequency signatures, and enhanced interactions using the Poisson equation. Finally, the triadic interactions are quantified using bi-spectral mode decomposition (BMD) to further understand the transition phenomenon. Here, we look at the interactions between KHI and the large-scale vortex shedding.
3.1. Unsteady shear-layer motion

Figure 11. Axial wall pressure gradient (
 $\partial p_w/\partial x$
) along the mid-span (
$\partial p_w/\partial x$
) along the mid-span (
 $z/d = 0$
) of both prisms at
$z/d = 0$
) of both prisms at
 $Re = 2.5\times 10^3$
.
$Re = 2.5\times 10^3$
.
We begin by first investigating the axial wall pressure gradient along the mid-span (
 $z/d = 0$
) of both prisms at
$z/d = 0$
) of both prisms at
 $Re = 2.5\times 10^3$
in figure 11. The rapid increase in pressure gradient near the leading edge is attributed to streamwise flow compression due to an abrupt flow separation at the leading edge (Obabko & Cassel Reference Obabko and Cassel2002). This yields a favourable pressure gradient, indicated by an overshoot of
$Re = 2.5\times 10^3$
in figure 11. The rapid increase in pressure gradient near the leading edge is attributed to streamwise flow compression due to an abrupt flow separation at the leading edge (Obabko & Cassel Reference Obabko and Cassel2002). This yields a favourable pressure gradient, indicated by an overshoot of
 $\partial p_w/\partial x$
towards a positive value. Then the pressure gradient recovers for
$\partial p_w/\partial x$
towards a positive value. Then the pressure gradient recovers for
 $DR = 1$
due to the absence of flow reattachment and shedding of the shea layer into the wake. For
$DR = 1$
due to the absence of flow reattachment and shedding of the shea layer into the wake. For
 $DR = 4$
, the pressure gradient remains elevated due to the reattachment of the shear layer on the prism surfaces. The elevated pressure gradients feature oscillatory motion, which results in flow compression and expansion (Obabko & Cassel Reference Obabko and Cassel2002). This leads to an unsteady shear layer characterized by flapping-like motion. Similar oscillatory shear-layer motions are observed in infinite-span prisms (Kiya & Sasaki Reference Kiya and Sasaki1983; Cimarelli et al. Reference Cimarelli, Leonforte and Angeli2018) as well as in two-dimensional forward–backward-facing steps (Fang & Tachie Reference Fang and Tachie2019). The unstable shear layer motion is associated with the formation of large-scale structures in the wake and their interactions, which are responsible for the momentum transport and mixing processes (More et al. Reference More, Dutta, Chauhan and Gandhi2015; Moore et al. Reference Moore, Letchford and Amitay2019a).
$DR = 4$
, the pressure gradient remains elevated due to the reattachment of the shear layer on the prism surfaces. The elevated pressure gradients feature oscillatory motion, which results in flow compression and expansion (Obabko & Cassel Reference Obabko and Cassel2002). This leads to an unsteady shear layer characterized by flapping-like motion. Similar oscillatory shear-layer motions are observed in infinite-span prisms (Kiya & Sasaki Reference Kiya and Sasaki1983; Cimarelli et al. Reference Cimarelli, Leonforte and Angeli2018) as well as in two-dimensional forward–backward-facing steps (Fang & Tachie Reference Fang and Tachie2019). The unstable shear layer motion is associated with the formation of large-scale structures in the wake and their interactions, which are responsible for the momentum transport and mixing processes (More et al. Reference More, Dutta, Chauhan and Gandhi2015; Moore et al. Reference Moore, Letchford and Amitay2019a).
Unsteady motion of the shear layer is analysed quantitatively using the wall shear stress (
 $\tau _w = \mu \,\partial u/\partial y$
) along the top surface of the long prism, as depicted in figure 12. Temporal variations between the mean reattachment point are recognized by the border between the reverse flow (
$\tau _w = \mu \,\partial u/\partial y$
) along the top surface of the long prism, as depicted in figure 12. Temporal variations between the mean reattachment point are recognized by the border between the reverse flow (
 $\tau _w\lt 0$
) and forward flow (
$\tau _w\lt 0$
) and forward flow (
 $\tau _w\gt 0$
) regions. Previous studies (Lander et al. Reference Lander, Moore, Letchford and Amitay2018) suggest two main mechanisms that control the flow unsteadiness around sharp-edged prisms: vorticity roll-up and shear layer flapping. For long prisms, the shear layer roll-up near the leading edge intermittently forces the newly formed vortices towards the prism surfaces, resulting in a flapping motion (Moore et al. Reference Moore, Letchford and Amitay2019a). This induces oscillations of the PR bubble between
$\tau _w\gt 0$
) regions. Previous studies (Lander et al. Reference Lander, Moore, Letchford and Amitay2018) suggest two main mechanisms that control the flow unsteadiness around sharp-edged prisms: vorticity roll-up and shear layer flapping. For long prisms, the shear layer roll-up near the leading edge intermittently forces the newly formed vortices towards the prism surfaces, resulting in a flapping motion (Moore et al. Reference Moore, Letchford and Amitay2019a). This induces oscillations of the PR bubble between
 $x/d\approx 1.2$
and
$x/d\approx 1.2$
and
 $x/d\approx 2.1$
. As presented in figure 12, the mean reattachment point at
$x/d\approx 2.1$
. As presented in figure 12, the mean reattachment point at
 $z/d = 0$
for the large-depth-ratio prism follows an oscillatory pattern. Further, SR also appears to oscillate, albeit in the opposite direction. With time, SR moves further upstream, while PR moves downstream. This behaviour may be linked to the mechanism of shear layer flapping, though it remains out of scope for this study, which focuses only on the transition phenomenon.
$z/d = 0$
for the large-depth-ratio prism follows an oscillatory pattern. Further, SR also appears to oscillate, albeit in the opposite direction. With time, SR moves further upstream, while PR moves downstream. This behaviour may be linked to the mechanism of shear layer flapping, though it remains out of scope for this study, which focuses only on the transition phenomenon.
3.2. Flow periodicity

Figure 12. Space–time plot of the instantaneous wall shear stress (
 $\tau _w$
) along the top surface of the prism with
$\tau _w$
) along the top surface of the prism with
 $DR = 4$
at
$DR = 4$
at
 $z/d=0$
. Here,
$z/d=0$
. Here,
 $\tau _w\gt 0$
(white) represents the region of forward flow, while
$\tau _w\gt 0$
(white) represents the region of forward flow, while
 $\tau _w\lt 0$
(grey) represents the region of reverse flow.
$\tau _w\lt 0$
(grey) represents the region of reverse flow.

Figure 13. Pre-multiplied power spectral density of streamwise (
 $E_u$
), normal (
$E_u$
), normal (
 $E_v$
) and spanwise (
$E_v$
) and spanwise (
 $E_w$
) velocity fluctuations near the leading edge at
$E_w$
) velocity fluctuations near the leading edge at
 $(0.5, 1.3, 0)$
for (a)
$(0.5, 1.3, 0)$
for (a)
 $DR = 1$
and (b)
$DR = 1$
and (b)
 $DR = 4$
.
$DR = 4$
.
The flow periodicity is investigated by using the pre-multiplied power spectral density of the streamwise (
 $E_u$
), normal (
$E_u$
), normal (
 $E_v$
) and spanwise (
$E_v$
) and spanwise (
 $E_w$
) velocity fluctuations near the leading edge at
$E_w$
) velocity fluctuations near the leading edge at
 $(0.5, 1.3, 0)$
in figure 13. Multiple peaks are noted in the power spectrum of both cases, with the one at
$(0.5, 1.3, 0)$
in figure 13. Multiple peaks are noted in the power spectrum of both cases, with the one at
 $St_{kh}$
appearing to be dominant. This frequency is associated with KHI of the leading-edge shear layer. Moreover, a harmonic of KHI is observed at
$St_{kh}$
appearing to be dominant. This frequency is associated with KHI of the leading-edge shear layer. Moreover, a harmonic of KHI is observed at
 $2St_{kh}$
. Another frequency centred at
$2St_{kh}$
. Another frequency centred at
 $St_{sh}$
is also observed, mainly attributed to the Kármán-like vortex shedding. At
$St_{sh}$
is also observed, mainly attributed to the Kármán-like vortex shedding. At
 $DR = 1$
,
$DR = 1$
,
 $St_{sh}$
and
$St_{sh}$
and
 $St_{kh}$
are
$St_{kh}$
are
 $0.170$
and
$0.170$
and
 $0.855$
, respectively, while
$0.855$
, respectively, while
 $St_{sh} = 0.173$
and
$St_{sh} = 0.173$
and
 $St_{kh} = 1.290$
at
$St_{kh} = 1.290$
at
 $DR = 4$
. With increasing depth ratio from
$DR = 4$
. With increasing depth ratio from
 $1$
to
$1$
to
 $4$
, a meagre increase in
$4$
, a meagre increase in
 $St_{sh}$
is noted, while
$St_{sh}$
is noted, while
 $St_{kh}$
and
$St_{kh}$
and
 $2St_{kh}$
are significantly enhanced. In other words, the depth ratio enhances KHI of the leading-edge shear layer, and further explains the strong spanwise vortex shedding (observed in figure 8
b). Additionally, as noted in figure 8(a), the formation of KHI rollers for
$2St_{kh}$
are significantly enhanced. In other words, the depth ratio enhances KHI of the leading-edge shear layer, and further explains the strong spanwise vortex shedding (observed in figure 8
b). Additionally, as noted in figure 8(a), the formation of KHI rollers for
 $DR = 1$
occurs over a larger distance compared to
$DR = 1$
occurs over a larger distance compared to
 $DR = 4$
. This delay in the onset of KHI rollers is reflected in figure 13, where
$DR = 4$
. This delay in the onset of KHI rollers is reflected in figure 13, where
 $St_{kh}$
for
$St_{kh}$
for
 $DR = 1$
is lower compared to
$DR = 1$
is lower compared to
 $DR = 4$
. This further suggests that structures associated with
$DR = 4$
. This further suggests that structures associated with
 $St_{kh}$
for
$St_{kh}$
for
 $DR = 1$
are larger and slow-growing compared to
$DR = 1$
are larger and slow-growing compared to
 $DR = 4$
. Finally, a subharmonic spanwise frequency is noted, which is attributed to alternate shedding of the secondary vortex structures in the wake (Goswami & Hemmati Reference Goswami and Hemmati2022).
$DR = 4$
. Finally, a subharmonic spanwise frequency is noted, which is attributed to alternate shedding of the secondary vortex structures in the wake (Goswami & Hemmati Reference Goswami and Hemmati2022).
Motion of the unsteady shear layer is correlated with the vortex-pairing mechanism in sharp-edged prisms (Ma et al. Reference Ma, Awasthi, Moreau and Doolan2023). Following the flow separation at the leading edge, both the shear layer rolls-up and newly formed vortices are intermittently forced towards the prism surfaces and convect downstream (flapping mechanism). These vortices pair with others in the wake, growing into large-scale structures, such as hairpin-like vortices (vortex-pairing mechanism). Large-scale vortex shedding away from the leading edge is associated with large-scale momentum transport. The vortex-pairing and interactions of KHI with large-scale vortices are quantified using the correlation
 $St_{kh}/St_{sh} = 0.18\,Re^{0.6}$
(Lander et al. Reference Lander, Moore, Letchford and Amitay2018). Since these interactions are a function of Reynolds number, empirically this ratio should be
$St_{kh}/St_{sh} = 0.18\,Re^{0.6}$
(Lander et al. Reference Lander, Moore, Letchford and Amitay2018). Since these interactions are a function of Reynolds number, empirically this ratio should be
 $St_{kh}/St_{sh} = 18$
for
$St_{kh}/St_{sh} = 18$
for
 $Re = 2.5\times 10^3$
(Lander et al. Reference Lander, Moore, Letchford and Amitay2018). For example, this ratio is
$Re = 2.5\times 10^3$
(Lander et al. Reference Lander, Moore, Letchford and Amitay2018). For example, this ratio is
 $St_{kh}/St_{sh} = 26.5$
for flow around a two-dimensional square prism at
$St_{kh}/St_{sh} = 26.5$
for flow around a two-dimensional square prism at
 $Re = 2\times 10^3$
(Brun et al. Reference Brun, Aubrun, Goossens and Ravier2008). In our cases, results in figure 13 indicate that this ratio is
$Re = 2\times 10^3$
(Brun et al. Reference Brun, Aubrun, Goossens and Ravier2008). In our cases, results in figure 13 indicate that this ratio is
 $\sim 5.0$
and
$\sim 5.0$
and
 $\sim 7.5$
for
$\sim 7.5$
for
 $DR = 1$
and
$DR = 1$
and
 $4$
, respectively. This suggests that interactions between KHI and large-scale structures depend on depth ratio, and they are suppressed compared to infinite-span and two-dimensional prisms (Brun et al. Reference Brun, Aubrun, Goossens and Ravier2008; Kumahor & Tachie Reference Kumahor and Tachie2022), potentially due to the three-dimensional effects in the wake.
$4$
, respectively. This suggests that interactions between KHI and large-scale structures depend on depth ratio, and they are suppressed compared to infinite-span and two-dimensional prisms (Brun et al. Reference Brun, Aubrun, Goossens and Ravier2008; Kumahor & Tachie Reference Kumahor and Tachie2022), potentially due to the three-dimensional effects in the wake.
3.3. Leading-edge shear layer interactions

Figure 14. Profiles of maximum values of r.m.s. (a) turbulence–mean shear interaction (
 $\textit{TMI}_{{max} }$
) and (b) turbulence–turbulence interaction (
$\textit{TMI}_{{max} }$
) and (b) turbulence–turbulence interaction (
 $\textit{TTI}_{{max} }$
) terms of the Poisson equation for
$\textit{TTI}_{{max} }$
) terms of the Poisson equation for
 $DR = 1$
and
$DR = 1$
and
 $4$
prisms at
$4$
prisms at
 $z/d = 0$
(blue) and
$z/d = 0$
(blue) and
 $y/d = 0.5$
(red). The axial distances are normalized using prism length (
$y/d = 0.5$
(red). The axial distances are normalized using prism length (
 $l$
). Circles represent
$l$
). Circles represent
 $DR = 1$
; squares represent
$DR = 1$
; squares represent
 $DR = 4$
.
$DR = 4$
.
Interactions between KHI and large-scale vortex shedding can be further quantified by analysing the Poisson equation:
 \begin{align} \nabla ^2 p = -\rho \left ( 2\,\overline {\frac {\partial u_i}{\partial x_j}}\,\frac {\partial u^\prime _j}{\partial x_i} + \frac {\partial ^2}{\partial x_i\, \partial x_j}(u^\prime _i u^\prime _j - \overline {u^\prime _i u^\prime _j}) \right ). \end{align}
Here, the right-hand side can be decomposed into two terms: turbulence–mean-shear interaction (TMI) and turbulence–turbulence interaction (TTI). The TMI accounts for the rapid changes in mean flow due to fluctuating fields, while TTI is associated with nonlinear interactions of turbulent structures. These two terms are considered the primary sources of pressure fluctuations in the flow (Ma et al. Reference Ma, Awasthi, Moreau and Doolan2023). Figure 14 presents the profiles of maximum values of TMI and TTI terms of the Poisson equation for
 $DR = 1$
and
$DR = 1$
and
 $4$
at
$4$
at
 $z/d = 0$
(blue) and
$z/d = 0$
(blue) and
 $y/d = 0.5$
(red). Figure 14(a) reveals heightened TMI closer to the leading edge, where separated shear layers are created for both prisms. Following the abrupt shear layer separation at the leading edge, vorticity associated with the shear layer alters the mean flow in this region, resulting in enhanced momentum. This explains the high values of TMI near the leading edge. Initially,
$y/d = 0.5$
(red). Figure 14(a) reveals heightened TMI closer to the leading edge, where separated shear layers are created for both prisms. Following the abrupt shear layer separation at the leading edge, vorticity associated with the shear layer alters the mean flow in this region, resulting in enhanced momentum. This explains the high values of TMI near the leading edge. Initially,
 $\textit{TMI}_{{max} }$
for both prisms remains large, though it subsides quickly for
$\textit{TMI}_{{max} }$
for both prisms remains large, though it subsides quickly for
 $DR = 1$
. Due to a lack of flow reattachment in
$DR = 1$
. Due to a lack of flow reattachment in
 $DR = 1$
,
$DR = 1$
,
 $\textit{TMI}_{{max} }$
for the top shear layer reduces until
$\textit{TMI}_{{max} }$
for the top shear layer reduces until
 $x/l\approx 0.5$
, followed by a gradual increase due to flow interactions with the upwash flow at the trailing edge (Goswami & Hemmati Reference Goswami and Hemmati2023). The TMI for
$x/l\approx 0.5$
, followed by a gradual increase due to flow interactions with the upwash flow at the trailing edge (Goswami & Hemmati Reference Goswami and Hemmati2023). The TMI for
 $DR = 4$
remains large in
$DR = 4$
remains large in
 $0.1\leqslant x/l\leqslant 0.3$
, indicating a region of elevated mean flow modulations by KHI. For both cases,
$0.1\leqslant x/l\leqslant 0.3$
, indicating a region of elevated mean flow modulations by KHI. For both cases,
 $\textit{TMI}_{{max} }$
on side surfaces is significantly suppressed compared to the top, indicating that the top surface shear layer plays a dominant role in driving the downstream flow. Finally, TMI points to the origins of mean flow modulations, which are associated with the shear layer flapping-like motion. Thus enhanced TMI near the leading edge for
$\textit{TMI}_{{max} }$
on side surfaces is significantly suppressed compared to the top, indicating that the top surface shear layer plays a dominant role in driving the downstream flow. Finally, TMI points to the origins of mean flow modulations, which are associated with the shear layer flapping-like motion. Thus enhanced TMI near the leading edge for
 $DR = 4$
identifies the location where shear layer flapping-like motion is most pronounced.
$DR = 4$
identifies the location where shear layer flapping-like motion is most pronounced.
The TTI term, presented in figure 14(b), highlights the interactions between different flow structures (Ma et al. Reference Ma, Awasthi, Moreau and Doolan2023). While TMI is concentrated near the leading edge, TTI is more distributed across the top and side surfaces of both prisms. The distribution is likely due to the enhanced flow momentum (velocity fluctuations) produced by the mean flow alterations that gradually affect the surrounding flow field. For
 $DR = 1$
,
$DR = 1$
,
 $\textit{TTI}_{{max} }$
is elevated closer to the trailing edge, which is attributed to direct shedding of the leading-edge shear layer into the wake. This enhances the interactions and vortex mixing in the wake region (Goswami & Hemmati Reference Goswami and Hemmati2023). For
$\textit{TTI}_{{max} }$
is elevated closer to the trailing edge, which is attributed to direct shedding of the leading-edge shear layer into the wake. This enhances the interactions and vortex mixing in the wake region (Goswami & Hemmati Reference Goswami and Hemmati2023). For
 $DR = 4$
, elevated
$DR = 4$
, elevated
 $\textit{TTI}_{{max} }$
occurs close to the location of the flow reattachment on the prism surfaces (
$\textit{TTI}_{{max} }$
occurs close to the location of the flow reattachment on the prism surfaces (
 $\overline {x_R}/l\approx 0.53$
). This region is associated with the breakdown of KHI rollers into hairpin-like vortices, which are then convected downstream. The interactions between KHI rollers and large-scale vortex shedding are most pronounced in this region, leading to an increased turbulence intensity and mixing (shown previously in figure 7
d). These processes enhance the flow momentum due to an influx of energy by the mean flow modulation (TMI). As such, increased momentum results in the enhancement of vortex shedding and wake transition. These interactions are driven by the flow geometry, since such a mechanism is absent for the short prism, where
$\overline {x_R}/l\approx 0.53$
). This region is associated with the breakdown of KHI rollers into hairpin-like vortices, which are then convected downstream. The interactions between KHI rollers and large-scale vortex shedding are most pronounced in this region, leading to an increased turbulence intensity and mixing (shown previously in figure 7
d). These processes enhance the flow momentum due to an influx of energy by the mean flow modulation (TMI). As such, increased momentum results in the enhancement of vortex shedding and wake transition. These interactions are driven by the flow geometry, since such a mechanism is absent for the short prism, where
 $\textit{TTI}_{{max} }$
steadily rises up to the trailing edge. Finally,
$\textit{TTI}_{{max} }$
steadily rises up to the trailing edge. Finally,
 $\textit{TTI}_{{max} }$
is comparable for the top and side surface shear layers for both prisms, which indicates an invariance of energy production and dissipation on the top and side surfaces.
$\textit{TTI}_{{max} }$
is comparable for the top and side surface shear layers for both prisms, which indicates an invariance of energy production and dissipation on the top and side surfaces.
Triadic interactions form the basis of the energy transfer mechanism in the wake transition phenomenon (Craik Reference Craik1971). The frequency triad, described by the interactions between two flow structures at frequencies
 $St_i$
and
$St_i$
and
 $St_j$
, results in a third frequency
$St_j$
, results in a third frequency
 $St_{i+j}$
such that
$St_{i+j}$
such that
 $St_i \pm St_j \pm St_{i+j} = 0$
. These interactions are quantified using BMD analysis, proposed by Schmidt (Reference Schmidt2020). Figure 15 shows the magnitude of the mode bi-spectrum for
$St_i \pm St_j \pm St_{i+j} = 0$
. These interactions are quantified using BMD analysis, proposed by Schmidt (Reference Schmidt2020). Figure 15 shows the magnitude of the mode bi-spectrum for
 $DR = 4$
in the sum and difference regions. Their interactions with large-scale vortex shedding frequency (
$DR = 4$
in the sum and difference regions. Their interactions with large-scale vortex shedding frequency (
 $St_{sh}$
) are noted in figure 15 along with the sum interaction of
$St_{sh}$
) are noted in figure 15 along with the sum interaction of
 $St_{kh}$
with
$St_{kh}$
with
 $St_{sh}$
, and the fundamental mode of
$St_{sh}$
, and the fundamental mode of
 $St_{sh}$
. The intensity of the spectrum is large for the large-scale frequencies (
$St_{sh}$
. The intensity of the spectrum is large for the large-scale frequencies (
 $St_{sh}$
), while it reduces significantly for
$St_{sh}$
), while it reduces significantly for
 $St_{kh}$
. Further, the sum interaction of
$St_{kh}$
. Further, the sum interaction of
 $St_{sh}$
corresponds to the global maximum of the mode bi-spectrum, consistent with the separated flow in Schmidt (Reference Schmidt2020).
$St_{sh}$
corresponds to the global maximum of the mode bi-spectrum, consistent with the separated flow in Schmidt (Reference Schmidt2020).

Figure 15. Magnitude mode bi-spectrum for
 $DR = 4$
, using
$DR = 4$
, using
 $N_{\mathit{fft}} = 2^{10}$
, in the sum and difference regions.
$N_{\mathit{fft}} = 2^{10}$
, in the sum and difference regions.

Figure 16. The BMD interaction map for the
 $DR = 4$
prism, showing the interactions between (a) KHI and mean flow, and (b) KHI and large-scale vortex shedding.
$DR = 4$
prism, showing the interactions between (a) KHI and mean flow, and (b) KHI and large-scale vortex shedding.
Interactions of KHI with the mean flow and large-scale vortex shedding are presented through a BMD interaction map in figure 16. This map quantifies the average local bi-correlation between the three frequencies,
 $St_i$
,
$St_i$
,
 $St_j$
and
$St_j$
and
 $St_{i+j}$
, involved in the triad. The interactions are defined as
$St_{i+j}$
, involved in the triad. The interactions are defined as
 $\Psi _{k,l} = |\phi _{k+l}\circ \phi _{k\circ l}|$
, where
$\Psi _{k,l} = |\phi _{k+l}\circ \phi _{k\circ l}|$
, where
 $\phi _{k+l}$
represents the resultant mode of triadic interaction, and
$\phi _{k+l}$
represents the resultant mode of triadic interaction, and
 $\phi _{k\circ l}$
represents the influence of input modes. For more information regarding the formulation, readers are referred to Schmidt (Reference Schmidt2020). For both cases, the interactions are most pronounced near the leading edge and throughout the upper surface of the prism up to
$\phi _{k\circ l}$
represents the influence of input modes. For more information regarding the formulation, readers are referred to Schmidt (Reference Schmidt2020). For both cases, the interactions are most pronounced near the leading edge and throughout the upper surface of the prism up to
 $x/d\approx 2$
, where the flow reattaches to the surface. Interactions of KHI with the mean flow are dominant outside the PR, with the maximum value occurring at
$x/d\approx 2$
, where the flow reattaches to the surface. Interactions of KHI with the mean flow are dominant outside the PR, with the maximum value occurring at
 $x/d\approx 0.8$
. This is consistent with the location of maximum TMI in figure 14(a). This interaction is associated with the mean flow modulation by KHI due to the shear layer flapping-like motion. A slightly elevated interaction at the trailing edge also corresponds to the trailing-edge shear layer interacting with the flow downstream. Interactions of KHI with large-scale vortex shedding are distributed across the prism surface. Near the centre of PR, these interactions enhance due to the flow impingement on prism surfaces as a result of the unsteady shear layer. This region of elevated interactions is consistent with the region of maximum TTI in figure 14(b). These results confirm that flow modulations at the leading edge, due to KHI, are convected downstream and interact with large-scale vortex shedding, enhancing the flow momentum. Due to the interactions and vortex breakdown, the flow momentum reduces further until the trailing edge. While not shown here for
$x/d\approx 0.8$
. This is consistent with the location of maximum TMI in figure 14(a). This interaction is associated with the mean flow modulation by KHI due to the shear layer flapping-like motion. A slightly elevated interaction at the trailing edge also corresponds to the trailing-edge shear layer interacting with the flow downstream. Interactions of KHI with large-scale vortex shedding are distributed across the prism surface. Near the centre of PR, these interactions enhance due to the flow impingement on prism surfaces as a result of the unsteady shear layer. This region of elevated interactions is consistent with the region of maximum TTI in figure 14(b). These results confirm that flow modulations at the leading edge, due to KHI, are convected downstream and interact with large-scale vortex shedding, enhancing the flow momentum. Due to the interactions and vortex breakdown, the flow momentum reduces further until the trailing edge. While not shown here for
 $DR = 1$
, such interactions remain absent, underscoring the influence of depth ratio in the wake transition phenomenon. These results provide a novel understanding of the interactions between KHI and large-scale vortex shedding in the wake of wall-mounted prisms.
$DR = 1$
, such interactions remain absent, underscoring the influence of depth ratio in the wake transition phenomenon. These results provide a novel understanding of the interactions between KHI and large-scale vortex shedding in the wake of wall-mounted prisms.
3.4. Observations across the parameter space

Figure 17. Instantaneous vortex structures overlaid with axial velocity (
 $u$
) contours for (a,c)
$u$
) contours for (a,c)
 $DR = 1.5$
and (b,d)
$DR = 1.5$
and (b,d)
 $DR=3.5$
at (a,b)
$DR=3.5$
at (a,b)
 $Re = 1.5\times 10^3$
, (c,d)
$Re = 1.5\times 10^3$
, (c,d)
 $Re = 4\times 10^3$
, identified using the
$Re = 4\times 10^3$
, identified using the
 $Q$
-criterion (
$Q$
-criterion (
 $Q^* = 1$
).
$Q^* = 1$
).
Observations and insights from the specific cases
 $DR = 1$
and
$DR = 1$
and
 $4$
at
$4$
at
 $Re = 2.5\times 10^3$
are expandable across the broad parameter space considered in this study, i.e. varying aspect ratio (
$Re = 2.5\times 10^3$
are expandable across the broad parameter space considered in this study, i.e. varying aspect ratio (
 $0.25{-}1.5$
), depth ratio (
$0.25{-}1.5$
), depth ratio (
 $1{-}4$
) and Reynolds numbers (
$1{-}4$
) and Reynolds numbers (
 $1\times 10^3 {-}5\times 10^3$
). For example, we consider the cases
$1\times 10^3 {-}5\times 10^3$
). For example, we consider the cases
 $DR = 1.5$
and
$DR = 1.5$
and
 $3.5$
at
$3.5$
at
 $Re = 1.5\times 10^3$
and
$Re = 1.5\times 10^3$
and
 $4\times 10^3$
in figure 17. These instantaneous vortex structures reveal that for a short-depth-ratio prism (
$4\times 10^3$
in figure 17. These instantaneous vortex structures reveal that for a short-depth-ratio prism (
 $DR = 1.5$
), the leading-edge shear layer extends and sheds directly into the wake. The influence of the Reynolds number becomes apparent, where the unsteady wake is classified into regular unsteady wake, consistent with the observations of Zargar et al. (Reference Zargar, Tarokh and Hemmati2022). In contrast, a larger-depth-ratio prism (
$DR = 1.5$
), the leading-edge shear layer extends and sheds directly into the wake. The influence of the Reynolds number becomes apparent, where the unsteady wake is classified into regular unsteady wake, consistent with the observations of Zargar et al. (Reference Zargar, Tarokh and Hemmati2022). In contrast, a larger-depth-ratio prism (
 $DR = 3.5$
) exhibits the shear layer reattachment to the prism surfaces, leading to an unsteady shear layer motion and enhanced interactions with large-scale vortex shedding. This results in the formation of large-scale vortex rollers and hairpin-like vortices in the wake, consistent with previous observations from the case
$DR = 3.5$
) exhibits the shear layer reattachment to the prism surfaces, leading to an unsteady shear layer motion and enhanced interactions with large-scale vortex shedding. This results in the formation of large-scale vortex rollers and hairpin-like vortices in the wake, consistent with previous observations from the case
 $DR = 4$
at
$DR = 4$
at
 $Re = 2.5\times 10^3$
.
$Re = 2.5\times 10^3$
.

Figure 18. Instantaneous vortex structures overlaid with axial velocity (
 $u$
) contours for prisms with
$u$
) contours for prisms with
 $AR = 1.5$
and (a)
$AR = 1.5$
and (a)
 $DR = 1.5$
and (b)
$DR = 1.5$
and (b)
 $DR=3.5$
at
$DR=3.5$
at
 $Re = 2.5\times 10^3$
identified using the
$Re = 2.5\times 10^3$
identified using the
 $Q$
-criterion (
$Q$
-criterion (
 $Q^* = 1$
).
$Q^* = 1$
).

Figure 19. Axial wall pressure gradient along the mid-span (
 $z/d = 0$
) of prisms with (a)
$z/d = 0$
) of prisms with (a)
 $AR = 1.5$
at
$AR = 1.5$
at
 $Re = 2.5\times 10^3$
, and (b)
$Re = 2.5\times 10^3$
, and (b)
 $AR = 1$
at
$AR = 1$
at
 $Re = 4\times 10^3$
.
$Re = 4\times 10^3$
.
Next, we consider the cases of prisms with
 $AR = 1.5$
and
$AR = 1.5$
and
 $DR = 1.5, 3.5$
at
$DR = 1.5, 3.5$
at
 $Re = 2.5\times 10^3$
in figure 18. The results are consistent with the observations from
$Re = 2.5\times 10^3$
in figure 18. The results are consistent with the observations from
 $AR = 1$
, where the interactions of KHI with large-scale vortex shedding is more pronounced for larger depth ratio. This results in a more complex wake topology downstream of the leading edge, as opposed to
$AR = 1$
, where the interactions of KHI with large-scale vortex shedding is more pronounced for larger depth ratio. This results in a more complex wake topology downstream of the leading edge, as opposed to
 $DR = 1.5$
, where shedding of the shear layer into the wake suppresses the interactions, resulting in a more stable flow. Influence of prism aspect ratio is further evident in figure 18, where the flow unsteadiness enhances with aspect ratio, consistent with observations of Saha (Reference Saha2013). Finally, the unsteady shear layer is quantitatively observed by axial wall pressure gradients plotted along the prism mid-span (
$DR = 1.5$
, where shedding of the shear layer into the wake suppresses the interactions, resulting in a more stable flow. Influence of prism aspect ratio is further evident in figure 18, where the flow unsteadiness enhances with aspect ratio, consistent with observations of Saha (Reference Saha2013). Finally, the unsteady shear layer is quantitatively observed by axial wall pressure gradients plotted along the prism mid-span (
 $z/d = 0$
) in figure 19. Here, we present the cases
$z/d = 0$
) in figure 19. Here, we present the cases
 $DR = 1.5, 3.5$
with
$DR = 1.5, 3.5$
with
 $AR = 1.5$
at
$AR = 1.5$
at
 $Re = 2.5\times 10^3$
, and
$Re = 2.5\times 10^3$
, and
 $AR = 1$
at
$AR = 1$
at
 $Re = 4\times 10^3$
. The rapid overshoot of pressure gradient near the leading edge, suggesting an abrupt flow separation, is consistent in all cases. The trends of
$Re = 4\times 10^3$
. The rapid overshoot of pressure gradient near the leading edge, suggesting an abrupt flow separation, is consistent in all cases. The trends of
 $\partial p_w/\partial x$
for
$\partial p_w/\partial x$
for
 $DR = 1.5$
remain steady at
$DR = 1.5$
remain steady at
 $Re = 2.5\times 10^3$
, while small oscillations are noted at
$Re = 2.5\times 10^3$
, while small oscillations are noted at
 $Re = 4\times 10^3$
. Although Reynolds number effects are not the primary focus of this study, the oscillations in
$Re = 4\times 10^3$
. Although Reynolds number effects are not the primary focus of this study, the oscillations in
 $\partial p_w/ \partial x$
at higher Reynolds numbers can be linked to unsteady wake dynamics. Notably, for a larger-depth-ratio prism (
$\partial p_w/ \partial x$
at higher Reynolds numbers can be linked to unsteady wake dynamics. Notably, for a larger-depth-ratio prism (
 $DR = 3.5$
), the oscillatory behaviour of the pressure gradient becomes evident and more pronounced across both aspect ratios and Reynolds numbers. Oscillations enhance with depth ratio, and they are associated with the shear layer flapping-like phenomenon, which is pronounced for these cases (see figures 17 and 18). Previous studies (Goswami & Hemmati Reference Goswami and Hemmati2022, Reference Goswami and Hemmati2023) have established that unsteady and mean wake topology of wall-mounted prisms are functions of both Reynolds number and body geometry. Our results expand this argument to turbulence transition, where the interactions between KHI and large-scale vortex shedding are enhanced with increasing depth ratio. These interactions are driven by the unsteady shear layer motion, which is most pronounced for large-depth-ratio prisms. These interactions enhance the flow momentum over the prism surfaces, resulting in a more complex wake structure, and ultimately leading to turbulence transition.
$DR = 3.5$
), the oscillatory behaviour of the pressure gradient becomes evident and more pronounced across both aspect ratios and Reynolds numbers. Oscillations enhance with depth ratio, and they are associated with the shear layer flapping-like phenomenon, which is pronounced for these cases (see figures 17 and 18). Previous studies (Goswami & Hemmati Reference Goswami and Hemmati2022, Reference Goswami and Hemmati2023) have established that unsteady and mean wake topology of wall-mounted prisms are functions of both Reynolds number and body geometry. Our results expand this argument to turbulence transition, where the interactions between KHI and large-scale vortex shedding are enhanced with increasing depth ratio. These interactions are driven by the unsteady shear layer motion, which is most pronounced for large-depth-ratio prisms. These interactions enhance the flow momentum over the prism surfaces, resulting in a more complex wake structure, and ultimately leading to turbulence transition.
4. Conclusion
This study numerically investigated the wake transition phenomenon around wall-mounted prisms. Results were presented at Reynolds number
 $2.5\times 10^3$
for prisms with aspect ratio
$2.5\times 10^3$
for prisms with aspect ratio
 $1$
and depth ratios
$1$
and depth ratios
 $1$
and
$1$
and
 $4$
, which were consistent for the entire parameter space studied here (
$4$
, which were consistent for the entire parameter space studied here (
 $AR = 0.25{-}1.5$
,
$AR = 0.25{-}1.5$
,
 $DR = 1 {-}4$
and
$DR = 1 {-}4$
and
 $Re = 1\times 10^3 {-}5\times 10^3$
). The wake unsteadiness is enhanced with increasing depth ratio. Kelvin–Helmholtz instability (KHI) is noted for all cases, forming finite spanwise vortex rollers. However, the intensity and frequency of the rollers are more pronounced for longer prisms (
$Re = 1\times 10^3 {-}5\times 10^3$
). The wake unsteadiness is enhanced with increasing depth ratio. Kelvin–Helmholtz instability (KHI) is noted for all cases, forming finite spanwise vortex rollers. However, the intensity and frequency of the rollers are more pronounced for longer prisms (
 $DR \geqslant 3$
), while for short prisms they are delayed and less frequent. Additionally, the formation of KHI for short prisms takes place over a larger distance compared to longer prisms. Enhanced wake unsteadiness is attributed to interactions between KHI and large-scale vortex shedding, induced by an unsteady shear layer flapping-like motion in the wake of large-depth-ratio prisms. Evidence of an unsteady shear layer is provided by analysing the space–time wall shear stress contours, showing an oscillating recirculating region. Interactions between KHI and large-scale vortex shedding are quantified using the Poisson equation and bi-spectral decomposition. The turbulence–mean-shear interaction (TMI) term of the Poisson equation is elevated near the leading edge, while the turbulence–turbulence interaction (TTI) term is distributed across the prism surfaces. Elevated TMI near the leading edge points to the mean flow manipulations due to the unsteady shear layer, while enhanced TTI on the prism surfaces indicates interactions between KHI and large-scale vortex shedding. Elevated TMI shows that the leading-edge flow manipulations provide energy, which is then transferred to the large-scale vortex shedding, enhancing the flow momentum. Increased momentum in the wake enhances vortex shedding, which is a precursor to turbulence transition. Finally, bi-spectral mode decomposition analysis provides evidence of the interactions between KHI and large-scale vortex shedding, further confirming the transition process. This study underscores the role of depth ratio in the transition to turbulence phenomenon at moderate Reynolds numbers, and provides novel insights into the interaction mechanisms of KHI and large-scale vortex shedding in the wake of wall-mounted prisms.
$DR \geqslant 3$
), while for short prisms they are delayed and less frequent. Additionally, the formation of KHI for short prisms takes place over a larger distance compared to longer prisms. Enhanced wake unsteadiness is attributed to interactions between KHI and large-scale vortex shedding, induced by an unsteady shear layer flapping-like motion in the wake of large-depth-ratio prisms. Evidence of an unsteady shear layer is provided by analysing the space–time wall shear stress contours, showing an oscillating recirculating region. Interactions between KHI and large-scale vortex shedding are quantified using the Poisson equation and bi-spectral decomposition. The turbulence–mean-shear interaction (TMI) term of the Poisson equation is elevated near the leading edge, while the turbulence–turbulence interaction (TTI) term is distributed across the prism surfaces. Elevated TMI near the leading edge points to the mean flow manipulations due to the unsteady shear layer, while enhanced TTI on the prism surfaces indicates interactions between KHI and large-scale vortex shedding. Elevated TMI shows that the leading-edge flow manipulations provide energy, which is then transferred to the large-scale vortex shedding, enhancing the flow momentum. Increased momentum in the wake enhances vortex shedding, which is a precursor to turbulence transition. Finally, bi-spectral mode decomposition analysis provides evidence of the interactions between KHI and large-scale vortex shedding, further confirming the transition process. This study underscores the role of depth ratio in the transition to turbulence phenomenon at moderate Reynolds numbers, and provides novel insights into the interaction mechanisms of KHI and large-scale vortex shedding in the wake of wall-mounted prisms.
Acknowledgements.
This research has received support from the Natural Sciences and Engineering Research Council of Canada (NSERC) and Alberta Innovates. The computational analysis was completed using Digital Research Alliance of Canada computing clusters.
Declaration of interests.
The authors report no conflict of interest.


 Open access