


1. Introduction
Particle-laden flow is ubiquitous both in nature and industry, including plankton in the ocean (Pedley & Kessler Reference Pedley and Kessler1992), dust and virus dispersed in the atmosphere (Mittal, Ni & Seo Reference Mittal, Ni and Seo2020) and catalytic particles in industrial settings (Wang, Mathai & Sun Reference Wang, Mathai and Sun2019, Reference Wang, Mathai and Sun2020). For the suspension of rigid spheroidal particles, the system can be characterized by the Reynolds number of the flow,  $Re$, and the particle parameters, which include the density,
  $\rho _p$, diameter,
  $d_p$, aspect ratio,
  $\lambda$, and volume fraction of the particle,
  $\varPhi$. According to the ranges of
  $d_p$ and
  $\varPhi$, the mechanism of the fluid–particle interaction can be roughly classified into two types: (i) one-way coupled and (ii) two-/four-way coupled (Elghobashi Reference Elghobashi1994; Voth & Soldati Reference Voth and Soldati2017). When
  $d_p \ll \eta _K$ (the dissipative length scale of the flow) and
  $\varPhi$ is low, the fluid and particles can be treated as one-way coupled, hence, the fluid is unaffected. In this regime the particle-laden flow can be described by the point-particle model, which has been extensively verified and used in the simulation studies (Saw et al. Reference Saw, Shaw, Ayyalasomayajula, Chuang and Gylfason2008; Rusconi, Guasto & Stocker Reference Rusconi, Guasto and Stocker2014; Frankel et al. Reference Frankel, Pouransari, Coletti and Mani2016; Lohse Reference Lohse2018; Park, O'Keefe & Richter Reference Park, O'Keefe and Richter2018; Lovecchio et al. Reference Lovecchio, Climent, Stocker and Durham2019). For
  $d_p \ll \eta _K$ but
  $\varPhi$ is high enough, the particles can still be modelled as point particles, but the flow is in a two- or four-way coupling regime, and the feedback of the particles in the flow needs to be accounted for. However, when
  $d_p$ exceeds
  $\eta _K$ (typically
  $d_p > 10\eta _K$, Voth & Soldati Reference Voth and Soldati2017), the particles, which are referred to as finite-size particles, can modify the surrounding flow field by two-way or four-way coupling. To resolve the flow field around the finite-size particles, experiments and fully resolved simulations, which have been conducted to study the physics of finite-size effects and particle dynamics (Magnaudet & Eames Reference Magnaudet and Eames2000; Peskin Reference Peskin2002; Uhlmann Reference Uhlmann2008; Tagawa et al. Reference Tagawa, Roghair, Prakash, van Sint Annaland, Kuipers, Sun and Lohse2013; Wang, Sierakowski & Prosperetti Reference Wang, Sierakowski and Prosperetti2017b; Bakhuis et al. Reference Bakhuis, Verschoof, Mathai, Huisman, Lohse and Sun2018; Jiang, Calzavarini & Sun Reference Jiang, Calzavarini and Sun2020; Will et al. Reference Will, Mathai, Huisman, Lohse, Sun and Krug2021; Assen et al. Reference Assen, Ng, Will, Stevens, Lohse and Verzicco2022), are required.
The finite-size effects on the microscopic scale can cause turbulence modulation on the macroscopic scale. It has been reported that tremendous drag reduction can be achieved by a small amount of large bubble injection (van den Berg et al. Reference van den Berg, Luther, Lathrop and Lohse2005, Reference van den Berg, van Gils, Lathrop and Lohse2007; van Gils et al. Reference van Gils, Guzman, Sun and Lohse2013; Verschoof et al. Reference Verschoof, Van Der Veen, Sun and Lohse2016; Ezeta et al. Reference Ezeta, Bakhuis, Huisman, Sun and Lohse2019); however, the mechanism of drag reduction is still not fully understood. The main difficulty in studying the bubbly flow in the experiments is the deformability of the bubble, which makes it difficult to fix the bubble shape and size. On the contrary, through performing density matching, suspended rigid spheroidal particles can be used to partially solve the difficulty above, making it possible to delve into the mechanism of bubbly drag reduction.
Indeed, recent studies have hinted that the spherical particles are promising in achieving drag modification both in channel flow (Lashgari et al. Reference Lashgari, Picano, Breugem and Brandt2014; Picano, Breugem & Brandt Reference Picano, Breugem and Brandt2015) and duct flow (Zade et al. Reference Zade, Costa, Fornari, Lundell and Brandt2018). However, on the one hand, few studies have directly measured the drag of the flow, under what conditions the particles will increase or decrease the turbulence drag is still unknown. Bakhuis et al. (Reference Bakhuis, Verschoof, Mathai, Huisman, Lohse and Sun2018) experimentally investigated the effects of finite-size rigid spherical particles on the drag of a Taylor–Couette (TC) turbulent flow, where they found that the overall drag does not vary much in their explored high-Reynolds-number range and the low particle volume fraction range. While in a later study, Ardekani & Brandt (Reference Ardekani and Brandt2019) varied the aspect ratios of the suspended particles in wall-bounded turbulence and found turbulence attenuation (compared with the single-phase flow) in prolate and oblate cases. In their study, an overall drag reduction was also found for the oblate particle with  $\lambda \leq 1/3$ when compared with the single-phase case. It should be noted that turbulence attenuation is not necessary to connect to an overall drag reduction and vice versa. For example, the turbulence attenuation but overall drag enhancement might be achieved at the same time at the cost of high particle volume fractions since the particle-induced stress is greatly enhanced (Picano et al. Reference Picano, Breugem and Brandt2015). Given the importance of the boundary layer for turbulent stress and drag, an explanation was proposed by Ardekani & Brandt (Reference Ardekani and Brandt2019) for the mechanism of turbulence modulation in terms of the near-wall dynamics of different particles. On the other hand, studies in recent years have shed some light on the physics of the turbulence modulation induced by particles. For example, Ardekani et al. (Reference Ardekani, Costa, Breugem, Picano and Brandt2017) performed simulations in turbulent channel flow laden with oblate particles up to a volume fraction of
  $\varPhi =15\,\%$, and they have observed an overall drag reduction. In their study, two possible mechanisms are found to be responsible for the particle-induced drag reduction: (i) the absence of the near-wall particle layer and (ii) the alignment of the major axes of the oblate particles to the wall. Besides, experimental findings have also suggested that the collective effects of the particles and bubbles can significantly affect the flow properties (Calzavarini et al. Reference Calzavarini, Cencini, Lohse and Toschi2008; Colin, Fabre & Kamp Reference Colin, Fabre and Kamp2012; van Gils et al. Reference van Gils, Guzman, Sun and Lohse2013; Maryami et al. Reference Maryami, Farahat, Javad Poor and Mayam2014; Alméras et al. Reference Alméras, Mathai, Lohse and Sun2017; Mathai et al. Reference Mathai, Huisman, Sun, Lohse and Bourgoin2018).
Among various flow geometries, a closed set-up, where drag can be directly measured, is convenient for evaluating the drag modification of the flow induced by suspended particles. In this work we employ a TC system (Grossmann, Lohse & Sun Reference Grossmann, Lohse and Sun2016) – the flow between two coaxial cylinders – to suspend the particles. The Reynolds number,  $Re$, the particle volume fraction,
  $\varPhi$, and the particle aspect ratio,
  $\lambda$, are varied to study their effects on the drag. To find out the mechanism of the drag modification, optical measurements are performed to obtain the particle distribution in the radial direction of the system.
2. Experiment
2.1. Experimental facility
The TC facility used in the present work is shown in figure 1(a). The inner cylinder is made of aluminum, while the outer one is made of PMMA (polymethyl methacrylate) to perform optical measurements. The outer cylinder is surrounded by a PMMA cubic circulating bath, which keeps the system temperature at  $T= 22\pm 0.1\,^{\circ }$C during the experiments. The radius of the inner and outer cylinder is
  $r_i = 25$ and
  $r_o = 35$ mm, respectively, giving the gap width
  $d$ =
$d$ =  $r_o-r_i = 10$ mm and the radius ratio
  $\eta =r_i/r_o=0.714$. The height of the inner cylinder is
  $L = 75$ mm, which gives the aspect ratio of the system
  $\varGamma =L/ d=7.5$.

Figure 1. (a) Sketch of the TC facility. The gap between the two coaxial cylinders is filled with a glycerine-water solution to match the particle density. The neutrally buoyant particles (blue dots) are recorded by the CCD camera. The outer cylinder is surrounded by a PMMA cubic circulating water bath, which keeps the temperature of the system at  $T=22\pm 0.1\,^{\circ }$C during the experiments. (b) Sketches showing the sizes of the particles used in this work.
During the experiments, the outer cylinder is fixed, while the inner cylinder is connected to and driven by a rheometer (Discovery Hybrid Rheometer, TA Instruments), and the overall torque of the system is measured at the same time by the torque sensor of the rheometer. The control parameter of TC flow is the Reynolds number defined by
 \begin{equation} Re=\frac{\omega_ir_id}{\nu}, \end{equation}
where  $\omega _i$ is the angular velocity of the inner cylinder and
  $\nu$ is the kinematic viscosity of the fluid. In the present work the
  $\omega _i$ ranges from
  $50$ to
  $200$ rad s
 $^{-1}$, which gives the
  $Re$ ranges from
  $6.5\times 10^3$ to
  $2.6\times 10^4$.
The overall torque of the system,  $\tau _{total}$, that needed to drive the inner cylinder at a constant angular velocity
  $\omega _i$, can be divided into two parts: (i) the torque,
  $\tau$, due to the sidewall of the inner cylinder (TC flow), (ii) the torque,
  $\tau _{end}$, contributed from the von Kármán flow at the end plates. Since the aspect ratio of the system is relatively small here, the rotation of the end plates generates secondary vortices that contribute to the torque measurements (Bagnold Reference Bagnold1954; Hunt et al. Reference Hunt, Zenit, Campbell and Brennen2002). The calibration of the end effect due to the von Kármán flow between the bottom and top lids of the inner and outer cylinder can be found in Appendix A. Here, only
  $\tau$ is used, and it can be non-dimensionalized as
 \begin{equation} G=\frac{\tau}{2{\rm \pi} L\rho_f\nu^2}, \end{equation}
where  $L$ is the length of the inner cylinder and
  $\rho _f$ is the fluid density.
In the experiments, the gap between the bottom and top lids of the inner and outer cylinders is 2 mm and larger than the particle diameter, the particles therefore continuously flow into and out of the bottom and top gaps between the inner and outer cylinders. For each experiment, the system is initially started from a static state, and then the inner cylinder is imposed a constant angular velocity by the motor of the rheometer. Before measuring the torque, the inner cylinder is kept rotating to ensure the establishment of a statistically stationary state. For each  $\omega _i$, the torque measurements are repeated three times, and the averaged value is used, of which the standard deviations are less than
  $1\,\%$.
2.2. Preparation of the finite-size particles
The particles we used are printed with a three-dimensional printer using photosensitive resin (elastic resin of Formlabs. Inc) and are then cured at  $60\,^{\circ }$C for 60 min. To check their water-absorbing ability, the particles are immersed in the static glycerin-water solution for 2 h, and afterwards the change in weight is found to be negligible. The density of the particle is
  $\rho _p=1.06 \times 10^3$ kg m
 $^{-3}$ (averaged value based on more than 1000 particles). The particle volume fraction,
  $\varPhi$, ranges from
  $0\,\%$ to
  $10\,\%$ with a spacing of
  $2\,\%$. In addition, optical measurements and additional torque measurements are performed at
  $\varPhi =0.5\,\%$. To study the shape effect of the finite-size particles, we change the particle aspect ratio,
  $\lambda =h_p/d_p$, where
  $d_p$ is the length of the symmetric axis of the particle, and
  $h_p$ is the length perpendicular to it. In this work
  $\lambda$ is designed to be equal to 1/3, 1 and 3, corresponding to the oblate, spherical and prolate, respectively (see figure 1b). We fix the volume of each particle for the three cases of aspect ratio studied. The equivalent diameter of the particle based on the volume,
  $d_e$, is equal to the diameter of the spherical particle, i.e.
  $d_e=d_s=1$ mm. Note that the particles are verified to be finite-size particles. For example, the dissipative length scale of the TC flow,
  $\eta _K$, can be estimated as around
  $0.075$ mm when
  $\omega _i=50$ rad s
 $^{-1}$, which gives
  $d_e>10\eta _K$ and satisfies the assumption of the finite-size model (Voth & Soldati Reference Voth and Soldati2017).
To eliminate the effect of gravity and buoyancy force, the density of the particle and fluid are matched using glycerin-water solution (the weight fraction of the glycerin is  $w_t=25\,\%$). The solution density is
  $\rho _f=1.0598\times 10^3$ kg m
 $^{-3}$ and the kinematic viscosity is
  $\nu =1.913\times 10^{-6}$ m
 $^{2}$ s
 $^{-1}$ at
  $T=22\,^{\circ }$C (Cristancho et al. Reference Cristancho, Delgado, Martinez, Abolghassemi Fakhree and Jouyban2011), giving a 0.02 % density mismatch from the particle density. Since the temperature of the system is well controlled by the circulating water bath, the effects of the temperature variation on the density and viscosity of the solution can be neglected in the present work.
The particle motion is recorded by a CCD camera (MD028MU-SY, Ximea.Inc) at a frequency  $f_c=15$ Hz, and then the particle positions are obtained by performing particle detection. The flow domain is illuminated by a light source, which is shown in figure 1(a). The details of the detection methods and examples can be found in Appendix C.
3. Results
3.1. Drag modification
Firstly, we study the effects of changing the Reynolds number on the drag of the system. For the global analysis of the drag modification by bubbles or particles, the friction coefficient,  $c_{f,\varPhi }$, which evaluates the skin frictional drag of the flow system, has been extensively used in various flow geometries (Sanders et al. Reference Sanders, Winkel, Dowling, Perlin and Ceccio2006; Verschoof et al. Reference Verschoof, Van Der Veen, Sun and Lohse2016; Olivucci, Wise & Ricco Reference Olivucci, Wise and Ricco2021). In the TC system the friction coefficient is defined as (Lathrop, Fineberg & Swinney Reference Lathrop, Fineberg and Swinney1992; van Gils et al. Reference van Gils, Huisman, Bruggert, Sun and Lohse2011)
 \begin{equation} c_{f,\varPhi}= \frac{(1-\eta)^2}{{\rm \pi} \eta^2}\frac{G}{Re^2}. \end{equation}
Figure 2 shows the normalized friction coefficients of the system,  $c_{f,\varPhi }/c_{f,\varPhi =0}$, where
  $c_{f,\varPhi =0}$ is the friction coefficient of the single-phase case. It is found that the drag modification increases with increasing
  $\varPhi$ for a given
  $Re$. In the investigated ranges, the maximum drag enhancement is found to be around
  $20\,\%$, which is observed in the spherical case at
  $Re=6.5\times 10^3$ and
  $\varPhi =10\,\%$ (figure 2b). Additionally,
  $c_{f,\varPhi }/c_{f,\varPhi =0}$ decreases as
  $Re$ increases, which has also been found and is referred to as the shear-thinning effect in the suspension of deformable particles (Adams, Frith & Stokes Reference Adams, Frith and Stokes2004) and the emulsions (Rosti & Takagi Reference Rosti and Takagi2021; Yi, Toschi & Sun Reference Yi, Toschi and Sun2021). Note that, the overall drag of the system (
 $G$ or
  $\tau$, which are not shown here) increases with increasing
  $Re$ and is consistent with the literature (Stickel & Powell Reference Stickel and Powell2005; Fall et al. Reference Fall, Lemaitre, Bertrand, Bonn and Ovarlez2010; Picano et al. Reference Picano, Breugem, Mitra and Brandt2013).

Figure 2. The normalized friction coefficient of the TC system,  $c_{f,\varPhi }/c_{f,\varPhi =0}$, for (a)
  $\lambda =1/3$ (oblate), (b)
  $\lambda =1$ (spherical) and (c)
  $\lambda =3$ (prolate), where
  $c_{f,\varPhi =0}$ is the friction coefficient for the single-phase case. The accuracy of the experiments is indicated by the error bars, which are typically less than 1 %.
The modification of the friction coefficient is related to the changes of the wall stress, which can be decomposed into three parts when no external force and torque is applied on particles, i.e.
 \begin{equation} \tau_{w,\varPhi} = \tau_{v}+\tau_{T}+ \tau_{p}= \tau_{v}+\tau_{T_f}+\tau_{T_p} +\tau_{p}, \end{equation}
where  $\tau _{v}$ the viscous stress of the fluid phase,
  $\tau _{p}$ the particle-induced stress and
  $\tau _{T}= \tau _{T_f}+\tau _{T_p}$ the turbulent Reynolds stress of the combined phase,
  $\tau _{T_f}$ and
  $\tau _{T_p}$ the turbulent Reynolds stress of fluid and particulate phase, respectively. Following the studies in Zhang & Prosperetti (Reference Zhang and Prosperetti2010) and Picano et al. (Reference Picano, Breugem and Brandt2015), the explicit expression of each term above in a Couette flow (Batchelor Reference Batchelor1970; Wang, Abbas & Climent Reference Wang, Abbas and Climent2017a) can be written as
 \begin{gather} \tau_{v} = \mu (1-\varPhi) \frac{\mathrm{d}U_f}{\mathrm{d}r}, \end{gather}
 \begin{gather}\tau_{T_f} ={-}\rho(1-\varPhi) \langle u^{\prime}_fv^{\prime}_f \rangle, \end{gather}
 \begin{gather}\tau_{T_p} ={-}\rho \varPhi \langle u^{\prime}_pv^{\prime}_p \rangle, \end{gather}
 \begin{gather}\tau_{p} = \varPhi \langle \sigma^p_{xy} \rangle, \end{gather}
where  $\mu$ is the dynamic viscosity of the fluid,
  $U_f$ is the mean fluid velocity in the azimuthal direction,
  $u^{\prime }$ and
  $v^{\prime }$ are the velocity fluctuations in the azimuthal and radial directions with the subscripts
  $f$ and
  $p$ denoting the fluid and particulate phase, respectively,
  $\sigma ^p_{xy}$ is the general stress in the particulate phase, normal to the cylindrical surface and pointing in the radial direction. Here we note that the contribution to fluid viscous stress due to velocity in the axial direction is neglected since it is a minor effect.
At a fixed  $Re$, the wall stress of the single-phase case,
  $\tau _{w,\varPhi =0} = \mu ({\mathrm {d}U}/{\mathrm {d}r})|_{r=r_i}$, is a constant, and the particle-induced stress (
 $\tau _{p}$) increases with increasing
  $\varPhi$. In addition, it has been reported that in channel flow (Picano et al. Reference Picano, Breugem and Brandt2015), for a fixed
  $Re$ in the current low particle volume fraction ranges, the viscous stress (
 $\tau _{v}$) weakly depends on
  $\varPhi$, and the turbulent Reynolds stress of the combined phase (
 $\tau _{T}$) increases with increasing
  $\varPhi$. Though there are differences between the channel flow and the TC flow, the result in the channel flow is instructive for the understanding of the current study. Considering the dependence above of the stress on
  $\varPhi$ at a fixed
  $Re$, the normalized friction coefficient increases with increasing
  $\varPhi$, which is consistent with the trends in figure 2. On the other hand, for a fixed low
  $\varPhi$ (as in this work), the turbulent Reynolds stress of the fluid phase in single-phase flow (
 $\tau _{T_f,\varPhi =0}$) increases greatly as
  $Re$ increases, which makes the contribution of particulate phase (
 $\tau _{T_p}$ and
  $\tau _{p}$) relatively insignificant and, therefore, results in the decreasing trends of normalized friction coefficients with increasing
  $Re$. Another feature of the normalized friction coefficients in figure 2 is that, as
  $Re$ increases, the differences between various
  $\varPhi$ decrease. Specifically, when
  $Re$ is small, the contributions of the particulate phase to the wall stress are non-negligible, hence, the normalized wall stress (friction coefficients) highly depends on
  $\varPhi$ through
  $\tau _{T_p}$ and
  $\tau _{p}$. However, when
  $Re$ is high enough and
  $\varPhi$ is low (as in this work), the turbulent Reynolds stress due to the fluid phase in the particle-laden flow and single-phase flow (
 $\tau _{T_f}$ and
  $\tau _{T_f,\varPhi =0}$) plays the dominant role while
  $\tau _{T_p}$ and
  $\tau _{p}$ become minor; therefore, the contributions from particles become less and less important as
  $Re$ increases. Hence, the effect of changing
  $\varPhi$ on the normalized friction coefficients becomes smaller at higher
  $Re$ in the current parameter regimes.
On the other side, taking the particle-laden flow as a continuous effective fluid, the interaction between the particles and the resulting particle distributions are related to the rheology of a particle-laden flow, which can be quantified by the effective viscosity,  $\nu _{eff}$. In the Stokes regime (
 $Re\ll 1$) the rheology of dense granular suspensions has been extensively investigated, and the dependence of the effective viscosity on the particle volume fraction has been discussed (Guazzelli & Pouliquen Reference Guazzelli and Pouliquen2018). In the current semi-dilute regime (
 $\varPhi \leq 10\,\%$) the normalized effective viscosity of the granular flow in the Stokes regime,
  $\nu ^S_{eff}$, can be approximated using the Krieger & Dougherty (K-D) formula (Krieger & Dougherty Reference Krieger and Dougherty1959),
 \begin{equation} \frac{\nu^S_{eff}}{{\nu_f}} =\left(1-\frac{\varPhi}{\varPhi_m}\right)^{-[\eta]\varPhi_m}, \end{equation}
where  $\nu _f$ is the viscosity of the fluid,
  $\varPhi _m$ is the maximum packing particle fraction (
 $\varPhi _m = 0.65$ is used here as done in Stickel & Powell Reference Stickel and Powell2005) and
  $[\eta ]={\frac 52}$ for rigid spheres. In this work,
  $\nu _{eff}$ was calculated using the same method as in previous works (Bakhuis et al. Reference Bakhuis, Ezeta, Bullee, Marin, Lohse, Sun and Huisman2021; Yi et al. Reference Yi, Toschi and Sun2021), and the details can be found in Appendix B. As shown in figure 3, we compare the experimental results with the K-D formula. Though the model captures the increasing trend of the effective viscosity, the
  $Re$-dependence of the effective viscosity is missing, indicating that the relation in the Stokes regime is no longer valid in the current situation. The disparity found between the experimental data and the model can be understood since (3.7) was obtained based on the assumptions that the flow is inertialess and the particles distribute uniformly in the Stokes regime. However, for the current turbulent flow (
 $Re\sim 10^4$) and the suspended finite-size particles, the particle inertia is non-negligible and can be measured by the Stokes number, which is far beyond unity as shown in the later section. Moreover, as has been reported in previous numerical studies (Picano et al. Reference Picano, Breugem and Brandt2015; Ardekani & Brandt Reference Ardekani and Brandt2019), the particles show collective effects, which are also found in our experiments and will be discussed later. Note that when
  $Re=6.5\times 10^3$, the flow could be in the classical regime with laminar boundary layers and a turbulent bulk with Taylor vortex (Grossmann et al. Reference Grossmann, Lohse and Sun2016), which may account for the tendency for the effective viscosity in this Re case to increase faster than the model and other experimental data sets. Using the effective viscosity, the shear-thinning effect of the particle-laden flow is also examined, which can be well described by the Herschel–Bulkley model (Herschel & Bulkley Reference Herschel and Bulkley1926), the details of which can be found in Appendix B.

Figure 3. The non-dimensional effective viscosity,  $\nu _{eff}/\nu _f$, as a function of the particle volume fraction,
  $\varPhi$, for (a)
  $\lambda =1/3$ (oblate), (b)
  $\lambda =1$ (spherical) and (c)
  $\lambda =3$ (prolate), where
  $\nu _f$ is the kinematic viscosity of the solution.
3.2. Effects of the particle aspect ratio
Next, we investigate the effects of changing the particle aspect ratio on the drag of the system. Particles with three kinds of aspect ratio are used:  $\lambda =1/3$ (oblate),
  $\lambda =1$ (spherical) and
  $\lambda =3$ (prolate). The results are already given in figures 2 and 3. It is found that the particles could increase the drag of the system regardless of their aspect ratio, which is attributed mostly to the hydrodynamics interactions and rarely to the frictional contact between the particles in the current low
  $\varPhi$ range (Guazzelli & Pouliquen Reference Guazzelli and Pouliquen2018). The shear-thinning effect and the increasing trend of the drag modification with increasing
  $\varPhi$ are found to be ubiquitous in all cases.
It is remarkable, however, that particles with different aspect ratios could affect the drag of the system to different degrees, even for the same  $Re$ or
  $\varPhi$. As shown in figure 2, for a given
  $\varPhi$, the
  $c_{f,\varPhi }/c_{f,\varPhi =0}$ of the oblate case decrease much more rapidly than that of the spherical and prolate cases, indicating that the suspended oblate particles result in a more pronounced shear-thinning effect, which can also be verified by the effective viscosity (see Appendix B). Moreover, for a given
  $Re$ and
  $\varPhi$, the suspensions of the spherical, prolate and oblate particles result in the maximum, moderate and minimal drag, respectively. In the investigated ranges, the largest discrepancy of
  $c_{f,\varPhi }/c_{f,\varPhi =0}$ between suspensions of particles with different aspect ratios is
  $4\,\%$, which occurs at
  $\varPhi =10\,\%$ and
  $Re=1.3\times 10^4$ in the spherical and oblate cases. Given the impressive accuracy of the drag measurements (less than 1 %) and the relatively low
  $\varPhi$, this disparity in the drag modification is quite noticeable. In addition, the difference of
  $c_{f,\varPhi }/c_{f,\varPhi =0}$ increases with increasing
  $\varPhi$, which is due to the increasing importance of particle-induced stress at higher
  $\varPhi$ (Ardekani & Brandt Reference Ardekani and Brandt2019). Therefore, it is reasonable to speculate that, as
  $\varPhi$ further increases, the differences of the drag modification between different aspect ratios would become larger. Note that this result is different from the particle-laden channel flow in the previous study (Ardekani & Brandt Reference Ardekani and Brandt2019), where they found that only the spherical particles increase the drag and the other two types of particles reduce the drag.
The dependence of the drag on the particle aspect ratio provides an experimental clue to the understanding of the mechanisms of bubbly drag reduction. Flow with dispersed bubbles can, under certain conditions, result in significant drag reduction (van den Berg et al. Reference van den Berg, Luther, Lathrop and Lohse2005, Reference van den Berg, van Gils, Lathrop and Lohse2007; Ezeta et al. Reference Ezeta, Bakhuis, Huisman, Sun and Lohse2019). However, bubbles are deformable, making it impossible to fix the bubble shape and, therefore, to isolate the effects of the bubble shape. van Gils et al. (Reference van Gils, Guzman, Sun and Lohse2013) and Verschoof et al. (Reference Verschoof, Van Der Veen, Sun and Lohse2016) have reported that the bubble deformation is crucial for achieving significant drag reduction, but the contributions of (i) the deformation process and (ii) the ultimate bubble shape after the deformation remain unknown. Obviously, the rigid particle suspensions are significantly different from bubbly flow, including the slip conditions at the surface, the resistance of the dispersed phase to straining motion, the polydispersity, the presence/absence of contaminants (surfactants), etc, and, therefore, a one-to-one comparison between these two types of flow is also unrealistic. However, the one that should be emphasized is that, as done in this work, the shape effect of rigid spheroidal finite-size particles on the overall drag provides a relatively effortless implement to study the shape effects of bubbles during the deformation process. Notwithstanding how simplistic the rigid particles are compared with bubbles, the kinematic motion of these particles (rigid particles and bubbles) is somehow similar, making the study of the rigid particles a reasonable choice to provide a reference case for bubbly flow studies. In this work the rigid spheroidal particles are used to study their shape effect on drag. Due to the frictional contact between solid surfaces, rigid particles dispersed in the flows result in the drag enhancement (Guazzelli & Pouliquen Reference Guazzelli and Pouliquen2018), which is contrary to the drag reduction in the bubbly flow. However, the fact that the particle aspect ratio affects the drag modification in the current particle-laden flow, also hints that the bubble shape could affect the drag of the bubbly flow. Given that the shape effect on the overall drag is relatively small (compared with the drag modulation amplitude in bubbly flow, which is around 40 % at  $\varPhi = 4\,\%$ Verschoof et al. Reference Verschoof, Van Der Veen, Sun and Lohse2016), one would expect that the bubbles can also modulate the turbulence through other mechanisms next to the change of their shapes. Therefore, the unique features of bubbly flow relative to rigid particle-laden flow are worthy of attention for future studies.
3.3. The collective effects of particles
To reveal the physical mechanism of the drag modification, we look into the particle distribution by performing optical measurements. It should be noted that, even at the minimal particle volume fraction ( $\varPhi =2\,\%$), the particles cause violent light scattering and cannot be accurately detected by algorithms. Therefore, we start with a smaller volume fraction (
 $\varPhi =0.5\,\%$, the number of particles
  ${\simeq }1700$) to reduce the intensity of the light scattering, so that the particles in the images can be detected using the ellipse detection algorithms (Lu et al. Reference Lu, Xia, Shao and Fu2020). One may question as to whether the particle distribution obtained at this low volume fraction could qualitatively represent that at higher volume fractions since the particle dynamics change greatly with increasing
  $\varPhi$. To assuage this misgiving, we perform torque measurements at
  $\varPhi =0.5\,\%$ and the results have been shown in figures 2, 3, 8–10. It can be seen that the quantities related to the drag of the system at
  $\varPhi =0.5\,\%$ (including
  $c_f$,
  $\nu _{eff}$ and
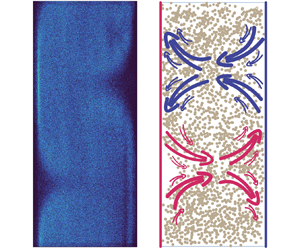
  $G$) show similar trends to that at higher volume fractions, hinting that the particles behave in similar ways at the low and high volume fractions in the current parameter regimes. Here, as depicted in figure 4(a,c), we define the region where the plumes are ejected from the inner (outer) boundary layer to the bulk as the ejected (injected) region, and the region between them is defined as the vortex-centre region. The spherical particle positions which are obtained from different frames when
  $\varPhi =0.5\,\%$ at
  $Re=6.5\times 10^3$ and
  $Re=1.3\times 10^4$ are given in figures 4(a) and 4(b), respectively. When
  $Re=6.5\times 10^3$, it is found that the particles distribute non-uniformly, and the pattern of the particle distributions reminisces about the Taylor vortices in TC flow (Grossmann et al. Reference Grossmann, Lohse and Sun2016). The particle distributions show a lower clustering near the inner wall in the ejected region, while in the injected region the lower clustering emerges near the outer wall. However, when
  $Re$ is increased to
  $1.3\times 10^4$, the particles distribute nearly homogeneously in the entire system (figure 4b).

Figure 4. The spherical particle positions which are obtained from different frames for  $\varPhi =0.5\,\%$ at (a)
  $Re=6.5\times 10^3$ and (b)
  $Re=1.3\times 10^4$. The value of the colour bar denotes the number of times that the particles appear at the position denoted by the points in the graph. The green, magenta and yellow rectangles represent the injected region, vortex-centre region and the ejected region, respectively, and the width of which is around
  $1.7d_e$. Note that most of the points in the graph are corresponding to values of
  $1{\sim}2$ in the colour bar. (c) Sketch of the flow structures and particle positions (dots) at
  $Re=6.5\times 10^3$. The injected and ejected plumes are represented by the red and blue arrows, respectively. Note that the particle positions in the sketch are not experimental data and are for demonstration only.
To quantitatively evaluate the collective effects of the particles, we choose three typical regions of the flow structures (i.e. the injected region, ejected region and the vortex-centre region) and calculate the probability density function (PDF) of the particle radial positions. As shown in figure 5, the PDF is consistent with the pattern of the particle distributions in figure 4. When  $Re=6.5\times 10^3$, the PDF has the minimal value near the inner wall in the ejected region, indicating the emergence of the lower clustering region. While in the injected region, the PDF peaks near the inner wall (i.e. highly clustering region) and approaches the lowest value near the outer wall. Not surprisingly, as shown in figure 5(b), the PDF curves tend to overlap with each other when
  $Re$ increases, indicating that the distribution of the particles becomes less non-uniform in the entire system at higher
  $Re$. Note that, the inner wall peak appears in the ejected region at higher
  $Re$ (figure 5b), which is opposite to the behaviour found at low
  $Re$ (figure 5a), and this might result from the slight shift of flow structure positions since the positions of the Taylor vortex could be not exactly the same at low and high
  $Re$. The difference of the particle distributions at different
  $Re$ can be interpreted from the perspective of the evolution of flow structures and the finite-size effect of the particles. On the one hand, though the TC flow displays flow structure at high
  $Re$ (Huisman et al. Reference Huisman, Van Der Veen, Sun and Lohse2014), the Taylor vortices become turbulent and the velocity fluctuations increase as
  $Re$ increases (Grossmann et al. Reference Grossmann, Lohse and Sun2016), resulting in the more vigorous particle motion. On the other hand, the finite-size effect of the particle can be characterized by the particle Reynolds number. Since the slip velocity of the particles is not accessible in the current experiments, the particle Reynolds number is estimated using the bulk velocity of the flow
  $u_b$, i.e.
  $Re_p=u_bd_e/\nu$, where
  $u_b$ can be estimated as
  $u_b\simeq 0.4\cdot \omega _ir_i$ in the present Reynolds number regime (Grossmann et al. Reference Grossmann, Lohse and Sun2016). Considering that the flow Reynolds number is defined by (2.1), one can obtain the particle Reynolds number as
 \begin{equation} Re_p=0.4{\frac{d_e}{d}}Re. \end{equation}
Hence,  $Re_p$ ranges from
  $2.6\times 10^2$ to
  $10^3$ in the experiments, and the finite-size effects of the particle become more pronounced at higher
  $Re$.
$Re$.

Figure 5. The PDF of the particles position for  $\lambda =1$ (spherical) at (a)
  $Re=6.5\times 10^3$ and (b)
  $Re=1.3\times 10^4$. The two red dashed vertical lines in each figure indicate the position of an equivalent radius of the particles (i.e.
  $r_e=0.5d_e$) away from the walls.
Furthermore, the particle inertia can also be measured by the particle Stokes number,  $St=\tau _p/\tau _\eta$, where
  $\tau _p$ and
  $\tau _\eta$ are the inertia response time of the particles and the Kolmogorov time scale of the flow, respectively. For spherical particles suspended in TC flow, the Stokes number is reduced to
 \begin{equation} St={\frac{\rho_pd_p^2}{18\rho_f[(r_o^2-r_i^2)r_id]^{1/2}}(GRe)^{1/2}}, \end{equation}
i.e. the  $St$ (or, the particle inertia) increases with increasing
  $G$ and
  $Re$. For non-spherical particles,
  $St_{non}=c\cdot St$, where
  $c=f(\lambda )$ is a constant only depending on
  $\lambda$ (Voth & Soldati Reference Voth and Soldati2017). Since the suspension is dilute here (
 $\varPhi =0.5\,\%$), the non-dimensional torque
  $G$ can be approximated to that of the single-phase case,
  $G_{sp}$, giving the
  $St$ ranging from
  $10$ to
  $60$. Therefore, in the current
  $Re_p$ and
  $St$ ranges, the suspended particles could induce unsteady wakes and exhibit inertia clustering (Toschi & Bodenschatz Reference Toschi and Bodenschatz2009; Mathai, Lohse & Sun Reference Mathai, Lohse and Sun2020). Specifically, for the case of
  $Re=6.5\times 10^3$ in figure 4(a) (correspondingly,
  $Re_p=2.6\times 10^2$ and
  $St=10$), the particles are principally driven by the strong plumes released from the boundary layer, which are depicted by the arrows in figure 4(c). While for the case of
  $Re=1.3\times 10^4$ in figure 4(b) (correspondingly,
  $Re_p=5.2\times 10^2$ and
  $St=25$), the particles with the increased inertia can escape more easily from the flow structures and distribute more uniformly.
Since the particle distributions are inhomogeneous in the axial direction of the system, we use the averaged PDF, which is obtained by calculating the arithmetic average value of the three typical regions, to quantitatively represent the collective effects of particles in the entire system. As shown in figure 6(a–c), for a given  $\lambda$, the trends of the averaged PDF curves remain when the
  $Re$ increases from
  $6.4\times 10^3$ to
  $Re=1.3\times 10^4$, suggesting that the increasing turbulent intensity has negligible effects on the averaged particle migration in the radial direction of the system in the current situation.

Figure 6. The averaged PDF of the particles position (a,d) for  $\lambda =1/3$ (oblate), (b,e) for
  $\lambda =1$ (spherical), (c,f) for
  $\lambda =3$ (prolate). Plots (a–c) are obtained at
  $\varPhi =0.5\,\%$ by calculating the arithmetic average value of the three typical regions in figure 4, while (d–f) are obtained at
  $\varPhi =2\,\%$ by manually detecting the particle positions. The two red dashed vertical lines in each figure are the same as in figure 5.
Nevertheless, for different  $\lambda$, the averaged PDF curves show distinct differences regardless of the
  $Re$. In other words, particles with different
  $\lambda$ show different collective behaviours near the walls and thereby are expected to affect the boundary layer to different degrees. Indeed, the formation of particle layers has been reported in the particle-laden channel flow in the previous simulation works (Costa et al. Reference Costa, Picano, Brandt and Breugem2016; Ardekani et al. Reference Ardekani, Costa, Breugem, Picano and Brandt2017; Ardekani & Brandt Reference Ardekani and Brandt2019). Ardekani & Brandt (Reference Ardekani and Brandt2019) have shown that the spherical particles form a particle layer, which could enhance the near-wall Reynolds stress. While for the cases of the oblate and prolate particles, the near-wall Reynolds stress is attenuated due to the absence of the particle layer. In the present work in TC flow, as indicated in figures 5 and 6(b), the spherical particles preferentially cluster and form a particle layer near the inner wall, where the boundary layer exists. Therefore, the maximum drag modification is observed in the flow laden with spherical particles. However, the near-wall clustering phenomenon disappears in the oblate case (figure 6a), of which the PDF peaks in the bulk and has the lowest value near the walls. The averaged PDF curves indicate that the oblate particles prefer to cluster in the bulk and thereby have a smaller effect on the boundary layer, accounting for the observations of the minimal drag modification in figures 2 and 3.
However, one more question remains since so far the analyses of particle distribution are based on the optical measurements at  $\varPhi =0.5\,\%$: will the particle preferential clustering persist at even higher
  $\varPhi$? To bridge the gap of volume fractions between the torque measurements (
 $\varPhi \geq 2\,\%$) and optical measurements (
 $\varPhi =0.5\,\%$), we further conduct optical measurements at higher volume fractions. Since the domain is illuminated from the back, the light intensity decreases greatly at higher volume fractions, making it difficult to distinguish the particles from the background fluid. At higher volume fractions, the feasible method to detect the particles is manual detection, which is of relatively low accuracy but provides reliable information. The averaged PDF curves of particle distribution at
  $\varPhi =2\,\%$ are shown in figure 6(d–f). For each case, 100 frames are used and the total number of detected particles is more than 3000. For even higher volume fractions (
 $\varPhi \geq 4\,\%$), the enormous amount of unfocused particles make the particles inside the focal plane invisible; therefore, no useful data can be obtained.
One can see in figure 6(d–f) that the spherical particles still preferentially cluster near the inner wall and, therefore, form a particle layer, which is consistent with the result obtained at  $\varPhi =0.5\,\%$. Additionally, at
  $\varPhi =2\,\%$, the distribution of spherical particles becomes more non-uniform in the radial direction than that at
  $\varPhi =0.5\,\%$, which has also been reported in Fornari et al. (Reference Fornari, Formenti, Picano and Brandt2016), hinting that the spherical particles tend to move toward the walls as
  $\varPhi$ increases. This growing non-uniform distribution possibly results from the stronger shear-induced particle–particle interactions at higher
  $\varPhi$, and could partially account for the increasing drag differences compared with other particle shapes as
  $\varPhi$ increases. Moreover, as
  $\varPhi$ increases, the particles might relaminarize the bulk flow and, thus, suppress the Reynolds stress (Fornari et al. Reference Fornari, Formenti, Picano and Brandt2016). This Reynolds stress suppression could therefore yield a stronger
  $Re$-dependence of the drag at higher
  $\varPhi$, which is verified by the stronger shear-thinning effects of the normalized friction coefficient (figure 2) and the normalized effective viscosity (figure 10). On the other hand, for oblate and prolate cases, it is clear that most of the particles distribute in the bulk region. The near-wall clustering phenomenon disappears and, therefore, the particle layer is absent, which is similar to that of
  $\varPhi =0.5\,\%$ and accounts for their similar overall drag.
So far, the optical measurements performed at  $\varPhi =0.5\,\%$ and
  $\varPhi =2\,\%$ lead to the same conclusion that the larger drag modification is connected to the near-wall particle clustering in the current system. Though the result and conclusion of particle preferential clustering might not be directly extrapolated further to higher volume fractions, one reasonable speculation would be that it will play a significant role in the drag modulation at higher
  $\varPhi$. Of course, further studies are needed to confirm it in future work.
4. Conclusion
In this study we experimentally investigated the drag modification by neutrally buoyant finite-size particles in the TC turbulent flow. The Reynolds number ranges from  $6.5\times 10^3$ to
  $2.6\times 10^4$, and the particle volume fraction ranges from
  $0\,\%$ to
  $10\,\%$. To study the shape effects of the finite-size particle, we conduct experiments using particles with aspect ratios equal to
  $\lambda =1/3$ (oblate),
  $\lambda =1$ (spherical), and
  $\lambda =3$ (prolate). It is found that, different from the cases in bubbly TC flow, the rigid particles increase the drag of the system due to the frictional contact between solid surfaces, and the particle-laden flow somehow exhibits the shear-thinning effect since the turbulent stress becomes dominant at higher Reynolds number in the current low volume fraction ranges. The drag modification by the particles was also interpreted from the perspective of the effective viscosity, which shows a discrepancy from the K-D formula due to the non-negligible flow inertia and the non-uniform particle distributions at high
  $Re$ and
  $\varPhi$ in the current study. Through varying the particle aspect ratios, we found that the suspensions of the spherical, prolate and oblate particles result in the maximum, moderate and minimal drag, respectively. The dependence of the drag modification on the particle aspect ratio also hints that the bubble shape might affect the drag of the flow to some extent in bubbly flow.
Furthermore, we performed optical measurements at low volume fractions ( $\varPhi =0.5\,\%$ and
  $\varPhi =2\,\%$) and found that the drag modification induced by the suspended particles is related to the particle collective effects. For
  $Re=6.5\times 10^3$ (correspondingly,
  $Re_p=2.6\times 10^2$ and
  $St=10$) at
  $\varPhi =0.5\,\%$, the particles could follow the motion of the flow and the distributions of the particle positions obtained from different frames reflect the Taylor vortices. However, when
  $Re$ increases to
  $1.3\times 10^4$ (correspondingly,
  $Re_p=5.2\times 10^2$ and
  $St=25$), the Taylor vortices become turbulent and the finite-size effects of the particle increase, allowing the particles to escape more easily from the flow structures and resulting in the more uniform distributions. Additionally, it is found that the particle aspect ratio affects the particle collective effects. The spherical particles preferentially cluster near the walls and form a particle layer, which are absent in the oblate case. This particle preferential clustering is verified to hold at
  $\varPhi =2\,\%$. Based on the results, it can be concluded that, for particles with different aspect ratios at low volume fractions (
 $\varPhi =0.5\,\%$ and
  $\varPhi =2\,\%$ here), the different preferential collective effects could affect the boundary layer to different degrees, and finally result in the different drag modifications. More studies are needed to further explore how particles modify the overall drag at higher volume fractions.
Funding
This work was supported by the Natural Science Foundation of China under grant nos. 11988102, 91852202, and Tencent Foundation through the XPLORER PRIZE.
Declaration of interests
The authors report no conflict of interest.
Appendix A. Torque measurement and the end effect calibration
The torque of system,  $\tau _{total}$, can be divided into two parts: (i) the torque,
  $\tau$, due to the sidewall of the inner cylinder (TC flow), (ii) the torque,
  $\tau _{end}$, contributed from the von Kármán flow at the end plates. Since
  $\tau$ increases linearly with the height of the inner cylinder (Greidanus, Delfos & Westerweel Reference Greidanus, Delfos and Westerweel2011; Hu Reference Hu2017), the
  $\tau _{end}$ can be obtained through the vertical intercept of the fitting lines. We conduct experiments to measure the torque using three apparatus with different heights of
  $L$,
$L$,  $1.5L$,
  $2L$, and the results are shown in figure 7. In these calibration experiments, the single-phase glycerin-water solution is used (i.e.
  $\varPhi =0$). For different Reynolds numbers, the ratio of
  $\tau _{end}$ to
  $\tau _{total}$ is found to be around a constant (25 %). Here we assume that, for
  $\varPhi >0$, the ratio of
  $\tau _{end}$ to
  $\tau _{total}$ is the same as that for the single-phase case (
 $\varPhi =0$).

Figure 7. The calibration of the torque measurements. The torque contribution from the von Kármán flow at the ends of the system can be determined as the vertical intercept of the fitting line. Here the particle volume fraction  $\varPhi =0$, i.e. the single-phase glycerin-water solution, is used.
Appendix B. Calculation of the effective viscosity
The rheology of multiphase flow can be characterized using the effective viscosity,  $\nu _{eff}$. For single-phase TC turbulent flow (
 $\varPhi =0\,\%$), a simple scaling law exists between
  $G$ and
  $Re$:
$Re$:  $G\propto Re^\alpha$ (Eckhardt, Grossmann & Lohse Reference Eckhardt, Grossmann and Lohse2000). Assuming that this relation is still valid for particle-laden flow (
 $\varPhi >0\,\%$) here, the following equation can be derived:
 \begin{equation} \frac{\nu_{eff}}{\nu_f}={\left(\frac{\tau}{{\tau_f}}\right)^{1/{(2-\alpha)}}}. \end{equation}
Here  $\nu _f$ is the viscosity of the fluid (i.e. the single-phase flow), and
  $\tau$ and
  $\tau _f$ are the measured torque for the particle-laden flow and the single-phase flow, respectively. As one could see from the derivation above, the effective viscosity is a fitting parameter depending on the scaling law between
  $G$ and
  $Re$. Using the equation above, the effective viscosity of the particle-laden flow can be calculated. We define the modified dimensionless torque,
  $G_m={\tau }/{{2{\rm \pi} l\rho _f\nu _{eff}^2}}$ and the modified Reynolds number,
  $Re_m=\omega _ir_id/\nu _{eff}$. As shown in figure 8, it is found that the particle-laden flow satisfied the scaling law
  $G_m\propto Re_m^\alpha$, where
  $\alpha \simeq 1.6$. The dependence of the normalized friction coefficient on the modified Reynolds number is shown in figure 9. Using the effective viscosity, the shear-thinning effect of the particle-laden flow can be quantified. The dependence of the non-dimensional effective viscosity,
  $\nu _{eff}/\nu _f$, on the characteristic shearing rate,
  $\dot {\gamma }=\omega _ir_i/d$, for various aspect ratios is shown in figure 10. To evaluate the shear-thinning effect of the particle-laden flow, we use the Herschel–Bulkley (HB) model (Herschel & Bulkley Reference Herschel and Bulkley1926),
 \begin{equation} \mu_{eff}=k_0\dot{\gamma}^{n-1}+\tau_0\dot{\gamma}^{{-}1}, \end{equation}
where  $\mu _{eff}$ is the effective dynamic viscosity of the particle-laden flow,
  $k_0$ and
  $n$ represent the consistency and the flow index, respectively, and
  $\tau _0$ is the yield shear stress. Since the flow is far from the jamming state in the current system, the yield shear stress is expected to be zero (
 $\tau _0=0$). As the density of the fluid and the particle are matched, we take
  $\rho _f$ as the density of the particle-laden flow, giving
  $\mu _{eff}/\mu _f$ =
  $\nu _{eff}/\nu _f$, where
  $\mu _f$ is the dynamic viscosity of the single-phase flow. Consequently, the HB model can be simplified as
  $\nu _{eff}/{\nu _f}=k_0\dot {\gamma }^{n-1}/\mu _f$ and the fitting curves are shown in figure 10. Note that the fitting parameter
  $k_0$ is different for various particle aspect ratios and volume fractions. For the single-phase case (
 $\varPhi =0\,\%$), the normalized effective viscosity
  $\nu _{eff}/\nu _f$ is around 1 for various
  $Re$. When
  $\varPhi$ increases, the HB model agrees well with the experimental data, and the flow index
  $n$ of the HB model decreases with increasing
  $\varPhi$, suggesting that the shear-thinning effect becomes more pronounced at higher
  $\varPhi$.

Figure 8. The dependence of the modified dimensionless torque,  $G_m$, on the modified Reynolds number,
  $Re_m$, for (a)
  $\lambda =1/3$ (oblate), (b)
  $\lambda =1$ (spherical), (c)
  $\lambda =3$ (prolate). The insets show
  $G_m$ compensated with
  $Re_m^{-1.6}$.

Figure 9. The normalized friction coefficient of the TC system,  $c_{f,\varPhi }/c_{f,\varPhi =0}$, as a function of the modified Reynolds number,
  $Re_m$, for (a)
  $\lambda =1/3$ (oblate), (b)
  $\lambda =1$ (spherical) and (c)
  $\lambda =3$ (prolate), where
  $c_{f,\varPhi =0}$ is the friction coefficient for the single-phase case. The accuracy of the experiments is indicated by the error bars, which is typically less than 1 %.

Figure 10. The dependence of the non-dimensional effective viscosity,  $\nu _{eff}/\nu _f$, on the characteristic shearing rate,
  $\dot {\gamma }$, for (a)
  $\lambda =1/3$ (oblate), (b)
  $\lambda =1$ (spherical) and (c)
  $\lambda =3$ (prolate). The curves are fitting results using the HB model. Insets: the decreasing flow index
  $n$ with the increasing
  $\varPhi$ indicates a more pronounced shear-thinning effect at higher
  $\varPhi$.
Appendix C. Particle detection
During the optical measurements, we locate the focal plane of the camera at the crossing plane of the axis and the light line (the cyan shadow plane in figure 1a). The depth of the field is around 0.21 mm, which is smaller than the particle diameter. Therefore, the depth resolution in the azimuthal direction is high enough. The central height of the camera is kept the same as the apparatus so that the visible window is located at the central height of the apparatus; therefore, the ending effects in the axis direction are eliminated.
Particle detection is performed using the ellipse detection method proposed by Lu et al. (Reference Lu, Xia, Shao and Fu2020). Examples of particle detection are given in figure 11. Inside the focal plane, most particles are detected and a few others are not since the material used to print the particles is transparent. Therefore, to ensure the accuracy of the data, 30 000 frames are used to calculate the distribution of particle positions (figure 4) and the PDF curves (figures 5 and 6) for each  $Re$ case.

Figure 11. The examples of particle detection for (a)  $\lambda =1/3$ (oblate), (b)
  $\lambda =1$ (spherical) and (c)
  $\lambda =3$ (prolate) at
  $Re=6.5\times 10^3$. Most particles inside the focal plane have been detected.


