


1 Introduction
The fragmentation of drops is a phenomenon of common occurrence in nature, i.e. the shattering of rain drops (Villermaux & Bossa Reference Villermaux and Bossa2009), the mist in the ocean formed from breaking waves and bubble entrainment (Walls, Bird & Bourouiba Reference Walls, Bird and Bourouiba2014; Veron Reference Veron2015); in volcano eruptions, deep below the Earth’s surface, bubbles nucleate and expand as they rise through the magma column, then during eruption these bubbles are shattered, forming a mist of lava drops (Gonnermann & Manga Reference Gonnermann and Manga2007); fragmentation is also frequently observed in man-made applications such as irrigation, ink-jet printing and internal combustion engines, to name a few (Villermaux Reference Villermaux2007).
A particular form of fragmentation also takes place when a concentrated source of energy, a laser beam, impacts a droplet or a collection of droplets. The fundamental understanding of drop atomization/fragmentation is of interest in laser beam propagation in the atmosphere. Here, it is required to counteract the effect of thermal blooming which occurs when the medium through which the laser beam propagates absorbs heat, thus causing the beam to spread (Schonfeld Reference Schonfeld1992). This topic is also of interest for in situ analysis of combustion products (Carls & Brock Reference Carls and Brock1987), a great concern due to its ecological implications (Wang et al.
Reference Wang, Maiorov, Baer, Garbuzov, Conolly and Hanson2000). In liquid chromatography based on laser-induced breakdown spectroscopy (LIBS), single droplets are atomized with a nanosecond Nd:YAG laser. Due to fragmentation, the initial droplet of approximately
 $50~\unicode[STIX]{x03BC}\text{m}$
becomes largely expanded while it emits light which is then collected and analysed by a spectrometer (Janzen et al.
Reference Janzen, Fleige, Noll, Schwenke, Lahmann, Knoth, Beaven, Jantzen, Oest and Koke2005). More recently, not only the fragmentation but also the shaping of liquid drops has caught the attention of research groups, as this is a hydrodynamic process closely related to a phenomenon that occurs in lithography machines; a deeper fundamental understanding of it can lead to improvements in the future design of these devices (Banine, Koshelev & Swinkels Reference Banine, Koshelev and Swinkels2011; Klein et al.
Reference Klein, Bouwhuis, Visser, Lhuissier, Sun, Snoeijer, Villermaux, Lohse and Gelderblom2015).
$50~\unicode[STIX]{x03BC}\text{m}$
becomes largely expanded while it emits light which is then collected and analysed by a spectrometer (Janzen et al.
Reference Janzen, Fleige, Noll, Schwenke, Lahmann, Knoth, Beaven, Jantzen, Oest and Koke2005). More recently, not only the fragmentation but also the shaping of liquid drops has caught the attention of research groups, as this is a hydrodynamic process closely related to a phenomenon that occurs in lithography machines; a deeper fundamental understanding of it can lead to improvements in the future design of these devices (Banine, Koshelev & Swinkels Reference Banine, Koshelev and Swinkels2011; Klein et al.
Reference Klein, Bouwhuis, Visser, Lhuissier, Sun, Snoeijer, Villermaux, Lohse and Gelderblom2015).
Earlier studies focused on the vaporization and fragmentation of small drops (Kafalas & Ferdinand Reference Kafalas and Ferdinand1973; Kafalas & Herrmann Reference Kafalas and Herrmann1973); also, significant attention was given to the characterization of the plasma created by a high-intensity laser beam on a transparent droplet, i.e. the velocity of propagation of the plasma, the shape of the plume, and the density of the plasma (Eickmans, Hsieh & Chang Reference Eickmans, Hsieh and Chang1987a
,Reference Eickmans, Hsieh and Chang
b
; Hsieh et al.
Reference Hsieh, Zheng, Wood, Chu and Chang1987; Lindinger et al.
Reference Lindinger, Hager, Sosaciu, Bernhardt, Wöste, Duft and Leisner2004). In these early studies, much of the work was focused on monodisperse droplets of radius,
 $R_{d}$
, in the range
$R_{d}$
, in the range
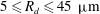 $5\leqslant R_{d}\leqslant 45~\unicode[STIX]{x03BC}\text{m}$
; thus when they were irradiated by the laser beam they were fully atomized. When larger drops were tested, the energy irradiated on them was not enough to fully atomize them. Partially fragmented drops that evolve into a thin liquid film resembling a jellyfish have been shown by Singh & Knight (Reference Singh and Knight1980), Alexander & Armstrong (Reference Alexander and Armstrong1987), Zhang et al. (Reference Zhang, Lam, Wood, Chu and Chang1987) and Lindinger et al. (Reference Lindinger, Hager, Sosaciu, Bernhardt, Wöste, Duft and Leisner2004).
$5\leqslant R_{d}\leqslant 45~\unicode[STIX]{x03BC}\text{m}$
; thus when they were irradiated by the laser beam they were fully atomized. When larger drops were tested, the energy irradiated on them was not enough to fully atomize them. Partially fragmented drops that evolve into a thin liquid film resembling a jellyfish have been shown by Singh & Knight (Reference Singh and Knight1980), Alexander & Armstrong (Reference Alexander and Armstrong1987), Zhang et al. (Reference Zhang, Lam, Wood, Chu and Chang1987) and Lindinger et al. (Reference Lindinger, Hager, Sosaciu, Bernhardt, Wöste, Duft and Leisner2004).
In contrast to previous work, our study focuses on the dynamics of the cavitation bubble generated inside the droplet and how this connects with the fragmentation and atomization at later times. Therefore, we varied the droplet size between
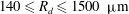 $140\leqslant R_{d}\leqslant 1500~\unicode[STIX]{x03BC}\text{m}$
and the laser energy between
$140\leqslant R_{d}\leqslant 1500~\unicode[STIX]{x03BC}\text{m}$
and the laser energy between
 $0.2\leqslant E_{l}\leqslant 5~\text{mJ}$
. During the bubble nucleation a shock wave is launched which is reflected and refocused inside the droplet, resulting in secondary cavitation. Then we study how the explosive growth of the cavitation bubble being sufficiently close to the droplet surface causes violent atomization. The last aspect is the oscillation of the droplet and the flows and instabilities generated thereby, leading to droplet shapes with mild disturbances up to thin liquid sheets and their capillary-driven fragmentation.
$0.2\leqslant E_{l}\leqslant 5~\text{mJ}$
. During the bubble nucleation a shock wave is launched which is reflected and refocused inside the droplet, resulting in secondary cavitation. Then we study how the explosive growth of the cavitation bubble being sufficiently close to the droplet surface causes violent atomization. The last aspect is the oscillation of the droplet and the flows and instabilities generated thereby, leading to droplet shapes with mild disturbances up to thin liquid sheets and their capillary-driven fragmentation.
The paper is organized as follows: in § 2 the experimental set-up and the relevant experimental parameters are described; in § 3 the results obtained from single-frame flash photography depicting the initial stage of the fragmentation process are introduced. The evolution of the shock wave inside a millimetre-sized drop is then discussed and compared to numerical simulations; next, the fragmentation process of drops of different size and different energy values captured by high-speed video is presented. In § 4 our findings are compared to previous studies on drop fragmentation and specific details are discussed, in particular the stability of the sheet and the droplet surface. This section is closed with a parameter plot summarizing the three experimental regimes. The work is summarized in § 5.

Figure 1. Experimental set-up; (a) acoustic levitator, the laser appears horizontally from left to right in all our experiments; (b) experimental parameters and dimensionless quantities.
2 Experimental set-up
2.1 Experimental equipment
The experimental set-up, depicted in figure 1(a), consists of a Langevin-type transducer that is driven at its resonant frequency,
 $f_{r}=27.4~\text{kHz}$
, and an aluminium block that acts as a reflector of the acoustic waves from the transducer. In this set-up we used the acoustic radiation pressure to maintain a liquid droplet floating in air (Foresti, Nabavi & Poulikakos Reference Foresti, Nabavi and Poulikakos2012). Figure 1(a) also portrays the optical arrangement. A laser beam from a
$f_{r}=27.4~\text{kHz}$
, and an aluminium block that acts as a reflector of the acoustic waves from the transducer. In this set-up we used the acoustic radiation pressure to maintain a liquid droplet floating in air (Foresti, Nabavi & Poulikakos Reference Foresti, Nabavi and Poulikakos2012). Figure 1(a) also portrays the optical arrangement. A laser beam from a
 $Q$
-switched Nd:YAG laser (New Wave Research, wavelength 532 nm, pulse duration 6 ns, laser beam diameter 2.75 mm) is expanded with a plano-concave lens of focal length
$Q$
-switched Nd:YAG laser (New Wave Research, wavelength 532 nm, pulse duration 6 ns, laser beam diameter 2.75 mm) is expanded with a plano-concave lens of focal length
 $f_{1}=-35~\text{mm}$
and collimated with a plano-convex of focal length
$f_{1}=-35~\text{mm}$
and collimated with a plano-convex of focal length
 $f_{2}=125~\text{mm}$
. The laser beam is focused inside the droplet by a 4
$f_{2}=125~\text{mm}$
. The laser beam is focused inside the droplet by a 4
 $\times$
microscope objective (Olympus UPlanFL N, NA
$\times$
microscope objective (Olympus UPlanFL N, NA
 $=$
0.13). The full focusing angle is
$=$
0.13). The full focusing angle is
 $14.9^{\circ }$
and it was kept the same throughout the experiments. We measured the laser energy close to the laser exit port by sampling approximately 4 % of the energy of the beam with a glass plate and recording with an energy meter (Thorlabs, detector ES111C), see figure 1(a). In the reported values for the laser energy we account for the losses from all optical components, which are approximately 50 %. Thus, the energy reported is the radiated laser energy at the focus. Reflections from the droplet surface are not accounted for. The size of the beam waist near the laser focus was estimated with a linagraph laser burn paper (Kodak, type 1895) for various energy values. The radius of the spot decreases with decreasing laser energy, i.e. from approximately
$14.9^{\circ }$
and it was kept the same throughout the experiments. We measured the laser energy close to the laser exit port by sampling approximately 4 % of the energy of the beam with a glass plate and recording with an energy meter (Thorlabs, detector ES111C), see figure 1(a). In the reported values for the laser energy we account for the losses from all optical components, which are approximately 50 %. Thus, the energy reported is the radiated laser energy at the focus. Reflections from the droplet surface are not accounted for. The size of the beam waist near the laser focus was estimated with a linagraph laser burn paper (Kodak, type 1895) for various energy values. The radius of the spot decreases with decreasing laser energy, i.e. from approximately
 $60\unicode[STIX]{x03BC}\text{m}$
at 4 mJ down to approximately
$60\unicode[STIX]{x03BC}\text{m}$
at 4 mJ down to approximately
 $30\unicode[STIX]{x03BC}\text{m}$
at 0.3 mJ. Thus, for all our experiments the droplet size is considerably larger than the beam width. Once the drops are levitating between the transducer and the reflector the laser pulse is aimed at the drop to fragment it. The initial stage of the fragmentation process is analysed by capturing single frames after specific time delays,
$30\unicode[STIX]{x03BC}\text{m}$
at 0.3 mJ. Thus, for all our experiments the droplet size is considerably larger than the beam width. Once the drops are levitating between the transducer and the reflector the laser pulse is aimed at the drop to fragment it. The initial stage of the fragmentation process is analysed by capturing single frames after specific time delays,
 $\unicode[STIX]{x0394}t$
, from the time of the laser pulse; the images are recorded with a digital 12-bit CCD camera (Sensicam QE, 500 ns minimum exposure). The scene is illuminated with red fluorescence emission from a second laser of the same model. The laser beams and the CMOS camera are all synchronized with a pulse delay generator (BNC, Berkeley Scientific). A 60 mm macro lens (Nikor) at full magnification is used; the resolution of the single images is
$\unicode[STIX]{x0394}t$
, from the time of the laser pulse; the images are recorded with a digital 12-bit CCD camera (Sensicam QE, 500 ns minimum exposure). The scene is illuminated with red fluorescence emission from a second laser of the same model. The laser beams and the CMOS camera are all synchronized with a pulse delay generator (BNC, Berkeley Scientific). A 60 mm macro lens (Nikor) at full magnification is used; the resolution of the single images is
 $6.5\unicode[STIX]{x03BC}\text{m}$
per pixel. Moderate diffuse illumination allows one to obtain contrasted images of the bubble and the propagating shock wave inside the droplet, for instance see figures 2(a) and 5(a). Yet, to image the shocks in air in figures 2(d) and 3(a–f) the camera lens was set to a large
$6.5\unicode[STIX]{x03BC}\text{m}$
per pixel. Moderate diffuse illumination allows one to obtain contrasted images of the bubble and the propagating shock wave inside the droplet, for instance see figures 2(a) and 5(a). Yet, to image the shocks in air in figures 2(d) and 3(a–f) the camera lens was set to a large
 $f$
-number without a diffuser. For each droplet, two images are taken, the first image is captured just before the fragmentation takes place, so its size can be obtained; the second image displays the state of the droplet after a specific time delay. The complete fragmentation event was also recorded using a high-speed camera; in this configuration the digital 12-bit CCD camera was replaced with a monochrome high-speed camera (Photron SAX2, 1 Mfps maximum frame rate) and the scene was illuminated with a LED fibre optic lamp (REVOX SLG 150V). The camera was triggered and synchronized with the pulse delay generator. The same 60 mm macro lens (Nikor) at full magnification is used in this configuration; however, the resolution is
$f$
-number without a diffuser. For each droplet, two images are taken, the first image is captured just before the fragmentation takes place, so its size can be obtained; the second image displays the state of the droplet after a specific time delay. The complete fragmentation event was also recorded using a high-speed camera; in this configuration the digital 12-bit CCD camera was replaced with a monochrome high-speed camera (Photron SAX2, 1 Mfps maximum frame rate) and the scene was illuminated with a LED fibre optic lamp (REVOX SLG 150V). The camera was triggered and synchronized with the pulse delay generator. The same 60 mm macro lens (Nikor) at full magnification is used in this configuration; however, the resolution is
 $20\unicode[STIX]{x03BC}\text{m}$
per pixel. The fragmentation events are recorded perpendicular to both the propagation path of the laser beam and the acoustic horn-reflector arrangement The laser energy in these experiments ranged from 0.2 to 5.0 mJ.
$20\unicode[STIX]{x03BC}\text{m}$
per pixel. The fragmentation events are recorded perpendicular to both the propagation path of the laser beam and the acoustic horn-reflector arrangement The laser energy in these experiments ranged from 0.2 to 5.0 mJ.

Figure 2. The droplet’s initial fragmentation; (a) bubble nucleation,
 $R_{d}=309~\unicode[STIX]{x03BC}\text{m}$
,
$R_{d}=309~\unicode[STIX]{x03BC}\text{m}$
,
 $E_{l}=0.5~\text{mJ}$
,
$E_{l}=0.5~\text{mJ}$
,
 $\unicode[STIX]{x0394}t=60~\text{ns}$
; (b) bubble expansion and secondary cavitation on the drop surface,
$\unicode[STIX]{x0394}t=60~\text{ns}$
; (b) bubble expansion and secondary cavitation on the drop surface,
 $R_{d}=284~\unicode[STIX]{x03BC}\text{m}$
,
$R_{d}=284~\unicode[STIX]{x03BC}\text{m}$
,
 $E_{l}=0.9~\text{mJ}$
,
$E_{l}=0.9~\text{mJ}$
,
 $\unicode[STIX]{x0394}t=160~\text{ns}$
; (c) drop deformation;
$\unicode[STIX]{x0394}t=160~\text{ns}$
; (c) drop deformation;
 $R_{d}=275~\unicode[STIX]{x03BC}\text{m}$
,
$R_{d}=275~\unicode[STIX]{x03BC}\text{m}$
,
 $E_{l}=0.9~\text{mJ}$
,
$E_{l}=0.9~\text{mJ}$
,
 $\unicode[STIX]{x0394}t=850~\text{ns}$
; (d) drop wall rupture and shock wave appearance,
$\unicode[STIX]{x0394}t=850~\text{ns}$
; (d) drop wall rupture and shock wave appearance,
 $R_{d}=242~\unicode[STIX]{x03BC}\text{m}$
,
$R_{d}=242~\unicode[STIX]{x03BC}\text{m}$
,
 $E_{l}=0.5~\text{mJ}$
,
$E_{l}=0.5~\text{mJ}$
,
 $\unicode[STIX]{x0394}t=870~\text{ns}$
. The velocity of the shock wave (white arrow) in (a) is
$\unicode[STIX]{x0394}t=870~\text{ns}$
. The velocity of the shock wave (white arrow) in (a) is
 $1720\pm 217~\text{m}~\text{s}^{-1}$
. In all the images the laser pulse propagates from left to right, as shown by the black arrow in (a).
$1720\pm 217~\text{m}~\text{s}^{-1}$
. In all the images the laser pulse propagates from left to right, as shown by the black arrow in (a).

Figure 3. The initial fragmentation of water drops of similar size; single images captured at different time delays
 $\unicode[STIX]{x0394}t$
; (a)
$\unicode[STIX]{x0394}t$
; (a)
 $R_{d}=196~\unicode[STIX]{x03BC}\text{m}$
; (b)
$R_{d}=196~\unicode[STIX]{x03BC}\text{m}$
; (b)
 $R_{d}=135~\unicode[STIX]{x03BC}\text{m}$
; (c)
$R_{d}=135~\unicode[STIX]{x03BC}\text{m}$
; (c)
 $R_{d}=196~\unicode[STIX]{x03BC}\text{m}$
; (d)
$R_{d}=196~\unicode[STIX]{x03BC}\text{m}$
; (d)
 $R_{d}=217~\unicode[STIX]{x03BC}\text{m}$
; (e)
$R_{d}=217~\unicode[STIX]{x03BC}\text{m}$
; (e)
 $R_{d}=200~\unicode[STIX]{x03BC}\text{m}$
; (f)
$R_{d}=200~\unicode[STIX]{x03BC}\text{m}$
; (f)
 $R_{d}=160~\unicode[STIX]{x03BC}\text{m}$
. In these tests
$R_{d}=160~\unicode[STIX]{x03BC}\text{m}$
. In these tests
 $E_{l}=3.8\pm 0.1$
mJ.
$E_{l}=3.8\pm 0.1$
mJ.
2.2 Experimental parameters
The experimental parameters relevant to this study are depicted in figure 1(b).
 $\unicode[STIX]{x1D719}$
is the ratio of horizontal,
$\unicode[STIX]{x1D719}$
is the ratio of horizontal,
 $R_{x}$
, to vertical radius,
$R_{x}$
, to vertical radius,
 $R_{y}$
, and
$R_{y}$
, and
 $\unicode[STIX]{x1D700}_{y}$
and
$\unicode[STIX]{x1D700}_{y}$
and
 $\unicode[STIX]{x1D700}_{x}$
are the vertical and horizontal eccentricities, respectively. Droplets in an acoustic levitator take an ellipsoidal shape (Yarin, Pfaffenlehner & Tropea Reference Yarin, Pfaffenlehner and Tropea1998; Foresti et al.
Reference Foresti, Nabavi and Poulikakos2012); thus to compare the volume of the droplets we report an equivalent radius of a sphere,
$\unicode[STIX]{x1D700}_{x}$
are the vertical and horizontal eccentricities, respectively. Droplets in an acoustic levitator take an ellipsoidal shape (Yarin, Pfaffenlehner & Tropea Reference Yarin, Pfaffenlehner and Tropea1998; Foresti et al.
Reference Foresti, Nabavi and Poulikakos2012); thus to compare the volume of the droplets we report an equivalent radius of a sphere,
 $R_{d}$
, with the same volume as the levitating droplet
$R_{d}$
, with the same volume as the levitating droplet
 $R_{d}=(R_{x}^{2}R_{y})^{1/3}$
.
$R_{d}=(R_{x}^{2}R_{y})^{1/3}$
.
Of the experimental parameters in this work the energy used to fragment the levitating droplets is the more relevant. An obvious energy scale is the work done to form a cavity of the volume of the droplet,
 $V_{d}$
, against the ambient pressure
$V_{d}$
, against the ambient pressure
 $P_{a}$
 $$\begin{eqnarray}E=\unicode[STIX]{x1D705}E_{l}/V_{d}P_{a},\end{eqnarray}$$
where
 $\unicode[STIX]{x1D705}$
is the fraction of the laser energy used to nucleate the cavitation bubble and
$\unicode[STIX]{x1D705}$
is the fraction of the laser energy used to nucleate the cavitation bubble and
 $E_{l}$
is the laser energy. The maximum volume of the cavity can only be obtained from the high-speed recordings in large droplets with sufficiently small bubbles nucleated. From there we can estimate an approximately constant energy conversion factor
$E_{l}$
is the laser energy. The maximum volume of the cavity can only be obtained from the high-speed recordings in large droplets with sufficiently small bubbles nucleated. From there we can estimate an approximately constant energy conversion factor
 $\unicode[STIX]{x1D705}$
. This allows us to estimate
$\unicode[STIX]{x1D705}$
. This allows us to estimate
 $V_{d}$
from the measured laser energy using (2.1), see § 4.6.1.
$V_{d}$
from the measured laser energy using (2.1), see § 4.6.1.
We can introduce a length scale by comparing the time-averaged dynamic pressure during bubble expansion with the coefficient of surface tension, i.e. with the Laplace pressure of the droplet. The averaged velocity is
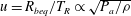 $u=R_{beq}/T_{R}\propto \sqrt{P_{a}/\unicode[STIX]{x1D70C}}$
, (where
$u=R_{beq}/T_{R}\propto \sqrt{P_{a}/\unicode[STIX]{x1D70C}}$
, (where
 $R_{beq}$
is bubble radius and
$R_{beq}$
is bubble radius and
 $T_{R}$
is Rayleigh collapse time), which is independent of the bubble radius (in an infinite fluid) and is obtained from the Rayleigh collapse time, where
$T_{R}$
is Rayleigh collapse time), which is independent of the bubble radius (in an infinite fluid) and is obtained from the Rayleigh collapse time, where
 $P_{a}$
is the ambient pressure. The ratio of the coefficient of surface tension and the dynamic pressure
$P_{a}$
is the ambient pressure. The ratio of the coefficient of surface tension and the dynamic pressure
 $\unicode[STIX]{x1D70C}u^{2}$
gives a length scale at which the dynamic pressure and the surface tension balance, i.e.
$\unicode[STIX]{x1D70C}u^{2}$
gives a length scale at which the dynamic pressure and the surface tension balance, i.e.
 $\unicode[STIX]{x1D70E}/P_{a}$
. This length scale is approximately 2–3 orders of magnitude smaller than the droplet radius in the present study.
$\unicode[STIX]{x1D70E}/P_{a}$
. This length scale is approximately 2–3 orders of magnitude smaller than the droplet radius in the present study.
When the experiments are conducted each droplet is positioned in the acoustic field such that the laser impacts it approximately at the equatorial plane,
 $-1.0\leqslant \unicode[STIX]{x1D700}_{x}\leqslant 1.0$
,
$-1.0\leqslant \unicode[STIX]{x1D700}_{x}\leqslant 1.0$
,
 $\unicode[STIX]{x1D700}_{y}\sim 0$
. Here, we report tests where the cavitation bubble was nucleated at
$\unicode[STIX]{x1D700}_{y}\sim 0$
. Here, we report tests where the cavitation bubble was nucleated at
 $-0.3\leqslant \unicode[STIX]{x1D700}_{x}\leqslant 0.9$
. Also, we recorded a few tests with the bubble created slightly above or below the equatorial plane. In all the experiments presented here the laser pulse propagates horizontally from left to right. We will follow the convention given in previous studies (Kafalas & Ferdinand Reference Kafalas and Ferdinand1973; Singh & Knight Reference Singh and Knight1980; Eickmans et al.
Reference Eickmans, Hsieh and Chang1987a
,Reference Eickmans, Hsieh and Chang
b
) to call the left side of the droplet the irradiated, illuminated or front face and the right side of the droplet the shadow or back face.
$-0.3\leqslant \unicode[STIX]{x1D700}_{x}\leqslant 0.9$
. Also, we recorded a few tests with the bubble created slightly above or below the equatorial plane. In all the experiments presented here the laser pulse propagates horizontally from left to right. We will follow the convention given in previous studies (Kafalas & Ferdinand Reference Kafalas and Ferdinand1973; Singh & Knight Reference Singh and Knight1980; Eickmans et al.
Reference Eickmans, Hsieh and Chang1987a
,Reference Eickmans, Hsieh and Chang
b
) to call the left side of the droplet the irradiated, illuminated or front face and the right side of the droplet the shadow or back face.
The liquids used to create the drops are deionized water (
 $\unicode[STIX]{x1D70C}=1000~\text{kg}~\text{m}^{-3}$
and
$\unicode[STIX]{x1D70C}=1000~\text{kg}~\text{m}^{-3}$
and
 $\unicode[STIX]{x1D70E}=72~\text{mN}~\text{m}^{-1}$
) and a soap-water solution, 5 % by weight (
$\unicode[STIX]{x1D70E}=72~\text{mN}~\text{m}^{-1}$
) and a soap-water solution, 5 % by weight (
 $\unicode[STIX]{x1D70C}=1000~\text{kg}~\text{m}^{-3}$
and
$\unicode[STIX]{x1D70C}=1000~\text{kg}~\text{m}^{-3}$
and
 $\unicode[STIX]{x1D70E}=25~\text{mN}~\text{m}^{-1}$
).
$\unicode[STIX]{x1D70E}=25~\text{mN}~\text{m}^{-1}$
).
3 Results
3.1 The initial stage of the fragmentation process, single-frame images
When the laser beam penetrates into the transparent medium, the focused energy of the beam locally boils the liquid, then a cavitation bubble is induced and a shock wave is launched. In figure 2, four different drops are depicted, each one at a different time delay,
 $\unicode[STIX]{x0394}t$
. Figure 2(a), taken 60 ns after the laser pulse is fired, shows a bright spot in the centre of the droplet, which is due to the plasma and covers the bubble. Yet we can observe the expanding shock wave. It is imaged as a dim ring, indicated by the white arrow. The expansion velocity of the shock wave measured is
$\unicode[STIX]{x0394}t$
. Figure 2(a), taken 60 ns after the laser pulse is fired, shows a bright spot in the centre of the droplet, which is due to the plasma and covers the bubble. Yet we can observe the expanding shock wave. It is imaged as a dim ring, indicated by the white arrow. The expansion velocity of the shock wave measured is
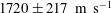 $1720\pm 217~\text{m}~\text{s}^{-1}$
, where we have corrected for the geometrical distortion due the curvature of the drop, as reported by Kobel et al. (Reference Kobel, Obreschkow, De Bosset, Dorsaz and Farhat2009). Interestingly, figure 2(b) portrays not only the drop and the expanding bubble but also a collection of smaller bubbles on the surface of the drop which appear due to secondary cavitation. Additionally, single-frame images showed that after a short time delay the interior of the droplet became darker. We believe this is due to an increased number of bubbles inside the drop. As a consequence of the bubble expansion, the liquid film between the bubble and the surrounding air becomes thinner, until it eventually ruptures. At this time, the high pressure inside the bubble is travelling as a wave into the surrounding air. This resembles the rupture of a membrane in a shock tube, where a high-pressure region is separated from a lower-pressure region by a thin membrane. As the shock wave propagates into the quiescent air, see figure 2(d), it increases the pressure behind it. From normal shock relations, a few values of the pressure behind the shock wave in the range
$1720\pm 217~\text{m}~\text{s}^{-1}$
, where we have corrected for the geometrical distortion due the curvature of the drop, as reported by Kobel et al. (Reference Kobel, Obreschkow, De Bosset, Dorsaz and Farhat2009). Interestingly, figure 2(b) portrays not only the drop and the expanding bubble but also a collection of smaller bubbles on the surface of the drop which appear due to secondary cavitation. Additionally, single-frame images showed that after a short time delay the interior of the droplet became darker. We believe this is due to an increased number of bubbles inside the drop. As a consequence of the bubble expansion, the liquid film between the bubble and the surrounding air becomes thinner, until it eventually ruptures. At this time, the high pressure inside the bubble is travelling as a wave into the surrounding air. This resembles the rupture of a membrane in a shock tube, where a high-pressure region is separated from a lower-pressure region by a thin membrane. As the shock wave propagates into the quiescent air, see figure 2(d), it increases the pressure behind it. From normal shock relations, a few values of the pressure behind the shock wave in the range
 $1\leqslant t\leqslant 6~\unicode[STIX]{x03BC}\text{s}$
have been calculated and are presented in table 1. We observe a thin sheet connecting the main droplet body with the atomized fragments close to the shock front. A careful look at the surface of the sheet in figure 2(d) depicts a structure one expects for a Kelvin–Helmholtz instability (inside the white box). Other instabilities may lead to the fine mist close to the shock front, some of these are even moving ahead. The shock wave depicted in figure 2(d) is estimated to be propagating in air at an average speed of
$1\leqslant t\leqslant 6~\unicode[STIX]{x03BC}\text{s}$
have been calculated and are presented in table 1. We observe a thin sheet connecting the main droplet body with the atomized fragments close to the shock front. A careful look at the surface of the sheet in figure 2(d) depicts a structure one expects for a Kelvin–Helmholtz instability (inside the white box). Other instabilities may lead to the fine mist close to the shock front, some of these are even moving ahead. The shock wave depicted in figure 2(d) is estimated to be propagating in air at an average speed of
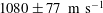 $1080\pm 77~\text{m}~\text{s}^{-1}$
.
$1080\pm 77~\text{m}~\text{s}^{-1}$
.
Table 1. Mach number, pressure and temperature according to the normal shock relation for figure 3(a–e).

The later dynamics of the fragmenting droplet from 1 to
 $10~\unicode[STIX]{x03BC}\text{s}$
is depicted in figure 3, in particular the expansion of the fragmentation zones and the outgoing shock wave on a larger spatial scale.
$10~\unicode[STIX]{x03BC}\text{s}$
is depicted in figure 3, in particular the expansion of the fragmentation zones and the outgoing shock wave on a larger spatial scale.
Soon after the rupture of the droplet wall, at
 $\unicode[STIX]{x0394}t=1~\unicode[STIX]{x03BC}\text{s}$
, small droplets are ejected, see figure 3(a). Again, we observe these fragments to travel even faster than the shock wave, here at
$\unicode[STIX]{x0394}t=1~\unicode[STIX]{x03BC}\text{s}$
, small droplets are ejected, see figure 3(a). Again, we observe these fragments to travel even faster than the shock wave, here at
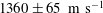 $1360\pm 65~\text{m}~\text{s}^{-1}$
, which is approximately four times faster than the speed of sound in air at
$1360\pm 65~\text{m}~\text{s}^{-1}$
, which is approximately four times faster than the speed of sound in air at
 $20\,^{\circ }\text{C}$
and 1 atm.
$20\,^{\circ }\text{C}$
and 1 atm.
An upper bound for the size of these fragments can be estimated from the capillary length,
 $\unicode[STIX]{x1D706}_{a}$
, where surface tension can balance the acceleration the fragments are exposed to,
$\unicode[STIX]{x1D706}_{a}$
, where surface tension can balance the acceleration the fragments are exposed to,
 $a_{x}$
. They obtain a velocity of approximately
$a_{x}$
. They obtain a velocity of approximately
 $1000~\text{m}~\text{s}^{-1}$
within
$1000~\text{m}~\text{s}^{-1}$
within
 $1~\unicode[STIX]{x03BC}\text{s}$
, see figure 3(a), they are exposed to an initial acceleration of the order of
$1~\unicode[STIX]{x03BC}\text{s}$
, see figure 3(a), they are exposed to an initial acceleration of the order of
 $10^{9}~\text{m}~\text{s}^{-2}$
. This gives an estimate of a stable fragment size,
$10^{9}~\text{m}~\text{s}^{-2}$
. This gives an estimate of a stable fragment size,
 $d$
, of
$d$
, of
 $$\begin{eqnarray}d<\unicode[STIX]{x1D706}_{a}=\sqrt{\unicode[STIX]{x1D70E}/\unicode[STIX]{x1D70C}a_{x}},\end{eqnarray}$$
where
 $\unicode[STIX]{x1D70E}=72\times 10^{-3}~\text{N}~\text{m}^{-1}$
and
$\unicode[STIX]{x1D70E}=72\times 10^{-3}~\text{N}~\text{m}^{-1}$
and
 $\unicode[STIX]{x1D70C}=1000~\text{kg}~\text{m}^{-3}$
are the surface tension and the density of the liquid, respectively. Hence, only droplets with a diameter smaller than 270 nm may remain intact under this extreme acceleration. This explains the fuzzy shape of the fragments close to the shock front, as they cannot be resolved in the present experiments.
$\unicode[STIX]{x1D70C}=1000~\text{kg}~\text{m}^{-3}$
are the surface tension and the density of the liquid, respectively. Hence, only droplets with a diameter smaller than 270 nm may remain intact under this extreme acceleration. This explains the fuzzy shape of the fragments close to the shock front, as they cannot be resolved in the present experiments.
In addition to that, figure 3(a–e) provides the instantaneous position and thus the velocity of the shock wave, which allows one to estimate the pressure and temperature behind the moving shock wave using the normal shock relations (Anderson Reference Anderson1990):
 $$\begin{eqnarray}\displaystyle & \displaystyle Ma=\frac{V_{sw}}{a_{1}}=\frac{V_{sw}}{\sqrt{\unicode[STIX]{x1D6FE}RT_{1}}}, & \displaystyle\end{eqnarray}$$
 $$\begin{eqnarray}\displaystyle & \displaystyle \frac{P_{2}}{P_{1}}=1+\frac{2\unicode[STIX]{x1D6FE}}{\unicode[STIX]{x1D6FE}+1}(Ma^{2}-1), & \displaystyle\end{eqnarray}$$
 $$\begin{eqnarray}\displaystyle & \displaystyle \frac{T_{2}}{T_{1}}=\frac{P_{2}}{P_{1}}\left(\frac{\displaystyle \frac{\unicode[STIX]{x1D6FE}+1}{\unicode[STIX]{x1D6FE}-1}+\frac{P_{2}}{P_{1}}}{\displaystyle 1+\frac{\unicode[STIX]{x1D6FE}+1}{\unicode[STIX]{x1D6FE}-1}\frac{P_{2}}{P_{1}}}\right). & \displaystyle\end{eqnarray}$$
 $Ma$
is the Mach number,
$Ma$
is the Mach number,
 $V_{sw}$
is the velocity of the shock wave,
$V_{sw}$
is the velocity of the shock wave,
 $a_{1}$
is the speed of sound in air,
$a_{1}$
is the speed of sound in air,
 $\unicode[STIX]{x1D6FE}$
is the specific heat ratio,
$\unicode[STIX]{x1D6FE}$
is the specific heat ratio,
 $R$
is the gas constant, for air
$R$
is the gas constant, for air
 $R=287~\text{m}^{2}/(\text{s}^{2}~\text{K})$
, and
$R=287~\text{m}^{2}/(\text{s}^{2}~\text{K})$
, and
 $P$
and
$P$
and
 $T$
are pressure and temperature respectively; the subscript 1 denotes the conditions of the quiescent air, that is, ahead of the shock wave, while the subscript 2 denotes the conditions behind the shock wave. Table 1 displays the values of the pressure and temperature behind the shock wave with
$T$
are pressure and temperature respectively; the subscript 1 denotes the conditions of the quiescent air, that is, ahead of the shock wave, while the subscript 2 denotes the conditions behind the shock wave. Table 1 displays the values of the pressure and temperature behind the shock wave with
 $P_{1}=1~\text{bar}$
and
$P_{1}=1~\text{bar}$
and
 $T_{1}=293~\text{K}$
.
$T_{1}=293~\text{K}$
.
The estimated pressure behind the shock wave
 $1~\unicode[STIX]{x03BC}\text{s}$
after the laser pulse is approximately 17 bar and the temperature is 1030 K;
$1~\unicode[STIX]{x03BC}\text{s}$
after the laser pulse is approximately 17 bar and the temperature is 1030 K;
 $6~\unicode[STIX]{x03BC}\text{s}$
after the laser pulse the pressure behind the shock wave has decreased to slightly more than 3 bar and a temperature slightly above the boiling temperature of water.
$6~\unicode[STIX]{x03BC}\text{s}$
after the laser pulse the pressure behind the shock wave has decreased to slightly more than 3 bar and a temperature slightly above the boiling temperature of water.
Let us now discuss the overall shape of the fragmenting droplet in figure 3. Initially, the left-hand side of the droplet is smooth while a sheet on the right-hand side expands quickly towards the right. The expanding sheet after
 $t=1~\unicode[STIX]{x03BC}\text{s}$
displays a rough surface with a complex pattern. These patterns seem to appear very quickly; it is mostly absent at
$t=1~\unicode[STIX]{x03BC}\text{s}$
displays a rough surface with a complex pattern. These patterns seem to appear very quickly; it is mostly absent at
 $t=870~\text{ns}$
in figure 2(d) and apparent at
$t=870~\text{ns}$
in figure 2(d) and apparent at
 $t=1000~\text{ns}$
in figure 3(a). This indicates that this sheet is exposed to a strong shear between the mostly stagnant air surrounding the droplet and the outflow from the vaporous explosion. Likely a Kelvin–Helmholtz instability sets in, which is supported by more experiments. They reveal that the sheet, although highly corrugated, remains intact and the dark structures are crests of wavy corrugation on the sheet.
$t=1000~\text{ns}$
in figure 3(a). This indicates that this sheet is exposed to a strong shear between the mostly stagnant air surrounding the droplet and the outflow from the vaporous explosion. Likely a Kelvin–Helmholtz instability sets in, which is supported by more experiments. They reveal that the sheet, although highly corrugated, remains intact and the dark structures are crests of wavy corrugation on the sheet.
A second peculiarity of this atomization is the very high speed of the smallest fragments moving ahead of the shock front. Only after approximately
 $5~\unicode[STIX]{x03BC}\text{s}$
, see figure 3(d), no more fragments are visibly ahead of the front moving at approximately
$5~\unicode[STIX]{x03BC}\text{s}$
, see figure 3(d), no more fragments are visibly ahead of the front moving at approximately
 $640\pm 13~\text{m}~\text{s}^{-1}$
.
$640\pm 13~\text{m}~\text{s}^{-1}$
.
The right-hand side of the droplet shows a delayed fragmentation, with a steadily growing surface roughness becoming visible after
 $t=2~\unicode[STIX]{x03BC}\text{s}$
. The wavelength of the structures has a considerably smaller scale than the structures of the expanding sheet.
$t=2~\unicode[STIX]{x03BC}\text{s}$
. The wavelength of the structures has a considerably smaller scale than the structures of the expanding sheet.
The drop deformation continues, as portrayed in figure 3(d–f); at
 $\unicode[STIX]{x0394}t=10~\unicode[STIX]{x03BC}\text{s}$
the drop is significantly fragmented, the leading edge is thinner than in the images of
$\unicode[STIX]{x0394}t=10~\unicode[STIX]{x03BC}\text{s}$
the drop is significantly fragmented, the leading edge is thinner than in the images of
 $\unicode[STIX]{x0394}t<10~\unicode[STIX]{x03BC}\text{s}$
and the shock wave being reflected back from the upper and lower walls can be observed. The deformation of the drop with time also presents an interesting feature; notice the small liquid threads on the surface of the drop, for instance on the left side of the wall at
$\unicode[STIX]{x0394}t<10~\unicode[STIX]{x03BC}\text{s}$
and the shock wave being reflected back from the upper and lower walls can be observed. The deformation of the drop with time also presents an interesting feature; notice the small liquid threads on the surface of the drop, for instance on the left side of the wall at
 $\unicode[STIX]{x0394}t=10~\unicode[STIX]{x03BC}\text{s}$
. We hypothesize that, due to the short acoustic time scale, multiple shock wave and droplet surface interactions occur before the liquid film is ruptured. This produces secondary cavitation on the droplet surface, as portrayed in figure 2(a). These bubbles may be the origin of the thin jets observed on the illuminated side of the droplet depicted in figure 3(f). Fast liquid jets are produced from a curved surface when the free surface experiences an impulsive acceleration (Antkowiak et al.
Reference Antkowiak, Bremond, Dizes and Villermaux2007; Thoroddsen et al.
Reference Thoroddsen, Takehara, Etoh and Ohl2009; Peters et al.
Reference Peters, Tagawa, Oudalov, Sun, Prosperetti, Lohse and van der Meer2013).
$\unicode[STIX]{x0394}t=10~\unicode[STIX]{x03BC}\text{s}$
. We hypothesize that, due to the short acoustic time scale, multiple shock wave and droplet surface interactions occur before the liquid film is ruptured. This produces secondary cavitation on the droplet surface, as portrayed in figure 2(a). These bubbles may be the origin of the thin jets observed on the illuminated side of the droplet depicted in figure 3(f). Fast liquid jets are produced from a curved surface when the free surface experiences an impulsive acceleration (Antkowiak et al.
Reference Antkowiak, Bremond, Dizes and Villermaux2007; Thoroddsen et al.
Reference Thoroddsen, Takehara, Etoh and Ohl2009; Peters et al.
Reference Peters, Tagawa, Oudalov, Sun, Prosperetti, Lohse and van der Meer2013).
The velocities of the ejected fragments are plotted in figure 4 for the first
 $6~\unicode[STIX]{x03BC}\text{s}$
. They are initially ejected at
$6~\unicode[STIX]{x03BC}\text{s}$
. They are initially ejected at
 $1360\pm 65~\text{m}~\text{s}^{-1}$
and rapidly decelerate to
$1360\pm 65~\text{m}~\text{s}^{-1}$
and rapidly decelerate to
 $560~\text{m}~\text{s}^{-1}$
after
$560~\text{m}~\text{s}^{-1}$
after
 $t=6~\unicode[STIX]{x03BC}\text{s}$
; the dotted line in figure 4 denotes the speed of sound in air at 1 bar and
$t=6~\unicode[STIX]{x03BC}\text{s}$
; the dotted line in figure 4 denotes the speed of sound in air at 1 bar and
 $20\,^{\circ }\text{C}$
. The uncertainty in the velocity measurement is due to the ambiguity of the position where the cavitation bubble is nucleated and the pixel resolution.
$20\,^{\circ }\text{C}$
. The uncertainty in the velocity measurement is due to the ambiguity of the position where the cavitation bubble is nucleated and the pixel resolution.
Similar high velocities of fragments from laser-induced cavitation bubbles created in the vicinity of a curved free surface have been reported previously by Thoroddsen et al. (Reference Thoroddsen, Takehara, Etoh and Ohl2009). Their sheet velocities reached
 $1400~\text{m}~\text{s}^{-1}$
. Next, we will study in detail the shock wave propagation within the droplet.
$1400~\text{m}~\text{s}^{-1}$
. Next, we will study in detail the shock wave propagation within the droplet.

Figure 4. The speed of the shock wave and the ejected fragments after rupture of the drop wall.
3.2 Shock wave dynamics inside a levitating drop
The short acoustic time scale – of the order of tens of nanoseconds – imposes a challenge in evaluating the motion of the shock wave inside the droplet. To overcome this, a millimetre-sized drop is levitated and a lower laser energy is used to nucleate cavitation bubbles which do not fragment the droplet. Two further advantages of droplets of larger size is the ability to do multiple experiments on the same drop and that the shock wave inside the droplet can be more easily visualized due to the smaller interface curvature. The experimental images presented in figure 5(a) correspond to the same levitating drop while the time delay was increased to capture the shock wave displaced. The time stated in figure 5(a) is in microseconds, relative to a fixed time
 $t=0$
, first frame in figure 5(a). Bubble nucleation occurs at
$t=0$
, first frame in figure 5(a). Bubble nucleation occurs at
 $t=-100~\text{ns}$
.
$t=-100~\text{ns}$
.

Figure 5. The position of the shock wave inside a levitated drop and comparison with numerical simulations; (a) side view experiment,
 $R_{x}=1.7~\text{mm}$
,
$R_{x}=1.7~\text{mm}$
,
 $R_{y}=1.10~\text{mm}$
,
$R_{y}=1.10~\text{mm}$
,
 $E_{l}=2.2~\text{mJ}$
; (b) side view simulation; (c) top view simulation; (d) volume of the lowest pressure during the wave propagation. Time is in microseconds and the length of the bar in the lower left corner of the first image is
$E_{l}=2.2~\text{mJ}$
; (b) side view simulation; (c) top view simulation; (d) volume of the lowest pressure during the wave propagation. Time is in microseconds and the length of the bar in the lower left corner of the first image is
 $500~\unicode[STIX]{x03BC}\text{m}$
.
$500~\unicode[STIX]{x03BC}\text{m}$
.
The drop has radii
 $R_{x}=1.7~\text{mm}$
,
$R_{x}=1.7~\text{mm}$
,
 $R_{y}=1.1~\text{mm}$
and the cavitation bubble is generated approximately at
$R_{y}=1.1~\text{mm}$
and the cavitation bubble is generated approximately at
 $\unicode[STIX]{x1D700}_{x}=-0.25$
. Figure 5(a) covers a time interval of
$\unicode[STIX]{x1D700}_{x}=-0.25$
. Figure 5(a) covers a time interval of
 $1.45~\unicode[STIX]{x03BC}\text{s}$
. During this time the shock wave expands radially from the position of bubble nucleation, reflects from the liquid–air interface and, while travelling back into the centre, focuses as a tension wave. Due to the ellipsoidal shape of the droplet and the origin of the shock wave being off-centre, a non-trivial refocusing is observed. To understand the process of shock wave focusing, the linear wave propagation is simulated with a finite element solver (PDE equation module, COMSOL 5.0, Burlington, USA); next, the numerical results are compared with the photographic frames, as depicted in figure 5(a,b).
$1.45~\unicode[STIX]{x03BC}\text{s}$
. During this time the shock wave expands radially from the position of bubble nucleation, reflects from the liquid–air interface and, while travelling back into the centre, focuses as a tension wave. Due to the ellipsoidal shape of the droplet and the origin of the shock wave being off-centre, a non-trivial refocusing is observed. To understand the process of shock wave focusing, the linear wave propagation is simulated with a finite element solver (PDE equation module, COMSOL 5.0, Burlington, USA); next, the numerical results are compared with the photographic frames, as depicted in figure 5(a,b).
For the presentation of the combined results we start with the stroboscopic pictures taken from the side, as shown in figure 5(a). Between
 $t=0$
and
$t=0$
and
 $t=0.40~\unicode[STIX]{x03BC}\text{s}$
, the shock wave spreads out radially from the nucleated bubble, which expands much slower than the shock wave. We name the water–air interface being closer and further from the nucleation side the proximal and distal side, respectively. The arrow in figure 5(a) (
$t=0.40~\unicode[STIX]{x03BC}\text{s}$
, the shock wave spreads out radially from the nucleated bubble, which expands much slower than the shock wave. We name the water–air interface being closer and further from the nucleation side the proximal and distal side, respectively. The arrow in figure 5(a) (
 $t=0.40~\unicode[STIX]{x03BC}\text{s}$
) points to a faint image of the shock wave travelling to the right side and not having reached the liquid–air interface on the distal side. At time
$t=0.40~\unicode[STIX]{x03BC}\text{s}$
) points to a faint image of the shock wave travelling to the right side and not having reached the liquid–air interface on the distal side. At time
 $t=1.10~\unicode[STIX]{x03BC}\text{s}$
the wave has been reflected fully from all water–air interfaces. In particular the waves reflected from the proximal top and bottom side of the droplet form two inclined lines, overlapping first on the proximal side at the centre (
$t=1.10~\unicode[STIX]{x03BC}\text{s}$
the wave has been reflected fully from all water–air interfaces. In particular the waves reflected from the proximal top and bottom side of the droplet form two inclined lines, overlapping first on the proximal side at the centre (
 $t=1.30~\unicode[STIX]{x03BC}\text{s}$
), and then on the distal side (
$t=1.30~\unicode[STIX]{x03BC}\text{s}$
), and then on the distal side (
 $t=1.45~\unicode[STIX]{x03BC}\text{s}$
). From time
$t=1.45~\unicode[STIX]{x03BC}\text{s}$
). From time
 $t=1.25~\unicode[STIX]{x03BC}\text{s}$
, a diffuse horizontal region appears, indicated with an arrow in figure 5(a) (
$t=1.25~\unicode[STIX]{x03BC}\text{s}$
, a diffuse horizontal region appears, indicated with an arrow in figure 5(a) (
 $t=1.25~\unicode[STIX]{x03BC}\text{s}$
), which grows from the proximal to the distal side. This region ends approximately where the two inclined lines overlap. We suggest that this region is formed by tensile waves superimposing and nucleating secondary cavitation (Paltauf, Schmidt-Kloiber & Frenz Reference Paltauf, Schmidt-Kloiber and Frenz1998; Robert et al.
Reference Robert, Lettery, Farhat, Monkewitz and Avellan2007).
$t=1.25~\unicode[STIX]{x03BC}\text{s}$
), which grows from the proximal to the distal side. This region ends approximately where the two inclined lines overlap. We suggest that this region is formed by tensile waves superimposing and nucleating secondary cavitation (Paltauf, Schmidt-Kloiber & Frenz Reference Paltauf, Schmidt-Kloiber and Frenz1998; Robert et al.
Reference Robert, Lettery, Farhat, Monkewitz and Avellan2007).
To support the hypothesis that the reflected waves are indeed focused, we compare the stroboscopic pictures with the finite element simulation of linear wave propagation. We compare the pictures with the absolute value of the pressure in the simulations, as the shadowgraph pictures are sensitive to rapid changes in the pressure. The small aperture of the lens gives a large depth of field, imaging the droplet in focus over the whole volume. To simulate this in the model, we sum up the pressure in all planes parallel to the photographic plane and present this overlaid image in figure 5(b). The simulation does not model the growth of the bubble, thus as a reasonable size of the bubble we use a value approximately equal to that when the wave reflects back onto its surface, see figure 5(a),
 $t=1.25~\unicode[STIX]{x03BC}\text{s}$
. The initial condition for the linear wave propagation is a time-dependent pressure source located on the surface of this bubble. It is modelled as a positive cycle of a squared sine-function with a pulse duration of 50 ns. By using a linear wave equation we ignore finite amplitude effects and can scale the pressure by a constant value. The surfaces of the inner bubble and the drop are modelled as perfect soft reflectors. We assume a constant speed of sound of
$t=1.25~\unicode[STIX]{x03BC}\text{s}$
. The initial condition for the linear wave propagation is a time-dependent pressure source located on the surface of this bubble. It is modelled as a positive cycle of a squared sine-function with a pulse duration of 50 ns. By using a linear wave equation we ignore finite amplitude effects and can scale the pressure by a constant value. The surfaces of the inner bubble and the drop are modelled as perfect soft reflectors. We assume a constant speed of sound of
 $1500~\text{m}~\text{s}^{-1}$
from the time
$1500~\text{m}~\text{s}^{-1}$
from the time
 $t=0$
, understanding that during the initial time,
$t=0$
, understanding that during the initial time,
 $-100~\text{ns}<t<0$
, the shock has decelerated to acoustic velocity (Vogel, Busch & Parlitz Reference Vogel, Busch and Parlitz1996). The grid size is chosen for a Courant–Friedrichs–Lewy condition of 0.2.
$-100~\text{ns}<t<0$
, the shock has decelerated to acoustic velocity (Vogel, Busch & Parlitz Reference Vogel, Busch and Parlitz1996). The grid size is chosen for a Courant–Friedrichs–Lewy condition of 0.2.
Dark shades in figure 5(b) depict large magnitudes of the absolute pressure. Initially, in figure 5(b) for
 $t<0.50~\unicode[STIX]{x03BC}\text{s}$
the pressure field is purely positive, yet upon reflection at the free boundary the wave is inverted. Secondary cavitation as found in figure 5(a),
$t<0.50~\unicode[STIX]{x03BC}\text{s}$
the pressure field is purely positive, yet upon reflection at the free boundary the wave is inverted. Secondary cavitation as found in figure 5(a),
 $t=1.25~\unicode[STIX]{x03BC}\text{s}$
, can be correlated to the instant the two inclined line structures in figure 5(b),
$t=1.25~\unicode[STIX]{x03BC}\text{s}$
, can be correlated to the instant the two inclined line structures in figure 5(b),
 $t=1.0~\unicode[STIX]{x03BC}\text{s}$
, overlap, i.e. when tensile waves superimpose. The small misalignment in time can be explained with some variability of the position of the laser focus between experiments. Yet, in general, we find good agreement with the shape, timing and position of the waves when comparing figures 5(a) and 5(b). Differences can be attributed to the imaging properties of the curved droplet surface, which is not taken into account, and the expansion dynamics of the bubble.
$t=1.0~\unicode[STIX]{x03BC}\text{s}$
, overlap, i.e. when tensile waves superimpose. The small misalignment in time can be explained with some variability of the position of the laser focus between experiments. Yet, in general, we find good agreement with the shape, timing and position of the waves when comparing figures 5(a) and 5(b). Differences can be attributed to the imaging properties of the curved droplet surface, which is not taken into account, and the expansion dynamics of the bubble.
Figure 5(c) displays simulated images that correspond to the images shown in figure 5(b); however, the images portray a top view. Positive pressures are indicated in red and tensile pressures in blue in figure 5(c). Surprisingly, the location where the pressure is lowest, and therefore a probable sites for cavitation inception, is not near the centre of the droplet but closer to its periphery. This fact is highlighted in figure 5(d). There a three-dimensinal representation of the liquid volume being exposed to a significant negative pressure is portrayed in grey; this is the accumulated volume over the simulation time where the pressure drops below
 $-0.7$
of the initial pressure amplitude. This accumulated volume takes the shape of an annular region located at some finite distance from the droplet surface. It corresponds to the location where the fuzzy horizontal line in figure 5(a) at
$-0.7$
of the initial pressure amplitude. This accumulated volume takes the shape of an annular region located at some finite distance from the droplet surface. It corresponds to the location where the fuzzy horizontal line in figure 5(a) at
 $t=1.25~\unicode[STIX]{x03BC}\text{s}$
appears. This supports our hypothesis that secondary cavitation is induced after the reflection at the pressure release boundary and in the droplet’s equatorial plane.
$t=1.25~\unicode[STIX]{x03BC}\text{s}$
appears. This supports our hypothesis that secondary cavitation is induced after the reflection at the pressure release boundary and in the droplet’s equatorial plane.
3.3 Overview of the fragmentation regimes
Next, we want to study the fragmentation process of drops as a function of size and laser energy. Although flash photography provides good spatial resolution with low motion blurring it cannot reveal details of the dynamics showing some variability as in the present study Therefore, we resort to high-speed video to investigate the fragmentation process. In general we have identified four common patterns of fragmentation, which are summarized in figure 6. These four regimes are atomization (figure 6 a), unstable sheet formation with sheet rupture (figure 6 b), stable sheet formation (figure 6 c), and coarse fragmentation (figure 6 d). The atomization regime has been shown already in § 3.1. In the sheet formation regimes, figure 6(b,c) the cavitation bubble expands, then ruptures the wall of the drop, and fast ejection of fragmented drops follows. However, the remaining volume of the drop is stretched, forming a thin liquid film that is propelled in the opposite direction to that of the initial ejection of matter. Finally, in the coarse fragmentation regime, only a small fraction of the original volume is ejected. In fact, the ejection of matter is related to the breakup of liquid jets formed after the first bubble collapse.

Figure 6. Fragmentation scenarios; (a) atomization,
 $R_{d}=186~\unicode[STIX]{x03BC}\text{m}$
,
$R_{d}=186~\unicode[STIX]{x03BC}\text{m}$
,
 $E_{l}=4.9~\text{mJ}$
; (b) unstable sheet,
$E_{l}=4.9~\text{mJ}$
; (b) unstable sheet,
 $R_{d}=401~\unicode[STIX]{x03BC}\text{m}$
,
$R_{d}=401~\unicode[STIX]{x03BC}\text{m}$
,
 $E_{l}=2.7~\text{mJ}$
; (c) stable stretched sheet,
$E_{l}=2.7~\text{mJ}$
; (c) stable stretched sheet,
 $R_{d}=450~\unicode[STIX]{x03BC}\text{m}$
,
$R_{d}=450~\unicode[STIX]{x03BC}\text{m}$
,
 $E_{l}=0.6~\text{mJ}$
; (d) coarse fragmentation,
$E_{l}=0.6~\text{mJ}$
; (d) coarse fragmentation,
 $R_{d}=1419~\unicode[STIX]{x03BC}\text{m}$
,
$R_{d}=1419~\unicode[STIX]{x03BC}\text{m}$
,
 $E_{l}=2.2~\text{mJ}$
. The bubble inside the drop attains a maximum radius,
$E_{l}=2.2~\text{mJ}$
. The bubble inside the drop attains a maximum radius,
 $R_{beq}=0.92\pm 0.2~\text{mm}$
at
$R_{beq}=0.92\pm 0.2~\text{mm}$
at
 $t=58.1~\unicode[STIX]{x03BC}\text{s}$
. Time in
$t=58.1~\unicode[STIX]{x03BC}\text{s}$
. Time in
 $\unicode[STIX]{x03BC}\text{s}$
; the length of the bar in the first image from the top is 1.0 mm. Images (a–c) are water drops containing soap above the critical micelle concentration (CMC), image (d) is a water drop.
$\unicode[STIX]{x03BC}\text{s}$
; the length of the bar in the first image from the top is 1.0 mm. Images (a–c) are water drops containing soap above the critical micelle concentration (CMC), image (d) is a water drop.
3.3.1 Atomization regime
In this regime the initial drop is fragmented into a cloud of fine droplets – the ones expelled first are smaller, on the right side of the droplet in figure 6(a). This process is shown in greater detail in § 3.1. Interestingly, the fragmentation is completed within a very brief time as compared to the three other regimes.
3.3.2 Unstable sheet formation
Here, the initial dynamics on the right-hand side of the droplet is very similar to the atomization, yet the left-hand side of the droplet remains mostly intact while it stretches vertically. Thereby a thin sheet is formed which eventually ruptures, here starting at
 $t=187.5~\unicode[STIX]{x03BC}\text{s}$
in figure 6(b). By measuring the velocities of the holes,
$t=187.5~\unicode[STIX]{x03BC}\text{s}$
in figure 6(b). By measuring the velocities of the holes,
 $V_{h}$
, and assuming a local planar sheet its thickness,
$V_{h}$
, and assuming a local planar sheet its thickness,
 $h$
, can be estimated using the Taylor–Culick relation (Culick Reference Culick1960):
$h$
, can be estimated using the Taylor–Culick relation (Culick Reference Culick1960):
 $$\begin{eqnarray}h=2\unicode[STIX]{x1D70E}/\unicode[STIX]{x1D70C}V_{h}^{2}.\end{eqnarray}$$
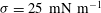
For a surface tension of
 $\unicode[STIX]{x1D70E}=0.025~\text{N}~\text{m}^{-1}$
we obtain a film thickness of
$\unicode[STIX]{x1D70E}=0.025~\text{N}~\text{m}^{-1}$
we obtain a film thickness of
 $0.8~\unicode[STIX]{x03BC}\text{m}$
when the sheet ruptures. This thickness compares with an averaged film thickness of
$0.8~\unicode[STIX]{x03BC}\text{m}$
when the sheet ruptures. This thickness compares with an averaged film thickness of
 $3.8~\unicode[STIX]{x03BC}\text{m}$
assuming mass conservation, thus ignoring mass loss on the proximal droplet side. The merging of many of these holes in the sheet leads to the formation of liquid ligaments, indicated by a white ellipse in figure 6(b). These ligaments then become Rayleigh–Plateau unstable and form relatively large droplets as compared to the initial ejecta on the right-hand side of the droplet, e.g.
$3.8~\unicode[STIX]{x03BC}\text{m}$
assuming mass conservation, thus ignoring mass loss on the proximal droplet side. The merging of many of these holes in the sheet leads to the formation of liquid ligaments, indicated by a white ellipse in figure 6(b). These ligaments then become Rayleigh–Plateau unstable and form relatively large droplets as compared to the initial ejecta on the right-hand side of the droplet, e.g.
 $t=25~\unicode[STIX]{x03BC}\text{s}$
of figure 6(b). The complete rupture of the sheet is observed approximately 200
$t=25~\unicode[STIX]{x03BC}\text{s}$
of figure 6(b). The complete rupture of the sheet is observed approximately 200
 $~\unicode[STIX]{x03BC}\text{s}$
after it has reached its maximum surface area (figure 6
b,
$~\unicode[STIX]{x03BC}\text{s}$
after it has reached its maximum surface area (figure 6
b,
 $t=175~\unicode[STIX]{x03BC}\text{s}$
). Some of the sheets formed are accompanied by a liquid jet moving to the left; an example is visible at
$t=175~\unicode[STIX]{x03BC}\text{s}$
). Some of the sheets formed are accompanied by a liquid jet moving to the left; an example is visible at
 $t=175~\unicode[STIX]{x03BC}\text{s}$
in figure 6(b), inside the white rectangle. It originates from a structure visible already at
$t=175~\unicode[STIX]{x03BC}\text{s}$
in figure 6(b), inside the white rectangle. It originates from a structure visible already at
 $t=25~\unicode[STIX]{x03BC}\text{s}$
, and may be produced from secondary cavitation at the distal side and interacting with the refocused and reflected shock waves before the droplet wall is ruptured.
$t=25~\unicode[STIX]{x03BC}\text{s}$
, and may be produced from secondary cavitation at the distal side and interacting with the refocused and reflected shock waves before the droplet wall is ruptured.
3.3.3 Stable sheet formation
Thicker and stable sheets are observed for larger droplets or lower laser energy, an example of which is given in figure 6(c). Comparing this with figure 6(b), where the laser energy is higher (yet the droplet radius and the position of the laser focus was approximately the same), we see distinct features: here the droplet expands vertically much less, to only approximately half the size as for the unstable sheet, and much less mist is generated at the proximal side (and into a smaller opening angle). Here, it is likely that the rupture of the distal film occurs at a later state of the bubble expansion, leading to a lower pressure difference between the bubble and ambient air at time of rupture. Because the sheet remains intact in figure 3(c), it develops an instability (Agbaglah, Joserrand & Zaleski Reference Agbaglah, Joserrand and Zaleski2013) at its rim which leads to shedding of larger droplets between
 $t=150~\unicode[STIX]{x03BC}\text{s}$
and
$t=150~\unicode[STIX]{x03BC}\text{s}$
and
 $t=600~\unicode[STIX]{x03BC}\text{s}$
.
$t=600~\unicode[STIX]{x03BC}\text{s}$
.
An average thickness of the sheet at maximum expansion can be estimated from mass conservation to
 $h=14~\unicode[STIX]{x03BC}\text{m}$
. The sheet reaches maximum extension at approximately
$h=14~\unicode[STIX]{x03BC}\text{m}$
. The sheet reaches maximum extension at approximately
 $t=450~\unicode[STIX]{x03BC}\text{s}$
and shrinks afterwards due to the action of surface tension. Balancing surface energy with kinetic energy, and assuming negligible loss of mass from the initial droplet, we can formulate a capillary time
$t=450~\unicode[STIX]{x03BC}\text{s}$
and shrinks afterwards due to the action of surface tension. Balancing surface energy with kinetic energy, and assuming negligible loss of mass from the initial droplet, we can formulate a capillary time
 $\unicode[STIX]{x1D70F}_{c}=\sqrt{1/6}(\unicode[STIX]{x1D70C}R_{d}^{3}/\unicode[STIX]{x1D70E})^{1/2}$
. This is the time scale during which a hemispherical liquid sheet with radius,
$\unicode[STIX]{x1D70F}_{c}=\sqrt{1/6}(\unicode[STIX]{x1D70C}R_{d}^{3}/\unicode[STIX]{x1D70E})^{1/2}$
. This is the time scale during which a hemispherical liquid sheet with radius,
 $R_{s}$
, collapses to common centre, converting its surface energy to kinetic energy. Inserting the values for the droplet shown in figure 6(c), we obtain
$R_{s}$
, collapses to common centre, converting its surface energy to kinetic energy. Inserting the values for the droplet shown in figure 6(c), we obtain
 $\unicode[STIX]{x1D70F}_{c}\approx 780~\unicode[STIX]{x03BC}\text{s}$
, which agrees well with the observed duration of the sheet lifetime.
$\unicode[STIX]{x1D70F}_{c}\approx 780~\unicode[STIX]{x03BC}\text{s}$
, which agrees well with the observed duration of the sheet lifetime.
3.3.4 Coarse fragmentation
In this regime the volume of the levitating drop is considerably larger than that in the previous regimes. The bubble is generated very close to the centre of the levitating drop. This safeguards that the laser-induced cavitation bubble expands and collapses within an intact droplet, an example is displayed in figure 6(d). Let us focus on the bubble dynamics: after the bubble is nucleated, a trail of secondary bubbles is found near the equatorial plane of the droplet,
 $t=8.3~\unicode[STIX]{x03BC}\text{s}$
in figure 6(d). They probably originate due to the geometric focusing of the reflected initial shock waves, as described in § 3.2. The main bubble expands until
$t=8.3~\unicode[STIX]{x03BC}\text{s}$
in figure 6(d). They probably originate due to the geometric focusing of the reflected initial shock waves, as described in § 3.2. The main bubble expands until
 $t=58.1~\unicode[STIX]{x03BC}\text{s}$
, reaching a maximum equivalent radius (to that of a sphere) of
$t=58.1~\unicode[STIX]{x03BC}\text{s}$
, reaching a maximum equivalent radius (to that of a sphere) of
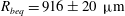 $R_{beq}=916\pm 20~\unicode[STIX]{x03BC}\text{m}$
, and collapses after approximately
$R_{beq}=916\pm 20~\unicode[STIX]{x03BC}\text{m}$
, and collapses after approximately
 $t=110~\unicode[STIX]{x03BC}\text{s}$
. At
$t=110~\unicode[STIX]{x03BC}\text{s}$
. At
 $t=96~\unicode[STIX]{x03BC}\text{s}$
the bubble shows large distortions, which we attribute to ripples on the surface of the droplet. Their amplitude can be seen at the contour of the droplet, i.e. at the north and south pole of the droplet. A careful inspection reveals that the ripples appear first at
$t=96~\unicode[STIX]{x03BC}\text{s}$
the bubble shows large distortions, which we attribute to ripples on the surface of the droplet. Their amplitude can be seen at the contour of the droplet, i.e. at the north and south pole of the droplet. A careful inspection reveals that the ripples appear first at
 $t=33.3~\unicode[STIX]{x03BC}\text{s}$
, which means they appear during the expansion of the bubble. We also observe that the waviness of the surface, or amplitude of the ripples, reduce during the shrinkage of the bubble. The origin of the surface instabilities during the bubble’s expansion and collapse will be discussed in context with the Rayleigh–Taylor instability on a spherical surface (Plesset Reference Plesset1954), see § 4.5.2.
$t=33.3~\unicode[STIX]{x03BC}\text{s}$
, which means they appear during the expansion of the bubble. We also observe that the waviness of the surface, or amplitude of the ripples, reduce during the shrinkage of the bubble. The origin of the surface instabilities during the bubble’s expansion and collapse will be discussed in context with the Rayleigh–Taylor instability on a spherical surface (Plesset Reference Plesset1954), see § 4.5.2.
Figure 6(d), at
 $t=116.2~\unicode[STIX]{x03BC}\text{s}$
, depicts the bubble after its first collapse. It has transformed into a toroidal shape with a protruding structure pointing downwards. In general, bubble collapse near a free boundary leads to a liquid jet pointing away from it. Here, the closest free boundaries (due to the prolate droplet and mostly spherical bubble shape) are the droplet’s north and south poles, i.e. we expect two jets to point from the poles to the centre of the droplet, eventually forming a toroidal bubble. This agrees with the observation at
$t=116.2~\unicode[STIX]{x03BC}\text{s}$
, depicts the bubble after its first collapse. It has transformed into a toroidal shape with a protruding structure pointing downwards. In general, bubble collapse near a free boundary leads to a liquid jet pointing away from it. Here, the closest free boundaries (due to the prolate droplet and mostly spherical bubble shape) are the droplet’s north and south poles, i.e. we expect two jets to point from the poles to the centre of the droplet, eventually forming a toroidal bubble. This agrees with the observation at
 $t=116.2~\unicode[STIX]{x03BC}\text{s}$
in figure 6(d); yet the protrusion may be formed by the dominance of one of two jets. Additionally, we observe secondary cavitation at
$t=116.2~\unicode[STIX]{x03BC}\text{s}$
in figure 6(d); yet the protrusion may be formed by the dominance of one of two jets. Additionally, we observe secondary cavitation at
 $t=116.2~\unicode[STIX]{x03BC}\text{s}$
, indicating that the collapse of the vapour bubble leads to the emission of a shock wave.
$t=116.2~\unicode[STIX]{x03BC}\text{s}$
, indicating that the collapse of the vapour bubble leads to the emission of a shock wave.
As mentioned in § 3.2 multiple shock wave and droplet surface interactions are likely to occur before the bubble collapses. This in turn induces secondary cavitation on the droplet surface. After the bubble collapse a second shock wave is emitted. The reflection of this wave from the bubble-seeded droplet surface may lead to the fast jets seen at
 $166\leqslant t\leqslant 323.7~\unicode[STIX]{x03BC}\text{m}$
. Impulsive acceleration of a curved free surface is known to give rise to fast liquid jets (Antkowiak et al.
Reference Antkowiak, Bremond, Dizes and Villermaux2007; Thoroddsen et al.
Reference Thoroddsen, Takehara, Etoh and Ohl2009; Peters et al.
Reference Peters, Tagawa, Oudalov, Sun, Prosperetti, Lohse and van der Meer2013). This acceleration is caused by momentum transfer of the wave during reflection. The velocities of the jet tips vary widely, with the fastest reaching up to
$166\leqslant t\leqslant 323.7~\unicode[STIX]{x03BC}\text{m}$
. Impulsive acceleration of a curved free surface is known to give rise to fast liquid jets (Antkowiak et al.
Reference Antkowiak, Bremond, Dizes and Villermaux2007; Thoroddsen et al.
Reference Thoroddsen, Takehara, Etoh and Ohl2009; Peters et al.
Reference Peters, Tagawa, Oudalov, Sun, Prosperetti, Lohse and van der Meer2013). This acceleration is caused by momentum transfer of the wave during reflection. The velocities of the jet tips vary widely, with the fastest reaching up to
 $120~\text{m}~\text{s}^{-1}$
and the slowest down to
$120~\text{m}~\text{s}^{-1}$
and the slowest down to
 $20~\text{m}~\text{s}^{-1}$
. Also, in figure 6(d), new jets emerge at approximately
$20~\text{m}~\text{s}^{-1}$
. Also, in figure 6(d), new jets emerge at approximately
 $t=323.7~\unicode[STIX]{x03BC}\text{s}$
, which we attribute to the second bubble collapse and the impulsive acceleration created thereby. Besides the ejection of mass through the liquid jets and their later Rayleigh–Plateau breakup, the droplet remains intact and slowly regains a spherical shape.
$t=323.7~\unicode[STIX]{x03BC}\text{s}$
, which we attribute to the second bubble collapse and the impulsive acceleration created thereby. Besides the ejection of mass through the liquid jets and their later Rayleigh–Plateau breakup, the droplet remains intact and slowly regains a spherical shape.

Figure 7. Water droplet fragmentation recorded at 269.2 kpfs,
 $R_{d}=230~\unicode[STIX]{x03BC}\text{m}$
,
$R_{d}=230~\unicode[STIX]{x03BC}\text{m}$
,
 $E_{l}=0.4~\text{mJ}$
. (a) the formation of the thin film after the rupture of the droplet wall; (b) a small drop of radius
$E_{l}=0.4~\text{mJ}$
. (a) the formation of the thin film after the rupture of the droplet wall; (b) a small drop of radius
 $r=20~\unicode[STIX]{x03BC}\text{m}$
, impacting on the stretched membrane; translation velocity
$r=20~\unicode[STIX]{x03BC}\text{m}$
, impacting on the stretched membrane; translation velocity
 $=8.6~\text{m}~\text{s}^{-1}$
; membrane thickness
$=8.6~\text{m}~\text{s}^{-1}$
; membrane thickness
 $=10~\unicode[STIX]{x03BC}\text{m}$
;
$=10~\unicode[STIX]{x03BC}\text{m}$
;
 $\unicode[STIX]{x1D70F}_{c}=0.4~\text{ms}$
. Time in
$\unicode[STIX]{x1D70F}_{c}=0.4~\text{ms}$
. Time in
 $\unicode[STIX]{x03BC}\text{s}$
; the length of the bar in the upper right corner of the first frame is
$\unicode[STIX]{x03BC}\text{s}$
; the length of the bar in the upper right corner of the first frame is
 $1.0~\text{mm}$
.
$1.0~\text{mm}$
.
4 Discussion
4.1 Instability of the liquid sheet and its rim
In the stable sheet regime, in addition to the initial ejection of mass, further fragmentation is observed through the emission of droplets from the sheet’s circular rim, see figure 6(c) at
 $t=150~\unicode[STIX]{x03BC}\text{s}$
. An event captured at a higher framing rate is shown in figure 7(a). There the rim forms very quickly after the ejection of the fine mist on the proximal side, occurring at
$t=150~\unicode[STIX]{x03BC}\text{s}$
. An event captured at a higher framing rate is shown in figure 7(a). There the rim forms very quickly after the ejection of the fine mist on the proximal side, occurring at
 $t=3.9~\unicode[STIX]{x03BC}\text{s}$
. Fragments detaching from the rim become visible already at
$t=3.9~\unicode[STIX]{x03BC}\text{s}$
. Fragments detaching from the rim become visible already at
 $t=15.6~\unicode[STIX]{x03BC}\text{s}$
and more pronounced at
$t=15.6~\unicode[STIX]{x03BC}\text{s}$
and more pronounced at
 $t=31.2~\unicode[STIX]{x03BC}\text{s}$
. Before that time the sheet is under large and non-uniform radial acceleration. From figure 7(a) we can estimate the acceleration of the liquid contained at the proximal side into the downstream end of the sheet from the increase of velocity of
$t=31.2~\unicode[STIX]{x03BC}\text{s}$
. Before that time the sheet is under large and non-uniform radial acceleration. From figure 7(a) we can estimate the acceleration of the liquid contained at the proximal side into the downstream end of the sheet from the increase of velocity of
 $92~\text{m}~\text{s}^{-1}$
within
$92~\text{m}~\text{s}^{-1}$
within
 $\unicode[STIX]{x0394}t=3.9~\unicode[STIX]{x03BC}\text{s}$
of approximately
$\unicode[STIX]{x0394}t=3.9~\unicode[STIX]{x03BC}\text{s}$
of approximately
 $a_{s}=24\times 10^{6}~\text{m}~\text{s}^{-2}$
. Thus, the sheet is subject to Rayleigh–Taylor instability (RTI). The growth time of the instabilities can be estimated from
$a_{s}=24\times 10^{6}~\text{m}~\text{s}^{-2}$
. Thus, the sheet is subject to Rayleigh–Taylor instability (RTI). The growth time of the instabilities can be estimated from
 $$\begin{eqnarray}\unicode[STIX]{x0394}t_{RT}=\left(\frac{\unicode[STIX]{x1D70E}}{\unicode[STIX]{x1D70C}\,a_{s}^{3}}\right)^{1/4},\end{eqnarray}$$
see Villermaux & Clanet (Reference Villermaux and Clanet2002). For the water droplet shown in figure 7 we obtain a growth rate of
 $\unicode[STIX]{x0394}t_{RT}=0.29~\unicode[STIX]{x03BC}\text{s}$
. Although the framing interval of
$\unicode[STIX]{x0394}t_{RT}=0.29~\unicode[STIX]{x03BC}\text{s}$
. Although the framing interval of
 $3.9~\unicode[STIX]{x03BC}\text{s}$
does not allow one to give a lower bound of when the instability sets in, we observe structures within the first frame with the sheet present, see
$3.9~\unicode[STIX]{x03BC}\text{s}$
does not allow one to give a lower bound of when the instability sets in, we observe structures within the first frame with the sheet present, see
 $t=3.9~\unicode[STIX]{x03BC}\text{s}$
in figure 7(a).
$t=3.9~\unicode[STIX]{x03BC}\text{s}$
in figure 7(a).
After some time the liquid sheet decelerates and liquid accumulates at the edge of the sheet, forming a rim. This process is continuous; a clear view of the rim is visible at
 $t=425~\unicode[STIX]{x03BC}\text{s}$
in figure 6(c) and for our faster sequence already at
$t=425~\unicode[STIX]{x03BC}\text{s}$
in figure 6(c) and for our faster sequence already at
 $t=167.7~\unicode[STIX]{x03BC}\text{s}$
in figure 7(b). We see that, in both cases, ligaments are connected to the rim, which by following the sequence of images in figure 7(a) originate from the Rayleigh–Taylor instabilities which do not detach from the sheet. An example is indicated with an arrow in figure 7(a) at time
$t=167.7~\unicode[STIX]{x03BC}\text{s}$
in figure 7(b). We see that, in both cases, ligaments are connected to the rim, which by following the sequence of images in figure 7(a) originate from the Rayleigh–Taylor instabilities which do not detach from the sheet. An example is indicated with an arrow in figure 7(a) at time
 $t=31.2~\unicode[STIX]{x03BC}\text{s}$
. We can follow this ligament to the development of a pronounced rim at
$t=31.2~\unicode[STIX]{x03BC}\text{s}$
. We can follow this ligament to the development of a pronounced rim at
 $t=167.7~\unicode[STIX]{x03BC}\text{s}$
. Both the ligament and the rim become Rayleigh–Plateau unstable and shed droplets from the downstream end of the sheet. These droplets are much bigger than the fine mist ejected during shock wave emission.
$t=167.7~\unicode[STIX]{x03BC}\text{s}$
. Both the ligament and the rim become Rayleigh–Plateau unstable and shed droplets from the downstream end of the sheet. These droplets are much bigger than the fine mist ejected during shock wave emission.
At later stages we observe dragging of droplets from the rim region into the volume bounded by the hemispherical-shaped sheet. The flow responsible for the transport of the droplets will be discussed in § 4.3. Next, we will focus on the interaction of the droplets accelerated towards the sheet.
4.2 Deformation and fragmentation of the sheet by ejected droplets
Careful inspection of approximately 110 experiments where sheets were formed we see a common feature that droplets ejected from the rim become entrained in a flow which accelerates some of them back towards the sheet and may lead to the impact of these droplets onto the sheet. Here, we want to document selected cases of this interaction and their consequences for the stability of the sheet.
Figure 7(b) is an example case where the droplets formed at the rim due to Rayleigh–Plateau instabilities are entrained into a sheet-directed vortical flow (see § 4.4 for a discussion of the origin of this flow).
4.3 Flow field leading to shear-layer formation
Figure 8(a,b) displays two droplets of similar size exposed and fragmented by a laser pulse of similar energy. We see a good repeatability of the fluid mechanics, with a similar formation of fragment sizes, i.e. a fine mist at the distal side and larger fragments formed from the sheet and its rim. Also, a close look at the images reveals that the angle of fragmentation may be sensitive to the initial bubble inception location. In figure 8(b), the bubble is nucleated closer to the proximal side; thus, at the moment when it ruptures the wall of the droplet, its internal pressure is higher and material is ejected into a wider angle. Interestingly, in this regime of laser energy and droplet size we find two dark stripes at the distal side, becoming visible approximately
 $10~\unicode[STIX]{x03BC}\text{s}$
after the laser was fired. These two stripes are indicated with two arrows in figure 8(a), at
$10~\unicode[STIX]{x03BC}\text{s}$
after the laser was fired. These two stripes are indicated with two arrows in figure 8(a), at
 $t=25~\unicode[STIX]{x03BC}\text{s}$
, see also figure 8(b). Over time their appearance becomes fuzzy and they are advected by the residual turbulent flow. Although the appearance is that of two stripes, its geometry is a region of high-density fine droplet fragments which are collected in a cone-shaped region. This particular cone shape must be caused by the flow field trapping the fragments and densifying their concentration. The reason for this could be a region of low gas velocity, i.e. a shear layer between two prevalent flows. We suggest an explanation for this particular flow sketched in figure 9.
$t=25~\unicode[STIX]{x03BC}\text{s}$
, see also figure 8(b). Over time their appearance becomes fuzzy and they are advected by the residual turbulent flow. Although the appearance is that of two stripes, its geometry is a region of high-density fine droplet fragments which are collected in a cone-shaped region. This particular cone shape must be caused by the flow field trapping the fragments and densifying their concentration. The reason for this could be a region of low gas velocity, i.e. a shear layer between two prevalent flows. We suggest an explanation for this particular flow sketched in figure 9.

Figure 8. Soap-water droplets of similar size fragmented by a cavitation bubble created near the proximal side. (a)
 $R_{d}=310~\unicode[STIX]{x03BC}\text{m}$
,
$R_{d}=310~\unicode[STIX]{x03BC}\text{m}$
,
 $E_{l}=3.5~\text{mJ}$
,
$E_{l}=3.5~\text{mJ}$
,
 $\unicode[STIX]{x1D700}_{x}=0.8$
; (b)
$\unicode[STIX]{x1D700}_{x}=0.8$
; (b)
 $R_{d}=290~\unicode[STIX]{x03BC}\text{m}$
,
$R_{d}=290~\unicode[STIX]{x03BC}\text{m}$
,
 $E_{l}=3.4~\text{mJ}$
,
$E_{l}=3.4~\text{mJ}$
,
 $\unicode[STIX]{x1D700}_{x}=0.9$
. The time is stated in microseconds and the length of the bar in the first frame in the top row is 1.0 mm.
$\unicode[STIX]{x1D700}_{x}=0.9$
. The time is stated in microseconds and the length of the bar in the first frame in the top row is 1.0 mm.

Figure 9. Flow around the fragmented droplet: (a) the initial ejection of droplets from the expanding cavitation bubble; (b) shear-layer formation; (c) vortex ring formation.
Once the droplet wall is ruptured, vapour and fragmented drops are violently ejected and this fast multiphase flow is accelerated from the high pressure,
 $P_{+}$
, inside the drop into the surrounding region being at a lower pressure,
$P_{+}$
, inside the drop into the surrounding region being at a lower pressure,
 $P_{-}$
, see figure 9(a). This forms an expanding jet flow of gas and fragments. Considering the droplet and the surrounding air as a closed system, momentum must be conserved. Thus, with the fast ejected material, the main droplet/sheet also acquires momentum such that the centre of mass of the closed system remains at rest. The main droplet expands radially and translates in the distal direction (to the left in figure 9
b), forming a sheet. This reduces the pressure at the proximal side and gas is drawn from the bulk into the back, forming a sheet. The expanding jet and the inflow of gas to the back of the drop are in opposite directions, thus they compete and form a stagnation zone which is along a stagnation surface, as sketched in figure 9(b). This situation relates to figure 7(a),
$P_{-}$
, see figure 9(a). This forms an expanding jet flow of gas and fragments. Considering the droplet and the surrounding air as a closed system, momentum must be conserved. Thus, with the fast ejected material, the main droplet/sheet also acquires momentum such that the centre of mass of the closed system remains at rest. The main droplet expands radially and translates in the distal direction (to the left in figure 9
b), forming a sheet. This reduces the pressure at the proximal side and gas is drawn from the bulk into the back, forming a sheet. The expanding jet and the inflow of gas to the back of the drop are in opposite directions, thus they compete and form a stagnation zone which is along a stagnation surface, as sketched in figure 9(b). This situation relates to figure 7(a),
 $15.6~\unicode[STIX]{x03BC}\text{s}\leqslant t\leqslant 31.2~\unicode[STIX]{x03BC}\text{s}$
. The dark stripes in figure 8(a) at time
$15.6~\unicode[STIX]{x03BC}\text{s}\leqslant t\leqslant 31.2~\unicode[STIX]{x03BC}\text{s}$
. The dark stripes in figure 8(a) at time
 $t=25~\unicode[STIX]{x03BC}\text{s}$
can now be related to the stagnation surface. Here, droplets accumulate due to the lower velocity. Later, both flows separate and it is likely that turbulence transports these accumulated droplets.
$t=25~\unicode[STIX]{x03BC}\text{s}$
can now be related to the stagnation surface. Here, droplets accumulate due to the lower velocity. Later, both flows separate and it is likely that turbulence transports these accumulated droplets.
The inflow on the back of the expanding sheet will eventually form a vortex ring. Besides the vorticity transported from the curved inflow, it may be that vorticity is formed on the impulsively accelerated surface of the sheet and advected with this inflow (Bouard & Coutanceau Reference Bouard and Coutanceau1980).
4.4 Fragment interaction with the liquid sheet
Figure 7(a,b) shows that droplets are entrained into a vortical flow at the distal end of the sheet. This observation supports our view on the vortex ring formation, see figure 9(c). Thus, it is expected that droplets ejected may become entrained in this flow and impact from the distal side onto the sheet. We now want to document cases of sheet deformation and eventual fragmentation caused by these events. Figure 10(a–c) presents three representative events of sheet rupture, simple coalescence and capillary wave generation.

Figure 10. Membranes impacted by entrained water droplet fragments. (a) Ruptured membrane;
 $R_{d}=210~\unicode[STIX]{x03BC}\text{m}$
,
$R_{d}=210~\unicode[STIX]{x03BC}\text{m}$
,
 $E_{l}=0.6~\text{mJ}$
,
$E_{l}=0.6~\text{mJ}$
,
 $V_{rel}=4.2~\text{m}~\text{s}^{-1}$
,
$V_{rel}=4.2~\text{m}~\text{s}^{-1}$
,
 $We=4.9$
; (b) simple coalescence;
$We=4.9$
; (b) simple coalescence;
 $R_{d}=510~\unicode[STIX]{x03BC}\text{m}$
,
$R_{d}=510~\unicode[STIX]{x03BC}\text{m}$
,
 $E_{l}=1.3~\text{mJ}$
,
$E_{l}=1.3~\text{mJ}$
,
 $V_{rel}=5.7~\text{m}~\text{s}^{-1}$
,
$V_{rel}=5.7~\text{m}~\text{s}^{-1}$
,
 $We=4.4$
; (c) capillary waves on the surface of the membrane;
$We=4.4$
; (c) capillary waves on the surface of the membrane;
 $R_{d}=520~\unicode[STIX]{x03BC}\text{m}$
,
$R_{d}=520~\unicode[STIX]{x03BC}\text{m}$
,
 $E_{l}=0.7~\text{mJ}$
,
$E_{l}=0.7~\text{mJ}$
,
 $V_{rel}=0.2~\text{m}~\text{s}^{-1}$
,
$V_{rel}=0.2~\text{m}~\text{s}^{-1}$
,
 $We=0.02$
. Time in
$We=0.02$
. Time in
 $\unicode[STIX]{x03BC}\text{s}$
. The length of each bar is
$\unicode[STIX]{x03BC}\text{s}$
. The length of each bar is
 $500~\unicode[STIX]{x03BC}\text{m}$
.
$500~\unicode[STIX]{x03BC}\text{m}$
.
From approximately 73 experiments where unstable sheets have been observed, we could relate three experiments where the membrane rupture could be unambiguously related to an impact event; one is shown in figure 10(a). Here, the droplet is marked with an arrow and tracked in the successive frames until
 $t=195~\unicode[STIX]{x03BC}\text{s}$
. The relative velocity between the impacting droplet of radius
$t=195~\unicode[STIX]{x03BC}\text{s}$
. The relative velocity between the impacting droplet of radius
 $r$
and the sheet is
$r$
and the sheet is
 $V_{rel}=4.2~\text{m}~\text{s}^{-1}$
. The Weber number, comparing the kinetic energy of the droplet with the surface energy of the system, is
$V_{rel}=4.2~\text{m}~\text{s}^{-1}$
. The Weber number, comparing the kinetic energy of the droplet with the surface energy of the system, is
 $$\begin{eqnarray}We=\unicode[STIX]{x1D70C}rV_{rel}^{2}/\unicode[STIX]{x1D70E}\end{eqnarray}$$
for this and the other two cases, where the membrane rupture is observed is between
 $We=4.9$
and
$We=4.9$
and
 $We=6.4$
. Most of the cases we observe show either coalescence or bouncing, which is difficult to distinguish in the videos. We have never observed tunnelling of the droplet through the sheet. A case where the sheet is deformed but does not break is shown in figure 7(b) (the impacting droplet tracked by the black arrows) and in figure 10(b,c). In figure 10(c), three surface waves emanate from the three successive impacts. We measured a velocity of the surface wave of
$We=6.4$
. Most of the cases we observe show either coalescence or bouncing, which is difficult to distinguish in the videos. We have never observed tunnelling of the droplet through the sheet. A case where the sheet is deformed but does not break is shown in figure 7(b) (the impacting droplet tracked by the black arrows) and in figure 10(b,c). In figure 10(c), three surface waves emanate from the three successive impacts. We measured a velocity of the surface wave of
 $3.5~\text{m}~\text{s}^{-1}$
, a capillary wave on infinite deep liquid would have a velocity of
$3.5~\text{m}~\text{s}^{-1}$
, a capillary wave on infinite deep liquid would have a velocity of
 $4.6~\text{m}~\text{s}^{-1}$
. For most of the cases where coalescence/bouncing is occurring we measure a
$4.6~\text{m}~\text{s}^{-1}$
. For most of the cases where coalescence/bouncing is occurring we measure a
 $We$
number below 4.9, e.g. see figure 10(b,c).
$We$
number below 4.9, e.g. see figure 10(b,c).
The impact of a droplet on a thin film has been studied in detail since Courbin & Stone (Reference Courbin and Stone2006). For the
 $We<16$
, Gilet & Bush (Reference Gilet and Bush2009) observe bouncing and coalescence, which was approximately confirmed by Kim & Wu (Reference Kim and Wu2010). Thus, our observations on coalescence seem to agree with their experiments. Yet we could not find literature where film rupture is induced by the pure impact of a droplet onto a sheet. Thoroddsen, Etoh & Takehara (Reference Thoroddsen, Etoh and Takehara2006) observed rupture of a thin splash of water when impacted by ethanol droplets, which they attributed to Marangoni stresses. In our case, e.g. figure 10(a), we do not expect gradients in the surface tension; one rupture is seen for soap droplets on a soap film and two ruptures for pure water droplets impacting on water sheets. A significant difference between our liquids and that used in Gilet & Bush (Reference Gilet and Bush2009) is that we use the same fluid impacting onto the thin film, whereas they use a liquid with a higher surface tension impacting onto the soap film. This may lead to Marangoni stresses which stabilize the film during the impact.
$We<16$
, Gilet & Bush (Reference Gilet and Bush2009) observe bouncing and coalescence, which was approximately confirmed by Kim & Wu (Reference Kim and Wu2010). Thus, our observations on coalescence seem to agree with their experiments. Yet we could not find literature where film rupture is induced by the pure impact of a droplet onto a sheet. Thoroddsen, Etoh & Takehara (Reference Thoroddsen, Etoh and Takehara2006) observed rupture of a thin splash of water when impacted by ethanol droplets, which they attributed to Marangoni stresses. In our case, e.g. figure 10(a), we do not expect gradients in the surface tension; one rupture is seen for soap droplets on a soap film and two ruptures for pure water droplets impacting on water sheets. A significant difference between our liquids and that used in Gilet & Bush (Reference Gilet and Bush2009) is that we use the same fluid impacting onto the thin film, whereas they use a liquid with a higher surface tension impacting onto the soap film. This may lead to Marangoni stresses which stabilize the film during the impact.
4.5 Regime of coarse fragmentation
In the coarse fragmentation regime the cavitation bubble remains intact during the first oscillation cycle, yet we may observe instabilities on the surface of the droplet which develop into jets. We now focus on the bubble dynamics within the droplet before we discuss the instabilities of the droplet surface.
4.5.1 Bubble dynamics within the droplet
An example of a bubble contained within the droplet is shown in figure 6(d). A laser pulse of 2.2 mJ resulted into a bubble of maximum equivalent radius
 $R_{beq}=0.92~\text{mm}$
. Considering only the work done against the pressure, approximately 10 % of the laser energy is converted into potential energy of the bubble (Vogel et al.
Reference Vogel, Noack, Nahen, Theisen, Busch, Parlitz, Hammer, Noojin, Rockwell and Birnbruger1999). The bubble dynamics is governed by inertia. In contrast to a bubble in an infinite liquid, inside a droplet a smaller mass needs to be accelerated, which reduces the oscillation period of the cavitation bubble. We measure an oscillation period of
$R_{beq}=0.92~\text{mm}$
. Considering only the work done against the pressure, approximately 10 % of the laser energy is converted into potential energy of the bubble (Vogel et al.
Reference Vogel, Noack, Nahen, Theisen, Busch, Parlitz, Hammer, Noojin, Rockwell and Birnbruger1999). The bubble dynamics is governed by inertia. In contrast to a bubble in an infinite liquid, inside a droplet a smaller mass needs to be accelerated, which reduces the oscillation period of the cavitation bubble. We measure an oscillation period of
 $116.2\pm 6~\unicode[STIX]{x03BC}\text{s}$
with a maximum bubble radius at approximately half the period, i.e. at
$116.2\pm 6~\unicode[STIX]{x03BC}\text{s}$
with a maximum bubble radius at approximately half the period, i.e. at
 $58.1\pm 6~\unicode[STIX]{x03BC}\text{s}$
. The Rayleigh collapse time (for an infinite medium) predicts a collapse time of
$58.1\pm 6~\unicode[STIX]{x03BC}\text{s}$
. The Rayleigh collapse time (for an infinite medium) predicts a collapse time of
 $T_{R}=0.915R_{beq}\;(\unicode[STIX]{x1D70C}/P_{\infty })^{1/2}=84~\unicode[STIX]{x03BC}\text{s}$
, and therefore overestimates the measured bubble oscillation time. The equivalent bubble radius is obtained from the apparent change of the droplet volume, as a direct measurement of the bubble size is difficult because the droplet acts like an optical lens. The uncertainty in estimating the size of the bubble is
$T_{R}=0.915R_{beq}\;(\unicode[STIX]{x1D70C}/P_{\infty })^{1/2}=84~\unicode[STIX]{x03BC}\text{s}$
, and therefore overestimates the measured bubble oscillation time. The equivalent bubble radius is obtained from the apparent change of the droplet volume, as a direct measurement of the bubble size is difficult because the droplet acts like an optical lens. The uncertainty in estimating the size of the bubble is
 $\pm 20~\unicode[STIX]{x03BC}\text{m}$
. A simple model of the oscillation of a bubble in a droplet has been derived by Obreschkow et al. (Reference Obreschkow, Kobel, Dorsaz, De Bosset, Nicollier and Farhat2006)
$\pm 20~\unicode[STIX]{x03BC}\text{m}$
. A simple model of the oscillation of a bubble in a droplet has been derived by Obreschkow et al. (Reference Obreschkow, Kobel, Dorsaz, De Bosset, Nicollier and Farhat2006)
 $$\begin{eqnarray}R_{b}\ddot{R}_{b}+\frac{3}{2}{\dot{R}}_{b}^{2}-2\unicode[STIX]{x1D6FC}{\dot{R}}_{b}^{2}-\unicode[STIX]{x1D6FC}R_{b}\ddot{R}_{b}+\frac{1}{2}\unicode[STIX]{x1D6FC}^{4}{\dot{R}}_{b}^{2}=-\frac{P_{\infty }}{\unicode[STIX]{x1D70C}_{l}},\end{eqnarray}$$
where
 $\unicode[STIX]{x1D6FC}$
is the ratio between the instantaneous radii of the bubble,
$\unicode[STIX]{x1D6FC}$
is the ratio between the instantaneous radii of the bubble,
 $R_{b}(t)$
, and the droplet
$R_{b}(t)$
, and the droplet
 $R_{d}(t)$
. Next, we compare a few measured radius–time curves with (4.3). Figure 11(a) portrays the experimental bubble dynamics,
$R_{d}(t)$
. Next, we compare a few measured radius–time curves with (4.3). Figure 11(a) portrays the experimental bubble dynamics,
 $R_{b}(t)$
, of three droplets of different size (the black squares correspond to figure 6
d). Time
$R_{b}(t)$
, of three droplets of different size (the black squares correspond to figure 6
d). Time
 $t=0$
is the first picture with the bubble present, thus
$t=0$
is the first picture with the bubble present, thus
 $R_{b}(t=0)>0$
. We observe a symmetric expansion collapse cycle, indicating that the dynamics is governed by a potential flow. Equation (4.3) with
$R_{b}(t=0)>0$
. We observe a symmetric expansion collapse cycle, indicating that the dynamics is governed by a potential flow. Equation (4.3) with
 $\unicode[STIX]{x1D6FC}=0$
restores the original Rayleigh collapse. The solution is plotted with thick dots in figure 11(b). Clearly this curve overestimates the collapse time of the three experimental bubbles. Yet the model with the appropriate
$\unicode[STIX]{x1D6FC}=0$
restores the original Rayleigh collapse. The solution is plotted with thick dots in figure 11(b). Clearly this curve overestimates the collapse time of the three experimental bubbles. Yet the model with the appropriate
 $\unicode[STIX]{x1D6FC}$
taken from the experiment nicely reproduces the observed bubble and droplet dynamics. The non-dimensionalized data depicted in figure 11(b) correspond to the experimental data in figure 11(a) denoted with the same symbol.
$\unicode[STIX]{x1D6FC}$
taken from the experiment nicely reproduces the observed bubble and droplet dynamics. The non-dimensionalized data depicted in figure 11(b) correspond to the experimental data in figure 11(a) denoted with the same symbol.

Figure 11. Bubble dynamics inside a levitating drop; (a) the expansion and collapse of bubbles of different sizes; (b) non-dimensional experimental results compared to (4.3).
4.5.2 Rayleigh–Taylor instability
Besides the oscillation of a bubble inside the droplet, we observed the ejection of liquid through fine jets at a later stage. An example of the occurrence of jets is shown in figure 6(d). There the jets form just after the first collapse of the bubble, which is captured at time
 $t\approx 116.2~\unicode[STIX]{x03BC}\text{s}$
. If we look very carefully, we already observe some surface waviness earlier, in particular during the maximum bubble expansion, see
$t\approx 116.2~\unicode[STIX]{x03BC}\text{s}$
. If we look very carefully, we already observe some surface waviness earlier, in particular during the maximum bubble expansion, see
 $t=58.1~\unicode[STIX]{x03BC}\text{s}$
in figure 6(d). The Rayleigh–Taylor instabilities are observed predominantly on the north and south poles of the droplet, this is possibly caused by the smaller mass that needs to be displaced from the upper and lower side of the droplet. Our hypothesis is that these surface undulations are the origins for the jets formed after the first bubble collapse. The mechanism behind this may be similar to the jetting from an impulse pressure (Antkowiak et al.
Reference Antkowiak, Bremond, Dizes and Villermaux2007). There, focused flows towards concave regions of the liquid–gas surface are formed which are accelerating slender jets. In our experiment, during the collapse and rebound of the cavitation bubbles, the fast inward flow is abruptly stopped and reversed into an outgoing flow. Neglecting the details of the collapse phase, the final liquid velocity after the collapse can be described by the gradient of an impulse pressure (Batchelor Reference Batchelor1967, § 6.10). The impulse pressure solves the Laplace equation and has to fulfil the constant-pressure boundary conditions at the droplet gas interface. Antkowiak et al. (Reference Antkowiak, Bremond, Dizes and Villermaux2007) showed that if the surface geometry is not compatible with the impulse pressure distribution, gradients in the liquid will be set up which accelerate the fluid. In our case, the above-mentioned surface corrugations are not compatible with the impulse pressure distribution (here an approximately spherical wave outgoing from the centre of the droplet and interacting with an approximately spherical surface). Thus, very similar to their case, we expect pressure gradients near the surface to fulfil the boundary conditions. These accelerate the liquid near the surface into thin jets, as seen in figure 6(d).
$t=58.1~\unicode[STIX]{x03BC}\text{s}$
in figure 6(d). The Rayleigh–Taylor instabilities are observed predominantly on the north and south poles of the droplet, this is possibly caused by the smaller mass that needs to be displaced from the upper and lower side of the droplet. Our hypothesis is that these surface undulations are the origins for the jets formed after the first bubble collapse. The mechanism behind this may be similar to the jetting from an impulse pressure (Antkowiak et al.
Reference Antkowiak, Bremond, Dizes and Villermaux2007). There, focused flows towards concave regions of the liquid–gas surface are formed which are accelerating slender jets. In our experiment, during the collapse and rebound of the cavitation bubbles, the fast inward flow is abruptly stopped and reversed into an outgoing flow. Neglecting the details of the collapse phase, the final liquid velocity after the collapse can be described by the gradient of an impulse pressure (Batchelor Reference Batchelor1967, § 6.10). The impulse pressure solves the Laplace equation and has to fulfil the constant-pressure boundary conditions at the droplet gas interface. Antkowiak et al. (Reference Antkowiak, Bremond, Dizes and Villermaux2007) showed that if the surface geometry is not compatible with the impulse pressure distribution, gradients in the liquid will be set up which accelerate the fluid. In our case, the above-mentioned surface corrugations are not compatible with the impulse pressure distribution (here an approximately spherical wave outgoing from the centre of the droplet and interacting with an approximately spherical surface). Thus, very similar to their case, we expect pressure gradients near the surface to fulfil the boundary conditions. These accelerate the liquid near the surface into thin jets, as seen in figure 6(d).
The question remains: what is the cause of these surface corrugations? Here we propose that the gas–liquid interface of the droplet in contrast to the liquid–gas interface of the bubble is unstable during the bubble oscillation. Plesset (Reference Plesset1954) extended the Rayleigh–Taylor stability criterion of an accelerated planar interface to a spherical interface. He studied two cases, namely the outer fluid being denser and being less dense than the inner fluid. In bubble dynamics occurring in large liquid domains only the denser outer fluid, e.g. water surrounding the gas/vapour bubble, is considered. The stability of this interface is supported by Plesset’s analysis, except for the very brief moment of bubble collapse, see Brenner, Lohse & Dupont (Reference Brenner, Lohse and Dupont1995). However, in the second case, the stability of the gas–liquid interface has received less attention. The interface is unstable to perturbations if the growth function for instabilities
 $$\begin{eqnarray}G(t)=\frac{3}{4}\frac{{\dot{R}}^{2}}{R^{2}}\pm \frac{\ddot{R}}{R}\left(n+\frac{1}{2}\right)>0.\end{eqnarray}$$
Here,
 $n$
is the mode number, where a positive sign refers to the bubble surface and a negative sign to the droplet surface, while
$n$
is the mode number, where a positive sign refers to the bubble surface and a negative sign to the droplet surface, while
 $R$
is the bubble or the droplet radius, respectively. Let us discuss the stability of the droplet interface first: during expansion the droplet velocity decreases, and therefore
$R$
is the bubble or the droplet radius, respectively. Let us discuss the stability of the droplet interface first: during expansion the droplet velocity decreases, and therefore
 $\ddot{R}<0$
; the droplet surface is unstable as well as for sufficiently small velocities during shrinkage. In contrast, the bubble is stabilized by negative accelerations, which is the case for large oscillating bubbles for most of the period.
$\ddot{R}<0$
; the droplet surface is unstable as well as for sufficiently small velocities during shrinkage. In contrast, the bubble is stabilized by negative accelerations, which is the case for large oscillating bubbles for most of the period.
Using a modified Rayleigh–Plesset type derived from (4.3), which additionally accounts for the gas pressure and surface tension, we can evaluate the function
 $G(t)$
for the droplet and the bubble surface for a typical case, e.g. the one shown in figure 6(d), where the bubble expands to approximately 0.9 mm and the droplet from 1.4 to 1.5 mm.
$G(t)$
for the droplet and the bubble surface for a typical case, e.g. the one shown in figure 6(d), where the bubble expands to approximately 0.9 mm and the droplet from 1.4 to 1.5 mm.

Figure 12. Modelling the oscillation of a bubble within a droplet and the stability of their interfaces. (a) Radius–time curve of the droplet (♦ (red)) and the bubble (● (blue)) for the case shown in figure 6(d). Some residual gas is taken into account to cover the rebound phase. (b) Growth function
 $G(t)$
of the droplet for the
$G(t)$
of the droplet for the
 $n=2$
mode, indicating that the interface is always unstable and perturbations grow most strongly during bubble expansion and early collapse phase. (c) Growth function
$n=2$
mode, indicating that the interface is always unstable and perturbations grow most strongly during bubble expansion and early collapse phase. (c) Growth function
 $G(t)$
of the bubble interface, demonstrating the well-known stability of the bubble interface except during the last collapse phase.
$G(t)$
of the bubble interface, demonstrating the well-known stability of the bubble interface except during the last collapse phase.
Figure 12 depicts the spherical bubble and droplet dynamics and the two growth functions
 $G(t)$
for the droplet and the bubble surface, respectively. Equation (4.3), with appropriate initial conditions
$G(t)$
for the droplet and the bubble surface, respectively. Equation (4.3), with appropriate initial conditions
 $R_{b}(t=0)=194~\unicode[STIX]{x03BC}\text{m}$
and
$R_{b}(t=0)=194~\unicode[STIX]{x03BC}\text{m}$
and
 $\dot{R_{b}}(t=0)=95~\text{m}~\text{s}^{-1}$
resulting in a maximum bubble radius of
$\dot{R_{b}}(t=0)=95~\text{m}~\text{s}^{-1}$
resulting in a maximum bubble radius of
 $R_{b}=955~\unicode[STIX]{x03BC}\text{m}$
and
$R_{b}=955~\unicode[STIX]{x03BC}\text{m}$
and
 $R_{d}=1.5~\text{mm}$
. Together with the undisturbed droplet size,
$R_{d}=1.5~\text{mm}$
. Together with the undisturbed droplet size,
 $R_{d}=1.36~\text{mm}$
, we approximate the case shown in figure 6(d) and analysed in figure 11(a,b) (square symbols) rather well, while noting that the droplet in the experiment has an ellipsoidal shape. The two growth functions
$R_{d}=1.36~\text{mm}$
, we approximate the case shown in figure 6(d) and analysed in figure 11(a,b) (square symbols) rather well, while noting that the droplet in the experiment has an ellipsoidal shape. The two growth functions
 $G(t)$
of perturbations (mode
$G(t)$
of perturbations (mode
 $n=2$
) for the droplet and the bubble, as shown in figure 12(b,c), reveal largely different regions of unstable growth: the surface of the droplet (figure 12
b) is unstable for the whole oscillation period, while the bubble is only unstable during early expansion and late collapse. In the experiment we observe the growth of higher-order modes than the mode
$n=2$
) for the droplet and the bubble, as shown in figure 12(b,c), reveal largely different regions of unstable growth: the surface of the droplet (figure 12
b) is unstable for the whole oscillation period, while the bubble is only unstable during early expansion and late collapse. In the experiment we observe the growth of higher-order modes than the mode
 $n=2$
shown in figure 12(b,c). These have a larger value of
$n=2$
shown in figure 12(b,c). These have a larger value of
 $G(t)$
and are expected to dominate, yet they are also affected more by the stabilizing effects of surface tension, which is neglected in (4.4). We expect that higher-order surface modes exist which grow fastest. Their precise shapes and locations on the droplet surface are important, as they are the origin of the fast jets emanating during the bubble collapse.
$G(t)$
and are expected to dominate, yet they are also affected more by the stabilizing effects of surface tension, which is neglected in (4.4). We expect that higher-order surface modes exist which grow fastest. Their precise shapes and locations on the droplet surface are important, as they are the origin of the fast jets emanating during the bubble collapse.

Figure 13. Overview of all the fragmentation experiments in water conducted for the present study. The horizontal axis denotes the ratio of dynamic pressure to Laplace pressure,
 $R_{d}/(\unicode[STIX]{x1D70E}/P_{a})$
and the vertical axis the non-dimensionalized energy
$R_{d}/(\unicode[STIX]{x1D70E}/P_{a})$
and the vertical axis the non-dimensionalized energy
 $E$
of the bubble. The symbols denote four scenarios: atomization (♦ (black)), stable membrane (▴ (blue)), unstable membrane (● (sky blue)) and coarse fragmentation (▪ (red)). Approximate borders between the scenarios are indicated with black lines (see text).
$E$
of the bubble. The symbols denote four scenarios: atomization (♦ (black)), stable membrane (▴ (blue)), unstable membrane (● (sky blue)) and coarse fragmentation (▪ (red)). Approximate borders between the scenarios are indicated with black lines (see text).
4.6 Parameter plot
4.6.1 Summary of the present experiments
A summary of all the fragmentation tests performed with water are presented in figure 13. The most important parameters of the experiments were the droplet size and the laser energy,
 $E_{l}$
. As introduced in § 2.2, an appropriate energy scale is the work done to form a cavity of a certain volume against the ambient pressure, e.g.
$E_{l}$
. As introduced in § 2.2, an appropriate energy scale is the work done to form a cavity of a certain volume against the ambient pressure, e.g.
 $E_{b}\approx P_{a}V$
, where
$E_{b}\approx P_{a}V$
, where
 $V$
is the volume of the cavity at maximum expansion. In the coarse fragmentation regime we obtain an average energy (out of seven experiments evaluated) of the bubble that is
$V$
is the volume of the cavity at maximum expansion. In the coarse fragmentation regime we obtain an average energy (out of seven experiments evaluated) of the bubble that is
 $7.1\pm 4.0\,\%$
of the initial laser energy. The conversion factor between the laser energy and the bubble energy for all experiments is
$7.1\pm 4.0\,\%$
of the initial laser energy. The conversion factor between the laser energy and the bubble energy for all experiments is
 $\unicode[STIX]{x1D705}=0.07$
. Vogel et al. (Reference Vogel, Noack, Nahen, Theisen, Busch, Parlitz, Hammer, Noojin, Rockwell and Birnbruger1999) reported maximum conversion efficiency for nanosecond laser pulses of 10 % for similar lens parameters. We scale the droplet radius with the ratio of dynamic pressure to the Laplace pressure,
$\unicode[STIX]{x1D705}=0.07$
. Vogel et al. (Reference Vogel, Noack, Nahen, Theisen, Busch, Parlitz, Hammer, Noojin, Rockwell and Birnbruger1999) reported maximum conversion efficiency for nanosecond laser pulses of 10 % for similar lens parameters. We scale the droplet radius with the ratio of dynamic pressure to the Laplace pressure,
 $\unicode[STIX]{x1D70E}/P_{a}$
, see § 2.2. In figure 13, the four scenarios, atomization, (un)stable sheets, and coarse fragmentation are plotted with distinct symbols and they are illustrated with a typical experimental picture. The labels on this figure portray the location of the images presented in previous sections. Label 2(a–d) displays an individual symbol since the final shape of the droplet cannot be determined from the single frames captured. As expected, the high-energy, small-droplet regime is dominated by atomization, while for large droplets and low laser energy only coarse fragmentation is observed. Interestingly, the regimes of stable and unstable sheets are seemingly separated using the normalization. We added lines which distinguish the regimes of most of the experimental data, although there are some overlaps. The rightmost line has slope of
$\unicode[STIX]{x1D70E}/P_{a}$
, see § 2.2. In figure 13, the four scenarios, atomization, (un)stable sheets, and coarse fragmentation are plotted with distinct symbols and they are illustrated with a typical experimental picture. The labels on this figure portray the location of the images presented in previous sections. Label 2(a–d) displays an individual symbol since the final shape of the droplet cannot be determined from the single frames captured. As expected, the high-energy, small-droplet regime is dominated by atomization, while for large droplets and low laser energy only coarse fragmentation is observed. Interestingly, the regimes of stable and unstable sheets are seemingly separated using the normalization. We added lines which distinguish the regimes of most of the experimental data, although there are some overlaps. The rightmost line has slope of
 $-3$
and is a result of the above scaling and with moderate changes in the laser energy. All the other lines are added to aid the reader, but as yet have no physical foundation. No sheets are formed above a laser energy of approximately
$-3$
and is a result of the above scaling and with moderate changes in the laser energy. All the other lines are added to aid the reader, but as yet have no physical foundation. No sheets are formed above a laser energy of approximately
 $E>20$
, while coarse fragmentation is only found for an energy of
$E>20$
, while coarse fragmentation is only found for an energy of
 $E<1$
. While keeping the radius of the droplet constant, we first observe stable sheets and, at higher energy, unstable sheets. The reason is the competition between surface tension and kinetic energy. Most of the data points of the two regimes can be separated with a line with slope of approximately
$E<1$
. While keeping the radius of the droplet constant, we first observe stable sheets and, at higher energy, unstable sheets. The reason is the competition between surface tension and kinetic energy. Most of the data points of the two regimes can be separated with a line with slope of approximately
 $-3$
, for which we cannot provide an explanation.
$-3$
, for which we cannot provide an explanation.
The position of the bubble within the droplet may greatly affect the regime as well. In particular, the offset parameter
 $\unicode[STIX]{x1D700}_{x}$
is not accounted for in figure 13 and may explain some of the scatter. Nevertheless, a remarkably simple parameter plot is found, which should be tested with more experiments and, in particular, with simulations.
$\unicode[STIX]{x1D700}_{x}$
is not accounted for in figure 13 and may explain some of the scatter. Nevertheless, a remarkably simple parameter plot is found, which should be tested with more experiments and, in particular, with simulations.
Table 2. Experimental parameters used in previous studies on drop atomization and fragmentation.

4.6.2 Comparison with previous studies
We compare our results with previous work using a cavitation bubble to fragment a droplet. The experimental parameters are listed in table 2. Please note that we omit work where strongly absorbing
 $\text{CO}_{2}$
laser light (e.g. Kafalas & Ferdinand Reference Kafalas and Ferdinand1973; Kafalas & Herrmann Reference Kafalas and Herrmann1973) and droplets containing a laser-light-absorbing dye (Klein et al.
Reference Klein, Bouwhuis, Visser, Lhuissier, Sun, Snoeijer, Villermaux, Lohse and Gelderblom2015) are used. In these works the fragmentation process might not be caused by cavitation, but rather by linear and nonlinear absorption on the surface of the droplet. Eickmans et al. (Reference Eickmans, Hsieh and Chang1987a
,Reference Eickmans, Hsieh and Chang
b
) recorded the emission spectra of the plasma caused by the dielectric breakdown. Therefore, they used rather high energies for the droplet size studies. They find matter emission plumes on the illuminated and the shadow face of the droplet which seem similar to the atomization regime. Their normalized energy is up to two orders of magnitude larger than the one reported in figure 13. Zhang et al. (Reference Zhang, Lam, Wood, Chu and Chang1987) performed high-speed stroboscopic photography in the atomization regime (named ‘explosive vaporization’). They also mention that a cavitation bubble precedes the film rupture, which may be compared with our figure 2(b,c). Similarly, they observe translation of the liquid mass away from the rupture side. Again this work uses a normalized energy up to two orders of magnitude larger than used in the present experiments. Hsieh et al. (Reference Hsieh, Zheng, Wood, Chu and Chang1987) create dielectric breakdown in an argon atmosphere next to a droplet. They report a plasma front penetrating into the droplet, which then causes fragmentation of the droplet. The shock front velocities leaving the droplet back into the argon atmosphere accelerate up to
$\text{CO}_{2}$
laser light (e.g. Kafalas & Ferdinand Reference Kafalas and Ferdinand1973; Kafalas & Herrmann Reference Kafalas and Herrmann1973) and droplets containing a laser-light-absorbing dye (Klein et al.
Reference Klein, Bouwhuis, Visser, Lhuissier, Sun, Snoeijer, Villermaux, Lohse and Gelderblom2015) are used. In these works the fragmentation process might not be caused by cavitation, but rather by linear and nonlinear absorption on the surface of the droplet. Eickmans et al. (Reference Eickmans, Hsieh and Chang1987a
,Reference Eickmans, Hsieh and Chang
b
) recorded the emission spectra of the plasma caused by the dielectric breakdown. Therefore, they used rather high energies for the droplet size studies. They find matter emission plumes on the illuminated and the shadow face of the droplet which seem similar to the atomization regime. Their normalized energy is up to two orders of magnitude larger than the one reported in figure 13. Zhang et al. (Reference Zhang, Lam, Wood, Chu and Chang1987) performed high-speed stroboscopic photography in the atomization regime (named ‘explosive vaporization’). They also mention that a cavitation bubble precedes the film rupture, which may be compared with our figure 2(b,c). Similarly, they observe translation of the liquid mass away from the rupture side. Again this work uses a normalized energy up to two orders of magnitude larger than used in the present experiments. Hsieh et al. (Reference Hsieh, Zheng, Wood, Chu and Chang1987) create dielectric breakdown in an argon atmosphere next to a droplet. They report a plasma front penetrating into the droplet, which then causes fragmentation of the droplet. The shock front velocities leaving the droplet back into the argon atmosphere accelerate up to
 $20~\text{km}~\text{s}^{-1}$
at a laser energy of 10 mJ for
$20~\text{km}~\text{s}^{-1}$
at a laser energy of 10 mJ for
 $40~\unicode[STIX]{x03BC}\text{m}$
radius droplets. In our work we neglected the plasma formation and assume it occurs within the droplet for times shorter than the growth time of the cavitation bubble. However, at higher energies and smaller droplets, plasma dynamics may become important, as was revealed by Hsieh et al. (Reference Hsieh, Zheng, Wood, Chu and Chang1987).
$40~\unicode[STIX]{x03BC}\text{m}$
radius droplets. In our work we neglected the plasma formation and assume it occurs within the droplet for times shorter than the growth time of the cavitation bubble. However, at higher energies and smaller droplets, plasma dynamics may become important, as was revealed by Hsieh et al. (Reference Hsieh, Zheng, Wood, Chu and Chang1987).
Plasma dynamics can be ignored also with short laser pulses. Lindinger et al. (Reference Lindinger, Hager, Sosaciu, Bernhardt, Wöste, Duft and Leisner2004) focused and amplified Ti:Sa 60 fs long laser pulses onto
 $50~\unicode[STIX]{x03BC}\text{m}$
radius droplets. Interestingly, their work covers normalized energy values similar to ours. Let us compare some of their results. At their lowest energy of the laser pulse of
$50~\unicode[STIX]{x03BC}\text{m}$
radius droplets. Interestingly, their work covers normalized energy values similar to ours. Let us compare some of their results. At their lowest energy of the laser pulse of
 $16~\unicode[STIX]{x03BC}\text{J}$
(figure 3 in their paper) they observe a slowly growing jet which resembles the coarse fragmentation regime in the low-energy range of our study. Their energy can be converted to a normalized energy by using a 3 % conversion efficiency for fs-laser pulses (Vogel et al.
Reference Vogel, Noack, Nahen, Theisen, Busch, Parlitz, Hammer, Noojin, Rockwell and Birnbruger1999) to
$16~\unicode[STIX]{x03BC}\text{J}$
(figure 3 in their paper) they observe a slowly growing jet which resembles the coarse fragmentation regime in the low-energy range of our study. Their energy can be converted to a normalized energy by using a 3 % conversion efficiency for fs-laser pulses (Vogel et al.
Reference Vogel, Noack, Nahen, Theisen, Busch, Parlitz, Hammer, Noojin, Rockwell and Birnbruger1999) to
 $E\approx 0.01$
. This experiment would give a data point which is outside the measured regime (normalized radius of the droplet
$E\approx 0.01$
. This experiment would give a data point which is outside the measured regime (normalized radius of the droplet
 $P_{a}R_{d}/\unicode[STIX]{x1D70E}=69$
). Increasing the energy to
$P_{a}R_{d}/\unicode[STIX]{x1D70E}=69$
). Increasing the energy to
 $E\approx 0.03$
(figure 5 in Lindinger et al. (Reference Lindinger, Hager, Sosaciu, Bernhardt, Wöste, Duft and Leisner2004)) shows a stable liquid sheet. Again, this is outside our range of data points, but it would be expected that, by increasing the energy, the stable sheet regime is reached. We cannot compare their experiments at highest energy; plasma is generated at the illuminated face of the droplet and the laser no longer nucleates a single bubble within the droplet. Absorption of the laser light at the illuminated face was also observed by Klein et al. (Reference Klein, Bouwhuis, Visser, Lhuissier, Sun, Snoeijer, Villermaux, Lohse and Gelderblom2015) using light-absorbing dye. Unfortunately, we cannot compare the dynamics of droplet deformation either, as the mechanism of force generation is very much different. In their study the droplet is shaped by the vaporization and pressure generation acting on the illuminated surface of the droplet, while in our study the cavitation bubble is accelerating a flow and/or shock wave inside the droplet, leading to the fragmentation.
$E\approx 0.03$
(figure 5 in Lindinger et al. (Reference Lindinger, Hager, Sosaciu, Bernhardt, Wöste, Duft and Leisner2004)) shows a stable liquid sheet. Again, this is outside our range of data points, but it would be expected that, by increasing the energy, the stable sheet regime is reached. We cannot compare their experiments at highest energy; plasma is generated at the illuminated face of the droplet and the laser no longer nucleates a single bubble within the droplet. Absorption of the laser light at the illuminated face was also observed by Klein et al. (Reference Klein, Bouwhuis, Visser, Lhuissier, Sun, Snoeijer, Villermaux, Lohse and Gelderblom2015) using light-absorbing dye. Unfortunately, we cannot compare the dynamics of droplet deformation either, as the mechanism of force generation is very much different. In their study the droplet is shaped by the vaporization and pressure generation acting on the illuminated surface of the droplet, while in our study the cavitation bubble is accelerating a flow and/or shock wave inside the droplet, leading to the fragmentation.
Obreschkow et al. (Reference Obreschkow, Kobel, Dorsaz, De Bosset, Nicollier and Farhat2006) investigated the dynamics of a spark-generated bubble inside a large droplet. They use microgravity to obtain an almost spherical shape of the droplet with radii of up to 13 mm. Very similar to our study, shortly after bubble generation they observed secondary cavitation near the droplet surface, and instabilities of the droplet surface after bubble collapse. The ratio of the normalized dynamic pressure to the Laplace pressure is in the range
 $8900<R_{d}/(\unicode[STIX]{x1D70E}/P_{a})<14\,400$
and a bubble energy between
$8900<R_{d}/(\unicode[STIX]{x1D70E}/P_{a})<14\,400$
and a bubble energy between
 $0.015<E=(R_{b}/R_{d})^{3}<0.455$
. These parameters place their experiments outside the range of our data points (coarse fragmentation regime); however, one can presume that, for the range of energy values tested and the size of their droplets, coarse fragmentation patterns are obtained. Their results show fine jets emanating from the droplet surface closer to the bubble and which are formed shortly after the bubble collapse. We speculate these jets are very similar to the ones shown in figure 6(d) and the result of the Rayleigh–Taylor instability discussed in § 4.5.2.
$0.015<E=(R_{b}/R_{d})^{3}<0.455$
. These parameters place their experiments outside the range of our data points (coarse fragmentation regime); however, one can presume that, for the range of energy values tested and the size of their droplets, coarse fragmentation patterns are obtained. Their results show fine jets emanating from the droplet surface closer to the bubble and which are formed shortly after the bubble collapse. We speculate these jets are very similar to the ones shown in figure 6(d) and the result of the Rayleigh–Taylor instability discussed in § 4.5.2.
5 Conclusions
We have studied the fragmentation of levitating droplets induced by cavitation bubbles. The experimental results reveal three distinct fragmentation regimes, which we have termed atomization, sheet formation and coarse fragmentation. The main parameters affecting the regimes in our experiment (using only water as a liquid) are the laser energy and the size of the droplet. During the nucleation of the bubble, stroboscopic photography reveals the formation of secondary cavitation near the surface of the droplet. Geometric focusing of an off-centre generated shock wave within an ellipsoidal droplet leads to an annular ring of secondary cavitation in the experiments and in a simple acoustic model. In smaller droplets, a thin liquid film separating the expanding bubble from the atmosphere may rupture, then leading to a complex fragmentation scenario of atomization. There, we see the release of a shock wave into the surrounding air, a fine mist (submicron-sized droplets) accelerated to several times the acoustic velocity, and a coarser fragmenting front part of the droplet probably caused by Rayleigh–Taylor instability. At lower energies or larger droplets, the film ruptures later in time. Then, the pressure difference between the bubble and the atmosphere results in a less violent acceleration of the main droplet body, i.e. the droplet deforms into a sheet. Two scenarios have been observed: smaller droplets/sheets are dominated by surface tension and the sheet collapses back into a droplet, while larger and thinner sheets rupture, leading to Rayleigh–Plateau unstable liquid filaments. Even larger droplets (or lower bubble energies) essentially keep the droplet intact with only little loss of mass. This coarse fragmentation regime shows an exciting instability of the droplet surface being Rayleigh–Taylor unstable during the whole bubble oscillation period.
The utilization of acoustic levitation allows one to conduct rather simple table-top experiments on droplet fragmentation. We find complex and interesting fluid mechanics, which is relevant for environmental monitoring with high-power lidar systems. In addition, the interaction of the laser with the droplet allows one to shape the liquid, which may be advantageous for industrial application, e.g. EUV light sources (Banine et al. Reference Banine, Koshelev and Swinkels2011), LIBS- based chromatography (Janzen et al. Reference Janzen, Fleige, Noll, Schwenke, Lahmann, Knoth, Beaven, Jantzen, Oest and Koke2005), and LIBS (Noll Reference Noll2012).
Acknowledgements
The authors are grateful to Professor D. Quéré for useful suggestions. The valuable comments and suggestions made by the anonymous reviewers are also appreciated.


