


1. Introduction
Control of flow past bluff bodies has received considerable attention due to its practical significance in engineering applications. Vortex shedding in the wake of a circular cylinder, resulting in a Bénard–Kármán vortex street, leads to large unsteady drag and lift forces acting on the cylinder. This may result in vortex-induced vibrations, which in certain cases lead to resonance, eventually resulting in structural damage (Williamson Reference Williamson1996). Several techniques have been proposed to control or suppress vortex shedding in the cylinder wake. One of the methods of flow control is the use of a rigid or flexible splitter plate attached to a stationary cylinder (Roshko Reference Roshko1954; Gerrard Reference Gerrard1966; Apelt, West & Szewczyk Reference Apelt, West and Szewczyk1973; Apelt & West Reference Apelt and West1975; Bearman Reference Bearman1984; Kwon & Choi Reference Kwon and Choi1996; Anderson & Szewczyk Reference Anderson and Szewczyk1997; Lee & You Reference Lee and You2013; Wu et al. Reference Wu, Qiu, Shu and Zhao2014a). A splitter plate, attached downstream, inhibits the interaction between the separating cylinder shear layers, thereby delaying vortex shedding in the wake. This results in a weaker Kármán vortex street in the wake. Consequently, the fluctuating lift and drag forces acting on the cylinder are reduced.
Recent studies by Wu & Shu (Reference Wu and Shu2011), Sudhakar & Vengadesan (Reference Sudhakar and Vengadesan2012) and Wu et al. (Reference Wu, Qiu, Shu and Zhao2014a); Wu, Shu & Zhao (Reference Wu, Shu and Zhao2014b) on flow past a stationary cylinder with an attached flapping plate have underlined the importance of forcing parameters in modulating the wake structures and in drag reduction. They also observed interactions between the vortices generated from the cylinder surface and those generated at the plate tip. Another method of flow control is to impart oscillations at prescribed conditions to the forebody. Forced oscillations of a cylinder can be achieved by imparting rotational oscillations to the cylinder or by oscillating the cylinder in-line or transverse to the free stream. The wake structure of a rotationally oscillating cylinder is strongly affected by the cylinder forcing parameters. Under certain forcing conditions, the vortex shedding frequency in the wake matches the cylinder forcing frequency, resulting in a ‘lock-in’ of the wake to the cylinder forcing. Such forcing is also known to reduce drag under certain conditions (Tokumaru & Dimotakis Reference Tokumaru and Dimotakis1991; Shiels & Leonard Reference Shiels and Leonard2001; Fujisawa, Tanahashi & Srinivas Reference Fujisawa, Tanahashi and Srinivas2005; Thiria, Goujon-Durand & Wesfreid Reference Thiria, Goujon-Durand and Wesfreid2006; Lee & Lee Reference Lee and Lee2008; Kumar et al. Reference Kumar, Lopez, Probst, Francisco, Askari and Yang2013).
In nature, birds and fish flap their wings and tails to propel themselves while flying or swimming. Thrust generation in flapping flight has therefore been a major source of inspiration in studying the flow past pitching airfoils. These studies have highlighted the significance of forcing parameters in altering the wake structure and in thrust generation (Koochesfahani Reference Koochesfahani1989; Anderson et al. Reference Anderson, Streitlien, Barrett and Triantafyllou1998; Bohl & Koochesfahani Reference Bohl and Koochesfahani2009; Godoy-Diana et al. Reference Godoy-Diana, Marais, Aider and Wesfreid2009). Studies involving direct force measurements on rigid pitching airfoils have shown that thrust is generated through the development of a jet-like velocity profile, associated with the shedding of a reverse Kármán vortex street (Triantafyllou, Triantafyllou & Grosenbaugh Reference Triantafyllou, Triantafyllou and Grosenbaugh1993; Anderson et al. Reference Anderson, Streitlien, Barrett and Triantafyllou1998). A similar observation has been made in the flow past a rotationally oscillating cylinder (which is a bluff body) with an attached filament.
A recent study by Sunil, Kumar & Poddar (Reference Sunil, Kumar and Poddar2020b) showed that filament oscillation significantly alters the wake structure in the flow past a rotationally oscillating cylinder from a Kármán vortex street to a reverse Kármán vortex street, resulting in thrust generation. This suggests that the mechanisms of flow and thrust generation in the flow past pitching airfoils and an oscillating cylinder–filament system may be similar. However, the study by Floryan, Van Buren & Smits (Reference Floryan, Van Buren and Smits2020) in the recent literature has shown that conclusions drawn solely based on wake structure are not reliable indicators of swimming performance. Recent studies have shown that the transition from a Kármán vortex street to a reverse Kármán vortex street precedes the actual drag-to-thrust transition (Godoy-Diana, Aider & Wesfreid Reference Godoy-Diana, Aider and Wesfreid2008; Bohl & Koochesfahani Reference Bohl and Koochesfahani2009; Das, Shukla & Govardhan Reference Das, Shukla and Govardhan2016; Andersen et al. Reference Andersen, Bohr, Schnipper and Walther2017). Therefore, great care must be taken while deriving conclusions about the swimming performance from wake structures (Floryan et al. Reference Floryan, Van Buren and Smits2020).
In addition to flapping their wings and tails, birds and fish use the inherent flexibility in their appendages to actively modify the flow around them to gain an enhanced thrust and improvements in propulsive efficiency, as discussed in the studies of Lighthill (Reference Lighthill1969), Combes & Daniel (Reference Combes and Daniel2003), Fish & Lauder (Reference Fish and Lauder2006), Shelton, Thornycroft & Lauder (Reference Shelton, Thornycroft and Lauder2014) and other works. Flapping and bending of flexible surfaces in a surrounding flow are ubiquitous. Examining the coupled interaction between the fluid and the flexible surface is crucial in understanding fluid–structure interaction problems. This is relevant to applications, such as energy harvesting by flow-induced oscillations of flexible surfaces, and in determining whether flexibility impedes or assists the propulsive motion of animals or devices (Shelley, Vandenberghe & Zhang Reference Shelley, Vandenberghe and Zhang2005; Shelley & Zhang Reference Shelley and Zhang2011).
To simulate and mimic fish locomotion in the simplest possible way, numerous investigations have been carried out on flow past pitching flexible panels (Wu Reference Wu1971; Katz & Weihs Reference Katz and Weihs1978; Prempraneerach, Hover & Triantafyllou Reference Prempraneerach, Hover and Triantafyllou2003; Heathcote & Gursul Reference Heathcote and Gursul2007; Michelin & Llewellyn Smith Reference Michelin and Llewellyn Smith2009; Dewey et al. Reference Dewey, Boschitsch, Moored, Stone and Smits2013; Shelton et al. Reference Shelton, Thornycroft and Lauder2014; Quinn, Lauder & Smits Reference Quinn, Lauder and Smits2015; David, Govardhan & Arakeri Reference David, Govardhan and Arakeri2017). Dewey et al. (Reference Dewey, Boschitsch, Moored, Stone and Smits2013) and David et al. (Reference David, Govardhan and Arakeri2017) showed that flexible pitching foils gave an increased thrust and propulsive efficiency compared to rigid pitching foils. A maximum in propulsive efficiency was achieved when the oscillation of the panel yields a Strouhal number,  $St$ (defined as the ratio between the product of foil frequency,
  $f$, and peak-to-peak amplitude of the foil trailing edge,
  $A$, to the free-stream velocity,
  $U_\infty$) in the range 0.25–0.35, similar to that noticed in the work of Triantafyllou et al. (Reference Triantafyllou, Triantafyllou and Grosenbaugh1993) in the flow past rigid pitching foils. This lies within a Strouhal-number range where optimal fish propulsion occurs.
In the flow past rigid pitching airfoils, at high Strouhal numbers,  $St>0.4$, a deflected jet, associated with the formation of an asymmetric reverse Kármán vortex street, is observed (Lewin & Haj-Hariri Reference Lewin and Haj-Hariri2003; Von Ellenrieder, Parker & Soria Reference Von Ellenrieder, Parker and Soria2003; Heathcote & Gursul Reference Heathcote and Gursul2007; Godoy-Diana et al. Reference Godoy-Diana, Marais, Aider and Wesfreid2009). Marais et al. (Reference Marais, Thiria, Wesfreid and Godoy-Diana2012) and Shinde & Arakeri (Reference Shinde and Arakeri2014) showed that foil flexibility delays the formation of an asymmetric wake in the flow past rigid pitching foils. Similar observations on the effect of flexibility in delaying the formation of an asymmetric wake in the flow past a rotationally oscillating cylinder has been made in Sunil, Kumar & Poddar (Reference Sunil, Kumar and Poddar2020a).
One of the main motivations for the present work comes from the fact that some marine animals such as tadpoles have a head which closely resembles a bluff body. In addition, they have a very flexible tail. They propel themselves by moving both their head as well as their tail (see supplementary movie 1 available at https://doi.org/10.1017/jfm.2021.894. Here, the Reynolds number,  $Re_{D}$, based on the average diameter of the tadpole's head and its swimming speed, is approximately 170, close to the value of
  $Re_{D} = 150$ examined in the present work). A computational fluid dynamics study on tadpole swimming by Liu, Wassersug & Kawachi (Reference Liu, Wassersug and Kawachi1996) showed that tadpoles gain forward momentum and generate thrust by producing a jet stream in their wake, associated with the shedding of a reverse Kármán vortex street. This is the source of thrust in undulatory swimmers, like fish, and in the flapping flight of birds/insects and pitching airfoils. Results from their study indicate that tadpoles generate thrust through an interaction of flows between the head–body and the tail.
The mechanism of flow and thrust generation in the flow past oscillatory and undulatory swimmers is inherently complicated and involves intricate interactions between the flexible surface and the surrounding flow field (Shinde & Arakeri Reference Shinde and Arakeri2018). Most previous studies have focused on characterizing the performance (in terms of thrust and propulsive efficiency) of rigid/flexible pitching foils. However, the mechanism of flow and thrust generation by a flapping filament attached to a rotationally oscillating cylinder is a relatively new domain that has received little attention. The main aim of the present paper is, therefore, to explore the physics and to clearly bring forward the crucial role of filament oscillation and flexibility in flow and thrust generation in the flow past an oscillating cylinder–filament system.
In this study, tadpole locomotion in a ‘tethered mode’ is approximately modelled by a rotationally oscillating cylinder with an attached flexible filament – the main focus of the present study (see figure 1(a) for a schematic). In nature, tadpoles generally swim by wobbling their head using large-amplitude oscillations and undulating their tail at particular wavelengths and frequencies. In the present paper, however, the filament is not actuated along its length and is free to move passively under the influence of the cylinder forcing parameters and the surrounding flow field. The classical paper by Machin (Reference Machin1958) explicitly discusses the differences between the motions of an active flagellum versus an actuated passive filament. It is established in their work that a passive elastic filament driven from one end cannot exhibit more than one-and-a-half wavelengths along its length. If a filament has more than one-and-a-half wavelengths along its length, or has a sustained amplitude along its length, the propagation of the waves cannot be due to a passive mechanism. In this case, energy has to be provided to maintain undulatory motions along the filament length. In the present work, the filament does not exhibit more than one wavelength along its length. Therefore, the filaments used in the current study can be appropriately described as actuated passive elastic filaments.

Figure 1. (a) Schematic of the problem and (b) perspective view of the experimental set-up.
In the case of rigid pitching airfoils with attached flexible panels, relatively small pitching amplitude resulted in no leading-edge separation from the airfoil surface. In these cases, boundary layer vorticity sheds from the airfoil trailing edge and interacts with the flow generated at the filament tip. However, in the present study, in the case of a rotationally oscillating cylinder with an attached filament, the shear layers separate from the cylinder surface, impinge on the filament and interact with the flow generated at the filament tip. The resultant wake structure depends on the cylinder forcing parameters, filament length as well as the filament stiffness.
The present study aims to address the following questions: (1) How does a filament modify the wake structure of a rotationally oscillating cylinder from a Kármán vortex street to a reverse Kármán vortex street? What are the mechanisms involved in thrust generation? (2) What is the effect of cylinder forcing parameters on the resultant wake structure and forces acting on the cylinder–filament system? (3) What is the effect of filament flexibility on the wake structure? How does filament flexibility inhibit the formation of an asymmetric wake?
The present work focuses on characterizing the flow past an oscillating cylinder–filament system by the following means. (1) Visualizing the wake structure obtained through laser-induced fluorescence technique. (2) Studying the evolution of vortex shedding frequency in the wake from hot-film data to examine the phenomenon of lock-in. (3) Examining the time evolution of vortex formation and shedding in the wake from vorticity data and the measured velocity fields and its relation to thrust generation. (4) Characterizing the properties of a vortex (such as vortex circulation and spatial arrangement) in the wake at an instant when it is shed from the filament tip. (5) Examining the velocity and vorticity field from time-averaged particle image velocimetry (PIV) data. (6) Estimation of streamwise force on the cylinder–filament system from wake velocity data using a modified formulation, suitable in a flow field where asymmetric wakes are observed.
2. Experimental set-up and methods
2.1. Water tunnel and cylinder–filament system
The experiments were carried out in a water tunnel facility with a test section of dimensions: 18 cm  $\times$ 25 cm
  $\times$ 46 cm. The tunnel has a 1.5 hp centrifugal pump for recirculating the water. A maximum speed of 10
  $\textrm {cm}~\textrm {s}^{-1}$ can be achieved in the test section. The free-stream velocity,
  $U_{\infty }$, in the test section required to realize a
  $Re_{D} = 150$ was
  $1.5~\textrm {cm}~\textrm {s}^{-1}$. The turbulence intensity and flow uniformity under the experimental conditions were found to be within 2.5 % and 2 % of the free-stream velocity, respectively. The turbulence intensity and flow uniformity in the tunnel test section were measured using planar PIV. The top of the test section was open. Therefore, a Plexiglas sheet was used for covering the top. The cylinder was inserted through a rectangular slot in this Plexiglas sheet. It was flush mounted on an anodized plate, 17.5 cm wide and 46 cm long, placed at the bottom wall of the test section. A bearing inserted in the anodized plate ensured smooth motion of the cylinder without wobbling. The cylinder model was a brass rod of diameter
  $D = 1$ cm and wetted length 25 cm. The blockage resulting from the cylinder in the test section was 5.5 %.
The filaments used in the study were overhead projector sheets as well as thin polythene sheets. Three filaments of different flexibility and lengths  $L/D = 2$ and 5 were used in the study. In order to characterize the filament flexibility, an effective stiffness,
  $K$, is defined in this study as
 \begin{equation} K= \frac{Et_{f}^3}{12(1-\nu^2)\rho_{w}U_{\infty}^2L^3}. \end{equation}
Here,  $E$ is the Young's modulus of the filament,
  $t_{f}$ is the filament thickness and
  $\nu$ is the Poisson's ratio. The Young's modulus of the filament,
  $E$, can be estimated using Euler–Bernoulli beam theory by treating the filament as a uniformly loaded cantilever beam deflecting under self-weight. Then the displacement of the filament tip,
  $\delta$ can be written as
 \begin{equation} \delta = \frac{wL^4}{8EI}, \end{equation}
where  $w$ is the weight per unit length of the filament and
  $I$ is the second moment of cross-sectional area. The material properties of the filaments used in the study as well as their natural frequency is presented in table 1.
Table 1. Material properties of the filaments used in the study.

The natural frequencies of the filaments were estimated using Euler–Bernoulli beam theory by treating the filament as a cantilever beam. While estimating the natural frequency of the filament in these cases, apart from the mass of the filament, an added mass of the fluid ( $\sim$41 g) is also included. The added mass of the fluid was estimated by considering the distribution of fluid mass along the filament span while it is mounted within the tunnel test section, similar to the estimation in Shinde & Arakeri (Reference Shinde and Arakeri2014).
Sinusoidal rotary oscillations at a prescribed frequency and amplitude were imparted to the cylinder by coupling it directly to a servo-motor. The servo-drive was connected to a signal generator, which provided an analogue signal of known frequency. The cylinder was forced to oscillate according to  $\theta = \theta _{0}\sin \omega t$, where
  $\theta$ is the angular position of the cylinder,
  $\theta _{0}$ is the oscillation amplitude,
  $f$ is the forcing frequency and
  $t$ is the time. Three cylinder oscillation amplitudes of
  $\theta _{0} = 5^{\circ }$,
  $10^{\circ }$ and
  $15^{\circ }$ were chosen in the study. A total of 10 cylinder forcing frequencies ranging between 0.106 Hz and 1.06 Hz, corresponding to cylinder forcing frequency ratios between
  $FR = f_{f}/f_{0} = 0.4$ and 4.2, were selected in the study. Here,
  $f_{f}$ is the cylinder forcing frequency and
  $f_{0}$ is the vortex shedding frequency past a stationary cylinder with no filament, which for
  $Re_{D} = 150$ is 0.25 Hz as measured using a hot-film anemometer.
A schematic of the problem and the experimental set-up is shown in figure 1. In the present work, the Strouhal number based on cylinder diameter is defined as  $St_{D} = f_{f}D/U_\infty$. The Strouhal number based on filament tip amplitude is defined as
  $St_{A} = f_{f}A/U_\infty$, where
  $A$ is the peak-to-peak amplitude of the filament tip. Since the filament tip amplitude is an output of the system, results in the present study are presented in terms of the cylinder forcing parameters.
2.2. Flow visualizations and hot-film measurements
Flow visualization was done in the present study using the laser-induced fluorescence technique using rhodamine-B as the dye. The dye was contained in a reservoir that could be pressurized externally using a hand pump. The dye was injected into the test section using two thin stainless-steel tubes, 0.9 mm in diameter, placed  ${\sim }10D$ upstream of the cylinder and symmetrically around the cylinder centreline. The illumination for flow visualization was provided using a 3 W continuous laser from the side of the test section, and images were recorded from above the test section using a digital single-lens reflex camera at 60 frames per second (see figure 1b). Images were obtained over a domain size of
  ${\sim }17D$ along the streamwise direction and
  $10D$ along the transverse direction.
Hot-film data were acquired at several streamwise locations,  $X/L = 1$ to 5, in the wake using a Dantec Dynamics single film probe (55R11) connected to a miniature constant-temperature anemometer (54T42 mini-CTA) module. During the experiments, the probe was placed at a transverse location of
  $Y/L = 1$ in the wake, in order to measure the frequency associated with the convecting vortices. Data were acquired at a sampling rate of 100 samples per second for 60 s using a National Instruments (NI) PCI-6255 data acquisition card. This corresponded to data being acquired over 6 cycles and 63 cycles of the cylinder oscillation in the case of the lowest and the highest cylinder forcing frequencies considered in the present study. The fast Fourier transform of the time series signal gives the amplitude spectrum in the frequency domain, which provides an indication of the dominant frequencies in the flow.
2.3. Particle image velocimetry technique and analysis
The experimental set-ups for flow visualization and two-dimensional PIV were similar, as shown in figure 1(b). However, the illumination for PIV is provided using a TSI Evergreen Nd:YAG double-pulsed laser from the side of the tunnel at the midspan of the cylinder–filament system. A laser light sheet of  $\sim$1 mm thickness was realized using light-sheet optics. The flow was seeded with silver-coated hollow glass spheres of diameter 10
  $\mathrm {\mu }$m. An 8 megapixel Powerview plus charge-coupled device (CCD) camera with a 28 mm Nikkor lens captured 400 PIV realizations at an acquisition rate of 3.65 Hz, resulting in a total acquisition time of
  $\sim$110 s. This corresponded to data being acquired over 11 cycles and 116 cycles of the cylinder oscillation in the case of the lowest and the highest cylinder forcing frequencies selected in the present study. Time-averaged velocity and vorticity field information were obtained by averaging data over these 400 PIV realizations. The camera and laser were synchronized using a TSI 610036 laser pulse synchronizer. The size of the captured images was 3312 pixels
  $\times$ 2488 pixels, corresponding to a physical area of 18 cm
  $\times$ 12.5 cm. The data were processed using a correlation window size of 32 pixels
  $\times$ 32 pixels with 50 % overlap using PIVlab, which resulted in a spatial resolution of 0.864 mm. The overall uncertainty in velocity was estimated to be approximately 1 % of the maximum streamwise velocity. This resulted in a maximum uncertainty of approximately 1.1 % and 1.2 % in the spanwise vorticity and circulation measured in the study. The uncertainty in kinetic energy was found to be approximately 2 %.
Since the motion of the cylinder–filament system was periodic, the time evolution of vortex shedding in the wake was studied using phase-averaged PIV by acquiring data at discrete angular positions of the cylinder during its oscillation. It was therefore necessary to track the motion of the cylinder in real time. However, since the cylinder was directly coupled to the motor, it was sufficient to obtain the output from the built-in encoder within the motor. The encoder signal from the motor was obtained through an ethernet port connected to a computer at a sampling rate of 1000 samples per second. A LabVIEW program was used to read and display the encoder signal. A digital pulse was generated at specified angular positions of the encoder signal (with a tolerance of  $\pm 0.05^{\circ }$), which corresponded to discrete angular positions of the cylinder during its oscillation. This digital pulse was generated using the counter output available in the NI PCI-6255 data acquisition card. The digital pulse was then provided as an external trigger to the TSI 610036 laser pulse synchronizer so that data could be captured at specified phases of the cylinder–filament system during its oscillation. Data were acquired at eight discrete phases of each oscillation cycle. A total of 100 PIV realizations were obtained and averaged over each phase.
Vortex properties such as peak vorticity, circulation, vortex core radius, convection velocity and spatial arrangement of the vortices were estimated from phase-averaged PIV data. Here, the spanwise vorticity field was obtained from the phase-averaged velocity field information by using the built-in function available in MATLAB. A vortex was identified as being ‘shed’ in the wake when there was no more vorticity feeding into it from the shear layers riding along the cylinder–filament surface. The vortices in the wake were found to be coherent and discrete in the present study. Therefore, the vortex centre was identified as the location corresponding to peak vorticity,  $\omega _{z,peak}$, within a region of concentrated vorticity, along the lines of Bohl & Koochesfahani (Reference Bohl and Koochesfahani2009). The circulation,
  $\varGamma$, of a vortex is obtained by evaluating the area integral of vorticity over this region. A cutoff vorticity magnitude of 1.3 s
 $^{-1}$ was used while estimating the circulation, in order to ensure that the vorticity within the connecting braids (thin layer of vorticity that connected vortices of alternate sign) did not enter this region. The deviation in the magnitude of the circulation was found to be within 5 % with a 5 % change in the cutoff vorticity.
The radius of gyration of the vorticity field is one way of defining the vortex radius when the vorticity distribution within a vortex deviates from the Gaussian distribution, is not symmetric or is not fully formed. The radius of gyration,  $r$, of the vorticity field can be defined as
 \begin{equation} r =\sqrt{ \frac{\displaystyle \iint r_{c}^2\omega_{z}\,\textrm{d}\kern0.06em x\,\textrm{d}y} {\displaystyle \iint\omega_{z}\,\textrm{d}\kern0.06em x\,\textrm{d}y}}, \end{equation}
where  $r_{c}$ is the vortex core radius and
  $\omega _{z}$ is the spanwise vorticity field. The definition of the vortex spacing parameters used in the study is illustrated in figure 2. This figure shows the phase-averaged vorticity field in the flow past a cylinder–filament system. Here, the white contour levels correspond to clockwise (CW) vortices, whereas the black contour levels correspond to anticlockwise (ACW) vortices. In this case, the vortices are arranged in a reverse vortex configuration, with the ACW vortices located above the CW vortices. Here, ‘
 $a$’ is the streamwise separation between the vortices, whereas ‘
 $b$’ is the transverse separation between the vortices. From the definition for
  $b$ presented in figure 2,
  $b > 0$ when ACW vortices are located above CW vortices, as observed in the case of a reverse Kármán vortex street, and
  $b < 0$ when CW vortices are located above ACW vortices, as observed in the case of a Kármán vortex street.

Figure 2. Vortex spacing parameters defined using vorticity field from PIV. Vorticity field is normalized by  $U_{\infty}/(D+L)$.
3. Estimation of streamwise force and power
The instantaneous streamwise force acting on a body is estimated by applying the integral momentum equation to a control volume enclosing the body. The conventional method of estimating the time-averaged streamwise force acting on a body from two-dimensional PIV measurements is to calculate the momentum flux across a control volume enclosing the body. In addition to the momentum flux due to mean velocity, the contribution to the streamwise force from the velocity fluctuations arising due to vortex shedding in the wake have to be considered. However, this formulation does not account for the pressure variation in the wake. Bohl & Koochesfahani (Reference Bohl and Koochesfahani2009) estimated the pressure variation in the wake from the  $Y$-component of the Navier–Stokes equation. In addition, the pressure difference along the boundary of the control volume was estimated from Bernoulli's equation. In their problem, the mean transverse velocity was found to be negligible. However, in the present study, the streamwise force is estimated at
  $X/L = 7$, corresponding to the fully developed region in the wake, where the contribution of the transverse velocity to the streamwise force cannot be neglected, particularly at higher
  $FR$, where an asymmetric vortex street is observed. Therefore, in the present study, a modified formulation for estimating the streamwise force acting on an oscillating body is proposed, applicable even in a wake where an asymmetric vortex street is observed.
A schematic of the control volume is presented in figure 3. Ideally, the upper and lower boundaries of the control volume should be chosen such that: (1) pressure is constant and equal to the free-stream pressure,  $P_{\infty }$, all along the boundary; and (2) there is no mass flux across the boundary. However, in the measurement domain covered in the present study (
 $Y/L = \pm 2.75$), these assumptions do not hold true.

Figure 3. Schematic of the control volume.
It was observed that the streamwise velocity along the upper and lower boundaries of the control volume,  $\overline {U}_{3}/U_{\infty }$, varied between 1 and 0.96 at different
  $FR$. This resulted in
  $\overline {P}_{3}$ being different from
  $P_{\infty }$ along the upper and lower boundaries of the control volume. This difference in pressure along the boundary was estimated from Bernoulli's equation. The pressure variation in the wake can be estimated from the
  $Y$-component of the Navier–Stokes equation, provided the streamwise gradient of Reynolds stress and the product of the mean streamwise and transverse velocities is negligible. In the present study, the contribution of these terms to the net streamwise force was found to be
  $O(10^{-4})$ and
  $O(10^{-5})$, respectively, and hence was neglected in the analysis. The pressure variation in the wake can then be expressed as
 \begin{equation} \overline{P}_{2}=P_{\infty}+\tfrac{1}{2}\rho(U_{\infty}^2- \overline{U}_{4}^2) -\rho \overline{V}_{2}^2-\rho v_{2,rms}^2. \end{equation}
 The contribution to the streamwise force arising from Bernoulli's condition imposed on the boundary of the control volume was found to be significant. A body undergoing rotational or translational motion in a fluid can introduce a mass flux across the upper and lower boundaries of the control volume. Therefore, in the present analysis, in addition to the  $X$-momentum flux due to the mass flux in the streamwise direction (across sections 1 and 2 of the control volume; see term 1 of (3.2)), the
  $X$-momentum flux due to the mass flux in the transverse direction (across sections 3 and 4 of the control volume; see term 6 of (3.2)) is considered. However, in the present study, the latter term contributes only 1 % to 3 % of the net streamwise force. The contribution of the shear stress along sections 3 and 4 of the control volume to the streamwise force was found to be
  $O(10^{-6})$ and hence was neglected in the analysis. Modified expressions for the time-averaged streamwise force coefficient,
  ${\overline {C}_{F}}$, and the instantaneous streamwise force coefficient,
  $C_{F}$, can now be written as
 \begin{align} {
\overline{C}_{F}} &=
\frac{2}{D+L}\int_{{-}h}^{{+}h} \left( \underbrace{\frac{\overline{U}_{2}}{U_{\infty}}
\left(\frac{\overline{U}_{2}}{U_{\infty}}-1\right)}_\text{term
1}
+\underbrace{\left(\frac{u_{2,rms}}{U_{\infty}}\right)^2}_\text{term 2}
-\underbrace{\left(\frac{v_{2,rms}}{U_{\infty}}\right)^2}_\text{term 3} - \underbrace{\left(\frac{\overline{V}_{2}}{U_{\infty}}\right)^2}_\text{term
4} \right)\,\textrm{d}Y \nonumber\\ &\quad +
\underbrace{\frac{2h}{D+L}
\left(1-\frac{\overline{U}_{4}^2}{U_{\infty}^2}\right)}_\text{term
5} +\frac{2}{D+L}\int_{0}^{l} \underbrace{\frac{\overline{V}_{3}}{U_{\infty}}
\left(\frac{\overline{U}_{3}}{U_{\infty}}-1\right)}_\text{term
6a} \,\textrm{d}\chi \nonumber\\
&\quad-\frac{2}{D+L}\int_{0}^{l} \underbrace{\frac{\overline{V}_{4}}{U_{\infty}}
\left(\frac{\overline{U}_{4}}{U_{\infty}}-1\right)}_\text{term
6b} \,\textrm{d}\chi, \end{align}
\begin{align} {
\overline{C}_{F}} &=
\frac{2}{D+L}\int_{{-}h}^{{+}h} \left( \underbrace{\frac{\overline{U}_{2}}{U_{\infty}}
\left(\frac{\overline{U}_{2}}{U_{\infty}}-1\right)}_\text{term
1}
+\underbrace{\left(\frac{u_{2,rms}}{U_{\infty}}\right)^2}_\text{term 2}
-\underbrace{\left(\frac{v_{2,rms}}{U_{\infty}}\right)^2}_\text{term 3} - \underbrace{\left(\frac{\overline{V}_{2}}{U_{\infty}}\right)^2}_\text{term
4} \right)\,\textrm{d}Y \nonumber\\ &\quad +
\underbrace{\frac{2h}{D+L}
\left(1-\frac{\overline{U}_{4}^2}{U_{\infty}^2}\right)}_\text{term
5} +\frac{2}{D+L}\int_{0}^{l} \underbrace{\frac{\overline{V}_{3}}{U_{\infty}}
\left(\frac{\overline{U}_{3}}{U_{\infty}}-1\right)}_\text{term
6a} \,\textrm{d}\chi \nonumber\\
&\quad-\frac{2}{D+L}\int_{0}^{l} \underbrace{\frac{\overline{V}_{4}}{U_{\infty}}
\left(\frac{\overline{U}_{4}}{U_{\infty}}-1\right)}_\text{term
6b} \,\textrm{d}\chi, \end{align}
and
 \begin{align} C_{F} &= \frac{2}{D+L} \underbrace{\frac{\partial}{\partial t} \int_{{-}h}^{{+}h} \int_0^l\frac{U}{U_{\infty}^2}\,\textrm{d}\chi\,\textrm{d}Y}_\text{unsteady term} +\frac{2}{D+L}\int_{{-}h}^{{+}h}\left( \underbrace{\frac{U_{2}}{U_{\infty}} \left(\frac{U_{2}}{U_{\infty}}-1\right)}_\text{term 1} -\underbrace{\left(\frac{V_{2}}{U_{\infty}}\right)^2}_\text{term 4} \right)\,\textrm{d}Y \nonumber\\ &\quad + \underbrace{\frac{2h}{D+L} \left(1-\frac{U_{4}^2}{U_{\infty}^2}\right)}_\text{term 5} +\frac{2}{D+L}\int_{0}^{l} \underbrace{\frac{V_{3}}{U_{\infty}} \left(\frac{U_{3}}{U_{\infty}}-1\right)}_\text{term 6a}\,\textrm{d}\chi \nonumber\\ &\quad -\frac{2}{D+L}\int_{0}^{l} \underbrace{\frac{V_{4}}{U_{\infty}} \left(\frac{U_{4}}{U_{\infty}}-1\right)}_\text{term 6b}\,\textrm{d}\chi, \end{align}
where  $\chi = X+(L+D)$.
In the present work, the quantities with an overbar indicate time-averaged values and those without an overbar indicate instantaneous values. For example,  $\overline {U}_{2}$ is the time-averaged streamwise velocity at section 2 and
  $U_{2}$ represents the instantaneous streamwise velocity at section 2. Similarly,
  $\overline {V}_{2}$ is the time-averaged transverse velocity at section 2 and
  $V_{2}$ represents the instantaneous transverse velocity at section 2. The root mean square values of the velocities are represented as
  $u_{2,rms}$ and
  $v_{2,rms}$ at section 2, for example.
In (3.2) and (3.3), a negative  $C_{F}$ indicates drag and a positive
  $C_{F}$ indicates thrust. Term 1 is the
  $X$-momentum flux due to the mass flux across sections 1 and 2. Terms 2 and 3 are the velocity fluctuations arising from vortex shedding in the wake. Term 4 is the variation in transverse velocity in the wake. Term 5 is the variation in streamwise velocity,
  $U_{4}$, along the lower boundary of the control volume. Terms 6a and 6b are the
  $X$-momentum flux due to the mass flux across sections 3 and 4. The instantaneous streamwise force coefficient was estimated from phase-averaged PIV data. The unsteady term in (3.3) is the temporal variation of the streamwise momentum content within the control volume. Volume integration of the streamwise momentum of the fluid over the entire control volume gives the net momentum content at a particular time instant. Differentiation of the net momentum content (within the control volume) at two closely spaced time intervals of the oscillation cycle gives the unsteady term in (3.3).
An energy balance applied to the control volume gives information about the mechanical power consumed or extracted from the control volume. In this case, in addition to the unsteady evolution of energy content in the control volume and the  $X$-kinetic energy flux due to the mass flux across sections 1 and 2 as well as sections 3 and 4 of the control volume, the rate of work done by the pressure forces on the control surface needs to be estimated. The rate of pressure work done can be expressed in terms of the pressure distribution on the control surface. The mechanical power coefficient,
  $C_{P}$, can now be written as
 \begin{align} -C_{P} &= \frac{1}{D+L} \underbrace{\frac{\partial}{\partial t} \int_{{-}h}^{{+}h} \int_{0}^{l} \left(\frac{U^2+V^2}{U_{\infty}^3}\right)}_\text{unsteady term} \,\textrm{d}\chi\,\textrm{d}Y \nonumber\\ &\quad +\frac{1}{D+L}\int_{{-}h}^{{+}h} \underbrace{\left[\left(\frac{{U_{2}}^2+{V_{2}}^2}{U_{\infty}^2}\right) \frac{U_{2}}{U_{\infty}}-1\right]}_\text{term a}\,\textrm{d}Y \nonumber\\ &\quad +\frac{1}{D+L}\int_{0}^{l} \underbrace{\left(\frac{{U}^2_{3}+{V}^2_{3}}{U_{\infty}^2}\right) \left(\frac{V_{3}}{U_{\infty}}\right)}_\text{term b(i)}\,\textrm{d}\chi -\frac{1}{D+L}\int_{0}^{l} \underbrace{\left(\frac{{U}^2_{4}+{V}^2_{4}}{U_{\infty}^2}\right) \left(\frac{V_{4}}{U_{\infty}}\right)}_\text{term b(ii)}\,\textrm{d}\chi \nonumber\\ &\quad -\frac{2}{D+L}\int_{{-}h}^{h} \underbrace{\frac{V_{2}^2U_{2}}{U_{\infty}^3}}_\text{term c}\,\textrm{d}Y -\frac{1}{D+L} \underbrace{\left(\frac{{U}^2_{4}}{U_{\infty}^2}-1\right) \int_{{-}h}^{h}\left(\frac{U_{2}}{U_{\infty}}\right)}_\text{term d} \,\textrm{d}Y\nonumber\\ &\quad +\frac{2}{\rho_{w}U_{\infty}^3(D+L)} \underbrace{\frac{\textrm{d}}{\textrm{d}t}\left(KE_{C}+KE_{F}\right)}_\text{term e}. \end{align}
 The elastic energy of the filament has been neglected in this derivation. A negative  $C_{P}$ indicates that power is consumed by the control volume and a positive
  $C_{P}$ indicates that power can be extracted from the control volume. The unsteady term in (3.4) is the temporal variation of energy content within the control volume. Term a is the
  $X$-kinetic energy flux due to the mass flux across sections 1 and 2. Terms b(i) and b(ii) are the
  $X$-kinetic energy flux due to the mass flux across sections 3 and 4 of the control volume. Terms c and d are associated with the rate of pressure work done. Term e is the temporal variation of kinetic energy of the cylinder and filament.
The kinetic energy of the cylinder per unit span,  $KE_{C}$, is defined as
 \begin{equation} KE_{C} = \frac{I_{c}\dot{\theta}^2}{2}, \end{equation}
where  $I_{c}$ is the moment of inertia of the cylinder per unit span and
  $\dot {\theta }$ is the angular velocity of the cylinder.
The kinetic energy of the filament,  $KE_{F}$, was estimated by dividing the filament into four equal segments along its length. (The difference in kinetic energy between the estimated numerical values are within 1 % for four, six or eight segments.) The filament velocity was obtained by measuring the displacement of the centre of mass of each filament segment. The summation of the kinetic energy of each segment gives the net kinetic energy of the whole filament at a particular instant. The kinetic energy of the filament per unit span,
  $KE_{F}$, is thus defined as
 \begin{equation} KE_{F} = \frac{1}{2} \frac{m_{f}}{4} \sum_{segments} V_F^2, \end{equation}
where  $m_{f}$ is the mass per unit span of the filament,
  $V_F$ is the velocity of the centre of mass of each segment of the filament, and the summation is done over the filament segments.
In the present study, the streamwise momentum flux,  $MF$, and the streamwise energy flux,
  $EF$, are defined as
 \begin{equation} MF = \frac{2}{D+L}\int_{{-}h}^{{+}h}{\frac{\overline{U}_2}{U_{\infty}} \left(\frac{\overline{U}_2}{U_{\infty}}-1\right)}\,\textrm{d}Y, \end{equation}
and
 \begin{equation} EF = \frac{1}{D+L}\int_{{-}h}^{{+}h} \left[ \left(\frac{{\overline{U}_{2}}^2+{\overline{V}_{2}}^2}{U_{\infty}^2}\right) \frac{\overline{U}_{2}}{U_{\infty}}-1\right]\,\textrm{d}Y .\end{equation}
The streamwise momentum flux gives an indication of the time-averaged streamwise force acting on the body. The energy flux is basically the useful energy imparted by the cylinder–filament system to the flow. The momentum content,  $M$, and energy content,
  $E$, within the control volume are defined as
 \begin{equation} M = \frac{2}{(D+L)^2}\int_{{-}h}^{{+}h}\int_{0}^{l} \frac{{U}}{U_{\infty}}\,\textrm{d}\chi \,\textrm{d}Y, \end{equation}
and
 \begin{equation} E = \frac{1}{(D+L)^2}\int_{{-}h}^{{+}h}\int_{0}^{l} \left(\frac{{U}^2+{V}^2}{U_{\infty}^2}\right)\,\textrm{d} \chi \,\textrm{d}Y . \end{equation}
4. Results and discussion
In the discussion of the results, the time instant  $T = 0$ corresponds to the instant when the cylinder is at its extreme position when it has completed its clockwise motion, as seen from the top (figure 1a). Similarly, the time instant
  $T = 0.5$ corresponds to the instant when the cylinder is at its extreme position when it has completed its anticlockwise motion. All times are non-dimensionalized with the cylinder oscillation time period. In the present work, ‘wake’ is defined as the region of disturbed fluid downstream of the filament tip.
4.1. Rotationally oscillating cylinder with and without an attached filament
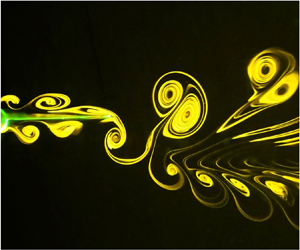
The effect of an attached filament (filament 1, which is the least flexible filament) on the wake structure of a rotationally oscillating cylinder is shown in figure 4 (see supplementary movie 2). In the flow past a rotationally oscillating cylinder, the vortices shedding from the cylinder surface convect downstream in the wake as a Kármán vortex street. Here, the CW vortices are arranged above the ACW vortices in the wake (figure 4a). However, in the case of a rotationally oscillating cylinder with a filament, in addition to the vortices shedding from the cylinder surface, there are vortices generated by the filament during its excursion in the flow. Here, the CW and ACW vortices shedding from the cylinder surface (subsequently referred to as ‘cylinder vortices’) ride along the filament length, interact with the vortices generated at the filament tip (subsequently referred to as ‘filament vortices’) and shed in the wake as a reverse Kármán vortex street (figure 4b). In the present study, it is observed that the cylinder and filament vortices interact constructively, wherein vortices of similar sign merge to form a stronger vortex of the same sign.

Figure 4. Wake structure at  $\theta _{0} = 5^{\circ }$ and
  $FR = 1.7$ in the case of a rotationally oscillating cylinder with and without filament 1 (least flexible filament of length
  $L/D = 5$). (a) Rotationally oscillating cylinder. (b) Rotationally oscillating cylinder with filament.
To understand the mechanisms leading to the formation of a reverse Kármán vortex street, it is necessary to study the time evolution of vortex formation and shedding in the wake (figure 4b). Here, there is no phase lag between the angular displacement of the cylinder and filament tip. Therefore, at  $T = 0$, when the cylinder is at its extreme position after it has completed its clockwise motion, the filament tip is at its extreme position after completing its downstroke and is located below the wake centreline. Similarly, at
  $T = 0.5$, when the cylinder is at its extreme position after it has completed its anticlockwise motion, the filament tip is at its extreme position after completing its upstroke and is located above the wake centreline.
At  $T = 0$, the clockwise vortex CW, riding along the upper side of the filament, begins to shed into the wake below the wake centreline. At
  $T = 0.125$, during the filament upstroke, a clockwise vortex, CW
 $_{TIP}$, is generated at the filament tip. By
  $T = 0.5$, CW and CW
 $_{TIP}$ have combined constructively to form a single clockwise vortex, CW1, in the wake. At the same time, the anticlockwise vortex ACW, riding along the lower side of the filament, begins to shed into the wake above the wake centreline. During the filament downstroke, an anticlockwise vortex, ACW
 $_{TIP}$, is generated at the filament tip. By
  $T = 1$, ACW
 $_{TIP}$ has combined constructively with ACW to form a single anticlockwise vortex, ACW1, in the wake. The vortex configuration in the wake is such that ACW1 is located above CW1, resulting in the formation of a reverse Kármán vortex street.
A comparison of the velocity profiles at several locations in the wake in the flow past a rotationally oscillating cylinder with and without an attached filament is presented in figure 5. In the case of a rotationally oscillating cylinder, the time-averaged velocity along the wake centreline is  $\overline {U}_{CL}/U_{\infty } \approx 0.75$ (figures 5a and 6a), indicating a velocity deficit in the wake, consistent with the Kármán vortex street observed in this case (figure 4a). However, in the case of a rotationally oscillating cylinder with an attached filament,
  $\overline {U}_{CL}/U_{\infty }$ varies between 1.6 and 2.1 (figures 5b and 6a), indicating a velocity excess in the wake, consistent with the reverse Kármán vortex street observed in this case (figure 4b).

Figure 5. Streamwise variation of mean velocity profiles at  $\theta _{0} = 5^{\circ }$ and
  $FR = 1.7$ in the case of a rotationally oscillating cylinder with and without filament 1 (least flexible filament of length
  $L/D = 5$). (a) Rotationally oscillating cylinder. (b) Rotationally oscillating cylinder with an attached filament.

Figure 6. Streamwise variations of (a) centreline velocity, (b) momentum flux,  $MF$, and (c) energy flux,
  $EF$, at
  $\theta _{0} = 5^{\circ }$ and
  $FR = 1.7$ in the case of a rotationally oscillating cylinder with and without filament 1 (least flexible filament of length
  $L/D = 5$). The dark grey area shows the cylinder region, whereas the light grey area shows the filament region.
A comparison of the streamwise momentum and energy flux in the case of a rotationally oscillating cylinder with and without an attached filament is shown in figure 6(b,c). In the case of a rotationally oscillating cylinder, the momentum flux,  $MF$ is
  $-0.16$, indicative of drag acting on the cylinder. However, in the case of a rotationally oscillating cylinder with filament,
  $MF$ is 0.2, indicative of thrust acting on the cylinder–filament system. It is seen in figure 6 that the majority of the momentum and energy flux in the wake happens at the filament tip, which suggests that filament oscillation is entirely responsible for thrust generation in the cylinder wake.
In addition, it is useful to demarcate the filament into an ‘active’ and ‘passive’ part to identify the portion of the filament that is responsible for thrust generation (similar to Shinde & Arakeri (Reference Shinde and Arakeri2018)). The portion of the filament that accelerates the surrounding fluid and adds momentum and energy in the wake is subsequently referred to as an ‘active portion’ of the filament, which, in this case, lies between  $X/D \sim -0.4$ and
  $0$, towards the filament tip (figure 6b,c). The remaining portion of the filament, which does not contribute to momentum or energy addition, is subsequently referred to as the ‘passive portion’ of the filament, which, in this case, lies between
  $X/D = -5$ and
  $-0.4$, towards the cylinder. In the passive region of the filament, the energy flux for an oscillating cylinder with and without a filament is comparable (figure 6c),
  $EF \sim 0.01$ to
  $-0.1$.
4.1.1. Unsteady thrust generation
To understand the mechanisms resulting in thrust generation in the flow past a cylinder–filament system, it is necessary to study the unsteady evolution of the velocity field in the wake and to identify the time instants of cylinder oscillation during which unsteady momentum and energy transfer happens in the wake.
During its oscillation, the filament draws in and accelerates the surrounding fluid from its sides and pushes it downstream in the wake as vortices, arranged in a reverse vortex configuration (figure 7). These vortices are then convected downstream in the wake, both by the free-stream flow and by the velocity induced by the cylinder–filament oscillation, resulting in the formation of a reverse Kármán vortex street. The spatial arrangement of vortices in a reverse Kármán vortex street is such that ACW vortices are located above CW vortices. Consequently, this results in an acceleration of the fluid between the vortices, leading to a velocity excess in the wake, thereby resulting in thrust generation. However, the formation of a reverse Kármán vortex street does not necessarily indicate thrust generation. Thrust is generated only when the excess momentum in the wake is sufficient to overcome the pressure deficit in the wake (Godoy-Diana et al. Reference Godoy-Diana, Aider and Wesfreid2008; Bohl & Koochesfahani Reference Bohl and Koochesfahani2009; Das et al. Reference Das, Shukla and Govardhan2016; Andersen et al. Reference Andersen, Bohr, Schnipper and Walther2017; Floryan et al. Reference Floryan, Van Buren and Smits2020).

Figure 7. Evolution of velocity field at certain time instants of oscillation in the flow past a cylinder–filament system with filament 1 (least flexible filament of length  $L/D = 5$) at
  $\theta _{0} = 5^{\circ }$ and
  $FR = 1.7$.
The mechanism of flow and thrust generation observed in the present work is quite similar and relevant to a broad range of animal locomotion observed in nature in flapping flight/fish locomotion and also in the flow past rigid/flexible pitching foils (Shinde & Arakeri Reference Shinde and Arakeri2018). The main difference between the published work and the present work is that the forebody is a cylinder, a bluff body, in the current study, which does not contribute to thrust generation. Filament oscillation is entirely responsible for thrust generation in the present work.
The unsteady evolution of velocity field (which is related to the streamwise momentum) and energy in the wake is presented in figure 8(b,c). From figure 8(b), it is clearly seen that there are pockets of accelerated fluid in the wake, in the region between ACW1 and CW1 vortices, which contributes towards thrust generation in the present case.

Figure 8. Evolution of (a) vorticity field, (b) streamwise velocity and (c) kinetic energy over one complete oscillation cycle in the flow past a cylinder–filament system with filament 1 (least flexible filament of length  $L/D = 5$) at
  $\theta _{0} = 5^{\circ }$ and
  $FR = 1.7$. Vorticity field is normalized by
  $U_{\infty}/(D+L)$, streamwise velocity is normalized by
  $U_{\infty }$ and kinetic energy is normalized by
  $U_{\infty }^2$.
Further, it is seen from figures 8(b,c) and 9(a,c) that maximum momentum and energy transfer in the wake takes place at the instants ( $T = 0.25$, 0.375 and 0.675) when maximum fluid entrainment takes place within the growing filament vortex. This happens closer to the instants when the filament tip velocity (
 $V_{FT}$) is maximum. It is now clear that the flow generation and momentum addition to the fluid is highly unsteady, as seen in figure 8. The instantaneous force acting on the cylinder–filament system (figure 9b) therefore comprises an unsteady term in addition to the momentum flux and the contributions from the streamwise and transverse velocity fluctuations in the wake. The unsteady term is the temporal variation of the momentum content within the control volume, whereas the flux term is the streamwise momentum flux leaving section 2 of the control volume presented in figure 3. The unsteady force shows a time-periodic variation (with a mean value of
  $\overline {C}_{F,unsteady} = 0.03$), whereas the flux term is almost constant with time (with a mean value of
  $\overline {C}_{F,flux} = 0.2$). Maximum force is generated at time instants
  $T = 0.5$ and 0.75, when the cylinder and filament vortices have combined constructively and shed in the wake.

Figure 9. Evolution of (a) momentum content within the control volume,  $M$, (b) instantaneous force coefficient,
  $C_{F}$, the unsteady term and term 1 in (3.3), (c) energy content within the control volume,
  $E$, and (d) power coefficient,
  $C_{P}$, the unsteady term and term a in (3.4) over one complete oscillation cycle in the flow past a cylinder–filament system with filament 1 (least flexible filament of length
  $L/D = 5$) at
  $\theta _{0} = 5^{\circ }$ and
  $FR = 1.7$. Here
  $\overline {C}_{F,net}$ is the instantaneous force coefficient averaged over an oscillation cycle; and
  $\overline {C}_{P,net}$ is the instantaneous power coefficient averaged over an oscillation cycle.
The instantaneous power coefficient (figure 9d) has similar contributions from an unsteady energy term and from an energy flux across the control volume. The unsteady term shows a time-periodic variation (with a mean value  $\sim -0.2$), whereas the flux term is almost constant with time (with a mean value
  $\sim 0.42$). Maximum power is consumed by the control volume at the same time instants when maximum force is generated, that is, at
  $T = 0.5$ and 0.75 when the vortices have shed in the wake. At certain time instants,
  $T = 0.25$, 0.625 and 0.875 (corresponding to the instants when maximum fluid entrainment takes place within the growing filament vortices), maximum power can be extracted from the control volume.
4.2. Effect of cylinder forcing parameters
In this section, the effect of cylinder forcing parameters on the cylinder–filament system is examined. The cylinder is forced to oscillate at  $\theta _{0} = 5^{\circ }$,
  $10^{\circ }$ and
  $15^{\circ }$ and different
  $FR$. Filament 1 of length
  $L/D = 2$ is used in the study. These cylinder forcing parameters and filament length were chosen since significant changes in the wake structure were observed at these conditions.
4.2.1. Wake structure and vortex shedding frequency
Figure 10 shows the effect of cylinder forcing frequency on the wake structure of a cylinder–filament system at  $\theta _{0} = 5^{\circ }$ as obtained through flow visualization. The data presented are at a time instant
  $T = 0.25$ of the cylinder oscillation.

Figure 10. Effect of cylinder forcing frequency on the wake structure of a cylinder–filament system with filament 1 (least flexible filament of length  $L/D = 2$) at an oscillation amplitude
  $\theta _{0} = 5^{\circ }$.
At  $FR = 0.8$, a regular Kármán vortex street is observed in the wake. On increasing the cylinder forcing frequency to
  $FR = 1.3$, it is observed that the filament vortices inhibit the interaction and shedding of the cylinder vortices at the filament tip, thereby delaying the formation of a Kármán vortex street in the wake. In this case, the vortices are not shed as separate and discrete vortices in the wake. Instead, they are shed as a chain of vortices on either side of the wake centreline. These vortices interact further downstream in the wake and a regular Kármán vortex street is observed beyond
  $X/L = 3$. This mode of vortex shedding has been observed previously in the flow past a stationary cylinder with an oscillating rigid splitter plate (Wu & Shu Reference Wu and Shu2011; Sudhakar & Vengadesan Reference Sudhakar and Vengadesan2012). At
  $FR = 1.7$ and 2.1, the cylinder and filament vortices interact constructively to form a Kármán vortex street in the wake. At
  $FR = 3$ and 3.4, the cylinder and filament vortices combine constructively to form an aligned and reverse Kármán vortex street, respectively. In the case of
  $FR = 3.4$, the wake becomes asymmetric at
  $X/L \sim 3$. At this location, the ACW vortex in the wake gets stretched and splits into two parts. Each of these split vortices are then arranged above and below the CW vortex, resulting in wake asymmetry. The vortex splitting of the ACW vortex in the wake at
  $X/L \sim 3$ can be attributed to the increased strain rate within the vortex at this location. At higher cylinder forcing frequencies, the wake becomes asymmetric and chaotic.
The effect of cylinder forcing frequency on the time-averaged vorticity field is shown in figure 11. At all  $FR$, vorticity of opposite sign is observed on either side of the cylinder–filament surface. This is associated with the vortices shedding from the cylinder surface (cylinder vortices). In all the cases, the vorticity magnitude associated with the cylinder vortices is greater than that observed in the wake. The reduction in vorticity magnitude in the wake may be attributed to the interaction of opposite-signed vorticity during the formation and shedding of vortices in the wake. Beyond
  $FR = 0.8$, there is a region immediately downstream of the filament tip where vorticity is of opposite sign to that associated with vortex shedding from the cylinder surface. This corresponds to the vorticity generated by the filament vortices. Till
  $FR = 1.7$, vorticity shedding along the cylinder–filament surface remains attached to the two streaks of vorticity observed in the wake. This indicates that the cylinder vortices are shed in the wake in a Kármán vortex configuration in these cases.

Figure 11. Effect of cylinder forcing frequency on the time-averaged vorticity field in the flow past a cylinder–filament system with filament 1 (least flexible filament of length  $L/D = 2$) at an oscillation amplitude
  $\theta _{0} = 5^{\circ }$. Vorticity field is normalized by
  $U_{\infty}/(D+L)$. Blue contour level indicates vorticity associated with CW vortices and red contour level indicates vorticity associated with ACW vortices. The contour levels have been scaled to highlight the vorticity level in the wake.
However, from  $FR = 2.1$ onwards, vorticity shedding along the cylinder–filament surface is not attached to that in the wake. This indicates that the cylinder vortices are shed in an aligned or reverse vortex configuration in the region immediately downstream of the filament tip. For
  $FR = 2.1$ and 3, there is a region in the wake immediately downstream of the filament tip where the time-averaged vorticity is almost zero, suggesting that vortices of similar strength and opposite vorticity convect along the same transverse location in the wake in such a way that their net vorticity cancels out. This is consistent with the observations from phase-averaged PIV data (see figure 21b,g later), where it is seen that the CW and ACW vortices shedding from the filament tip have similar circulation and are located along the same transverse location in the wake. In the case of
  $FR = 2.1$, beyond
  $X/L \sim 1$, there are two well-defined streaks of vorticity observed in the wake, consistent with the shedding of a regular Kármán vortex street. The
  $FR = 3$ case indicates an aligned vortex street till
  $X/L \sim 3$. At
  $FR = 3.4$, the vorticity in the wake is of opposite sense to the vorticity shedding from the cylinder–filament surface, consistent with the reverse Kármán vortex street observed in this case.
Figure 12(a) maps out the wake structures observed in the flow past a cylinder–filament system at different cylinder forcing parameters. Figure 12(b) shows the wake map in the corresponding Strouhal number–amplitude ( $St_{D}$–
 $A/D$) domain. With an increase in
  $\theta _{0}$ and
  $A/D$, the transition in the wake structure from a Kármán vortex street to a reverse Kármán vortex street and subsequently to an asymmetric vortex street happens at lower values of
  $FR$ and
  $St_{D}$, similar to the observations made in the wakes of flapping foils (Godoy-Diana et al. Reference Godoy-Diana, Aider and Wesfreid2008; Schnipper, Andersen & Bohr Reference Schnipper, Andersen and Bohr2009). The solid black and green lines in figure 12(b) indicate the amplitude-based Strouhal number,
  $St_{A}$, at which this transition takes place. From figure 12(b), it is seen that a reverse Kármán vortex street is observed in the present study at a slightly higher value of
  $St_{A} \sim 0.25$ to
  $0.5$ (found in nature in flapping flight and fish propulsion) compared to that observed in the wake of flapping foils (where a reverse Kármán vortex street is observed within a range of
  $St_{A} \sim 0.18\text {--}0.4$). The higher values of
  $St_{A}$ observed in the present study may possibly be attributed to the fact that the filament, being flexible (as opposed to the rigid flapping foil), requires more energy (generated at higher
  $St_{A}$) to induce a transition in the wake structure to a reverse Kármán vortex street.

Figure 12. (a) Wake map based on cylinder forcing parameters in the flow past a cylinder–filament system with filament 1 (least flexible filament of length,  $L/D = 2$) (b) Wake map in the
  $St_{D}$-
 $A/D$ domain for filaments 1, 2, 3 of
  $L/D = 2$.
Figure 13(a) shows the effect of cylinder forcing parameters on the time-averaged streamwise force acting on the cylinder–filament system. In all cases, a drag reduction is observed when the transverse arrangement of the vortex pair at the filament tip is in an aligned or reverse vortex configuration. At  $\theta _{0} = 5^{\circ }$ and
  $FR = 1.7$, there is a notable increase in drag. Here, the cylinder and filament vortices interact constructively to form stronger vortices, which are arranged in a Kármán vortex configuration in the wake. This results in a greater velocity deficit in the wake, leading to an increase in drag. Drag-to-thrust transition takes place at a higher
  $FR$, when the energy supplied to the fluid by the filament oscillation is sufficient to overcome the pressure reduction in the wake. Figure 13(b) shows the contribution of each term (except the unsteady term) in (3.1) to the net streamwise force. At
  $FR \geq 3$, term 1 overestimates the thrust and the contributions of terms 4 and 5 become important. A similar observation is also made in Bohl & Koochesfahani (Reference Bohl and Koochesfahani2009), where, in their study, term 1 overestimates the thrust produced by the pitching airfoil.

Figure 13. (a) Effect of cylinder forcing parameters on the time-averaged streamwise force acting on the cylinder–filament system with filament 1 (least flexible filament) of length  $L/D = 2$. (b) Contribution of individual terms in (3.2) to the streamwise force at
  $\theta _{0} = 10^{\circ }$. The summation of the individual terms gives the net streamwise force for a particular case. The black dotted line corresponds to zero drag. Here,
  $\overline {C}_{F0} = 0.48$, which is the streamwise force coefficient at
  $FR = 0$.
The frequency content in the wake of a cylinder–filament system at several streamwise locations is shown in figure 14. The wake structure corresponding to each case is also shown in the figure. At  $FR = 0$, in the case of a stationary cylinder with a filament, the vortex shedding frequency ratio
  $FR^* = f_{V}/f_{0} = 0.8$ at all streamwise locations in the wake, where
  $f_{V}$ is the vortex shedding frequency in the wake. When the wake is locked-in to the cylinder forcing frequency,
  $FR^*$ is the same as
  $FR$. However, when there is no lock-in,
  $FR^* = 0.8$, that is, the vortices shed at the same frequency as that behind a stationary cylinder with a filament. At
  $FR = 0.8$, the wake is locked-in at all streamwise locations. At
  $FR = 1.3$, there is no clearly discernible peak in the vortex shedding frequency till
  $X/L = 3$, consistent with the observation from flow visualization that a regular Kármán vortex street is observed only beyond
  $X/L = 3$. At
  $X/L = 3$ and 4,
  $FR^* = 0.8$, which is the same as that behind a stationary cylinder with a filament. At
  $FR = 1.7$ and 2.1, the wake is divided into two regions, where the near wake (
 $X/L < 2$) is locked-in and the far wake (
 $X/L > 2$) is not locked-in to the cylinder forcing frequency. Beyond
  $FR = 3$, the wake is observed to be locked-in at all streamwise locations. The extent of lock-in increases at
  $FR = 3.4$ with the appearance of a reverse Kármán vortex street. For cylinder oscillation amplitudes
  $\theta _{0} =10^{\circ }$ and
  $15^{\circ }$ (not shown here), the wake is found to be locked-in at all streamwise locations for all
  $FR$.
$FR$.

Figure 14. Effect of cylinder forcing frequency on vortex shedding frequency at several streamwise locations in the flow past a cylinder–filament system with filament 1 (least flexible filament of length  $L/D = 2$) at an oscillation amplitude
  $\theta _{0}= 5^{\circ }$.
Significant changes in the wake structure are observed in the flow past a rotationally oscillating cylinder with a filament at different  $FR$, including the shedding of a chain of vortices, as well as a transition from a Kármán vortex street to a reverse Kármán vortex street. These interesting changes in the wake structure will be discussed in detail in the subsequent sections.
4.2.2. Chain of vortices
To understand the mechanisms resulting in the formation of a chain of vortices (in the case of filament 1 of length  $L/D = 2$ at
  $\theta _{0} = 5^{\circ }$ and
  $FR = 1.3$), the time evolution of the vortex formation and shedding process is presented in figure 15 (see supplementary movie 3). Here, the angular displacements of the cylinder and filament tip are in phase with each other. At
  $T = 0$, the cylinder vortices, CW and ACW, are located on either side of the filament. An anticlockwise vortex (ACW
 $_{TIP}$) generated at the filament tip during its downstroke in the previous cycle is also seen. This ACW
 $_{TIP}$ prevents the cylinder vortex, CW
 $^*$, from shedding into the wake at the filament tip. Between
  $T = 0.25$ and 0.75, the presence of opposite-signed vorticity at the filament tip (generated by the filament vortices, CW
 $_{TIP}$ and ACW
 $_{TIP}$) prevents the cylinder vortices ACW and CW from shedding into the wake. The cylinder vortices CW and ACW then convect in the wake as a chain of vortices without interacting till
  $X/L \sim 3$. Beyond
  $X/L = 3$, these vortices interact and a regular Kármán vortex shedding is observed. The filament vortices thereby delay the formation of a Kármán vortex street in the wake to further downstream distances by inhibiting the interaction of the cylinder vortices at the filament tip.

Figure 15. Time evolution of vortex shedding in the flow past a cylinder–filament system with filament 1 (least flexible filament of length  $L/D = 2$) at
  $\theta _{0} = 5^{\circ }$ and
  $FR = 1.3$: (a) flow visualization data and (b) vorticity field. Vorticity field is normalized by
  $U_{\infty }/(D+L)$.
4.2.3. Transition from Kármán vortex street to reverse Kármán vortex street
The time evolution of the vortex shedding process at different  $FR$ showing the transition in the wake structure from a Kármán vortex street to a reverse Kármán vortex street and subsequently to an asymmetric vortex street is shown in figure 16 (see supplementary movie 4). The corresponding velocity field at certain time instants of oscillation is shown in figure 17. The instant at which a vortex pair is shed from the filament tip and its subsequent evolution in the wake determines the resultant wake structure.

Figure 16. Transition in the wake structure from Kármán vortex street to a reverse Kármán vortex street in the flow past a cylinder–filament system with filament 1 (least flexible filament of length  $L/D = 2$) at
  $\theta _{0} = 10^{\circ }$ and (a)
  $FR = 1.3$, (b)
  $FR = 1.7$ and (c)
  $FR = 3$.

Figure 17. Velocity field in the flow past a cylinder–filament system with filament 1 (least flexible filament of length  $L/D = 2$) at
  $\theta _{0} = 10^{\circ }$ and (a)
  $FR=1.3$, (b)
  $FR=1.7$ and (c)
  $FR=3$.
At  $T = 0$, the cylinder vortices, CW and ACW, are located on either side of the filament surface in all three cases (figure 16). In case (a),
  $FR = 1.3$, during the filament upstroke, between
  $T = 0$ and 0.5, the cylinder vortex, CW, sheds in the wake and forms part of the connecting braid between vortices (figure 16a). By
  $T = 0.5$, the filament vortex, CW
 $_{TIP}$, is shed above the wake centreline. Between
  $T = 0.5$ and 1, during the filament downstroke, the cylinder vortex, ACW, sheds in the wake and forms part of the connecting braid between vortices. By
  $T = 1$, the filament vortex, ACW
 $_{TIP}$, is shed below the wake centreline. During filament oscillation, the majority of the fluid entrainment in the growing filament vortex happens between time instants
  $T = 0.375$ and 0.5 (when the filament tip is located above the wake centreline) in the case of CW
 $_{TIP}$, and between
  $T = 0.875$ and 1 (when the filament tip is located below the wake centreline) in the case of ACW
 $_{TIP}$. This corresponds to the time instants of the cylinder oscillation at which the filament tip velocity,
  $V_{FT}$, is maximum
  ${\sim }0.62~\textrm {cm}~\textrm {s}^{-1}$ and
  $0.7~\textrm {cm}~\textrm {s}^{-1}$. This induces CW
 $_{TIP}$ and ACW
 $_{TIP}$ to pinch off from the filament tip and shed in the wake in a Kármán vortex configuration (figures 16a and 17a).
In case (b),  $FR = 1.7$, during the filament upstroke, between
  $T = 0$ and 0.5, CW and CW
 $_{TIP}$ interact constructively and shed below the wake centreline as a single clockwise vortex, CW1. Similarly, during the filament downstroke, between
  $T = 0.5$ and 1, ACW and ACW
 $_{TIP}$ interact constructively and shed above the wake centreline as a single anticlockwise vortex, ACW1. For cases (b) and (c), the majority of the fluid entrainment in the growing filament vortex happens between time instants
  $T = 0$ and 0.25 (when the filament tip is located below the wake centreline) in the case of CW
 $_{TIP}$, and between
  $T = 0.5$ and 0.625 (when the filament tip is located above the wake centreline) in the case of ACW
 $_{TIP}$. This corresponds to the time instants of the cylinder oscillation at which
  $V_{FT}$ is maximum
  ${\sim }1~\textrm {cm}~\textrm {s}^{-1}$ and
  $1.6~\textrm {cm}~\textrm {s}^{-1}$ for cases (b) and (c), respectively. This induces CW
 $_{TIP}$ and ACW
 $_{TIP}$ to shed in the wake in a reverse vortex configuration (figures 16b,c and 17b,c), resulting in a coherent jet, aligned along the wake centreline (figure 18b).

Figure 18. Time-averaged velocity magnitude contours in the flow past a cylinder–filament system with filament 1 (least flexible filament of length  $L/D = 2$) at
  $\theta _{0} = 10^{\circ }$ and different
  $FR$. Velocity magnitude is normalized by
  $U_{\infty }$. (a) Kármán vortex street. (b) Reverse Kármán vortex street. (c) Asymmetric vortex street. (d) P + S vortex street.
In case (c),  $FR = 3$, there is no constructive interaction observed between the cylinder and filament vortices. Here, the vortex pair comprising CW
 $_{TIP}$ and ACW
 $_{TIP}$ has already shed in the wake by
  $T = 0.75$. The cylinder vortices, CW and ACW, form part of the connecting braid between vortices (figure 16c). Additionally, it is noted that between time instants
  $T = 0.25$ and 0.5, due to the induced velocity of the filament motion, CW
 $_{TIP}$ is pushed closer towards ACW
 $^*$ (which was shed during the previous half-cycle), resulting in the formation of a vortex dipole, with an induced velocity,
  $V_{i}$ in the downward direction marked by the arrow in figure 16(c). This leads to the formation of a downward deflected jet (figure 18c). With increase in cylinder forcing frequency beyond
  $FR = 3$, a P + S asymmetric vortex street is formed. In this case, an upward-deflected jet associated with the shedding of a reverse vortex street is observed (figure 18d). In addition, there is a recirculation zone below the wake centreline, which is associated with the shedding of the single vortex, S. The mechanisms resulting in the formation of an asymmetric P + S vortex street will be discussed subsequently in § 4.3.4.
At  $FR > 1.7$,
  $\overline {U}_{CL}/U_{\infty }$ is greater than 1 (figure 19a), indicating thrust generation. At higher forcing frequencies,
  $FR \sim 3$, closer to the filament natural frequency (
 $f_{n1}^*$/4, in the case of filament 1), the filament entrains more fluid into the growing filament vortex over a shorter time period of oscillation. This results in the generation of vortices of increased strength and opposite vorticity (figure 21b), closely spaced together in the wake, leading to the formation of vortex dipoles, thereby triggering wake asymmetry. These vortex dipoles convect away more rapidly in the wake due to its self-induced velocity, in addition to the velocity induced by the cylinder–filament motion and the free-stream velocity. This results in a significant increase in the momentum and energy flux in the wake at
  $FR \geq 3$ (figure 19b,c). Most of this momentum and energy addition to the fluid happens in the ‘active portion’ of the filament, which in this case lies between
  $X/L = -0.3$ and 0.

Figure 19. Effect of forcing frequency on the streamwise variation of (a) centreline velocity, (b) momentum flux,  $MF$, and (c) energy flux,
  $EF$, in the flow past a cylinder–filament system with filament 1 (least flexible filament of length
  $L/D = 2$) at
  $\theta _{0} = 10^{\circ }$.
The unsteady evolution of streamwise force acting on the cylinder–filament system (figure 20) shows a time-periodic variation, whereas the flux term remains almost constant. Maximum force is generated and maximum power is consumed by the control volume at the instants when the filament vortices are shed in the wake. Here, it is seen that the majority of the instantaneous force acting on the cylinder–filament system comes from the unsteady momentum flux within the control volume, indicating that the filament oscillation plays a crucial role in thrust generation. An interesting observation in this case is that, even with the appearance of a reverse Kármán vortex street at  $FR = 1.7$, the value of the instantaneous force averaged over one oscillation cycle is
  $\overline {C}_{F,net} = -0.15$, indicating a drag force acting on the cylinder–filament system (figure 20b). However, with the appearance of an asymmetric vortex street, at
  $FR = 3$, one has
  $\overline {C}_{F,net} = 0.2$, indicating thrust generation (figure 20c). This is consistent with the observations in many recent studies (Godoy-Diana et al. Reference Godoy-Diana, Aider and Wesfreid2008; Bohl & Koochesfahani Reference Bohl and Koochesfahani2009; Das et al. Reference Das, Shukla and Govardhan2016; Andersen et al. Reference Andersen, Bohr, Schnipper and Walther2017) that thrust is generated when the extra momentum flux associated with the reverse Kármán vortex street is sufficient to overcome the pressure reduction in the wake.

Figure 20. Effect of cylinder forcing frequency on (a–c) instantaneous force coefficient,  $C_{F}$, the unsteady term and term 1 in (3.3) and (d–f) power coefficient,
  $C_{P}$, the unsteady term and term a in (3.4) in the flow past a cylinder–filament system with filament 1 (least flexible filament of length
  $L/D = 2$) at
  $\theta _{0} = 10^{\circ }$.
4.2.4. Vortex properties
The strength and transverse arrangement of the vortices in the wake play a crucial role in determining the streamwise force acting on a body. Figure 21 presents the effect of cylinder forcing parameters on the vortex properties at an instant when a vortex is shed from the filament tip. Figure 21 also shows the resultant convection velocity of the vortices and inter-vortex spacing parameters at a streamwise location of  $X/L = 2$, well beyond the filament tip, where a regular vortex street has been established.

Figure 21. Effect of cylinder forcing frequency,  $FR$, on the properties of a vortex at an instant when it is shed at the filament tip: (a) peak vorticity; (b) circulation of the CW (closed symbols) and ACW vortex (open symbols); (c) radius; (d–f) convection velocity of the vortices and inter-vortex spacing parameters at a streamwise location of
  $X/L = 2$ in the wake; and (g) transverse separation of the CW and ACW vortex at an instant when it is shed at the filament tip. The cylinder is forced to oscillate at
  $\theta _{0} = 5^{\circ }$,
  $10^{\circ }$ and
  $15^{\circ }$. Filament 1 (least flexible filament) of length
  $L/D = 2$ is used.
The peak vorticity and circulation of the vortex increase nearly linearly with  $FR$ (figure 21a,b). In the case of
  $\theta _{0} = 5^{\circ }$, the circulations of the CW and ACW vortices (figure 21b) are comparable at all
  $FR$, which indicates that the formation time of these vortices is similar. However, for
  $\theta _{0} = 10^{\circ }$ and
  $15^{\circ }$, with the appearance of an asymmetric P + S vortex street beyond
  $FR \sim 3$, the circulation of the CW vortex exceeds that of the corresponding ACW vortex. This suggests that the CW vortex forms over a longer time period of the cylinder oscillation cycle than the corresponding ACW vortex. In the present study, the asymmetric P + S wake is seen to be deflected upwards. The direction of wake asymmetry is closely related to the initial conditions of the cylinder oscillation. A similar observation was also made in the study by Cleaver, Wang & Gursul (Reference Cleaver, Wang and Gursul2012) in the flow past plunging airfoils. The vortex radius reaches a maximum at
  $FR = 1.3$, beyond which it decreases and almost becomes constant (figure 21c).
The convection velocity,  $U_{C,R}$, increases with
  $FR$ till
  $FR \sim 3$ (figure 21d). With the appearance of an asymmetric wake beyond
  $FR \sim 3$, the convection velocity initially decreases and later increases with
  $FR$. For
  $\theta _{0} = 5^{\circ }$, there is a noticeable reduction in convection velocity at
  $FR = 2.5$. This can be attributed to the abrupt transition in the wake structure from an aligned vortex street to a Kármán vortex street at
  $X/L = 2$, as observed from flow visualization (figure 10). This resulted in a vortex street where the vortices were closely spaced, which led to a reduction in convection velocity. With increase in
  $FR$, as the frequency of vortex shedding increases, the streamwise separation
  $a$ between the vortices (figure 21e) decreases. The transverse separation
  $b$ between the vortices (figure 21f) shows a trend consistent with that observed from flow visualization (figure 10). At lower
  $FR$, when a Kármán vortex street is observed,
  $b < 0$. With increase in
  $FR$, when an aligned vortex street is observed,
  $b \sim 0$. With the appearance of a reverse Kármán vortex street,
  $b > 0$. The transverse separation
  $c$ between the CW and ACW vortices at the instants when they are shed at the filament tip is presented in figure 21(g). It is interesting to note that at
  $\theta _{0} = 5^{\circ }$ and
  $FR = 2.1$ and 2.5, one has
  $c \sim 0$, indicating an aligned vortex street (figure 21f,g). However, for the same case, at
  $X/L = 2$, one has
  $b < 0$, indicating a Kármán vortex street, consistent with the observations from flow visualization data and time-averaged vorticity contours (figures 10 and 11).
It is observed in figure 21(b) that circulation is a function of both oscillation amplitude and forcing frequency. To further improve the scaling of circulation with oscillation amplitude, a regression analysis was performed using the linear least-squares method. It is seen in figure 22 that a good linear fit of the data is obtained if the normalized circulation is scaled by  $\theta _{0}^{1.4}$. The normalized circulation,
  $\varGamma /(D+L)U_{\infty }$, can now be expressed in terms of oscillation amplitude,
  $\theta _{0}$, and forcing frequency,
  $FR$, as
  $(0.0349 - 0.0092 FR)\theta _{0}^{1.4}$. The inset in figure 22 shows the variation of the sum of squares of the residuals,
  $S$, with the amplitude scaling exponent,
  $n$. It is seen that
  $S \sim 0$ when
  $n = 1.4$.

Figure 22. Variation of scaled circulation with oscillation amplitude at different forcing frequencies in the flow past an oscillating cylinder–filament system with filament 1 (least flexible filament of length  $L/D = 2$). A linear fit of the scaled circulation obtained through least-squares regression analysis is shown by the solid black line. The inset shows the variation of the sum of the squares of the residuals,
  $S$, against the amplitude scaling exponent,
  $n$, obtained using the least-squares method.
4.3. Effect of filament stiffness
Visualization data and the measured vorticity fields indicated that the effect of filament stiffness on the wake structure was more evident in the case of a longer filament of length  $L/D = 5$. Hence, in the present section, the effect of filament stiffness on flow past a cylinder–filament system for a filament of length
  $L/D = 5$ is investigated.
4.3.1. Wake structure
The effect of filament stiffness on the wake structure of a cylinder–filament system is shown in figure 23. Here, the cylinder is forced to oscillate at  $\theta _{0} = 5^{\circ }$ and different
  $FR$. Two filaments of different stiffness, filament 1 (least flexible filament) and filament 3 (most flexible filament), both of length
  $L/D = 5$ are used in the study.

Figure 23. Effect of filament stiffness on the wake structure of a cylinder–filament system: (a) filament 1 and (b) filament 3. (Filament 1 is the least flexible filament and filament 3 is the most flexible filament.) The cylinder is forced to oscillate at  $\theta _{0} = 5^{\circ }$ and different forcing frequencies and comparison at the same
  $FR$ is made at a time instant
  $T = 0.25$ of the cylinder oscillation. The filament is of length
  $L/D = 5$.
At  $FR = 0.8$, in the case of filaments 1 and 3 (figure 23a,b), the 2S mode of vortex shedding is observed. In this case, a vortex pair, P, comprising a CW and an ACW vortex is shed during each oscillation cycle. As they travel downstream, these vortices convect along the same transverse location in the wake, thereby resulting in the formation of an aligned vortex street. On increasing the forcing frequency to
  $FR = 1.7$, a 2S mode of vortex shedding is observed in the case of filament 1 (figure 23a), whereas, in the case of filament 3, a 2P vortex street is formed due to vortex splitting (figure 23b). In both cases, a reverse Kármán vortex street is observed. With further increase in forcing frequency, at
  $FR = 2.1$, an asymmetric P + S vortex street is observed in the case of filament 1, whereas, in the case of filament 3, a 2P vortex street, symmetrically arranged about the wake centreline, is seen. In a P + S vortex street, a vortex pair, P (arranged in a reverse vortex configuration), and a single ACW vortex, S, is shed during each oscillation cycle. At a higher forcing frequency of
  $FR = 4.2$, an asymmetric P + S vortex street is observed in both cases.
Wake asymmetry has been observed in the present study in the case of filament 1 (least flexible filament) at  $St_{A} > 0.4$, consistent with the formation of asymmetric wakes reported in the flow past rigid pitching airfoils (Lewin & Haj-Hariri Reference Lewin and Haj-Hariri2003; Von Ellenrieder et al. Reference Von Ellenrieder, Parker and Soria2003; Heathcote & Gursul Reference Heathcote and Gursul2007; Godoy-Diana et al. Reference Godoy-Diana, Marais, Aider and Wesfreid2009; Marais et al. Reference Marais, Thiria, Wesfreid and Godoy-Diana2012; Shinde & Arakeri Reference Shinde and Arakeri2014; David et al. Reference David, Govardhan and Arakeri2017). It is observed in the present study that filament 3 (most flexible filament) of length
  $L/D = 5$ delays the formation of an asymmetric wake to higher
  $FR$ (figure 23), similar to the findings reported in Marais et al. (Reference Marais, Thiria, Wesfreid and Godoy-Diana2012) and Shinde & Arakeri (Reference Shinde and Arakeri2014). In the case of filament 3 of length
  $L/D = 5$, an asymmetric wake appears at
  $St_{A} \geq 0.25$.
4.3.2. Generation of a 2P vortex street due to vortex splitting
In the 2P vortex street observed in the case of filament 3 (at  $FR = 1.7$ and 2.1, figure 23b), it is seen that only a single vortex pair, comprising a CW and ACW vortex, is shed at the filament tip during each oscillation cycle. However, at
  $X/L \sim 0.25$, each (CW and ACW) vortex splits into two like-signed vortices. Each of these split vortices then combines with another vortex of opposite sign formed during the previous half-cycle, resulting in a 2P wake structure, with a vortex pair arranged along either side of the wake centreline. In this case, the vortex pairs are arranged in a reverse vortex configuration. Similar observations on the formation of a 2P wake structure due to vortex splitting have been discussed in Govardhan & Williamson (Reference Govardhan and Williamson2000), Mackowski & Williamson (Reference Mackowski and Williamson2015) and David et al. (Reference David, Govardhan and Arakeri2017). However, in their studies, there was no leading-edge separation and the 2P wake structure observed is due to splitting of the trailing-edge vorticity. In the present study, separated shear layers from the cylinder surface roll up into vortices (cylinder vortices) and interact with the trailing-edge vortices before shedding in the wake. The formation and shedding of the 2P wake structure will be discussed in detail in § 4.3.4.
The formation of a 2P vortex street due to vortex splitting may be attributed to the intense strain-rate field within the developing vortex, as discussed in Govardhan & Williamson (Reference Govardhan and Williamson2000) and verified in the present study (see figure 24). The strain-rate field obtained from time-averaged PIV corresponding to the 2S mode (in the case of filament 1 at  $FR = 1.7$) and 2P mode (in the case of filament 3 at
  $FR = 2.1$) of vortex shedding is presented in figure 24(a,b), respectively. Here, the time-averaged strain rate,
  $\bar {\varepsilon }$ is defined as
 \begin{equation} \bar{\varepsilon} = \frac{\textrm{d}(\overline{U} + u)}{\textrm{d}Y} + \frac{\textrm{d}(\overline{V} + v)}{\textrm{d}\kern0.06em X}, \end{equation}
where  $u$ and
  $v$ are the fluctuating velocity components in the wake.

Figure 24. (a,b) Strain-rate field obtained from time-averaged PIV, and (c–f) corresponding phase-averaged vorticity field at time instants  $T = 0$ (c,d) and 0.5 (e,f) in the case of (a,c,e) filament 1, the 2S mode of vortex shedding and (b,d,f) filament 3, the 2P mode of vortex shedding. The cylinder is forced to oscillate at
  $\theta _{0} = 5^{\circ }$ and different forcing frequencies,
  $FR$. Two filaments of different stiffness (filament 1 is the least flexible filament and filament 3 is the most flexible filament) and length
  $L/D = 5$ are used. The vertical black dotted line corresponds to the location where the vortices are first shed in the wake. Strain-rate field is normalized by
  $U_{\infty }/(D+L)$. Vorticity field is normalized by
  $U_{\infty }/(D+L)$.
The vorticity contours at the instants when the CW and ACW vortices shed in the wake is also shown (see figure 24(c,e) for 2S mode and figure 24(d,f) for 2P mode). The black dotted line in the figure indicates the location in the wake where the vortices shed from the filament tip. In the 2S mode of vortex shedding, both CW and ACW vortices shed as a region of concentrated vorticity in the wake at  $X/L \sim 0.3$. In this case, filament 1 is seen to be deflecting in the first bending mode with zero radius of curvature along the filament length. Therefore, the vortices shedding from the cylinder surface (CW
 $^*$ and ACW
 $^*$; see figure 24c,e) retain their original shape since their inception while they convect along the filament length as regions of concentrated vorticity. In this case, the flow is generated mainly by the active portion of the filament (
 $X/L \sim -0.4$ to
  $0$, towards the filament tip; see figure 26).
The enhanced acceleration at the filament tip induces CW and ACW to pinch off from the filament surface and shed in the wake in a region away from the filament tip. Here, the CW and ACW vortices are shed in the wake beyond the location corresponding to the maximum strain rate (see figure 24a,c,e). In the case where a 2P vortex street is observed (figure 24b,d,f), the vortices shed as a region of elongated vorticity at the filament tip. In this case filament 3 is seen to be deflecting in the second bending mode with a finite radius of curvature along the filament length. Therefore, the vortices shedding from the cylinder surface, CW $^*$ and ACW
 $^*$ (see figure 24d,f) get stretched and elongated as they convect along the filament length as elongated vortices. In this case, the filament moves passively in accordance with the surrounding flow field. This induces CW and ACW to shed at the filament tip, corresponding to the maximum strain-rate location in the wake. The intense strain rate within these vortices leads to vortex splitting at
  $X/L \sim 0.25$.
4.3.3. Time-averaged velocity and vorticity field
Figure 25 shows the time-averaged vorticity field for the cases examined in figure 23. At  $FR = 0.8$, the time-averaged vorticity in the wake is close to zero, indicating the shedding and convection of vortices of comparable circulation and opposite vorticity along the same transverse location in the wake. This is consistent with the shedding of an aligned vortex street in the wake (figure 23).

Figure 25. Effect of filament stiffness on time-averaged vorticity contours in the flow past a cylinder–filament system: (a) filament 1 and (b) filament 3. (Filament 1 is the least flexible filament and filament 3 is the most flexible filament.) The cylinder is forced to oscillate at  $\theta _{0} = 5^{\circ }$ and different
  $FR$. Two filaments of different stiffness and length
  $L/D = 5$ are used.
At  $FR = 1.7$, in the case of filament 1, two streaks of vorticity opposite to that along the cylinder–filament surface are observed in the wake. This is associated with the shedding of a reverse Kármán vortex street. At
  $FR = 1.7$ and 2.1, in the case of filament 3, where a 2P vortex street is observed, there are two streaks of vorticity at the filament tip, which are of opposite sign to the vorticity along the cylinder–filament surface. This corresponds to the shedding of a single CW and ACW vortex in a reverse vortex configuration at the filament tip during each oscillation cycle. However, at
  $X/L \sim 0.25$, two additional streaks of vorticity (associated with the convection of vortex pairs, P1 and P2) appear in the wake. This corresponds to the location where a 2P vortex street forms due to vortex splitting. In this case the streak of vorticity associated with the convection of vortex pairs P1 and P2 is opposite to that shedding along the cylinder–filament surface, indicating a reverse vortex configuration.
At  $FR = 2.1$, in the case of filament 1, there are two well-defined streaks of vorticity, which are deflected upwards from the wake centreline, indicating wake asymmetry. This is associated with the shedding of a reverse vortex street, where a vortex pair, P, is shed and gets convected above the wake centreline during each oscillation cycle. In addition, there is a streak of vorticity beneath the wake centreline. This corresponds to the shedding of the single ACW vortex, S (in addition to the vortex pair, P), during each oscillation cycle. An interesting observation in these cases is that at
  $FR \geq 1.7$, the time-averaged vorticity magnitude in the wake in the case of filament 1 is greater compared to filament 3, indicating that comparatively stronger vortices are shed and convected in the wake in the case of filament 1. This suggests an increased thrust in the case of filament 1 compared to filament 3 (see figure 30).
Owing to its finite rigidity, filament 1 draws in a comparatively greater amount of fluid over a shorter time period of oscillation, and pushes it downstream in the wake, leading to a rapid increase in the momentum and energy flux in the wake (figure 26a–c), indicating an increase in thrust generation. Here, in the case of filament 1, at  $FR = 2.5$, one has
  $MF = 1.4$. However, owing to its comparatively nominal rigidity, filament 3 contributes very little towards accelerating the fluid in the wake. Therefore, the contribution of filament 3 towards momentum and energy addition in the wake (figure 26d–f) is comparatively smaller. Consequently, the streamwise force generated in the case of filament 3 at
  $FR = 2.5$ is
  $MF = 0.1$, which is only sufficient to overcome the pressure reduction in the wake.

Figure 26. Streamwise variation of (a,d) centreline velocity, (b,e) momentum flux,  $MF$, and (c,f) energy flux,
  $EF$, in the flow past a cylinder–filament system in the case of filaments 1 and 3. (Filament 1 is the least flexible filament and filament 3 is the most flexible filament.)
4.3.4. Effect of filament stiffness on wake symmetry
Figure 23 shows that at  $FR = 2.1$, an asymmetric P + S vortex street is observed in the case of filament 1, whereas a symmetric 2P vortex street is observed in the case of filament 3. To understand the effect of filament flexibility on wake symmetry, the time evolution of the vortex formation and shedding process is examined in these cases.
The resultant wake structure in the flow past a body executing forced oscillations is governed by the dynamics imposed by the body motion, which in this case is the motion of the cylinder–filament system. Therefore, before examining the time evolution of vortex shedding in the wake, the dynamics of the cylinder–filament motion is studied. The angular displacement of the cylinder and filament tip during an entire oscillation cycle extracted from flow visualization data is presented in figure 27(a,b). The time instants at which vortices are shed in the wake are indicated in the figure. Filament deflection profiles at various time instants during a half-cycle are presented in figure 27(c,d). In the case of filament 1, the displacements of the cylinder and filament tip are in phase with each other. Here, the filament is seen to be deflecting in the first bending mode with no inflection point along its length. This results in a CW vortex being first shed in the wake followed by an ACW vortex during each oscillation cycle. In the case of filament 3, the filament tip lags the cylinder displacement by a phase of  ${\approx }180^{\circ }$. Here, the filament deflects in the second bending mode with an inflection point along its length. This results in an ACW vortex being first shed in the wake followed by a CW vortex during each oscillation cycle.

Figure 27. Details of the cylinder–filament motion during a complete cycle of the cylinder oscillation: (a,b) angular displacement of the cylinder and filament tip; and (c,d) filament deflection profiles at different time instants over one half-cycle. The cylinder is forced to oscillate at  $\theta _{0} = 5^{\circ }$ and at
  $FR = 2.1$. Two filaments of different stiffness and length
  $L/D = 5$ are used: (a,c) filament 1 and (b,d) filament 3. (Filament 1 is the least flexible filament and filament 3 is the most flexible filament).
Figure 28 shows that at  $T = 0$, a CW and ACW vortex is located along either side of the filament surface in the case of filaments 1 and 3. In the case of filament 3, a clockwise vortex, CW1, formed during the previous half-cycle is also seen in the wake. In the case of filament 1, vortices are formed and shed in the wake over shorter time periods of the cylinder oscillation. Therefore, by
  $T = 0.75$, a vortex pair, P, comprising a CW and ACW vortex, has already shed in the wake and is located above the wake centreline (figure 28a). The CW and ACW vortices within the vortex pair, P, are closely spaced in the wake, resulting in the formation of a vortex dipole. At later time instants of the cylinder–filament motion, this vortex dipole convects under its self-induced velocity in the same orientation at which it was first shed in the wake (marked by the white arrow in figure 28(a) at
  $T = 1$), leading to wake asymmetry. Between
  $T = 0.75$ and 1, during the filament downstroke, an additional anticlockwise vortex, S, is shed from the filament tip, resulting in a P + S vortex street.

Figure 28. Effect of filament flexibility on wake symmetry in the flow past a cylinder–filament system. The cylinder is forced to oscillate at  $\theta _{0} = 5^{\circ }$ and
  $FR = 2.1$. Two filaments of different stiffness and length
  $L/D = 5$ are used: (a) filament 1 and (b) filament 3. (Filament 1 is the least flexible filament and filament 3 is the most flexible filament.)
In the case of filament 3, during the anticlockwise motion of the cylinder, between  $T = 0$ and 0.5, the filament tip is in its downstroke. During this period, the ACW vortex (located below the filament surface) combines with a filament vortex, ACW
 $_{TIP}$, and sheds in the wake above the wake centreline. By
  $T = 0.5$, at
  $X/L \sim 0.25$, this ACW vortex splits into two vortices, ACW1 and ACW2, due to the intense strain rate within the developing vortex, ACW, as discussed in § 4.3.2. Here, ACW1 is located above the wake centreline, whereas ACW2 is located below the wake centreline. ACW1 then combines with CW1, which was shed during the previous half-cycle, to form a vortex pair, P1, arranged in a reverse vortex configuration. During the clockwise motion of the cylinder, between
  $T = 0.5$ and 1, the filament tip is in its upstroke. During this period, the CW vortex (located above the filament surface) combines with a filament vortex, CW
 $_{TIP}$, and sheds in the wake below the wake centreline. By
  $T = 1$, at
  $X/L \sim 0.25$, this CW vortex splits into two vortices, CW1
 $^*$ and CW2, due to the increased strain rate within the developing vortex, CW. Here, CW1
 $^*$ is located above the wake centreline, whereas CW2 is located below the wake centreline. Then CW2 combines with ACW2, which was shed during the previous half-cycle, to form a vortex pair, P2, arranged in a reverse vortex configuration. At later time instants of oscillation, vortex pairs P1 and P2 convect along either side of the wake centreline, resulting in the formation of a symmetric 2P vortex street.
Figure 29(a) shows that in the case of filament 1, most of the fluid acceleration in the wake happens due to the filament oscillation in the flow. In this case, the active portion of the filament ( $X/L \sim -0.3$ to
  $0$) is responsible for the majority of the momentum and energy addition in the flow field (figure 26a–c). However, in the case of filament 3, filament oscillation is not very effective in altering the momentum and energy content in the flow (figure 26d–f). In this case, the filament does not accelerate the fluid (figure 29b). Instead, the filament motion in this case is governed by the surrounding flow field. This is clearly observed at time instants
  $T = 0.5$ and 0.75, when the active portion of the filament is deflected downwards due to the flow induced by CW (located along the upper surface of the filament) and ACW2 (located in the wake).

Figure 29. Effect of filament stiffness on the vorticity field: (a) filament 1 and (b) filament 3. Filament 1 is the least flexible filament and filament 3 is the most flexible filament.
Similarly, at time instant  $T = 1$, the active portion of the filament is deflected upwards due to the flow induced by ACW (located along the lower surface of the filament) and CW1
 $^*$ (located in the wake). In this case, the dynamics of the filament motion is governed by an intricately coupled interaction between the filament and the surrounding flow field. This intimate coordination between the filament motion and the flow field is responsible for the appropriate arrangement of vortices in the wake, thereby resulting in the formation of a symmetric 2P wake. This suggests that filament stiffness plays a significant role in the generation of vortices as well as their subsequent arrangement in the wake. The time instants of cylinder motion at which a vortex pair is shed in the wake from the filament tip as well as the location in the wake where it is shed is crucial in determining wake symmetry.
Figure 30 shows the time variation of the streamwise force coefficient in the case of filaments 1 and 3. The figure shows that the mechanisms of thrust generation in both cases are similar, with maximum thrust being generated at the time instants when the filament vortices shed in the wake. However, owing to its nominal rigidity, filament 3 is observed to move passively under the surrounding flow field, and, consequently, produces comparatively less thrust. In the present study, while filament 1 is a suitable model for examining flapping flight, filament 3 is suitable for modelling undulatory locomotion, albeit for a flexible surface that moves passively in accordance with the imposed forcing conditions. The mechanism of flow and thrust generation in the case of filament 1 is in accordance with that observed in the flow past pitching airfoils. However, to accurately simulate and examine tadpole swimming, filament 3 has to be actuated along its length at the prescribed parameters found in nature.

Figure 30. Effect of filament stiffness on the instantaneous force acting on the cylinder–filament system. (a) filament 1 and (b) filament 3. Filament 1 is the least flexible filament and filament 3 is the most flexible filament.
5. Conclusion
In the present work, experimental studies were conducted to investigate the effect of an attached flexible filament on the flow past a rotationally oscillating cylinder at  $Re_{D} = 150$. Parametric studies were carried out to examine the effect of cylinder forcing parameters and filament stiffness on the resultant wake structure and forces on the cylinder–filament system. The conclusions from the study are summarized below.
(i) An attached filament significantly alters the flow past a cylinder–filament system from a Kármán vortex street to a reverse Kármán vortex street, albeit over a certain range of cylinder forcing parameters. In the present study, a reverse Kármán vortex street is observed within a range of Strouhal number,  $St_{A} = 0.25$ to 0.5, encountered in nature in flapping flight/fish propulsion and also in the flow past pitching airfoils. In the present work, it is observed that the majority of the momentum and energy flux in the wake happens at the filament tip, which suggests that filament oscillation is responsible for thrust generation. Further, it is noted that it is the ‘active portion’ of the filament (towards the filament tip) that is responsible for the momentum and energy addition in the wake. The mechanism of flow generation, and consequently the momentum and energy addition in the flow field, is highly unsteady, with vortex interactions and shedding observed at various time instants of the oscillation cycle. The mechanism of thrust generation is explored in detail by studying the time evolution of the streamwise force acting on the cylinder–filament system. The measured velocity fields and visualization data indicate that maximum momentum and energy addition in the wake happens at the instants when maximum fluid entrainment takes place within the growing filament vortex, whereas maximum thrust is generated at the instants when the filament vortices shed in the wake.
(ii) In the flow past a cylinder–filament system, in addition to the vortices shedding from the cylinder surface (cylinder vortices), there are vortices generated by the filament motion in the flow (filament vortices). In the present study, the cylinder and filament vortices are observed to interact and combine constructively at the filament tip before shedding in the wake. Many interesting changes are observed in the wake structure at different cylinder forcing parameters, including the formation and shedding of a 2P vortex street, a chain of vortices, a reverse Kármán vortex street as well as an asymmetric P + S vortex street. The mechanisms leading to the formation of a chain of vortices and transition from a Kármán vortex street to a reverse Kármán vortex street are explored by studying the time evolution of vortex formation and shedding in the wake. The resultant wake structure in a flow field depends on the time instants at which vortices are shed in the wake at the filament tip, which subsequently governs their location in the wake. Filament vortices are generated and shed in the wake near the time instants when maximum fluid entrainment takes place within the growing vortex. This corresponds to the instants when the velocity of the filament tip is maximum. At lower forcing frequencies, filament oscillation is not effective in significantly altering the wake structure or in imparting momentum and energy in the wake. At higher forcing frequencies close to (harmonics of) the filament natural frequency, with the formation of vortex dipoles, resulting in wake asymmetry, vortices of increased strength convect rapidly in the wake. This results in an increase in the momentum and energy flux in the wake, indicating a significant increase in thrust.
(iii) Circulation increases almost linearly with cylinder forcing frequency,  $FR$. With the appearance of an asymmetric P + S vortex street in the wake, at
  $St_{A} \geq 0.4$, the circulation values of the ACW vortices are comparatively smaller than the corresponding CW vortices within the same vortex pair, P. This indicates that the CW vortices form over a longer time period of the cylinder oscillation than the corresponding ACW vortices. Normalized values of circulation at different forcing frequencies scale with oscillation amplitude as
  $\theta _{0}^{1.4}$ for filament 1 of length
  $L/D = 2$.
(iv) The streamwise force acting on the cylinder–filament system and power is estimated through control volume analysis using a modified formulation, which takes into account the streamwise and transverse velocity fluctuations in the wake. The results indicate that these terms become important while estimating streamwise force in a flow field where asymmetric wakes are observed. In all cases, drag reduction is observed when the vortex arrangement at the filament tip is in an aligned or reverse Kármán vortex configuration. In the present study, it is observed that the transition in the wake structure from a Kármán vortex street to a reverse Kármán vortex street does not correspond to drag-to-thrust transition. Thrust is generated when the extra momentum flux produced by the filament oscillation is sufficient to overcome the pressure reduction in the wake, similar to the observations in Godoy-Diana et al. (Reference Godoy-Diana, Aider and Wesfreid2008), Bohl & Koochesfahani (Reference Bohl and Koochesfahani2009), Das et al. (Reference Das, Shukla and Govardhan2016) and Andersen et al. (Reference Andersen, Bohr, Schnipper and Walther2017).
(v) Visualization data indicate that filament flexibility delays the formation of an asymmetric wake, albeit over a certain range of cylinder forcing frequencies and filament lengths. At the same cylinder forcing parameters and filament length ( $\theta _{0} = 5^{\circ }$,
  $FR = 2.1$ and
  $L/D = 5$), an asymmetric P + S vortex street is observed in the case of filament 1 (least flexible filament, which suitably models rigid pitching motions, relevant to flapping flight), whereas a symmetric 2P vortex street (formed due to vortex splitting) is observed in the case of filament 3 (most flexible filament, which suitably models undulatory motions of a flexible surface flapping in accordance with the surrounding flow field). The mechanisms leading to wake asymmetry are examined. It is found that wake symmetry is governed by the time instant of cylinder oscillation at which a vortex pair is shed in the wake at the filament tip, which subsequently governs its location in the wake. Asymmetric wakes are observed in the case of filament 1, at
  $St_{A} > 0.4$, whereas, in the case of filament 3, wake asymmetry is observed at
  $St_{A} > 0.25$. In the case of filament 1, the flow is entirely governed by the filament motion. Here, vortices are formed and shed over shorter time instants of the cylinder oscillation, leading to the formation of vortex dipoles, resulting in wake asymmetry. However, in the case of filament 3, there is an intricately coupled interaction between the filament motion and the surrounding flow. In this case, the ‘active’ portion of the filament does not accelerate the fluid. Instead, it moves passively in the wake, under the influence of the induced velocity in the surrounding flow field. This intimate coordination between the filament motion and the flow field is responsible for the appropriate arrangement of vortices in the wake, leading to the formation of a symmetric 2P vortex street.
Supplementary movies
Supplementary movies are available at https://doi.org/10.1017/jfm.2021.894.
Acknowledgements
The authors gratefully acknowledge the help and support received from the staff and graduate students of the Low Speed Aerodynamics Laboratory and Fluid Dynamics Laboratory of the Indian Institute of Technology, Kanpur. The authors gratefully acknowledge the referees for their insightful comments and valuable suggestions.
Funding
This research received no specific grant from any funding agency, commercial or not-for-profit sectors.
Declaration of interests
The authors report no conflict of interest.


