


1. Introduction
In the seminal work of Moffatt (Reference Moffatt1964), the existence of the so-called Moffatt vortices was predicted in flows within a planar wedge at the tip angles below 146°. The fascinating direct experimental observation was provided by Taneda (Reference Taneda1979); cf. van Dyke (Reference Van Dyke1982). The Moffatt-type vortices within conical surfaces were studied by Wakiya (Reference Wakiya1976), who predicted the critical angle of 80.6° for the disappearance of the vortices, and also by Weidman & Calmidi (Reference Weidman and Calmidi1999), and Shankar (Reference Shankar2005) (the corresponding computations of Liu & Joseph (Reference Liu and Joseph1978) were found to be erroneous in Malhotra, Weidman & Davis (Reference Malhotra, Weidman and Davis2005) and Shankar (Reference Shankar2005)). The axisymmetric counterpart of the planar flow also arises in confinements between two concentric conical surfaces, where the theoretical results similarly predict the formation of the Moffatt-type nested toroidal vortices (Malhotra etal. Reference Malhotra, Weidman and Davis2005). However, experimental observations of such toroidal Moffatt vortices have not been reported yet to the best of our knowledge.
The present work investigates the electrohydrodynamic flow arising between a pin electrode and a nearby grounded plate normal to the electrode axis (a particular case of a flow between two conical surfaces, with one of them being a plane). The resulting flow structure resembles a particular case of the flow between two concentric conical surfaces where the Moffatt-type vortices form (e.g. cf. Malhotra et al. Reference Malhotra, Weidman and Davis2005, figure 13b). At a sufficiently high DC voltage at the pin electrode, neutral species in the liquid either accept an electron in contact with the cathode (a negative pin electrode) or lose an electron in contact with the anode (a positive pin electrode); hence, the liquid near the electrode tip acquires the same polarity as the electrode. Then, a strong submerged jet-like flow arises, which is always directed away from the electrode tip at any polarity because it is driven by the repulsive Coulomb bulk force, as shown in figure 1 (Sankaran et al. Reference Sankaran, Staszel, Mashayek and Yarin2018). The rest of the liquid is practically uncharged and becomes entrained in the flow by viscous forces. The experimental results discussed below were obtained using particle image velocimetry (PIV) (Adrian & Westerweel Reference Adrian and Westerweel2011). The results reveal that the arising axisymmetric flow acquires additional degrees of complexity in the form of the toroidal Moffatt vortices.

Figure 1. A submerged electrically driven jet from the pin electrode, which is either (a) a cathode or (b) an anode.
2. Experiment
2.1. Oil bath
The experimental set-up consisted of a stainless-steel pin cathode submerged in food-grade canola oil, with a stainless-steel plane container wall (normal to the pin axis) serving as a counter-electrode (figure 2). The horizontal cross-section of the liquid bath was 48 mm × 48 mm and had a height of 48 mm. The inter-electrode distance (the distance from the pin tip to the plate), a 0, was set at 1.8 mm using a spring-loaded micrometer with a resolution of 0.001 mm. The pin electrode was connected to a custom-built negative high voltage (0–20 kV) DC supply. Although the shaft of the electrode sustained a comparably insignificant electric field strength, to eliminate any possible interference from this part the surface of the electrode shaft was insulated by Star-Brite liquid electrical tape, exposing only the conical tip. The experiments were conducted at room conditions at 22 °C and 50 %–60 % relative humidity. Here, only the high voltage (−12 kV) cases are considered where the Moffatt vortical flows were detected.

Figure 2. Schematic of the oil bath with the electrodes and the electric circuit.
To capture both the fast and slow-moving structures, separate trials were performed at different time-step sizes for the PIV image pairs. To capture the vortices and low-speed bulk flow, a 2500 μs time-step size was selected. An adequate capture of the fast-moving flow structures near the electrode tip required a reduction of the time-step size to 750 μs. Each trial consisted of 1000 image pairs acquired at a rate of 7.16 Hz.
2.2. Camera/lens, laser and control/acquisition system
A 5 W liquid-cooled, double-pulse yttrium argon garnet (YAG) laser source (cf.figure 3a) was controlled by LaVision's DaVis 10 software to ensure synchronized timing of the laser sheets and camera frames. Two LaVision SX 5Ms acquired the data with a 2448 × 2050 resolution using a Nikkor 50 mm lens for the near-field and a 200 mm lens for the far-field. The resulting pixel resolutions for the cameras were 0.0038 mm pixel−1 and 0.0085 mm pixel−1 for the near- and far-fields, respectively. Light exposure during the experiment was limited to 2000 μs. The laser sheet was vertically aligned with the pin axis, and the camera placed perpendicularly to the laser sheet. To reduce noise from reflection, the near-field camera used a 532 nm band-pass filter with 10 % light. The photograph of the experimental set-up is shown in figure 3(b).

Figure 3. The PIV schematic is shown in panel (a) and the photograph of the experimental set-up in panel (b).
2.3. Particles
Particles utilized for visualization were SiO2 microspheres with diameters in the 9–13 μm range, selected for their documented use as tracers in electrohydrodynamic experiments (Traoré, Daaboul & Louste Reference Traoré, Daaboul and Louste2010). The Stokes number  $St = {t_p}{u_0}/{\ell _0}$ characterizes whether tracer particles are fully entrained by a flow, where u 0 is the characteristic flow velocity,
  ${\ell _0}$ is the characteristic length scale, and tp is the characteristic particle relaxation time. If the particle diameter-based Reynolds number Re is much lower than one, the latter is found as
  ${t_p} = {\rho _p}d_p^2/(18\mu)$, where ρp is the particle density, dp is its diameter and μ is the viscosity of the liquid. The density of SiO2 particles is 2650 kg m−3, and μ = 0.05 Pa s is the viscosity of canola oil. Then, for the velocity
  ${u_0}$ ∼ 76 mm s−1 and dp ∼ 10 μm, the Stokes number
  $St\sim 2.1 \times {10^{ - 5}}$. Particles with St < 0.1 are considered to be fully entrained by flows (Tropea Reference Traoré, Wu, Louste, Pelletier and Dascalescu2007), which is the case here. The tracer particles were added to the oil bath until the particle content of 0.4 g l−1 was reached (cf. figure 4).

Figure 4. Sample of the tracer particle seeding. (a) Near-field domain, (b) far-field domain.
Figure 4 shows sample seeding distribution in the near- and far-field domains. The chosen seeding density in each domain is sufficient, with no under-seeding in the near-field (figure 4a), and no over-saturating in the far-field (figure 4b). Additionally, the individual particle size used can be resolved and traced in both domains, allowing for simultaneous measurements in both domains; hence capturing both microscopic and macroscopic structures. Without this technique, it would be quite difficult to fully capture microscopic structures as the resolution is limited, and the macroscopic domain extends beyond the field of view. The density of canola oil is ρ = 920 kg m−3. Then, the overall flow Reynolds number based on the characteristic length scale of flow (say, the inter-electrode gap)  ${\ell _0}\sim 1.8\;\textrm{mm}$ is
  $Re \approx 2.5$, which is close to the creeping flow regime.
2.4. Post-processing
The PIV calculations were performed by LaVision's DaVis 10 software using a multi-pass approach, starting with a square 48 × 48 pixel interrogation window with a 75 % overlap. No additional filters were applied.
The time-weighted velocity vector fields discussed below provide the visuals and approximations for the steady-state field. Intermediate intervals are provided to demonstrate the transient nature of the observed vortices. Replicates used to evaluate repeatability were performed non-continuously and not back to back.
3. Results and discussion
3.1. The main pattern of Moffatt vortices between conical surfaces
The PIV data are presented in multiple contour/vector field overlays due to the need to show results from different time-step sizes. The results for the large time-step size in the near-field are presented first, as such time-step sizes allow for the best capture of the flow structures outside the peak velocity domain observed near the pin electrode tip. Then, figures with the results for the small time-step size for the near-field domain are provided, which allow capturing of the peak velocity in the inter-electrode gap and the extension to the macroscopic view of the entire domain in the oil bath. It should be emphasized that the near-field and far-field images at the same time-step size could be taken simultaneously, whereas at the smaller time-step size they are taken in separate trials. Only the main findings are discussed in this note, whereas multiple results acquired to evaluate repeatability are not shown but mentioned briefly. For clarity, regions of the figures outside the range suitable for the selected time-step sizes are cross-hatched.
The measured flow field depicted in figure 5 reveals three toroidal vortices; two partially resolved, and one fully resolved. The left border of the primary driving vortex 1 is directly below the electrode tip with the centre of the roll structure located at (x = 0.5 mm, y = 0.75 mm). The inner structure of vortex 1 is not fully resolved in figure 5 due to the elevated velocity of the jet requiring a smaller time-step size of 750 μs. Accordingly, the inner flow structure under the electrode tip acquired with the smaller time-step size is shown in figure 6.

Figure 5. The near-field velocity vectors with the colour representing velocity magnitude. The electrode has a fully exposed tip with an insulated shaft. The data acquisition time-step size was 2500 μs.

Figure 6. The near-field velocity vectors with the colour representing velocity magnitude. The electrode has a fully exposed tip with an insulated shaft. The data acquisition time-step size was 750 μs.
The second toroidal vortex (centred at x = 1.5 mm, y = 2.25 mm) is driven by the primary vortex via viscous forces; inferred by the clockwise direction of vortex 2 in figure 5 and the counter-clockwise rotation of vortex 1. The third vortex, centred at x = 10.25 mm and y = 7 mm, is mostly outside the border of the microscopic domain shown in figure 5. Therefore, it is fully resolved in the far-field domain in figure 7. Each vortex may be better observed (without the circulation direction) by using the streak line plots, as shown in figures 8 and 9, corresponding to figures 5 and 7 for the microscopic and macroscopic domains, respectively.

Figure 7. The near-field velocity vectors with the colour representing velocity magnitude. The electrode has a fully exposed tip with an insulated shaft. The data acquisition time-step size was 2500 μs.

Figure 8. The streak line plot of the velocity field observed in figure 5. The electrode has a fully exposed tip with an insulated shaft. The data acquisition time-step was 2500 μs.

Figure 9. The streak line plot of the velocity field observed in figure 7. The electrode has a fully exposed tip with an insulated shaft. The DC voltage at the pin electrode was −12 kV, and the data acquisition time-step size was 2500 μs.
The vortices demonstrated in figures 5–9 closely resemble the Moffatt-type vortices in conical confinements. The present experiment is successful in resolving them because of the small inter-electrode gap, which allows one to closely reproduce the concentric cone–plate conic structure (which is the flow between two nested conical surfaces, one of which is the plane). It is difficult to examine this geometry experimentally due to the small inter-electrode gap and the curved surface of the pin electrode yielding significant reflections to the PIV camera. Despite these difficulties, the results demonstrate, to our knowledge, the first observation of the Moffatt vortices in a conical confinement.
3.2. Transient effects
The transience of the flow structures in the near-field domain was investigated by subsampling the collection with iterate groups of 100 image pairs. Intermediate intervals of the velocity magnitude and vector field are presented in figure 10 with corresponding streak line plots in figure 11. In figures 10 and 11, vortex 1 is observed to expand from 0 to 14 s and subsequently expand until 56 s. This pseudo-steady structure suggests the existence of the next bifurcation, reminiscent of that characteristic of the Taylor vortices in the Taylor–Couette flow (King et al. Reference King, Li, Swinney and Marcus1984). However, it should be emphasized that in the present case, the transient effect is sufficiently weak not to blur the nearly steady-state pattern of the conical Moffatt vortices depicted in figures 5–9.

Figure 10. The vector fields illustrating the transient effects. (a) The time average from 0 to 14s, (b) the time average from 14 to 28 s, (c) the time average from 28 to 42 s, (d) the time average from 42 to 56 s.

Figure 11. The streak lines illustrating the transient effects. (a) The time average from 0 to 14s (b) the time average from 14 to 28 s, (c) the time average from 28 to 42 s, (d) the time average from 42 to 56 s.
3.2.1. The body force distribution and comparison of the flow structure with the theory
First, consider the so-called charge injection process in the narrow inter-electrode gap, which drives the flow in the present experiments. In electrohydrodynamics, net charges in liquid bulk can appear either due to the electron transfer to or from a metal electrode (the faradaic reactions) or due to dissociation of molecules of liquid at an electrode (Alj et al. Reference Alj, Denat, Gosse, Gosse and Nakamura1985; Castellanos Reference Castellanos1998; Sankaran et al. Reference Sankaran, Staszel, Mashayek and Yarin2018). In the present case, a strong jet is directed away from the pin irrespective of the polarity (cf. figure 1), which suggests that at −12 kV the faradaic reaction mechanism resulting in ion formation at the liquid–electrode interface is dominant (Sankaran et al. Reference Sankaran, Staszel, Mashayek and Yarin2018). A characteristic faradaic reaction at the cathode-liquid interface can be written as (Castellanos Reference Castellanos1998)
 \begin{equation}X + {e^ - } \to {X^ - },\end{equation}
where the species X from oil accepts an electron to form an anion with the same polarity as the cathode. Note that such faradaic reactions have been termed ‘electrochemical injection’, ‘charge injection’, or ‘ion injection’ (Castellanos Reference Castellanos1998; Sankaran et al. Reference Sankaran, Staszel, Mashayek and Yarin2018).
Electrohydrodynamic flows are induced when the electric field acts on the net bulk charges (or the ‘injected charges’), formed according to (3.1), resulting in the Coulomb body force acting on the liquid. For the present experiments, the charge injection and the corresponding electrohydrodynamic flows can be simulated numerically using the following system of the dimensionless governing equations:
 \begin{gather}\boldsymbol{\nabla} \boldsymbol{\cdot} \boldsymbol{U} = 0,\end{gather}
 \begin{gather}\frac{{\partial \boldsymbol{U}}}{{\partial t}} + (\boldsymbol{U}\boldsymbol{\cdot} \boldsymbol{\nabla})\boldsymbol{U} ={-} \boldsymbol{\nabla }p + \frac{1}{{\textrm{Re}}}{\boldsymbol{\nabla }^2}\boldsymbol{U} + Cq\boldsymbol{E,}\end{gather}
 \begin{gather}\frac{{\partial q}}{{\partial t}} + \boldsymbol{\nabla} \boldsymbol{\cdot}\left[ {q\left( {\boldsymbol{U} + \frac{1}{M}\boldsymbol{E}} \right)} \right] = 0,\end{gather}
 \begin{gather}{\boldsymbol{\nabla }^2}\varphi ={-} Cq,\end{gather}
where (3.2) is the continuity equation and (3.3) is the momentum balance equation. Equation (3.4) is the net bulk charge transport equation with the diffusion term neglected (Castellanos, Reference Castellanos1998). Equation (3.5) is the Poisson equation, expressing the Gauss law, the only trace of the general Maxwell equations relevant in the present case. The electric field strength in (3.3) and (3.4) is  $\boldsymbol{E} ={-} \boldsymbol{\nabla }\varphi$.
The following notations are used in (3.2)–(3.5), with all bold-faced characters denoting vectors: t is time, U is the velocity field, p is the pressure field, q is the net bulk charge density and φ is the electric potential. The dimensionless groups Re, M and C are the Reynolds number, the dimensionless mobility and the dimensionless charge number, respectively, defined below in (3.6).
The following scales were used to render the governing equations dimensionless:  ${\ell _0}$ as the length scale, the magnitude of the applied voltage at the pin electrode
  $|{{\varphi_0}} |$ as the scale of the potential φ,
  $|{{\varphi_0}} |/{\ell _0}$ as the scale of the electric field strength E,
  ${q_0}$ as the scale of the net bulk charge density (see below),
  ${U_0} = {{{K_H}{V_0}} / {{\ell _0}}}$ as the velocity scale, with the hydraulic mobility KH defined below, and
  $\rho U_0^2$ as the pressure scale, where ρ is the density of the liquid.
Accordingly, the dimensionless groups are given by the following expressions:
 \begin{equation}Re = \frac{{\rho |{{\varphi_0}} |{K_H}}}{\mu },\quad M = \frac{{{K_H}}}{{{K_i}}},\quad C = \frac{{{\ell _0}^2{q_0}}}{{\varepsilon {\varepsilon _0}|{{\varphi_0}} |}},\end{equation}
where the hydraulic mobility is  ${K_H} = \sqrt {{{\varepsilon {\varepsilon _0}} / \rho }}$, and the ionic mobility is
  ${K_i} = {{D{e_c}} / {({{k_B}T} )}}$, with
  $\varepsilon $ being the relative dielectric permittivity,
  $\varepsilon_{0} $ being the vacuum permittivity (the SI units are used), ec being elementary charge, D being the ion diffusion coefficient, kB being the Boltzmann constant and T being temperature. Also,
  ${q_0} = {{\sigma {k_B}T} / {({D{e_c}} )}}$ is used as the scale for the net bulk charge density q, where σ is the electric conductivity of the liquid. Note that such dimensionless equations were previously discussed and used in Castellanos (Reference Castellanos1998), Traoré et al. (Reference Traoré, Daaboul and Louste2010), and Traoré et al. (Reference Tropea, Tropea, Yarin and Foss2015).
To demonstrate the so-called charge injection process in the narrow inter-electrode gap, which triggers the bulk flow in the present experiments, (3.2)–(3.5) were solved numerically for the characteristic set of parameters listed in table 1. Also, the conductivity of canola oil has been measured elsewhere at different relative humidities (Sankaran et al. Reference Sankaran, Staszel, Belknap, Yarin and Mashayek2019), and here it is taken as σ = 4 × 10⁻¹² S cm−1. Accordingly, the dimensionless groups take the following values Re = 20, M = 500, and C = 10 (rounded to the nearest significant figure).
Table 1. The characteristic parameter values used for the numerical simulations.

In the numerical simulations, the domain boundaries have a dimensionless electric potential of 1 at the pin electrode and 0 at the counter-electrode, as well as a zero gradient of potential on all remaining surfaces. All surfaces are subjected to no-slip boundary conditions, and the liquid is initially at rest. There are numerous methodologies available to pose the boundary condition for the electric current at the electrode surface (Suh Reference Suh2012), ranging from a fixed current density to variation proportional to the electric field, or associating it with the bulk dissociation reactions and faradaic reaction at the surface (Kashir et al. Reference Kashir, Perri, Yarin and Mashayek2019). For this simulation, a constant charge density is applied at the electrode surface at those locations where the electric field strength at the surface is greater than or equal to 30 % of the peak electric field strength (located at the tip of the electrode). This approximation of surface charge distribution is reminiscent of that of Traoré et al. (Reference Traoré, Daaboul and Louste2010) for unipolar charge injection.
As gravitational forces are deemed negligible, and there is no applied pressure gradient, the primary source term in the momentum balance equation (3.3) is  $Cq\boldsymbol{E}$.
The predicted electric field strength depicted in figure 12 demonstrates that, as expected,  $|\boldsymbol{E} |$ is orders of magnitudes greater near the sharp pin electrode than that near the plane counter-electrode. The field is maximal at the tip of the pin in the proximity of the counter-electrode, dramatically dropping off in the liquid bulk. Because the electrodes are equipotential conductors, the electric field strength vectors are normal to them at any point. Compounding with the no-slip boundary condition, there is a negligible tangential force applied to the fluid bulk near the electrodes.

Figure 12. The dimensionless electric field strength distribution with vector field for an axisymmetric point-to-plane system. Note that the electric field strength colour bar is a logarithmic scale.
Due to the relatively high value of the mobility coefficient M, the injected charge is practically embedded in the fluid flow. Accordingly, a narrow charged jet appears between the electrodes (figure 13). It should be emphasized that the charge relaxation time  ${t_C} = \varepsilon {\varepsilon _0}/({K_i}q) \approx 0.07\;\textrm{s}$, whereas the jet transit time,
  ${t_j} = {{{\ell _0}} / {{U_0}}} \approx 0.002\;\textrm{s}$ is much shorter, once again indicating that the charge is confined to the jet and reaches the counter-electrode before relaxing.

Figure 13. The dimensionless charge density distribution for an axisymmetric point-to-plane system.
Figure 13 shows how the charge is injected at the pin electrode tip and is repelled from it by the Coulomb force, similarly to figure 1. Additionally, the narrow charged jet is attracted to the counter-electrode, where it is neutralized similarly to the numerical and experimental results of Atten, Malraison & Zahn (Reference Atten, Malraison and Zahn1997), Vázquez et al. (Reference Vázquez, Pérez, Castellanos and Atten2000) and Gazaryan et al. (Reference Gazaryan, Sitnikov, Chirkov and Stishkov2017). The charges are injected into the liquid at the pin electrode surface and are subsequently carried in the jet flow after being subjected to a combination of electrostatic repulsion, convection, and electromigration. The result is a peak in the body force term  $Cq\boldsymbol{E}$ in (3.3) on the electrode tip. The field of the body force term
  $Cq\boldsymbol{E}$ is shown in figure 14 with the close-up visualizations on the logarithmic scale. The results show that the electric driving force is associated with a very narrow and relatively short strip near the pin electrode (cf. figure 15). The driving Coulomb force is narrowly localized in the small gap between the pin and the plane electrodes, having a negligible influence on the main fluid body due to the lack of net charge in the bulk, which is confirmed by the numerical and experimental results of Atten et al. (Reference Atten, Malraison and Zahn1997) and Gazaryan et al. (Reference Gazaryan, Sitnikov, Chirkov and Stishkov2017).

Figure 14. The predicted magnitude of the dimensionless Coulomb body force  $|{Cq\boldsymbol{E}} |$. Unit vectors show the local directions of the field.

Figure 15. The predicted dimensionless net bulk charge density q, the electric field strength magnitude  $|\boldsymbol{E} |$ and the magnitude of the dimensionless Coulomb body force
  $|{Cq\boldsymbol{E}} |$ along the central axis of the inter-electrode gap, with Y = 0 denoting the plane electrode.
Accordingly, the flow structure seen in figures 7–9 results under the action of the viscous forces alone, while a practically pointwise electric driving force is concentrated at the domain boundary near the tip of the pin electrode adjacent to the plain electrode. Therefore, the creeping flow of figures 7–9 is expected to resemble the nested toroidal vortices between concentric conical surfaces predicted by Malhotra et al. (Reference Malhotra, Weidman and Davis2005). The direct comparison with their theory shows that this is, indeed, the case.
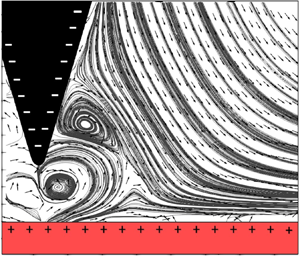
The experiments of this work correspond to the inter-cone gap of 76°, with the cone generatrixes’ angles from the vertical axis being 14° (the pin electrode) and 90° (the plane electrode). In this case, the theoretical predictions of Malhotra et al. (Reference Malhotra, Weidman and Davis2005) reveal the flow structure shown in figure 16. The results in the depicted domain reveal two Moffatt-type vortices, which are to be compared with vortices 2 and 3 of figures 5 and 7–9. The results listed in table 2 reveal that the comparison between the experimental and theoretical data is good, which ascertains that the vortical structures found in the present experiments are, indeed, the Moffatt-type vortices between concentric conical surfaces.

Figure 16. Theoretically predicted flow field based on the theory of Malhotra et al. (Reference Malhotra, Weidman and Davis2005) in the case of concentric conical surfaces with generatrixes at 14° (the pin electrode) and 90° (the plane electrode) from the vertical axis.
Table 2. Comparison of the experimental data and the theoretical predictions for the Moffatt-type concentric conical surfaces with generatrixes at 14° (the pin electrode) and 90° (the plane electrode) from the vertical axis. All lengths and coordinates are normalized by the radial domain lengths in both cases.

4. Conclusion
The present PIV study of flow patterns generated in an oil bath by a thin submerged jet repelled by the Coulomb force from a pin electrode toward a nearby concentric plane counter-electrode revealed that the flow entrained by viscous forces resembles the toroidal Moffatt vortices predicted theoretically for confinements between two concentric conical surfaces. To our knowledge, this work documents the first experimental observation of the Moffatt vortices between concentric conical surfaces. Such a flow was observed above the threshold DC voltage magnitude at the pin electrode (a cathode, in the present case) at −12 kV. The threshold voltage (with the other parameters being fixed) is between −8 kV (the case not discussed here for brevity) and −12 kV. It should be emphasized that Sankaran et al. (Reference Sankaran, Staszel, Mashayek and Yarin2018) discovered that at the voltage of −4 kV, an additional mechanism of faradaic reactions in oil becomes significant; specifically, neutral species accept electron on the pin cathode. The resulting anions are repelled from the pin cathode, and a global circulation arises directed outward from the pin. It might be that this global circulation already involves a system of the inner Moffatt-type vortices, albeit weak ones, and the experimental resolution is insufficient to recognize them. However, at −12 kV, the vortices become fully recognizable.
The experimental observations in the near- and far-fields fully revealed three consecutive counter-rotating toroidal Moffatt vortices. It is shown that the electric drive due to the Coulomb force is concentrated at the domain boundary near the tip of the pin electrode adjacent to the plane electrode, and the main flow resembles the creeping flow of the Moffatt-type. The experimental results of the present work are in good agreement with the theoretical predictions of Malhotra et al. (Reference Malhotra, Weidman and Davis2005) for the Moffatt-type nested vortices between concentric conical surfaces. Accordingly, the vortical structures found in the present experiments are, indeed, the first experimental observation of the Moffatt-type vortices between concentric conical surfaces.
Slight oscillations in shapes and locations of the toroidal Moffatt vortices between the concentric conical surfaces were observed at the intermediate averaging time intervals, which may suggest the existence of the next bifurcation similar to the one known for the Taylor vortices in the Taylor–Couette flow.
Acknowledgements
This work was supported by the National Science Foundation (NSF) GOALI Grant CBET-1505276. The useful discussions of the experimental results with Drs H. K. Moffatt and J. Westerweel are greatly appreciated. The authors would also like to thank Dr P.Traoré from the University of Poitiers for the fruitful discussion of numerical simulations. The first and second authors contributed equally to this work.
Declaration of interests
The authors report no conflict of interest.


