


1 Introduction
Dynamic wetting is a common phenomenon in everyday life and industrial coating operations where an ambient fluid (often air) is displaced by a liquid on a solid surface. In particular, coating flows rely heavily on steady dynamic wetting to uniformly deposit a liquid on a moving substrate (Weinstein & Ruschak Reference Weinstein and Ruschak2004). Dynamic wetting fails at some critical substrate speed and is accompanied by a change in flow from steady two-dimensional (2D) to unsteady three-dimensional (3D) flow (Burley & Kennedy Reference Burley and Kennedy1976; Blake & Ruschak Reference Blake and Ruschak1979; Vandre, Carvalho & Kumar Reference Vandre, Carvalho and Kumar2014). In coating processes, wetting failure leads to air entrainment and can degrade product quality (Kistler Reference Kistler and Berg1993; Weinstein & Ruschak Reference Weinstein and Ruschak2004). Therefore, understanding the mechanisms of wetting failure is very important so that strategies to delay the onset of wetting failure and increase coating speed can be developed.
Curtain coating is a high-speed coating method where substrate speeds of
 $U\approx 10~\text{m}~\text{s}^{-1}$
can be achieved (Brown Reference Brown1961; Hughes Reference Hughes1970; Blake et al.
Reference Blake, Dobson, Batts and Harrison1995; Blake, Dobson & Ruschak Reference Blake, Dobson and Ruschak2004). In this method, liquid is extruded (at a feed flow velocity
$U\approx 10~\text{m}~\text{s}^{-1}$
can be achieved (Brown Reference Brown1961; Hughes Reference Hughes1970; Blake et al.
Reference Blake, Dobson, Batts and Harrison1995; Blake, Dobson & Ruschak Reference Blake, Dobson and Ruschak2004). In this method, liquid is extruded (at a feed flow velocity
 $V$
) from a die (of width
$V$
) from a die (of width
 $w$
) at a height
$w$
) at a height
 $h_{curt}$
onto a moving substrate (figure 1
a). Gravity accelerates the liquid as it flows down the curtain (Kistler Reference Kistler1985; Blake, Clarke & Ruschak Reference Blake, Clarke and Ruschak1994). A uniform film of thickness
$h_{curt}$
onto a moving substrate (figure 1
a). Gravity accelerates the liquid as it flows down the curtain (Kistler Reference Kistler1985; Blake, Clarke & Ruschak Reference Blake, Clarke and Ruschak1994). A uniform film of thickness
 $h_{inf}$
is formed on the substrate when the liquid flow is steady and 2D. The ability to achieve high substrate speeds has made curtain coating a popular mass production method (Miyamoto & Katagiri Reference Miyamoto, Katagiri, Kistler and Schweizer1997). However, the mechanism of wetting failure in curtain coating remains poorly understood.
$h_{inf}$
is formed on the substrate when the liquid flow is steady and 2D. The ability to achieve high substrate speeds has made curtain coating a popular mass production method (Miyamoto & Katagiri Reference Miyamoto, Katagiri, Kistler and Schweizer1997). However, the mechanism of wetting failure in curtain coating remains poorly understood.

Figure 1. Schematics of (a) curtain coating and (b) parallel-plate geometry.
1.1 Hydrodynamic assist
The term ‘hydrodynamic assist’ is used to describe the fact that curtain coating can be manipulated to assist dynamic wetting and delay the onset of wetting failure (i.e. air entrainment) (Blake et al.
Reference Blake, Clarke and Ruschak1994; Miyamoto & Katagiri Reference Miyamoto, Katagiri, Kistler and Schweizer1997). It was found that manipulating the feed flow velocity
 $V$
in curtain coating can postpone the onset of wetting failure to a higher critical substrate speed
$V$
in curtain coating can postpone the onset of wetting failure to a higher critical substrate speed
 $U^{crit}$
in comparison with ‘plunge coating’, where a solid substrate plunges into a liquid pool (Blake, Bracke & Shikhmurzaev Reference Blake, Bracke and Shikhmurzaev1999; Yamamura Reference Yamamura2007). Experimental observations show that the degree of hydrodynamic assist reaches its maximum (i.e. the largest critical speed) when the dynamic contact line (DCL) is right beneath the liquid curtain, which leads to a strong hydrodynamic pressure near the DCL as the liquid impacts the substrate (Blake et al.
Reference Blake, Clarke and Ruschak1994; Miyamoto & Katagiri Reference Miyamoto, Katagiri, Kistler and Schweizer1997; Blake et al.
Reference Blake, Bracke and Shikhmurzaev1999; Yamamura et al.
Reference Yamamura, Suematsu, Kajiwara and Adachi2000; Blake et al.
Reference Blake, Dobson and Ruschak2004; Yamamura Reference Yamamura2007).
$U^{crit}$
in comparison with ‘plunge coating’, where a solid substrate plunges into a liquid pool (Blake, Bracke & Shikhmurzaev Reference Blake, Bracke and Shikhmurzaev1999; Yamamura Reference Yamamura2007). Experimental observations show that the degree of hydrodynamic assist reaches its maximum (i.e. the largest critical speed) when the dynamic contact line (DCL) is right beneath the liquid curtain, which leads to a strong hydrodynamic pressure near the DCL as the liquid impacts the substrate (Blake et al.
Reference Blake, Clarke and Ruschak1994; Miyamoto & Katagiri Reference Miyamoto, Katagiri, Kistler and Schweizer1997; Blake et al.
Reference Blake, Bracke and Shikhmurzaev1999; Yamamura et al.
Reference Yamamura, Suematsu, Kajiwara and Adachi2000; Blake et al.
Reference Blake, Dobson and Ruschak2004; Yamamura Reference Yamamura2007).
Flow visualizations near the DCL show that manipulating
 $V$
(at a given substrate speed
$V$
(at a given substrate speed
 $U$
) can also lead to a reduction in the dynamic contact angle
$U$
) can also lead to a reduction in the dynamic contact angle
 $\unicode[STIX]{x1D703}_{D}$
, the observed angle between the fluid interface and the substrate at the DCL (figure 1
a) (Blake et al.
Reference Blake, Bracke and Shikhmurzaev1999, Reference Blake, Dobson and Ruschak2004; Clarke & Stattersfield Reference Clarke and Stattersfield2006; Decent Reference Decent2008). To study the origin of the reduction in
$\unicode[STIX]{x1D703}_{D}$
, the observed angle between the fluid interface and the substrate at the DCL (figure 1
a) (Blake et al.
Reference Blake, Bracke and Shikhmurzaev1999, Reference Blake, Dobson and Ruschak2004; Clarke & Stattersfield Reference Clarke and Stattersfield2006; Decent Reference Decent2008). To study the origin of the reduction in
 $\unicode[STIX]{x1D703}_{D}$
, Wilson et al. (Reference Wilson, Summers, Gaskell, Shikhmurzaev, King and Shikhmurzaev2001, Reference Wilson, Summers, Shikhmurzaev, Clarke and Blake2006) developed a hydrodynamic model for curtain coating with a fixed microscopic contact angle
$\unicode[STIX]{x1D703}_{D}$
, Wilson et al. (Reference Wilson, Summers, Gaskell, Shikhmurzaev, King and Shikhmurzaev2001, Reference Wilson, Summers, Shikhmurzaev, Clarke and Blake2006) developed a hydrodynamic model for curtain coating with a fixed microscopic contact angle
 $\unicode[STIX]{x1D703}_{mic}$
prescribed at the DCL. Note that
$\unicode[STIX]{x1D703}_{mic}$
prescribed at the DCL. Note that
 $\unicode[STIX]{x1D703}_{mic}$
serves as a boundary condition at the DCL and influences the free-surface shape (Blake Reference Blake2006; Snoeijer & Andreotti Reference Snoeijer and Andreotti2013).
$\unicode[STIX]{x1D703}_{mic}$
serves as a boundary condition at the DCL and influences the free-surface shape (Blake Reference Blake2006; Snoeijer & Andreotti Reference Snoeijer and Andreotti2013).
Their model prediction (Wilson et al.
Reference Wilson, Summers, Gaskell, Shikhmurzaev, King and Shikhmurzaev2001, Reference Wilson, Summers, Shikhmurzaev, Clarke and Blake2006) shows that the reduction in the apparent contact angle (i.e. interface angle calculated
 $20~\unicode[STIX]{x03BC}\text{m}$
away from the DCL in their model and assumed to be equal to
$20~\unicode[STIX]{x03BC}\text{m}$
away from the DCL in their model and assumed to be equal to
 $\unicode[STIX]{x1D703}_{D}$
) is much smaller than the reduction in
$\unicode[STIX]{x1D703}_{D}$
) is much smaller than the reduction in
 $\unicode[STIX]{x1D703}_{D}$
observed experimentally by Blake et al. (Reference Blake, Bracke and Shikhmurzaev1999). Therefore, Wilson et al. (Reference Wilson, Summers, Gaskell, Shikhmurzaev, King and Shikhmurzaev2001, Reference Wilson, Summers, Shikhmurzaev, Clarke and Blake2006) claimed that
$\unicode[STIX]{x1D703}_{D}$
observed experimentally by Blake et al. (Reference Blake, Bracke and Shikhmurzaev1999). Therefore, Wilson et al. (Reference Wilson, Summers, Gaskell, Shikhmurzaev, King and Shikhmurzaev2001, Reference Wilson, Summers, Shikhmurzaev, Clarke and Blake2006) claimed that
 $\unicode[STIX]{x1D703}_{mic}$
is not a constant and must depend on parameters controlling the overall flow (e.g. curtain height
$\unicode[STIX]{x1D703}_{mic}$
is not a constant and must depend on parameters controlling the overall flow (e.g. curtain height
 $h_{curt}$
and feed flow rate
$h_{curt}$
and feed flow rate
 $Q=wV$
). However, their hydrodynamic model does not consider the contribution of air stresses and, as a consequence, cannot predict a critical speed for wetting failure. As we will discuss below, air stresses are essential for determining the shape of the fluid interface and predicting wetting failure (Chan et al.
Reference Chan, Srivastava, Marchand, Andreotti, Biferale, Toschi and Snoeijer2013; Vandre, Carvalho & Kumar Reference Vandre, Carvalho and Kumar2013; Vandre et al.
Reference Vandre, Carvalho and Kumar2014).
$Q=wV$
). However, their hydrodynamic model does not consider the contribution of air stresses and, as a consequence, cannot predict a critical speed for wetting failure. As we will discuss below, air stresses are essential for determining the shape of the fluid interface and predicting wetting failure (Chan et al.
Reference Chan, Srivastava, Marchand, Andreotti, Biferale, Toschi and Snoeijer2013; Vandre, Carvalho & Kumar Reference Vandre, Carvalho and Kumar2013; Vandre et al.
Reference Vandre, Carvalho and Kumar2014).
Before proceeding, we note that there are several different ways to describe dynamic wetting phenomena (Blake Reference Blake2006; Snoeijer & Andreotti Reference Snoeijer and Andreotti2013; Sui, Ding & Spelt Reference Sui, Ding and Spelt2014; Blake et al.
Reference Blake, Fernandez-Toledano, Doyen and De Coninck2015). The first (and simplest) is to assume that
 $\unicode[STIX]{x1D703}_{mic}$
is constant, and that all variations in
$\unicode[STIX]{x1D703}_{mic}$
is constant, and that all variations in
 $\unicode[STIX]{x1D703}_{D}$
are due to bending of the fluid interface by viscous forces. The second is to assume that
$\unicode[STIX]{x1D703}_{D}$
are due to bending of the fluid interface by viscous forces. The second is to assume that
 $\unicode[STIX]{x1D703}_{mic}$
depends on substrate speed through a relationship like that obtained from the molecular kinetic theory of wetting. The third is to assume that
$\unicode[STIX]{x1D703}_{mic}$
depends on substrate speed through a relationship like that obtained from the molecular kinetic theory of wetting. The third is to assume that
 $\unicode[STIX]{x1D703}_{mic}$
depends on parameters controlling the overall flow, which is the approach of the interface formation model. Wilson et al. (Reference Wilson, Summers, Gaskell, Shikhmurzaev, King and Shikhmurzaev2001, Reference Wilson, Summers, Shikhmurzaev, Clarke and Blake2006) used the first approach and concluded that it cannot adequately describe the experimental observations. The conclusion of the present paper is that the first approach may be sufficient provided that air stresses are accounted for.
$\unicode[STIX]{x1D703}_{mic}$
depends on parameters controlling the overall flow, which is the approach of the interface formation model. Wilson et al. (Reference Wilson, Summers, Gaskell, Shikhmurzaev, King and Shikhmurzaev2001, Reference Wilson, Summers, Shikhmurzaev, Clarke and Blake2006) used the first approach and concluded that it cannot adequately describe the experimental observations. The conclusion of the present paper is that the first approach may be sufficient provided that air stresses are accounted for.
1.2 The role of air stresses
A common approach in previous computational studies of coating flows is to neglect the contribution of air stresses due to the low air viscosity (Kistler & Scriven Reference Kistler and Scriven1984; Christodoulou & Scriven Reference Christodoulou and Scriven1989; Wilson et al. Reference Wilson, Summers, Gaskell, Shikhmurzaev, King and Shikhmurzaev2001, Reference Wilson, Summers, Shikhmurzaev, Clarke and Blake2006; Nam & Carvalho Reference Nam and Carvalho2009). However, in our previous work on fluid displacement between two parallel plates (figure 1 b), we have shown the need to incorporate the air phase to accurately describe the displacement process and predict wetting failure (Vandre, Carvalho & Kumar Reference Vandre, Carvalho and Kumar2012; Vandre Reference Vandre2013; Vandre et al. Reference Vandre, Carvalho and Kumar2013, Reference Vandre, Carvalho and Kumar2014).
If air stresses are neglected in the model, 2D steady-state solutions can be obtained at any substrate speed, meaning that the onset of wetting failure (i.e. the critical substrate speed
 $U^{crit}$
) is completely missed (Vandre et al.
Reference Vandre, Carvalho and Kumar2013). By including the air-phase contribution to stress balances along the fluid interface, a limit point arises in the steady-state solution path (
$U^{crit}$
) is completely missed (Vandre et al.
Reference Vandre, Carvalho and Kumar2013). By including the air-phase contribution to stress balances along the fluid interface, a limit point arises in the steady-state solution path (
 $\unicode[STIX]{x1D703}_{D}$
versus
$\unicode[STIX]{x1D703}_{D}$
versus
 $U$
), indicating that 2D steady solutions do not exist beyond a critical substrate speed. This critical speed marks the onset of wetting failure (Vandre et al.
Reference Vandre, Carvalho and Kumar2013). A stress-gradient analysis revealed that wetting failure occurs when capillary-stress gradients generated by interfacial curvature can no longer provide the pressure gradients needed to pump air away from the DCL, a mechanism supported by experimental studies (Vandre et al.
Reference Vandre, Carvalho and Kumar2013, Reference Vandre, Carvalho and Kumar2014).
$U$
), indicating that 2D steady solutions do not exist beyond a critical substrate speed. This critical speed marks the onset of wetting failure (Vandre et al.
Reference Vandre, Carvalho and Kumar2013). A stress-gradient analysis revealed that wetting failure occurs when capillary-stress gradients generated by interfacial curvature can no longer provide the pressure gradients needed to pump air away from the DCL, a mechanism supported by experimental studies (Vandre et al.
Reference Vandre, Carvalho and Kumar2013, Reference Vandre, Carvalho and Kumar2014).
Notably, the geometry of curtain coating is significantly different from that of the parallel-plate system (figure 1). In the former geometry, liquid is fed from a coating die and creates two free surfaces (i.e. upstream and downstream fluid interfaces) as the liquid impacts the substrate. In the latter geometry, there is no feed flow and only one free surface between two plates. However, even though these two geometries are very different, they both feature a thin air layer (wedge) near the DCL during fluid displacement, especially near the onset of wetting failure. Therefore, our previous work on the parallel-plate system (Vandre et al. Reference Vandre, Carvalho and Kumar2013, Reference Vandre, Carvalho and Kumar2014) suggests that it will be important to consider the contribution of air stresses when modeling curtain coating.
1.3 Influence of surfactants
Surfactants are known to lower the surface tension
 $\unicode[STIX]{x1D70E}$
, and can also lower the static contact angle
$\unicode[STIX]{x1D70E}$
, and can also lower the static contact angle
 $\unicode[STIX]{x1D703}_{s}$
according to Young’s equation (Tricot Reference Tricot, Kistler and Schweizer1997). In addition, gradients in surfactant concentration can induce surface-tension gradients (i.e. Marangoni stresses), driving liquid from regions of low to high surface tension (Scriven & Sternling Reference Scriven and Sternling1960). Experimental results reported by Marston et al. (Reference Marston, Hawkins, Decent and Simmons2009) show that the addition of surfactant (sodium dodecyl sulphate) to glycerol/water mixtures significantly decreases the critical substrate speed
$\unicode[STIX]{x1D703}_{s}$
according to Young’s equation (Tricot Reference Tricot, Kistler and Schweizer1997). In addition, gradients in surfactant concentration can induce surface-tension gradients (i.e. Marangoni stresses), driving liquid from regions of low to high surface tension (Scriven & Sternling Reference Scriven and Sternling1960). Experimental results reported by Marston et al. (Reference Marston, Hawkins, Decent and Simmons2009) show that the addition of surfactant (sodium dodecyl sulphate) to glycerol/water mixtures significantly decreases the critical substrate speed
 $U^{crit}$
(up to 66.7 %) in curtain coating. In addition, the shape of the coating window (i.e. the parameter space within which the coating flow is steady and free of defects) is considerably modified, with the degree of hydrodynamic assist being greatly reduced by surfactants.
$U^{crit}$
(up to 66.7 %) in curtain coating. In addition, the shape of the coating window (i.e. the parameter space within which the coating flow is steady and free of defects) is considerably modified, with the degree of hydrodynamic assist being greatly reduced by surfactants.
Marston et al. (Reference Marston, Hawkins, Decent and Simmons2009) reported that, after the addition of surfactant, a twofold reduction in surface tension is observed but the liquid viscosity remains approximately the same. Since no non-Newtonian rheological behaviour is observed in the surfactant solutions, the change in the critical speed and the shape of the coating window suggests that surface-tension gradients (i.e. Marangoni stresses) may also play an important role. Our previous work with the parallel-plate system (figure 1
b) demonstrates that the presence of Marangoni stresses promotes the onset of wetting failure (i.e. decreases
 $U^{crit}$
) by thinning the air film between the fluid interface and the substrate (Liu et al.
Reference Liu, Vandre, Carvalho and Kumar2016). However, since the geometries of the parallel-plate system and curtain coating are significantly different, it is not obvious that the physical mechanisms relevant to the parallel-plate system still hold in curtain coating.
$U^{crit}$
) by thinning the air film between the fluid interface and the substrate (Liu et al.
Reference Liu, Vandre, Carvalho and Kumar2016). However, since the geometries of the parallel-plate system and curtain coating are significantly different, it is not obvious that the physical mechanisms relevant to the parallel-plate system still hold in curtain coating.
1.4 Overview of present paper
In this paper, a hydrodynamic model for curtain coating accounting for the receding air flow is developed. Since a full 2D description of both the liquid and air phases is computationally prohibitive, here we use a less computationally intense approach that combines a 2D description of the liquid and a one-dimensional (1D) description of the air near the DCL. The 1D description is motivated by the observation of a long and slender air film as the interface deforms near the onset of wetting failure (Kistler Reference Kistler and Berg1993; Marchand et al. Reference Marchand, Chan, Snoeijer and Andreotti2012; Vandre et al. Reference Vandre, Carvalho and Kumar2014). This hybrid approach was used in our previous work (Liu et al. Reference Liu, Vandre, Carvalho and Kumar2016) on the parallel-plate system (figure 1 b) and its predictions were shown to be in excellent agreement with those from calculations using full 2D descriptions of both the air and liquid phases. Here, the hybrid approach is applied to a considerably more complicated geometry (figure 1 a).
We solve this hybrid formulation of the hydrodynamic model with the Galerkin finite element method. By tracing steady-state solutions of the model as substrate speed increases, we can locate a critical substrate speed
 $U^{crit}$
beyond which 2D steady solutions do not exist. This critical condition corresponds to the onset of wetting failure and is characterized by a critical capillary number
$U^{crit}$
beyond which 2D steady solutions do not exist. This critical condition corresponds to the onset of wetting failure and is characterized by a critical capillary number
 $Ca^{crit}=\unicode[STIX]{x1D707}_{adv}U^{crit}/\unicode[STIX]{x1D70E}$
, where
$Ca^{crit}=\unicode[STIX]{x1D707}_{adv}U^{crit}/\unicode[STIX]{x1D70E}$
, where
 $\unicode[STIX]{x1D707}_{adv}$
is the viscosity of the advancing liquid and
$\unicode[STIX]{x1D707}_{adv}$
is the viscosity of the advancing liquid and
 $\unicode[STIX]{x1D70E}$
is the surface tension. Prior literature shows that the value of
$\unicode[STIX]{x1D70E}$
is the surface tension. Prior literature shows that the value of
 $Ca^{crit}$
depends on various factors such as fluid properties (Marston, Simmons & Decent Reference Marston, Simmons and Decent2007; Marchand et al.
Reference Marchand, Chan, Snoeijer and Andreotti2012; Sprittles Reference Sprittles2015), substrate properties (Benkreira Reference Benkreira2004; Vandre et al.
Reference Vandre, Carvalho and Kumar2013) and flow geometry (Blake et al.
Reference Blake, Bracke and Shikhmurzaev1999; Clarke & Stattersfield Reference Clarke and Stattersfield2006; Vandre et al.
Reference Vandre, Carvalho and Kumar2012, Reference Vandre, Carvalho and Kumar2014).
$Ca^{crit}$
depends on various factors such as fluid properties (Marston, Simmons & Decent Reference Marston, Simmons and Decent2007; Marchand et al.
Reference Marchand, Chan, Snoeijer and Andreotti2012; Sprittles Reference Sprittles2015), substrate properties (Benkreira Reference Benkreira2004; Vandre et al.
Reference Vandre, Carvalho and Kumar2013) and flow geometry (Blake et al.
Reference Blake, Bracke and Shikhmurzaev1999; Clarke & Stattersfield Reference Clarke and Stattersfield2006; Vandre et al.
Reference Vandre, Carvalho and Kumar2012, Reference Vandre, Carvalho and Kumar2014).
The objective of the present paper is to determine how
 $Ca^{crit}$
in curtain coating changes with the viscosity of the receding air
$Ca^{crit}$
in curtain coating changes with the viscosity of the receding air
 $\unicode[STIX]{x1D707}_{rec}$
(i.e. the strength of air stresses), feed flow rate
$\unicode[STIX]{x1D707}_{rec}$
(i.e. the strength of air stresses), feed flow rate
 $Q$
(i.e.
$Q$
(i.e.
 $V$
) and Marangoni stresses induced by surface-tension gradients. To examine how well the hydrodynamic model performs, we also compare our predictions of contact-angle behaviour with prior computational work by Wilson et al. (Reference Wilson, Summers, Gaskell, Shikhmurzaev, King and Shikhmurzaev2001, Reference Wilson, Summers, Shikhmurzaev, Clarke and Blake2006) and experimental work by Blake et al. (Reference Blake, Bracke and Shikhmurzaev1999). In addition, physical explanations of hydrodynamic assist and Marangoni effects on wetting failure are proposed using a stress-gradient analysis (Vandre et al.
Reference Vandre, Carvalho and Kumar2013; Liu et al.
Reference Liu, Vandre, Carvalho and Kumar2016).
$V$
) and Marangoni stresses induced by surface-tension gradients. To examine how well the hydrodynamic model performs, we also compare our predictions of contact-angle behaviour with prior computational work by Wilson et al. (Reference Wilson, Summers, Gaskell, Shikhmurzaev, King and Shikhmurzaev2001, Reference Wilson, Summers, Shikhmurzaev, Clarke and Blake2006) and experimental work by Blake et al. (Reference Blake, Bracke and Shikhmurzaev1999). In addition, physical explanations of hydrodynamic assist and Marangoni effects on wetting failure are proposed using a stress-gradient analysis (Vandre et al.
Reference Vandre, Carvalho and Kumar2013; Liu et al.
Reference Liu, Vandre, Carvalho and Kumar2016).
The mathematical formulation and solution method we use are described in § 2. In § 3, we discuss the influence of the receding phase and compare
 $Ca^{crit}$
in curtain coating and the parallel-plate system. Hydrodynamic assist in curtain coating and its physical mechanism are examined in § 4. The variation of contact angle with feed flow rate is the topic of § 5. Section 6 presents results on the influence of surfactants on wetting failure and the underlying physical mechanisms. Finally, a summary of our results is provided in § 7.
$Ca^{crit}$
in curtain coating and the parallel-plate system. Hydrodynamic assist in curtain coating and its physical mechanism are examined in § 4. The variation of contact angle with feed flow rate is the topic of § 5. Section 6 presents results on the influence of surfactants on wetting failure and the underlying physical mechanisms. Finally, a summary of our results is provided in § 7.
2 Hydrodynamic model
In curtain coating, liquid is fed from an elevated slot die (width
 $w$
and height
$w$
and height
 $h_{curt}$
) with an average downward feed flow velocity
$h_{curt}$
) with an average downward feed flow velocity
 $V$
onto a substrate moving at speed
$V$
onto a substrate moving at speed
 $U$
(figure 2). The liquid impacts the substrate at the DCL, whose position
$U$
(figure 2). The liquid impacts the substrate at the DCL, whose position
 $x_{DCL}$
depends on the problem parameters. The viscosities of the advancing (liquid) and the receding (air) fluids are denoted by
$x_{DCL}$
depends on the problem parameters. The viscosities of the advancing (liquid) and the receding (air) fluids are denoted by
 $\unicode[STIX]{x1D707}_{adv}$
and
$\unicode[STIX]{x1D707}_{adv}$
and
 $\unicode[STIX]{x1D707}_{rec}$
, respectively. The liquid density and surface tension are denoted by
$\unicode[STIX]{x1D707}_{rec}$
, respectively. The liquid density and surface tension are denoted by
 $\unicode[STIX]{x1D70C}$
and
$\unicode[STIX]{x1D70C}$
and
 $\unicode[STIX]{x1D70E}$
. Symbols
$\unicode[STIX]{x1D70E}$
. Symbols
 $x$
and
$x$
and
 $y$
represent the Cartesian coordinates, whose origin is right beneath the upstream tip of the slot die as indicated in figure 2. During steady wetting, a coating film with a uniform thickness
$y$
represent the Cartesian coordinates, whose origin is right beneath the upstream tip of the slot die as indicated in figure 2. During steady wetting, a coating film with a uniform thickness
 $h_{inf}=Q/U$
is formed over the moving substrate, where
$h_{inf}=Q/U$
is formed over the moving substrate, where
 $Q=wV$
is the liquid flow rate per unit width from the slot die. Note that the domain length
$Q=wV$
is the liquid flow rate per unit width from the slot die. Note that the domain length
 $l_{d}$
extends to approximately
$l_{d}$
extends to approximately
 $5h_{curt}$
downstream to obtain a well-developed flow in the coating film.
$5h_{curt}$
downstream to obtain a well-developed flow in the coating film.

Figure 2. Schematic of physical coating domain and illustration of interface characteristics near the DCL. The IP corresponds to the maximum interface angle, and its height and radial distance are characterized by
 $h_{f}$
and
$h_{f}$
and
 $r_{f}$
, respectively.
$r_{f}$
, respectively.
The schematic of the region near the DCL (figure 2) shows the difference between the microscopic contact angle
 $\unicode[STIX]{x1D703}_{mic}$
and the macroscopic contact angle
$\unicode[STIX]{x1D703}_{mic}$
and the macroscopic contact angle
 $\unicode[STIX]{x1D703}_{M}$
. The former angle (
$\unicode[STIX]{x1D703}_{M}$
. The former angle (
 $\unicode[STIX]{x1D703}_{mic}$
) is located at the place where the interface contacts the substrate and serves as a boundary condition in our model. In contrast, the latter one (
$\unicode[STIX]{x1D703}_{mic}$
) is located at the place where the interface contacts the substrate and serves as a boundary condition in our model. In contrast, the latter one (
 $\unicode[STIX]{x1D703}_{M}$
) is defined to be the maximum angle along the fluid interface and corresponds to the inflection point (IP) of the fluid interface. Note that
$\unicode[STIX]{x1D703}_{M}$
) is defined to be the maximum angle along the fluid interface and corresponds to the inflection point (IP) of the fluid interface. Note that
 $\unicode[STIX]{x1D703}_{M}$
does not necessarily equal the dynamic contact angle
$\unicode[STIX]{x1D703}_{M}$
does not necessarily equal the dynamic contact angle
 $\unicode[STIX]{x1D703}_{D}$
, the experimentally observed angle between the fluid interface and the substrate. The height of the IP and the radial distance from the DCL are denoted by
$\unicode[STIX]{x1D703}_{D}$
, the experimentally observed angle between the fluid interface and the substrate. The height of the IP and the radial distance from the DCL are denoted by
 $h_{f}$
and
$h_{f}$
and
 $r_{f}$
, respectively.
$r_{f}$
, respectively.
Since we are interested in the influence of Marangoni stresses on wetting failure, we will also consider the case where insoluble surfactants are present on the upstream fluid interface. We neglect the effect of surfactants on the downstream fluid interface because wetting failure occurs at the DCL.
2.1 Governing equations
The steady Navier–Stokes equations describe the velocity
 $\boldsymbol{v}$
and pressure
$\boldsymbol{v}$
and pressure
 $p$
in the liquid phase:
$p$
in the liquid phase:
 $$\begin{eqnarray}\unicode[STIX]{x1D735}\boldsymbol{\cdot }\boldsymbol{v}=0,\quad Re(\boldsymbol{v}\boldsymbol{\cdot }\unicode[STIX]{x1D735}\boldsymbol{v})=\unicode[STIX]{x1D6FB}^{2}\boldsymbol{v}-\unicode[STIX]{x1D735}p+(Bo/Ca)\boldsymbol{g}.\end{eqnarray}$$
The lengths, velocities and stresses are non-dimensionalized with the characteristic scales
 $Q/U$
,
$Q/U$
,
 $U$
and
$U$
and
 $\unicode[STIX]{x1D707}_{adv}U^{2}/Q$
, respectively. The Reynolds, capillary and Bond numbers are given by
$\unicode[STIX]{x1D707}_{adv}U^{2}/Q$
, respectively. The Reynolds, capillary and Bond numbers are given by
 $Re=\unicode[STIX]{x1D70C}Vw/\unicode[STIX]{x1D707}_{adv}$
,
$Re=\unicode[STIX]{x1D70C}Vw/\unicode[STIX]{x1D707}_{adv}$
,
 $Ca=\unicode[STIX]{x1D707}_{adv}U/\unicode[STIX]{x1D70E}$
and
$Ca=\unicode[STIX]{x1D707}_{adv}U/\unicode[STIX]{x1D70E}$
and
 $Bo=(\unicode[STIX]{x1D70C}g/\unicode[STIX]{x1D70E})(wV/U)^{2}$
, respectively. The gravitational acceleration is given by
$Bo=(\unicode[STIX]{x1D70C}g/\unicode[STIX]{x1D70E})(wV/U)^{2}$
, respectively. The gravitational acceleration is given by
 $\boldsymbol{g}=-g\boldsymbol{e}_{y}$
, where
$\boldsymbol{g}=-g\boldsymbol{e}_{y}$
, where
 $\boldsymbol{e}_{y}$
is the unit vector in the
$\boldsymbol{e}_{y}$
is the unit vector in the
 $y$
-direction.
$y$
-direction.
Near the DCL, the air phase is long and slender. Lubrication theory is thus applied to the air phase, resulting in a 1D description of the air flow (as described in our previous work (Vandre Reference Vandre2013; Liu et al. Reference Liu, Vandre, Carvalho and Kumar2016)):
 $$\begin{eqnarray}\displaystyle & \displaystyle Ah+\frac{1}{2}Bh^{2}+\frac{1}{6}\frac{\text{d}p}{\text{d}s}h^{3}=0, & \displaystyle\end{eqnarray}$$
 $$\begin{eqnarray}\displaystyle & \displaystyle \left.\frac{\unicode[STIX]{x2202}u}{\unicode[STIX]{x2202}y}\right|_{s}=B+\frac{\text{d}p}{\text{d}s}h\quad \text{where }A=\frac{\unicode[STIX]{x1D712}h+\unicode[STIX]{x1D712}\unicode[STIX]{x1D706}u_{s}-\frac{1}{2}(\text{d}p/\text{d}s)h^{2}\unicode[STIX]{x1D706}}{\unicode[STIX]{x1D706}+h},\quad B=\frac{-\unicode[STIX]{x1D712}+A}{\unicode[STIX]{x1D706}}, & \displaystyle\end{eqnarray}$$
where
 $h$
is the interface height,
$h$
is the interface height,
 $p$
is the air pressure,
$p$
is the air pressure,
 $u_{s}$
represents the horizontal interface velocity,
$u_{s}$
represents the horizontal interface velocity,
 $\unicode[STIX]{x1D706}=l_{slip}U/Q=l_{slip}/h_{inf}$
is a dimensionless slip length with
$\unicode[STIX]{x1D706}=l_{slip}U/Q=l_{slip}/h_{inf}$
is a dimensionless slip length with
 $l_{slip}$
being the dimensional slip length, and
$l_{slip}$
being the dimensional slip length, and
 $\unicode[STIX]{x1D712}=\unicode[STIX]{x1D707}_{rec}/\unicode[STIX]{x1D707}_{adv}$
is the viscosity ratio. The velocity gradient in (2.3) is evaluated at the interface. Note that the quasi-parallel (QP) approximation (
$\unicode[STIX]{x1D712}=\unicode[STIX]{x1D707}_{rec}/\unicode[STIX]{x1D707}_{adv}$
is the viscosity ratio. The velocity gradient in (2.3) is evaluated at the interface. Note that the quasi-parallel (QP) approximation (
 $\text{d}x\approx \text{d}s$
) is used in (2.2) and (2.3) to express pressure gradients with respect to the arclength coordinate
$\text{d}x\approx \text{d}s$
) is used in (2.2) and (2.3) to express pressure gradients with respect to the arclength coordinate
 $s$
along the interface (figure 2) (Jacqmin Reference Jacqmin2004; Sbragaglia, Sugiyama & Biferale Reference Sbragaglia, Sugiyama and Biferale2008).
$s$
along the interface (figure 2) (Jacqmin Reference Jacqmin2004; Sbragaglia, Sugiyama & Biferale Reference Sbragaglia, Sugiyama and Biferale2008).
The following set of dimensionless boundary conditions is applied along the upstream fluid interface:
 $$\begin{eqnarray}\displaystyle & \boldsymbol{v}|_{rec}=\boldsymbol{v}|_{adv}, & \displaystyle\end{eqnarray}$$
 $$\begin{eqnarray}\displaystyle & \boldsymbol{n}\boldsymbol{\cdot }\boldsymbol{v}=0, & \displaystyle\end{eqnarray}$$
 $$\begin{eqnarray}\displaystyle & M\unicode[STIX]{x1D735}_{\boldsymbol{s}}\unicode[STIX]{x1D70E}\boldsymbol{\cdot }\boldsymbol{t}=\boldsymbol{n}\boldsymbol{\cdot }\unicode[STIX]{x1D64F}\boldsymbol{\cdot }\boldsymbol{t}|_{adv}-\boldsymbol{n}\boldsymbol{\cdot }\unicode[STIX]{x1D64F}\boldsymbol{\cdot }\boldsymbol{t}|_{rec}, & \displaystyle\end{eqnarray}$$
 $$\begin{eqnarray}\displaystyle & \unicode[STIX]{x1D705}(1/Ca+\unicode[STIX]{x1D70E}M)=\boldsymbol{n}\boldsymbol{\cdot }\unicode[STIX]{x1D64F}\boldsymbol{\cdot }\boldsymbol{n}|_{adv}-\boldsymbol{n}\boldsymbol{\cdot }\unicode[STIX]{x1D64F}\boldsymbol{\cdot }\boldsymbol{n}|_{rec}. & \displaystyle\end{eqnarray}$$
Equations (2.4) and (2.5) represent the no-slip and no-penetration boundary conditions, and (2.6) and (2.7) are interfacial stress balances. At the fluid interface,
 $\boldsymbol{n}$
is the unit outward vector normal to the interface, and unit tangent vector
$\boldsymbol{n}$
is the unit outward vector normal to the interface, and unit tangent vector
 $\boldsymbol{t}$
points in the direction of increasing distance
$\boldsymbol{t}$
points in the direction of increasing distance
 $s$
along the interface (figure 2). Subscripts ‘
$s$
along the interface (figure 2). Subscripts ‘
 $adv$
’ and ‘
$adv$
’ and ‘
 $rec$
’ indicate properties in the advancing and receding phases, respectively.
$rec$
’ indicate properties in the advancing and receding phases, respectively.
In the stress balances,
 $\unicode[STIX]{x1D735}_{\boldsymbol{s}}\unicode[STIX]{x1D70E}$
denotes the surface-tension gradient along the interface,
$\unicode[STIX]{x1D735}_{\boldsymbol{s}}\unicode[STIX]{x1D70E}$
denotes the surface-tension gradient along the interface,
 $\unicode[STIX]{x1D705}$
represents the interface curvature, and
$\unicode[STIX]{x1D705}$
represents the interface curvature, and
 $\unicode[STIX]{x1D64F}$
is the Newtonian stress tensor. The Marangoni and capillary numbers are defined as
$\unicode[STIX]{x1D64F}$
is the Newtonian stress tensor. The Marangoni and capillary numbers are defined as
 $M=(\unicode[STIX]{x1D70E}_{o}-\unicode[STIX]{x1D70E}_{m})/\unicode[STIX]{x1D707}_{adv}U$
and
$M=(\unicode[STIX]{x1D70E}_{o}-\unicode[STIX]{x1D70E}_{m})/\unicode[STIX]{x1D707}_{adv}U$
and
 $Ca=\unicode[STIX]{x1D707}_{adv}U/\unicode[STIX]{x1D70E}_{m}$
. Here,
$Ca=\unicode[STIX]{x1D707}_{adv}U/\unicode[STIX]{x1D70E}_{m}$
. Here,
 $\unicode[STIX]{x1D70E}_{o}$
is the surface tension of the surfactant-free solution and
$\unicode[STIX]{x1D70E}_{o}$
is the surface tension of the surfactant-free solution and
 $\unicode[STIX]{x1D70E}_{m}$
is the surface tension corresponding to the mean surfactant concentration
$\unicode[STIX]{x1D70E}_{m}$
is the surface tension corresponding to the mean surfactant concentration
 $\unicode[STIX]{x1D6E4}_{m}$
at the interface. In the absence of surfactant,
$\unicode[STIX]{x1D6E4}_{m}$
at the interface. In the absence of surfactant,
 $\unicode[STIX]{x1D70E}_{o}=\unicode[STIX]{x1D70E}_{m}$
and the Marangoni stresses vanish (i.e.
$\unicode[STIX]{x1D70E}_{o}=\unicode[STIX]{x1D70E}_{m}$
and the Marangoni stresses vanish (i.e.
 $M=0$
).
$M=0$
).
At the downstream fluid interface, the no-slip and kinematic boundary conditions (2.4) and (2.5) are still valid. However, since the air flow near the downstream interface is not expected to have significant effects on wetting failure, the stress contribution from the air phase there is neglected. The stress balances at the downstream interface become:
 $$\begin{eqnarray}\displaystyle & \boldsymbol{n}\boldsymbol{\cdot }\unicode[STIX]{x1D64F}\boldsymbol{\cdot }\boldsymbol{t}|_{adv}=0, & \displaystyle\end{eqnarray}$$
 $$\begin{eqnarray}\displaystyle & \unicode[STIX]{x1D705}=Ca(\boldsymbol{n}\boldsymbol{\cdot }\unicode[STIX]{x1D64F}\boldsymbol{\cdot }\boldsymbol{n}|_{adv}+P_{amb}), & \displaystyle\end{eqnarray}$$
where
 $P_{amb}$
is the ambient pressure. As noted earlier, we neglect the effect of surfactants on the downstream fluid interface. Therefore, surface tension there remains constant, resulting in (2.8) and (2.9).
$P_{amb}$
is the ambient pressure. As noted earlier, we neglect the effect of surfactants on the downstream fluid interface. Therefore, surface tension there remains constant, resulting in (2.8) and (2.9).
To remove the stress singularity that would arise by applying the no-slip boundary condition at the DCL, a Navier slip boundary condition is applied along the moving substrate (Huh & Scriven Reference Huh and Scriven1971; Dussan Reference Dussan1976; Chan et al. Reference Chan, Srivastava, Marchand, Andreotti, Biferale, Toschi and Snoeijer2013; Sibley, Nold & Kalliadasis Reference Sibley, Nold and Kalliadasis2015):
 $$\begin{eqnarray}\boldsymbol{t}_{\boldsymbol{s}}\boldsymbol{\cdot }(\boldsymbol{v}-\boldsymbol{U})=\unicode[STIX]{x1D706}[\boldsymbol{n}_{\boldsymbol{s}}\boldsymbol{\cdot }\unicode[STIX]{x1D64F}\boldsymbol{\cdot }\boldsymbol{t}_{\boldsymbol{s}}],\end{eqnarray}$$
where
 $\unicode[STIX]{x1D706}$
is the dimensionless slip length defined earlier. Symbols
$\unicode[STIX]{x1D706}$
is the dimensionless slip length defined earlier. Symbols
 $\boldsymbol{n}_{\boldsymbol{s}}$
,
$\boldsymbol{n}_{\boldsymbol{s}}$
,
 $\boldsymbol{t}_{\boldsymbol{s}}$
and
$\boldsymbol{t}_{\boldsymbol{s}}$
and
 $\boldsymbol{U}$
correspond to the substrate’s normal, tangent and velocity vectors, respectively. This slip boundary condition is applied along the entire bottom substrate and is able to recover the no-slip condition (
$\boldsymbol{U}$
correspond to the substrate’s normal, tangent and velocity vectors, respectively. This slip boundary condition is applied along the entire bottom substrate and is able to recover the no-slip condition (
 $\boldsymbol{v}\rightarrow \boldsymbol{U}$
) for distances greater than
$\boldsymbol{v}\rightarrow \boldsymbol{U}$
) for distances greater than
 $l_{slip}$
away from the DCL. Although the slip length will in general have different values in the advancing and receding phases, for simplicity we assume here that it has the same value in both phases. This assumption has worked well in our previous work on the parallel-plate system (Vandre et al.
Reference Vandre, Carvalho and Kumar2012, Reference Vandre, Carvalho and Kumar2013, Reference Vandre, Carvalho and Kumar2014). Note that, in the vertical direction, the no-penetration condition is applied to the bottom boundary.
$l_{slip}$
away from the DCL. Although the slip length will in general have different values in the advancing and receding phases, for simplicity we assume here that it has the same value in both phases. This assumption has worked well in our previous work on the parallel-plate system (Vandre et al.
Reference Vandre, Carvalho and Kumar2012, Reference Vandre, Carvalho and Kumar2013, Reference Vandre, Carvalho and Kumar2014). Note that, in the vertical direction, the no-penetration condition is applied to the bottom boundary.
In the hydrodynamic model, the microscopic contact angle
 $\unicode[STIX]{x1D703}_{mic}$
serves as a boundary condition at the DCL to determine the free-surface shape (Blake Reference Blake2006; Snoeijer & Andreotti Reference Snoeijer and Andreotti2013). In general,
$\unicode[STIX]{x1D703}_{mic}$
serves as a boundary condition at the DCL to determine the free-surface shape (Blake Reference Blake2006; Snoeijer & Andreotti Reference Snoeijer and Andreotti2013). In general,
 $\unicode[STIX]{x1D703}_{mic}$
may depend on problem parameters such as the substrate speed, curtain height and feed flow rate (Kistler Reference Kistler and Berg1993; Shikhmurzaev Reference Shikhmurzaev1997; Sui et al.
Reference Sui, Ding and Spelt2014; Blake et al.
Reference Blake, Fernandez-Toledano, Doyen and De Coninck2015) (see § 1.1). Since we wish to isolate the influence of air stresses, we take the simplest view and assume
$\unicode[STIX]{x1D703}_{mic}$
may depend on problem parameters such as the substrate speed, curtain height and feed flow rate (Kistler Reference Kistler and Berg1993; Shikhmurzaev Reference Shikhmurzaev1997; Sui et al.
Reference Sui, Ding and Spelt2014; Blake et al.
Reference Blake, Fernandez-Toledano, Doyen and De Coninck2015) (see § 1.1). Since we wish to isolate the influence of air stresses, we take the simplest view and assume
 $\unicode[STIX]{x1D703}_{mic}$
to be equal to the static contact angle
$\unicode[STIX]{x1D703}_{mic}$
to be equal to the static contact angle
 $\unicode[STIX]{x1D703}_{s}$
(a fixed value) (Lowndes Reference Lowndes1980; Eggers Reference Eggers2005; Vandre et al.
Reference Vandre, Carvalho and Kumar2013; Sui et al.
Reference Sui, Ding and Spelt2014).
$\unicode[STIX]{x1D703}_{s}$
(a fixed value) (Lowndes Reference Lowndes1980; Eggers Reference Eggers2005; Vandre et al.
Reference Vandre, Carvalho and Kumar2013; Sui et al.
Reference Sui, Ding and Spelt2014).
2.2 Surfactant transport
A steady convection–diffusion equation describes insoluble surfactant transport along the upstream fluid interface:
 $$\begin{eqnarray}\unicode[STIX]{x1D735}_{\boldsymbol{s}}\boldsymbol{\cdot }(\boldsymbol{v}_{\boldsymbol{s}}\unicode[STIX]{x1D6E4})=\frac{1}{Pe}{\unicode[STIX]{x1D6FB}_{s}}^{2}\,\unicode[STIX]{x1D6E4},\end{eqnarray}$$
where
 $\unicode[STIX]{x1D735}_{\boldsymbol{s}}$
is the surface gradient operator and
$\unicode[STIX]{x1D735}_{\boldsymbol{s}}$
is the surface gradient operator and
 $\boldsymbol{v}_{\boldsymbol{s}}$
is the interface velocity. The surface Péclet number
$\boldsymbol{v}_{\boldsymbol{s}}$
is the interface velocity. The surface Péclet number
 $Pe=Vw/D_{s}$
is defined using the surface diffusion coefficient
$Pe=Vw/D_{s}$
is defined using the surface diffusion coefficient
 $D_{s}$
. The dimensionless surfactant concentration
$D_{s}$
. The dimensionless surfactant concentration
 $\unicode[STIX]{x1D6E4}$
is scaled with
$\unicode[STIX]{x1D6E4}$
is scaled with
 $K\unicode[STIX]{x1D6E4}_{m}$
, where
$K\unicode[STIX]{x1D6E4}_{m}$
, where
 $K$
represents a scaling factor (
$K$
represents a scaling factor (
 $K\gg 1$
) and
$K\gg 1$
) and
 $\unicode[STIX]{x1D6E4}_{m}$
is the mean surfactant concentration at the fluid interface. Because the flow along the interface carries surfactant towards the DCL, large concentration gradients arise there that are computationally prohibitive to resolve if we scale
$\unicode[STIX]{x1D6E4}_{m}$
is the mean surfactant concentration at the fluid interface. Because the flow along the interface carries surfactant towards the DCL, large concentration gradients arise there that are computationally prohibitive to resolve if we scale
 $\unicode[STIX]{x1D6E4}$
with
$\unicode[STIX]{x1D6E4}$
with
 $\unicode[STIX]{x1D6E4}_{m}$
only (i.e.
$\unicode[STIX]{x1D6E4}_{m}$
only (i.e.
 $K=1$
). As a result, we introduce a scaling factor
$K=1$
). As a result, we introduce a scaling factor
 $K$
and choose
$K$
and choose
 $K=500$
.
$K=500$
.
The surfactant transport equation (2.11) is coupled with the tangential stress balance (2.6) through an equation of state (Schunk & Scriven Reference Schunk, Scriven, Kistler and Schweizer1997). For simplicity, we assume that the surfactant concentration is dilute enough to apply a linear equation of state (Ramé Reference Ramé2001; Campana et al. Reference Campana, Di Paolo and Saita2004; Kumar & Matar Reference Kumar and Matar2004; Campana et al. Reference Campana, Ubal, Giavedoni and Saita2011):
 $$\begin{eqnarray}\unicode[STIX]{x1D70E}=1-\unicode[STIX]{x1D6E4}.\end{eqnarray}$$
Here, surface tension
 $\unicode[STIX]{x1D70E}$
has been non-dimensionalized using the relation
$\unicode[STIX]{x1D70E}$
has been non-dimensionalized using the relation
 $\unicode[STIX]{x1D70E}^{\prime }=\unicode[STIX]{x1D70E}_{m}+(\unicode[STIX]{x1D70E}_{o}-\unicode[STIX]{x1D70E}_{m})\unicode[STIX]{x1D70E}$
, where
$\unicode[STIX]{x1D70E}^{\prime }=\unicode[STIX]{x1D70E}_{m}+(\unicode[STIX]{x1D70E}_{o}-\unicode[STIX]{x1D70E}_{m})\unicode[STIX]{x1D70E}$
, where
 $\unicode[STIX]{x1D70E}^{\prime }$
represents the dimensional surface tension (Craster & Matar Reference Craster and Matar2009).
$\unicode[STIX]{x1D70E}^{\prime }$
represents the dimensional surface tension (Craster & Matar Reference Craster and Matar2009).
We assume that surfactants do not deposit onto the solid surfaces. As a result, no-flux boundary conditions
 $\boldsymbol{n}\boldsymbol{\cdot }\unicode[STIX]{x1D735}\unicode[STIX]{x1D6E4}=0$
are applied at the DCL and also the upstream tip of the slot die (figure 2). These boundary conditions require that a constraint of constant surfactant mass be applied:
$\boldsymbol{n}\boldsymbol{\cdot }\unicode[STIX]{x1D735}\unicode[STIX]{x1D6E4}=0$
are applied at the DCL and also the upstream tip of the slot die (figure 2). These boundary conditions require that a constraint of constant surfactant mass be applied:
 $$\begin{eqnarray}\int _{S}\unicode[STIX]{x1D6E4}\,\text{d}s=(1/K)S,\end{eqnarray}$$
where
 $S$
represents the total arclength of upstream fluid interface. Note that
$S$
represents the total arclength of upstream fluid interface. Note that
 $1/K$
in (2.13) results from scaling concentration by
$1/K$
in (2.13) results from scaling concentration by
 $K\unicode[STIX]{x1D6E4}_{m}$
.
$K\unicode[STIX]{x1D6E4}_{m}$
.
Surfactants can potentially influence the microscopic contact angle
 $\unicode[STIX]{x1D703}_{mic}$
and induce surface-tension gradients at the same time. To isolate the influence of Marangoni stresses on wetting failure, we assume that
$\unicode[STIX]{x1D703}_{mic}$
and induce surface-tension gradients at the same time. To isolate the influence of Marangoni stresses on wetting failure, we assume that
 $\unicode[STIX]{x1D703}_{mic}$
is neutral at the DCL (i.e.
$\unicode[STIX]{x1D703}_{mic}$
is neutral at the DCL (i.e.
 $\unicode[STIX]{x1D703}_{mic}=90^{\circ }$
) and remains unchanged by surfactants. In addition, when comparing curtain coating in the absence and presence of surfactants, the mean surface tensions
$\unicode[STIX]{x1D703}_{mic}=90^{\circ }$
) and remains unchanged by surfactants. In addition, when comparing curtain coating in the absence and presence of surfactants, the mean surface tensions
 $\unicode[STIX]{x1D70E}_{m}$
are kept the same.
$\unicode[STIX]{x1D70E}_{m}$
are kept the same.
2.3 Solution method
The Navier–Stokes equations (2.1a,b ), 1D description of the receding air flow (2.2), surfactant transport equation (2.11) and associated boundary and integral conditions (2.4)–(2.10), (2.12) and (2.13) are solved with the Galerkin finite element method. The liquid domain is partitioned into seven quadrangular regions and the air flow is only discretized in the 1D region (8) near the DCL (figure 3 a). Regions (8) and (9) represent the 1D domain on which surfactant transport along the upstream fluid interface is solved.
To solve the free-boundary problem, the physical domain (figure 3
a) is mapped to a computational domain whose coordinates are
 $\unicode[STIX]{x1D702}$
and
$\unicode[STIX]{x1D702}$
and
 $\unicode[STIX]{x1D709}$
(figure 3
b). The mapping function satisfies the elliptic mesh generation equations (Carvalho & Scriven Reference Carvalho and Scriven1997; Nam & Carvalho Reference Nam and Carvalho2009). Biquadratic basis functions are used for position and velocity variables, and linear discontinuous basis functions are used for pressure in the liquid phase. The air pressure and the surfactant concentration are also described by biquadratic basis functions.
$\unicode[STIX]{x1D709}$
(figure 3
b). The mapping function satisfies the elliptic mesh generation equations (Carvalho & Scriven Reference Carvalho and Scriven1997; Nam & Carvalho Reference Nam and Carvalho2009). Biquadratic basis functions are used for position and velocity variables, and linear discontinuous basis functions are used for pressure in the liquid phase. The air pressure and the surfactant concentration are also described by biquadratic basis functions.

Figure 3. Schematics of (a) the physical coating domain and (b) the computational domain composed of seven liquid regions (1)–(7), air region (8) and surfactant transport regions (8) and (9).
We found that mesh quality is best when the contact-line position
 $x_{DCL}$
(figure 3
a) is located directly underneath the upstream tip of the slot die (
$x_{DCL}$
(figure 3
a) is located directly underneath the upstream tip of the slot die (
 $x_{DCL}=0$
). When the DCL moves downstream (
$x_{DCL}=0$
). When the DCL moves downstream (
 $x_{DCL}>0$
), elements near the DCL are stretched as the curtain is pulled (appendix A). In contrast, when
$x_{DCL}>0$
), elements near the DCL are stretched as the curtain is pulled (appendix A). In contrast, when
 $x_{DCL}<0$
, elements are stretched both near the DCL and near the upstream interface, where the curtain contacts a liquid heel that forms (appendix A). These mesh distortions make it very difficult to obtain discretization-independent steady-state solutions as the substrate speed
$x_{DCL}<0$
, elements are stretched both near the DCL and near the upstream interface, where the curtain contacts a liquid heel that forms (appendix A). These mesh distortions make it very difficult to obtain discretization-independent steady-state solutions as the substrate speed
 $U$
increases (at a fixed feed flow velocity
$U$
increases (at a fixed feed flow velocity
 $V$
). To mitigate this numerical issue, we fix
$V$
). To mitigate this numerical issue, we fix
 $x_{DCL}$
(as a flow parameter) and calculate
$x_{DCL}$
(as a flow parameter) and calculate
 $V$
(as a dependent variable) as we trace solution paths to higher substrate speeds
$V$
(as a dependent variable) as we trace solution paths to higher substrate speeds
 $U$
(using first-order continuation). As expected,
$U$
(using first-order continuation). As expected,
 $V$
must increase as
$V$
must increase as
 $U$
increases to hold the DCL position fixed (appendix B).
$U$
increases to hold the DCL position fixed (appendix B).
Since the interface bends sharply near the DCL (figure 3
a), a larger number of elements near the DCL is required to resolve large gradients in the interface curvature. These gradients become larger as
 $Ca$
increases. As a consequence, we found that element sizes near the DCL need to be less than
$Ca$
increases. As a consequence, we found that element sizes near the DCL need to be less than
 $10^{-3}l_{slip}$
to obtain mesh-independent solutions. Convergence is tested by systematically varying the number of elements to verify that solutions are mesh-independent (i.e. less than 2 % variation in
$10^{-3}l_{slip}$
to obtain mesh-independent solutions. Convergence is tested by systematically varying the number of elements to verify that solutions are mesh-independent (i.e. less than 2 % variation in
 $Ca^{crit}$
predicted from solution paths in § 3).
$Ca^{crit}$
predicted from solution paths in § 3).
2.4 Model parameters
Because we are most interested in how flow behaviour changes as the substrate speed increases for fixed fluid properties, it is convenient to choose a representative set of dimensional parameters. Motivated by experimental data, we take
 $\unicode[STIX]{x1D707}_{adv}=25~\text{cP}$
,
$\unicode[STIX]{x1D707}_{adv}=25~\text{cP}$
,
 $\unicode[STIX]{x1D707}_{rec}=0.018~\text{cP}$
,
$\unicode[STIX]{x1D707}_{rec}=0.018~\text{cP}$
,
 $\unicode[STIX]{x1D70E}=70~\text{mN}~\text{m}^{-1}$
and
$\unicode[STIX]{x1D70E}=70~\text{mN}~\text{m}^{-1}$
and
 $\unicode[STIX]{x1D70C}=1000~\text{kg}~\text{m}^{-3}$
. In addition, since we would like to isolate the effects of substrate speed and feed flow rate, we assume a neutral microscopic contact angle of
$\unicode[STIX]{x1D70C}=1000~\text{kg}~\text{m}^{-3}$
. In addition, since we would like to isolate the effects of substrate speed and feed flow rate, we assume a neutral microscopic contact angle of
 $\unicode[STIX]{x1D703}_{mic}=90^{\circ }$
. We note that, even for this value of
$\unicode[STIX]{x1D703}_{mic}=90^{\circ }$
. We note that, even for this value of
 $\unicode[STIX]{x1D703}_{mic}$
, predictions of the hybrid model for the parallel-plate geometry are in excellent agreement with results from a model that uses a full 2D description of both the air and liquid phases (Liu et al.
Reference Liu, Vandre, Carvalho and Kumar2016). For this reason, we expect that a 1D description of the air flow is sufficient for accurately describing the behaviour of curtain coating.
$\unicode[STIX]{x1D703}_{mic}$
, predictions of the hybrid model for the parallel-plate geometry are in excellent agreement with results from a model that uses a full 2D description of both the air and liquid phases (Liu et al.
Reference Liu, Vandre, Carvalho and Kumar2016). For this reason, we expect that a 1D description of the air flow is sufficient for accurately describing the behaviour of curtain coating.
To avoid the prohibitive computational costs that come with having too large a flow domain, we fix the curtain height at
 $h_{curt}=1~\text{cm}$
. Although this is smaller than typical curtain heights (
$h_{curt}=1~\text{cm}$
. Although this is smaller than typical curtain heights (
 ${\sim}2{-}25~\text{cm}$
), we expect that the results reported here will show the same qualitative behaviour as results for larger curtain heights.
${\sim}2{-}25~\text{cm}$
), we expect that the results reported here will show the same qualitative behaviour as results for larger curtain heights.
Since smaller values of the slip length mean more elements near the DCL and a higher computational cost, a relatively large slip length
 $l_{slip}=10^{-5}~\text{m}$
is selected for numerical convenience. Other runs we have performed (not shown here) and our previous work with the parallel-plate geometry (Liu et al.
Reference Liu, Vandre, Carvalho and Kumar2016) indicate that an increase in the slip length only increases the
$l_{slip}=10^{-5}~\text{m}$
is selected for numerical convenience. Other runs we have performed (not shown here) and our previous work with the parallel-plate geometry (Liu et al.
Reference Liu, Vandre, Carvalho and Kumar2016) indicate that an increase in the slip length only increases the
 $Ca^{crit}$
values without changing the qualitative nature of the solutions. We note that our choice of
$Ca^{crit}$
values without changing the qualitative nature of the solutions. We note that our choice of
 $l_{slip}$
leads to a situation where the slip length is larger than the thickness of the air film. However, this was also the case in our previous work on the parallel-plate system (Vandre et al.
Reference Vandre, Carvalho and Kumar2013), yet the hydrodynamic model yielded predictions consistent with key experimental observations. This suggests that slip in the air phase, while necessary to include, may not play a dominant role in determining the main aspects of dynamic wetting failure for the flows considered in Vandre et al. (Reference Vandre, Carvalho and Kumar2013).
$l_{slip}$
leads to a situation where the slip length is larger than the thickness of the air film. However, this was also the case in our previous work on the parallel-plate system (Vandre et al.
Reference Vandre, Carvalho and Kumar2013), yet the hydrodynamic model yielded predictions consistent with key experimental observations. This suggests that slip in the air phase, while necessary to include, may not play a dominant role in determining the main aspects of dynamic wetting failure for the flows considered in Vandre et al. (Reference Vandre, Carvalho and Kumar2013).
We consider values of
 $U$
(substrate speed) from
$U$
(substrate speed) from
 ${\sim}0.1$
to
${\sim}0.1$
to
 $10~\text{m}~\text{s}^{-1}$
and
$10~\text{m}~\text{s}^{-1}$
and
 $V$
(feed flow velocity) from
$V$
(feed flow velocity) from
 ${\sim}0.1$
to
${\sim}0.1$
to
 $1~\text{m}~\text{s}^{-1}$
, and take the slot width
$1~\text{m}~\text{s}^{-1}$
, and take the slot width
 $w$
to be 1 mm. With the parameter choices listed above, this yields values of
$w$
to be 1 mm. With the parameter choices listed above, this yields values of
 $h_{inf}$
from
$h_{inf}$
from
 ${\sim}0.1$
to 1 mm (appendix B). In addition,
${\sim}0.1$
to 1 mm (appendix B). In addition,
 $Ca$
varies from
$Ca$
varies from
 ${\sim}0.1$
to 2.5,
${\sim}0.1$
to 2.5,
 $Re$
varies from
$Re$
varies from
 ${\sim}1$
to 40,
${\sim}1$
to 40,
 $Bo$
varies from
$Bo$
varies from
 ${\sim}10^{-3}$
to
${\sim}10^{-3}$
to
 $10^{-1}$
, and the dimensionless slip length
$10^{-1}$
, and the dimensionless slip length
 $\unicode[STIX]{x1D706}$
varies from
$\unicode[STIX]{x1D706}$
varies from
 ${\sim}10^{-2}$
to
${\sim}10^{-2}$
to
 $10^{-1}$
. Note that, since the liquid properties are fixed,
$10^{-1}$
. Note that, since the liquid properties are fixed,
 $Ca$
,
$Ca$
,
 $Re$
,
$Re$
,
 $Bo$
and
$Bo$
and
 $\unicode[STIX]{x1D706}$
change as the substrate speed and feed flow velocity are varied.
$\unicode[STIX]{x1D706}$
change as the substrate speed and feed flow velocity are varied.
3 Influence of receding phase and comparison with parallel-plate system
In this section, the influence of the receding phase on wetting failure in curtain coating is studied. A comparison of the critical capillary number
 $Ca^{crit}$
is also made between curtain coating and the parallel-plate system examined in our previous work (Vandre et al.
Reference Vandre, Carvalho and Kumar2012, Reference Vandre, Carvalho and Kumar2013, Reference Vandre, Carvalho and Kumar2014; Liu et al.
Reference Liu, Vandre, Carvalho and Kumar2016) (figure 1
b) to demonstrate the influence of the curtain flow on the onset of wetting failure.
$Ca^{crit}$
is also made between curtain coating and the parallel-plate system examined in our previous work (Vandre et al.
Reference Vandre, Carvalho and Kumar2012, Reference Vandre, Carvalho and Kumar2013, Reference Vandre, Carvalho and Kumar2014; Liu et al.
Reference Liu, Vandre, Carvalho and Kumar2016) (figure 1
b) to demonstrate the influence of the curtain flow on the onset of wetting failure.
The macroscopic contact angles
 $\unicode[STIX]{x1D703}_{M}$
(figure 2) are determined as a function of the capillary number
$\unicode[STIX]{x1D703}_{M}$
(figure 2) are determined as a function of the capillary number
 $Ca$
to construct steady-state solution paths (figure 4
a). Solution paths are computed for zero and non-zero viscosity ratios
$Ca$
to construct steady-state solution paths (figure 4
a). Solution paths are computed for zero and non-zero viscosity ratios
 $\unicode[STIX]{x1D712}=\unicode[STIX]{x1D707}_{rec}/\unicode[STIX]{x1D707}_{adv}$
in curtain coating to demonstrate the influence of the viscosity in the receding phase
$\unicode[STIX]{x1D712}=\unicode[STIX]{x1D707}_{rec}/\unicode[STIX]{x1D707}_{adv}$
in curtain coating to demonstrate the influence of the viscosity in the receding phase
 $\unicode[STIX]{x1D707}_{rec}$
.
$\unicode[STIX]{x1D707}_{rec}$
.

Figure 4. (a) Solution paths for various viscosity ratio
 $\unicode[STIX]{x1D712}$
values,
$\unicode[STIX]{x1D712}$
values,
 $\unicode[STIX]{x1D712}=10^{-2}$
(blue squares),
$\unicode[STIX]{x1D712}=10^{-2}$
(blue squares),
 $\unicode[STIX]{x1D712}=7.2\times 10^{-4}$
(black diamonds) and
$\unicode[STIX]{x1D712}=7.2\times 10^{-4}$
(black diamonds) and
 $\unicode[STIX]{x1D712}=0$
(green circles), in curtain coating. Inset: solution paths for
$\unicode[STIX]{x1D712}=0$
(green circles), in curtain coating. Inset: solution paths for
 $\unicode[STIX]{x1D712}=7.2\times 10^{-4}$
in curtain coating (black diamonds) and the parallel-plate system (red triangles). (b) Magnitude of stress gradients at the interface IP for curtain coating (black diamonds) and the parallel-plate system (red triangles) for
$\unicode[STIX]{x1D712}=7.2\times 10^{-4}$
in curtain coating (black diamonds) and the parallel-plate system (red triangles). (b) Magnitude of stress gradients at the interface IP for curtain coating (black diamonds) and the parallel-plate system (red triangles) for
 $\unicode[STIX]{x1D712}=7.2\times 10^{-4}$
. The capillary-stress gradients (filled symbols) match the air-pressure gradients (open symbols) at
$\unicode[STIX]{x1D712}=7.2\times 10^{-4}$
. The capillary-stress gradients (filled symbols) match the air-pressure gradients (open symbols) at
 $Ca^{crit}$
values denoted by dotted lines. Values of other parameters are
$Ca^{crit}$
values denoted by dotted lines. Values of other parameters are
 $x_{DCL}=0$
and
$x_{DCL}=0$
and
 $\unicode[STIX]{x1D703}_{mic}=90^{\circ }$
. For the parallel-plate system, the scaled slip length
$\unicode[STIX]{x1D703}_{mic}=90^{\circ }$
. For the parallel-plate system, the scaled slip length
 $\unicode[STIX]{x1D706}=10^{-2}$
. For curtain coating when
$\unicode[STIX]{x1D706}=10^{-2}$
. For curtain coating when
 $\unicode[STIX]{x1D712}=7.2\times 10^{-4}$
,
$\unicode[STIX]{x1D712}=7.2\times 10^{-4}$
,
 $\unicode[STIX]{x1D706}$
varies from 0.0096 to 0.095 as
$\unicode[STIX]{x1D706}$
varies from 0.0096 to 0.095 as
 $Ca$
increases.
$Ca$
increases.
For
 $\unicode[STIX]{x1D712}>0$
(
$\unicode[STIX]{x1D712}>0$
(
 $\unicode[STIX]{x1D712}=10^{-2}$
, blue squares, and
$\unicode[STIX]{x1D712}=10^{-2}$
, blue squares, and
 $7.2\times 10^{-4}$
, black diamonds),
$7.2\times 10^{-4}$
, black diamonds),
 $\unicode[STIX]{x1D703}_{M}$
increases with
$\unicode[STIX]{x1D703}_{M}$
increases with
 $Ca$
until reaching a limit point at a critical capillary number
$Ca$
until reaching a limit point at a critical capillary number
 $Ca^{crit}$
(figure 4
a). Beyond this
$Ca^{crit}$
(figure 4
a). Beyond this
 $Ca^{crit}$
value (
$Ca^{crit}$
value (
 $Ca>Ca^{crit}$
), we are unable to find any 2D steady-state solutions. We assume that this corresponds to the point where the system develops 3D or transient flows resulting in wetting failure (Ledesma-Aguilar, Hernandez-Machado & Pagonabarraga Reference Ledesma-Aguilar, Hernandez-Machado and Pagonabarraga2013; Vandre et al.
Reference Vandre, Carvalho and Kumar2013). However, if the receding air is not accounted for (
$Ca>Ca^{crit}$
), we are unable to find any 2D steady-state solutions. We assume that this corresponds to the point where the system develops 3D or transient flows resulting in wetting failure (Ledesma-Aguilar, Hernandez-Machado & Pagonabarraga Reference Ledesma-Aguilar, Hernandez-Machado and Pagonabarraga2013; Vandre et al.
Reference Vandre, Carvalho and Kumar2013). However, if the receding air is not accounted for (
 $\unicode[STIX]{x1D712}=0$
, green circles), the system appears to maintain steady 2D wetting with
$\unicode[STIX]{x1D712}=0$
, green circles), the system appears to maintain steady 2D wetting with
 $\unicode[STIX]{x1D703}_{M}\rightarrow 180^{\circ }$
as the substrate speed approaches infinity (
$\unicode[STIX]{x1D703}_{M}\rightarrow 180^{\circ }$
as the substrate speed approaches infinity (
 $Ca\rightarrow \infty$
). Similar behaviour is also predicted in fluid displacement between parallel plates (Vandre et al.
Reference Vandre, Carvalho and Kumar2013) and in plunge coating (Benkreira & Khan Reference Benkreira and Khan2008; Benkreira & Ikin Reference Benkreira and Ikin2010).
$Ca\rightarrow \infty$
). Similar behaviour is also predicted in fluid displacement between parallel plates (Vandre et al.
Reference Vandre, Carvalho and Kumar2013) and in plunge coating (Benkreira & Khan Reference Benkreira and Khan2008; Benkreira & Ikin Reference Benkreira and Ikin2010).
Figure 4(a) clearly demonstrates the influence of the receding flow on the
 $Ca^{crit}$
values. With a high-viscosity receding gas (
$Ca^{crit}$
values. With a high-viscosity receding gas (
 $\unicode[STIX]{x1D712}=10^{-2}$
), the system tends to have wetting failure at a smaller substrate speed, which is consistent with prior studies in parallel-plate geometries (Sbragaglia et al.
Reference Sbragaglia, Sugiyama and Biferale2008; Chan et al.
Reference Chan, Srivastava, Marchand, Andreotti, Biferale, Toschi and Snoeijer2013; Vandre Reference Vandre2013; Vandre et al.
Reference Vandre, Carvalho and Kumar2013). However, the onset of wetting failure is completely missed when neglecting stress contributions from the receding phase (
$\unicode[STIX]{x1D712}=10^{-2}$
), the system tends to have wetting failure at a smaller substrate speed, which is consistent with prior studies in parallel-plate geometries (Sbragaglia et al.
Reference Sbragaglia, Sugiyama and Biferale2008; Chan et al.
Reference Chan, Srivastava, Marchand, Andreotti, Biferale, Toschi and Snoeijer2013; Vandre Reference Vandre2013; Vandre et al.
Reference Vandre, Carvalho and Kumar2013). However, the onset of wetting failure is completely missed when neglecting stress contributions from the receding phase (
 $\unicode[STIX]{x1D712}=0$
). Therefore, it is crucial to incorporate the stresses from the receding phase to even predict the onset of wetting failure in curtain coating. Although curtain coating has been studied in previous work (Kistler Reference Kistler1985; Miyamoto & Katagiri Reference Miyamoto, Katagiri, Kistler and Schweizer1997; Wilson et al.
Reference Wilson, Summers, Shikhmurzaev, Clarke and Blake2006; Lukyanov & Shikhmurzaev Reference Lukyanov and Shikhmurzaev2007; Decent Reference Decent2008), to the best of the authors’ knowledge this is the first work that predicts the onset of wetting failure in this important flow.
$\unicode[STIX]{x1D712}=0$
). Therefore, it is crucial to incorporate the stresses from the receding phase to even predict the onset of wetting failure in curtain coating. Although curtain coating has been studied in previous work (Kistler Reference Kistler1985; Miyamoto & Katagiri Reference Miyamoto, Katagiri, Kistler and Schweizer1997; Wilson et al.
Reference Wilson, Summers, Shikhmurzaev, Clarke and Blake2006; Lukyanov & Shikhmurzaev Reference Lukyanov and Shikhmurzaev2007; Decent Reference Decent2008), to the best of the authors’ knowledge this is the first work that predicts the onset of wetting failure in this important flow.
As mentioned in § 1.2, the flows in curtain coating and the parallel-plate system are significantly different. The main difference lies in the impinging liquid curtain, which may lead to high hydrodynamic pressure near the DCL (figure 1). The inset of figure 4(a) demonstrates the influence of the liquid curtain on
 $Ca^{crit}$
and
$Ca^{crit}$
and
 $\unicode[STIX]{x1D703}_{M}$
. At this particular set of conditions, the critical capillary number in curtain coating is almost twice that obtained in the parallel-plate system. (Inertial and gravitational effects are neglected in the parallel-plate system. For curtain coating,
$\unicode[STIX]{x1D703}_{M}$
. At this particular set of conditions, the critical capillary number in curtain coating is almost twice that obtained in the parallel-plate system. (Inertial and gravitational effects are neglected in the parallel-plate system. For curtain coating,
 $Re=30.37$
and
$Re=30.37$
and
 $Bo=1.54\times 10^{-3}$
at
$Bo=1.54\times 10^{-3}$
at
 $Ca=Ca^{crit}$
.)
$Ca=Ca^{crit}$
.)
This delay in the onset of wetting failure in curtain coating agrees with prior experimental observations: by manipulating the flow in curtain coating, the critical coating speed (i.e. air entrainment) is delayed and the dynamic contact angles are reduced in comparison with plunge coating (Blake et al. Reference Blake, Clarke and Ruschak1994, Reference Blake, Bracke and Shikhmurzaev1999, Reference Blake, Dobson and Ruschak2004; Yamamura Reference Yamamura2007). The term ‘hydrodynamic assist’ is used to describe the delay of air entrainment caused by manipulation of the flow (§ 1.1) (Blake et al. Reference Blake, Clarke and Ruschak1994). In § 4, we will propose a physical explanation of hydrodynamic assist by using a stress-gradient analysis near the DCL.
Although the values of the dimensionless slip lengths are comparable in the two systems, their definitions are not the same (one is scaled by the gap width
 $H$
between the two plates (figure 1) and the other is scaled by
$H$
between the two plates (figure 1) and the other is scaled by
 $Q/U$
). Therefore, to study the mechanism of hydrodynamic assist, the analysis in § 4 will only focus on curtain coating.
$Q/U$
). Therefore, to study the mechanism of hydrodynamic assist, the analysis in § 4 will only focus on curtain coating.
In prior work on wetting failure in the parallel-plate geometry, we proposed that wetting failure occurs when capillary-stress gradients can no longer provide the pressure gradient required to pump the receding fluid away from the DCL (Vandre et al.
Reference Vandre, Carvalho and Kumar2013). To examine whether this wetting failure mechanism is still valid in curtain coating, capillary-stress gradients (filled symbols) and air-pressure gradients (open symbols) at the interface IP in curtain coating (black diamonds) and the parallel-plate system (red triangles) are plotted as a function of
 $Ca$
in figure 4(b). The critical capillary number
$Ca$
in figure 4(b). The critical capillary number
 $Ca^{crit}$
in each system corresponds to the flow condition where the capillary-stress and air-pressure gradients match, indicating that the physical mechanisms that govern wetting failure in both systems are similar despite the significant difference in geometry and flow fields. Note that the pressure gradient in the receding phase grows faster than the capillary-stress gradient as
$Ca^{crit}$
in each system corresponds to the flow condition where the capillary-stress and air-pressure gradients match, indicating that the physical mechanisms that govern wetting failure in both systems are similar despite the significant difference in geometry and flow fields. Note that the pressure gradient in the receding phase grows faster than the capillary-stress gradient as
 $Ca$
increases, thereby imposing a limitation to dynamic wetting.
$Ca$
increases, thereby imposing a limitation to dynamic wetting.
Use of lubrication theory and the slip boundary condition yields the prediction that the magnitude of the capillary-stress gradient
 ${\sim}r_{f}^{-1}$
, where
${\sim}r_{f}^{-1}$
, where
 $r_{f}$
is the distance to the IP (figure 2) (Vandre et al.
Reference Vandre, Carvalho and Kumar2013; Liu et al.
Reference Liu, Vandre, Carvalho and Kumar2016). This scaling is obeyed by the data from the parallel-plate system, but the data from curtain coating show a stronger dependence on the IP location (
$r_{f}$
is the distance to the IP (figure 2) (Vandre et al.
Reference Vandre, Carvalho and Kumar2013; Liu et al.
Reference Liu, Vandre, Carvalho and Kumar2016). This scaling is obeyed by the data from the parallel-plate system, but the data from curtain coating show a stronger dependence on the IP location (
 ${\sim}r_{f}^{-1.5}$
) (figure 4
b). In both systems, the air-pressure gradient
${\sim}r_{f}^{-1.5}$
) (figure 4
b). In both systems, the air-pressure gradient
 ${\sim}h_{f}^{-2}$
(figure 4
b), where
${\sim}h_{f}^{-2}$
(figure 4
b), where
 $h_{f}$
is the IP height, consistent with lubrication theory (Vandre et al.
Reference Vandre, Carvalho and Kumar2013; Liu et al.
Reference Liu, Vandre, Carvalho and Kumar2016). The stronger dependence of the capillary-stress gradient on the IP location in curtain coating can be attributed to the hydrodynamic pressure exerted by the impinging curtain (see § 4 for more details).
$h_{f}$
is the IP height, consistent with lubrication theory (Vandre et al.
Reference Vandre, Carvalho and Kumar2013; Liu et al.
Reference Liu, Vandre, Carvalho and Kumar2016). The stronger dependence of the capillary-stress gradient on the IP location in curtain coating can be attributed to the hydrodynamic pressure exerted by the impinging curtain (see § 4 for more details).
4 Hydrodynamic assist in curtain coating
As mentioned in § 1.1, hydrodynamic assist is the manipulation of curtain coating to assist dynamic wetting and delay the onset of wetting failure (i.e. air entrainment) (Blake et al.
Reference Blake, Clarke and Ruschak1994; Miyamoto & Katagiri Reference Miyamoto, Katagiri, Kistler and Schweizer1997). Prior experimental observations show that hydrodynamic assist is sensitive to the DCL position
 $x_{DCL}$
(Blake et al.
Reference Blake, Clarke and Ruschak1994; Clarke Reference Clarke1995; Blake et al.
Reference Blake, Bracke and Shikhmurzaev1999; Yamamura et al.
Reference Yamamura, Suematsu, Kajiwara and Adachi2000; Blake et al.
Reference Blake, Dobson and Ruschak2004; Marston, Decent & Simmons Reference Marston, Decent and Simmons2006; Chang et al.
Reference Chang, Shih, Liu and Tiu2012). In this section, we first show the flow fields for different
$x_{DCL}$
(Blake et al.
Reference Blake, Clarke and Ruschak1994; Clarke Reference Clarke1995; Blake et al.
Reference Blake, Bracke and Shikhmurzaev1999; Yamamura et al.
Reference Yamamura, Suematsu, Kajiwara and Adachi2000; Blake et al.
Reference Blake, Dobson and Ruschak2004; Marston, Decent & Simmons Reference Marston, Decent and Simmons2006; Chang et al.
Reference Chang, Shih, Liu and Tiu2012). In this section, we first show the flow fields for different
 $x_{DCL}$
and connect these with prior experimental observations (Blake et al.
Reference Blake, Clarke and Ruschak1994; Clarke Reference Clarke1995; Marston et al.
Reference Marston, Decent and Simmons2006; Chang et al.
Reference Chang, Shih, Liu and Tiu2012). We then propose a physical mechanism for hydrodynamic assist based on these flow fields and a stress-gradient analysis.
$x_{DCL}$
and connect these with prior experimental observations (Blake et al.
Reference Blake, Clarke and Ruschak1994; Clarke Reference Clarke1995; Marston et al.
Reference Marston, Decent and Simmons2006; Chang et al.
Reference Chang, Shih, Liu and Tiu2012). We then propose a physical mechanism for hydrodynamic assist based on these flow fields and a stress-gradient analysis.
4.1 Flow fields with different
 $x_{DCL}$

Air/liquid displacement (
 $\unicode[STIX]{x1D712}=7.2\times 10^{-4}$
) in curtain coating is studied at various positions of
$\unicode[STIX]{x1D712}=7.2\times 10^{-4}$
) in curtain coating is studied at various positions of
 $x_{DCL}$
, which is controlled by the feed flow velocity
$x_{DCL}$
, which is controlled by the feed flow velocity
 $V$
in experiments at fixed substrate speed
$V$
in experiments at fixed substrate speed
 $U$
and curtain height
$U$
and curtain height
 $h_{curt}$
(Blake et al.
Reference Blake, Clarke and Ruschak1994; Miyamoto & Katagiri Reference Miyamoto, Katagiri, Kistler and Schweizer1997; Marston et al.
Reference Marston, Simmons and Decent2007; Chang et al.
Reference Chang, Shih, Liu and Tiu2012). Decreasing
$h_{curt}$
(Blake et al.
Reference Blake, Clarke and Ruschak1994; Miyamoto & Katagiri Reference Miyamoto, Katagiri, Kistler and Schweizer1997; Marston et al.
Reference Marston, Simmons and Decent2007; Chang et al.
Reference Chang, Shih, Liu and Tiu2012). Decreasing
 $V$
allows the substrate to drag the DCL downstream, whereas increasing
$V$
allows the substrate to drag the DCL downstream, whereas increasing
 $V$
tends to move the DCL upstream.
$V$
tends to move the DCL upstream.
Figure 5 shows (a–c) pressure contours and (d–f) velocity-magnitude contours for three flow configurations (corresponding to three
 $x_{DCL}$
values) in curtain coating (Blake et al.
Reference Blake, Clarke and Ruschak1994; Clarke Reference Clarke1995; Miyamoto & Katagiri Reference Miyamoto, Katagiri, Kistler and Schweizer1997; Marston et al.
Reference Marston, Decent and Simmons2006; Chang et al.
Reference Chang, Shih, Liu and Tiu2012): (a,d) bead pulling,
$x_{DCL}$
values) in curtain coating (Blake et al.
Reference Blake, Clarke and Ruschak1994; Clarke Reference Clarke1995; Miyamoto & Katagiri Reference Miyamoto, Katagiri, Kistler and Schweizer1997; Marston et al.
Reference Marston, Decent and Simmons2006; Chang et al.
Reference Chang, Shih, Liu and Tiu2012): (a,d) bead pulling,
 $x_{DCL}>0$
; (b,e) DCL right beneath the liquid curtain,
$x_{DCL}>0$
; (b,e) DCL right beneath the liquid curtain,
 $x_{DCL}=0$
; and (c,f) heel formation,
$x_{DCL}=0$
; and (c,f) heel formation,
 $x_{DCL}<0$
. Because it is easiest to compare different cases when the spatial scales are the same, all lengths have been rescaled by the slot width
$x_{DCL}<0$
. Because it is easiest to compare different cases when the spatial scales are the same, all lengths have been rescaled by the slot width
 $w$
in this plot and subsequent ones. Note that the first two cases are at their respective critical capillary numbers
$w$
in this plot and subsequent ones. Note that the first two cases are at their respective critical capillary numbers
 $Ca^{crit}$
, whereas the last one is not. This is because, in the last case, mesh distortion is so strong that it prevents us from obtaining converged solutions before
$Ca^{crit}$
, whereas the last one is not. This is because, in the last case, mesh distortion is so strong that it prevents us from obtaining converged solutions before
 $Ca^{crit}$
can be clearly identified. Impinging liquid pressurizes the flow underneath the curtain, with the effect being most prominent when the DCL is right beneath the liquid curtain and in the heel-formation configuration. The effect is not as prominent in the bead-pulling configuration since the curtain is dragged by the substrate.
$Ca^{crit}$
can be clearly identified. Impinging liquid pressurizes the flow underneath the curtain, with the effect being most prominent when the DCL is right beneath the liquid curtain and in the heel-formation configuration. The effect is not as prominent in the bead-pulling configuration since the curtain is dragged by the substrate.

Figure 5. (a–c) Pressure contours and (d–f) velocity-magnitude contours for various
 $x_{DCL}$
values:
$x_{DCL}$
values:
 $x_{DCL}=1$
(a,d),
$x_{DCL}=1$
(a,d),
 $x_{DCL}=0$
(b,e) and
$x_{DCL}=0$
(b,e) and
 $x_{DCL}=-1$
(c,f). Values of other parameters are viscosity ratio
$x_{DCL}=-1$
(c,f). Values of other parameters are viscosity ratio
 $\unicode[STIX]{x1D712}=7.2\times 10^{-4}$
and
$\unicode[STIX]{x1D712}=7.2\times 10^{-4}$
and
 $\unicode[STIX]{x1D703}_{mic}=90^{\circ }$
. Here,
$\unicode[STIX]{x1D703}_{mic}=90^{\circ }$
. Here,
 $Ca=1.33$
(
$Ca=1.33$
(
 $x_{DCL}=1$
), 2.59 (
$x_{DCL}=1$
), 2.59 (
 $x_{DCL}=0$
) and 1.36 (
$x_{DCL}=0$
) and 1.36 (
 $x_{DCL}=-1$
). Note that
$x_{DCL}=-1$
). Note that
 $Ca=Ca^{crit}$
except for the case
$Ca=Ca^{crit}$
except for the case
 $x_{DCL}=-1$
. In addition,
$x_{DCL}=-1$
. In addition,
 $Re=11.99$
(
$Re=11.99$
(
 $x_{DCL}=1$
), 30.37 (
$x_{DCL}=1$
), 30.37 (
 $x_{DCL}=0$
) and 34.93 (
$x_{DCL}=0$
) and 34.93 (
 $x_{DCL}=-1$
), and
$x_{DCL}=-1$
), and
 $Bo=9.12\times 10^{-4}$
(
$Bo=9.12\times 10^{-4}$
(
 $x_{DCL}=1$
),
$x_{DCL}=1$
),
 $1.54\times 10^{-3}$
(
$1.54\times 10^{-3}$
(
 $x_{DCL}=0$
) and
$x_{DCL}=0$
) and
 $7.33\times 10^{-3}$
(
$7.33\times 10^{-3}$
(
 $x_{DCL}=-1$
).
$x_{DCL}=-1$
).
Prior experimental observations suggest that hydrodynamic assist is most influential (i.e. the substrate speed
 $U^{crit}$
is maximum) when the contact line is right beneath the liquid curtain (Blake et al.
Reference Blake, Clarke and Ruschak1994, Reference Blake, Bracke and Shikhmurzaev1999; Yamamura et al.
Reference Yamamura, Suematsu, Kajiwara and Adachi2000; Wilson et al.
Reference Wilson, Summers, Shikhmurzaev, Clarke and Blake2006). Our results show that, when
$U^{crit}$
is maximum) when the contact line is right beneath the liquid curtain (Blake et al.
Reference Blake, Clarke and Ruschak1994, Reference Blake, Bracke and Shikhmurzaev1999; Yamamura et al.
Reference Yamamura, Suematsu, Kajiwara and Adachi2000; Wilson et al.
Reference Wilson, Summers, Shikhmurzaev, Clarke and Blake2006). Our results show that, when
 $x_{DCL}=0$
,
$x_{DCL}=0$
,
 $Ca^{crit}$
is the largest and its value is almost twice that when
$Ca^{crit}$
is the largest and its value is almost twice that when
 $x_{DCL}=1$
(figure 5
a,b). The degree of hydrodynamic assist is related to the distance between the DCL and the curtain impingement position (i.e. right beneath the upstream tip of the slot die) (figure 5
a–c). Hydrodynamic pressure due to the inertia of the liquid curtain has the strongest effect when the impingement position overlaps the DCL (i.e.
$x_{DCL}=1$
(figure 5
a,b). The degree of hydrodynamic assist is related to the distance between the DCL and the curtain impingement position (i.e. right beneath the upstream tip of the slot die) (figure 5
a–c). Hydrodynamic pressure due to the inertia of the liquid curtain has the strongest effect when the impingement position overlaps the DCL (i.e.
 $x_{DCL}=0$
) because dynamic wetting and wetting failure take place at the DCL (i.e. air bubbles break off vertices of the sawtooth-shaped DCL) (Blake & Ruschak Reference Blake and Ruschak1979; Vandre et al.
Reference Vandre, Carvalho and Kumar2014).
$x_{DCL}=0$
) because dynamic wetting and wetting failure take place at the DCL (i.e. air bubbles break off vertices of the sawtooth-shaped DCL) (Blake & Ruschak Reference Blake and Ruschak1979; Vandre et al.
Reference Vandre, Carvalho and Kumar2014).
In contrast, in the bead-pulling configuration, the effect of hydrodynamic assist is weakened because the high-pressure region is not as prominent and the DCL is away from the impingement position (figure 5 a). In the heel-formation configuration, although hydrodynamic pressure is enhanced under the curtain, the increased distance between the impingement position and the DCL results in weak hydrodynamic assist (figure 5 c).
In all the flow configurations, liquid must accelerate near the DCL to match the substrate velocity (figure 5
d–f). Consequently, liquid pressure decreases sharply near the DCL, providing a pressure gradient that draws liquid towards the moving substrate (figure 5
a–c). The low-pressure zone paired with the high-pressure region under the curtain allow the
 $x_{DCL}=0$
case to achieve high coating speeds (figure 5
b). In the heel-formation configuration, however, the high pressure under the curtain is located far from the DCL and directs liquid upstream (figure 5
c). This results in a recirculation region (figure 5
f), similar to what is observed experimentally (Clarke & Stattersfield Reference Clarke and Stattersfield2006).
$x_{DCL}=0$
case to achieve high coating speeds (figure 5
b). In the heel-formation configuration, however, the high pressure under the curtain is located far from the DCL and directs liquid upstream (figure 5
c). This results in a recirculation region (figure 5
f), similar to what is observed experimentally (Clarke & Stattersfield Reference Clarke and Stattersfield2006).
4.2 Mechanism of hydrodynamic assist
As noted in § 3, the mechanism of wetting failure is similar in curtain coating and the parallel-plate system. Here, we investigate the influence of hydrodynamic assist on the wetting failure mechanism. Figure 6(a) shows the capillary-stress gradient (filled symbols) and air-pressure gradient (open symbols) at the interface IP as a function of
 $Ca$
for
$Ca$
for
 $x_{DCL}=0$
(black circles) and
$x_{DCL}=0$
(black circles) and
 $x_{DCL}=0.5$
(red diamonds). Notably, when
$x_{DCL}=0.5$
(red diamonds). Notably, when
 $x_{DCL}=0$
the capillary-stress gradient is larger and has a stronger dependence on the IP location (
$x_{DCL}=0$
the capillary-stress gradient is larger and has a stronger dependence on the IP location (
 ${\sim}r_{f}^{-1.5}$
) in comparison with the case when
${\sim}r_{f}^{-1.5}$
) in comparison with the case when
 $x_{DCL}=0.5$
(
$x_{DCL}=0.5$
(
 ${\sim}r_{f}^{-1}$
). We point out that the
${\sim}r_{f}^{-1}$
). We point out that the
 $r_{f}^{-1}$
behaviour observed when
$r_{f}^{-1}$
behaviour observed when
 $x_{DCL}=0.5$
is similar to that in the previously examined parallel-plate geometry (figure 4
b). Therefore, the stronger dependence of the capillary-stress gradient on
$x_{DCL}=0.5$
is similar to that in the previously examined parallel-plate geometry (figure 4
b). Therefore, the stronger dependence of the capillary-stress gradient on
 $r_{f}$
when
$r_{f}$
when
 $x_{DCL}=0$
can be attributed to the presence of hydrodynamic assist.
$x_{DCL}=0$
can be attributed to the presence of hydrodynamic assist.

Figure 6. (a) Magnitude of capillary-stress (filled symbols) and air-pressure (open symbols) gradients at the IP for
 $x_{DCL}=0$
(black circles) and
$x_{DCL}=0$
(black circles) and
 $x_{DCL}=0.5$
(red diamonds). (b) IP radial distance
$x_{DCL}=0.5$
(red diamonds). (b) IP radial distance
 $r_{f}$
(filled symbols) and height
$r_{f}$
(filled symbols) and height
 $h_{f}$
(open symbols) as a function of
$h_{f}$
(open symbols) as a function of
 $Ca$
for
$Ca$
for
 $x_{DCL}=0$
(black circles) and
$x_{DCL}=0$
(black circles) and
 $x_{DCL}=0.5$
(red diamonds). Inset: the ratio between the two length scales for
$x_{DCL}=0.5$
(red diamonds). Inset: the ratio between the two length scales for
 $x_{DCL}=0$
(black circles) and
$x_{DCL}=0$
(black circles) and
 $x_{DCL}=0.5$
(red diamonds). Values of other parameters are viscosity ratio
$x_{DCL}=0.5$
(red diamonds). Values of other parameters are viscosity ratio
 $\unicode[STIX]{x1D712}=7.2\times 10^{-4}$
and
$\unicode[STIX]{x1D712}=7.2\times 10^{-4}$
and
 $\unicode[STIX]{x1D703}_{mic}=90^{\circ }$
.
$\unicode[STIX]{x1D703}_{mic}=90^{\circ }$
.
Figure 6(b) shows the change of the interface IP height
 $h_{f}$
(filled symbols) and radial distance
$h_{f}$
(filled symbols) and radial distance
 $r_{f}$
(open symbols) with
$r_{f}$
(open symbols) with
 $Ca$
(see figure 2 for definitions of
$Ca$
(see figure 2 for definitions of
 $h_{f}$
and
$h_{f}$
and
 $r_{f}$
). For both
$r_{f}$
). For both
 $x_{DCL}=0$
(black circles) and
$x_{DCL}=0$
(black circles) and
 $x_{DCL}=0.5$
(red diamonds), the IP migrates towards the DCL (i.e.
$x_{DCL}=0.5$
(red diamonds), the IP migrates towards the DCL (i.e.
 $h_{f}$
and
$h_{f}$
and
 $r_{f}$
decreasing) as
$r_{f}$
decreasing) as
 $Ca$
increases because the interface curvature needs to increase to balance the increasing viscous stresses from the air. Notably, the IP for
$Ca$
increases because the interface curvature needs to increase to balance the increasing viscous stresses from the air. Notably, the IP for
 $x_{DCL}=0$
is closer to the DCL than that for
$x_{DCL}=0$
is closer to the DCL than that for
 $x_{DCL}=0.5$
as
$x_{DCL}=0.5$
as
 $Ca$
approaches the onset of wetting failure, meaning that the interface curvature for
$Ca$
approaches the onset of wetting failure, meaning that the interface curvature for
 $x_{DCL}=0$
is larger than that for
$x_{DCL}=0$
is larger than that for
 $x_{DCL}=0.5$
. As a result, the capillary-stress gradient for
$x_{DCL}=0.5$
. As a result, the capillary-stress gradient for
 $x_{DCL}=0$
is larger than that for
$x_{DCL}=0$
is larger than that for
 $x_{DCL}=0.5$
, which is consistent with what is shown in figure 6(a).
$x_{DCL}=0.5$
, which is consistent with what is shown in figure 6(a).
The inset of figure 6(b) shows the ratio between
 $h_{f}$
and
$h_{f}$
and
 $r_{f}$
for
$r_{f}$
for
 $x_{DCL}=0$
and
$x_{DCL}=0$
and
 $x_{DCL}=0.5$
. This ratio is related to the angle of the wedge formed in the receding phase (figure 2); a larger ratio corresponds to a smaller macroscopic contact angle
$x_{DCL}=0.5$
. This ratio is related to the angle of the wedge formed in the receding phase (figure 2); a larger ratio corresponds to a smaller macroscopic contact angle
 $\unicode[STIX]{x1D703}_{M}$
. The inset of figure 6(b) shows that this ratio is larger when
$\unicode[STIX]{x1D703}_{M}$
. The inset of figure 6(b) shows that this ratio is larger when
 $x_{DCL}=0$
. This is a consequence of the strong hydrodynamic pressure near the DCL when
$x_{DCL}=0$
. This is a consequence of the strong hydrodynamic pressure near the DCL when
 $x_{DCL}=0$
, which suppresses the penetration of the air film. Therefore, the model results suggest that the macroscopic contact angle
$x_{DCL}=0$
, which suppresses the penetration of the air film. Therefore, the model results suggest that the macroscopic contact angle
 $\unicode[STIX]{x1D703}_{M}$
in curtain coating is reduced by hydrodynamic assist, which is consistent with experimental observations that hydrodynamic assist leads to a reduction in the dynamic contact angle
$\unicode[STIX]{x1D703}_{M}$
in curtain coating is reduced by hydrodynamic assist, which is consistent with experimental observations that hydrodynamic assist leads to a reduction in the dynamic contact angle
 $\unicode[STIX]{x1D703}_{D}$
(Blake et al.
Reference Blake, Bracke and Shikhmurzaev1999, Reference Blake, Dobson and Ruschak2004; Clarke & Stattersfield Reference Clarke and Stattersfield2006; Decent Reference Decent2008). In § 5, we will discuss the influence of air stresses on the contact-angle behaviour.
$\unicode[STIX]{x1D703}_{D}$
(Blake et al.
Reference Blake, Bracke and Shikhmurzaev1999, Reference Blake, Dobson and Ruschak2004; Clarke & Stattersfield Reference Clarke and Stattersfield2006; Decent Reference Decent2008). In § 5, we will discuss the influence of air stresses on the contact-angle behaviour.
Together, figures 5 and 6 suggest that hydrodynamic assist can be attributed to the strong pressure generated by the inertia of the impinging curtain. This pressure creates large gradients in the interface curvature near the DCL, which in turn enhances the capillary-stress gradient there and lowers the dynamic contact angle. These larger capillary-stress gradients more effectively pump air away from the DCL and delay the onset of wetting failure.
5 Variation of dynamic contact angle with feed flow rate
As mentioned in § 1.1, varying the feed flow rate
 $Q=wV$
in curtain coating can delay the onset of wetting failure (i.e. increase the critical capillary number
$Q=wV$
in curtain coating can delay the onset of wetting failure (i.e. increase the critical capillary number
 $Ca^{crit}$
). Flow visualizations show that the dynamic contact angle also varies with
$Ca^{crit}$
). Flow visualizations show that the dynamic contact angle also varies with
 $Q$
(Blake et al.
Reference Blake, Clarke and Ruschak1994, Reference Blake, Bracke and Shikhmurzaev1999). In this section, we examine the influence of
$Q$
(Blake et al.
Reference Blake, Clarke and Ruschak1994, Reference Blake, Bracke and Shikhmurzaev1999). In this section, we examine the influence of
 $Q$
on
$Q$
on
 $Ca^{crit}$
and the macroscopic contact angle
$Ca^{crit}$
and the macroscopic contact angle
 $\unicode[STIX]{x1D703}_{M}$
. Because the Reynolds number
$\unicode[STIX]{x1D703}_{M}$
. Because the Reynolds number
 $Re=\unicode[STIX]{x1D70C}Vw/\unicode[STIX]{x1D707}_{adv}$
is directly proportional to the feed flow velocity
$Re=\unicode[STIX]{x1D70C}Vw/\unicode[STIX]{x1D707}_{adv}$
is directly proportional to the feed flow velocity
 $V$
, we use it as a proxy for the feed flow rate.
$V$
, we use it as a proxy for the feed flow rate.

Figure 7. Solution paths for various
 $x_{DCL}$
values (i.e. feed flow rates) when viscosity ratio
$x_{DCL}$
values (i.e. feed flow rates) when viscosity ratio
 $\unicode[STIX]{x1D712}=7.2\times 10^{-4}$
:
$\unicode[STIX]{x1D712}=7.2\times 10^{-4}$
:
 $x_{DCL}=3$
(
$x_{DCL}=3$
(
 $Re=11.04$
, diamonds),
$Re=11.04$
, diamonds),
 $x_{DCL}=2$
(
$x_{DCL}=2$
(
 $Re=11.39$
, circles),
$Re=11.39$
, circles),
 $x_{DCL}=1$
(
$x_{DCL}=1$
(
 $Re=11.99$
, squares),
$Re=11.99$
, squares),
 $x_{DCL}=0$
(
$x_{DCL}=0$
(
 $Re=30.37$
, triangles) and
$Re=30.37$
, triangles) and
 $x_{DCL}=-1$
(
$x_{DCL}=-1$
(
 $Re=34.93$
, asterisks). Note that the listed
$Re=34.93$
, asterisks). Note that the listed
 $Re$
values are those for the largest
$Re$
values are those for the largest
 $Ca$
in the respective solution paths. Inset: coating window with
$Ca$
in the respective solution paths. Inset: coating window with
 $Re_{max}$
corresponding to the flow condition where
$Re_{max}$
corresponding to the flow condition where
 $x_{DCL}=0$
. Values of other parameters are
$x_{DCL}=0$
. Values of other parameters are
 $\unicode[STIX]{x1D712}=7.2\times 10^{-4}$
and
$\unicode[STIX]{x1D712}=7.2\times 10^{-4}$
and
 $\unicode[STIX]{x1D703}_{mic}=90^{\circ }$
. The corresponding values of
$\unicode[STIX]{x1D703}_{mic}=90^{\circ }$
. The corresponding values of
 $Bo$
are
$Bo$
are
 $1.30\times 10^{-3}$
,
$1.30\times 10^{-3}$
,
 $1.12\times 10^{-3}$
,
$1.12\times 10^{-3}$
,
 $9.12\times 10^{-4}$
,
$9.12\times 10^{-4}$
,
 $1.54\times 10^{-3}$
and
$1.54\times 10^{-3}$
and
 $7.33\times 10^{-3}$
.
$7.33\times 10^{-3}$
.
Steady-state solution paths for various values of
 $x_{DCL}$
are shown in figure 7. As mentioned in § 2.3, we fix the value of
$x_{DCL}$
are shown in figure 7. As mentioned in § 2.3, we fix the value of
 $x_{DCL}$
and calculate
$x_{DCL}$
and calculate
 $Re$
as we trace the solution paths to higher capillary numbers
$Re$
as we trace the solution paths to higher capillary numbers
 $Ca$
. The results show that, at the largest
$Ca$
. The results show that, at the largest
 $Ca$
for each
$Ca$
for each
 $x_{DCL}$
, the corresponding
$x_{DCL}$
, the corresponding
 $Re$
(i.e. feed flow rate) increases as the DCL moves upstream (i.e. decreasing
$Re$
(i.e. feed flow rate) increases as the DCL moves upstream (i.e. decreasing
 $x_{DCL}$
).
$x_{DCL}$
).
Owing to strong mesh distortion, the solution path for the heel-formation configuration (
 $x_{DCL}=-1$
, asterisks in figure 7) does not reach a limit point and thus the corresponding
$x_{DCL}=-1$
, asterisks in figure 7) does not reach a limit point and thus the corresponding
 $Ca^{crit}$
cannot be computed. However, it is clear that, when
$Ca^{crit}$
cannot be computed. However, it is clear that, when
 $x_{DCL}=-1$
, the macroscopic contact angles
$x_{DCL}=-1$
, the macroscopic contact angles
 $\unicode[STIX]{x1D703}_{M}$
are increased in comparison with
$\unicode[STIX]{x1D703}_{M}$
are increased in comparison with
 $x_{DCL}=0$
(triangles), suggesting that wetting failure occurs at a smaller
$x_{DCL}=0$
(triangles), suggesting that wetting failure occurs at a smaller
 $Ca^{crit}$
. Therefore, figure 7 implies that
$Ca^{crit}$
. Therefore, figure 7 implies that
 $Ca^{crit}$
increases first and then decreases as the feed flow rate increases. To the best of the authors’ knowledge, this is the first time the non-monotonic behaviour of
$Ca^{crit}$
increases first and then decreases as the feed flow rate increases. To the best of the authors’ knowledge, this is the first time the non-monotonic behaviour of
 $Ca^{crit}$
(i.e. air entrainment) in curtain coating has been predicted.
$Ca^{crit}$
(i.e. air entrainment) in curtain coating has been predicted.
Among the various cases shown in figure 7, the solution path for
 $x_{DCL}=0$
shows the maximum
$x_{DCL}=0$
shows the maximum
 $Ca^{crit}$
, which is similar to experimental observations that the maximum hydrodynamic assist occurs when the DCL is right beneath the curtain (Blake et al.
Reference Blake, Clarke and Ruschak1994, Reference Blake, Bracke and Shikhmurzaev1999; Yamamura et al.
Reference Yamamura, Suematsu, Kajiwara and Adachi2000). Figure 7 also shows that, at a given
$Ca^{crit}$
, which is similar to experimental observations that the maximum hydrodynamic assist occurs when the DCL is right beneath the curtain (Blake et al.
Reference Blake, Clarke and Ruschak1994, Reference Blake, Bracke and Shikhmurzaev1999; Yamamura et al.
Reference Yamamura, Suematsu, Kajiwara and Adachi2000). Figure 7 also shows that, at a given
 $Ca$
, increasing the feed flow rate leads to a non-monotonic behaviour of
$Ca$
, increasing the feed flow rate leads to a non-monotonic behaviour of
 $\unicode[STIX]{x1D703}_{M}$
(i.e. the angle decreases first, then increases), which has been predicted by Wilson et al. (Reference Wilson, Summers, Gaskell, Shikhmurzaev, King and Shikhmurzaev2001, Reference Wilson, Summers, Shikhmurzaev, Clarke and Blake2006) in simulations that do not account for the air phase and will be discussed further below.
$\unicode[STIX]{x1D703}_{M}$
(i.e. the angle decreases first, then increases), which has been predicted by Wilson et al. (Reference Wilson, Summers, Gaskell, Shikhmurzaev, King and Shikhmurzaev2001, Reference Wilson, Summers, Shikhmurzaev, Clarke and Blake2006) in simulations that do not account for the air phase and will be discussed further below.
A coating window can be predicted by our model, as shown in the inset of figure 7. Here,
 $Re$
is plotted as a function of
$Re$
is plotted as a function of
 $Ca$
to demonstrate the high-speed limit (i.e. air entrainment) in curtain coating. The shaded area represents a steady coating regime, where
$Ca$
to demonstrate the high-speed limit (i.e. air entrainment) in curtain coating. The shaded area represents a steady coating regime, where
 $Re_{max}$
corresponds to flow conditions at the maximum
$Re_{max}$
corresponds to flow conditions at the maximum
 $Ca^{crit}$
(
$Ca^{crit}$
(
 $x_{DCL}=0$
). As
$x_{DCL}=0$
). As
 $Re$
increases,
$Re$
increases,
 $Ca^{crit}$
increases and the regime of steady coating (at a fixed
$Ca^{crit}$
increases and the regime of steady coating (at a fixed
 $Re$
) enlarges, suggesting that inertia is essential in curtain coating for maintaining steady wetting at higher speeds. However, because critical capillary numbers could not be computed for
$Re$
) enlarges, suggesting that inertia is essential in curtain coating for maintaining steady wetting at higher speeds. However, because critical capillary numbers could not be computed for
 $Re>Re_{max}$
(associated with the heel-formation configurations,
$Re>Re_{max}$
(associated with the heel-formation configurations,
 $x_{DCL}<0$
), this plot only shows part of the coating window usually observed in experiments (Blake et al.
Reference Blake, Bracke and Shikhmurzaev1999, Reference Blake, Dobson and Ruschak2004; Marston et al.
Reference Marston, Decent and Simmons2006, Reference Marston, Simmons and Decent2007, Reference Marston, Hawkins, Decent and Simmons2009).
$x_{DCL}<0$
), this plot only shows part of the coating window usually observed in experiments (Blake et al.
Reference Blake, Bracke and Shikhmurzaev1999, Reference Blake, Dobson and Ruschak2004; Marston et al.
Reference Marston, Decent and Simmons2006, Reference Marston, Simmons and Decent2007, Reference Marston, Hawkins, Decent and Simmons2009).
As noted in § 1.1, the predictions reported by Wilson et al. (Reference Wilson, Summers, Gaskell, Shikhmurzaev, King and Shikhmurzaev2001, Reference Wilson, Summers, Shikhmurzaev, Clarke and Blake2006) show that the reduction in the apparent contact angle (i.e. interface angle calculated
 $20~\unicode[STIX]{x03BC}\text{m}$
from the DCL) is much smaller (
$20~\unicode[STIX]{x03BC}\text{m}$
from the DCL) is much smaller (
 ${<}10^{\circ }$
) than that in dynamic contact angle
${<}10^{\circ }$
) than that in dynamic contact angle
 $\unicode[STIX]{x1D703}_{D}$
(
$\unicode[STIX]{x1D703}_{D}$
(
 ${\sim}20^{\circ }$
) observed experimentally by Blake et al. (Reference Blake, Bracke and Shikhmurzaev1999). Since their model does not consider the contribution of air stresses, here we investigate how the presence of air stresses influences the variation of
${\sim}20^{\circ }$
) observed experimentally by Blake et al. (Reference Blake, Bracke and Shikhmurzaev1999). Since their model does not consider the contribution of air stresses, here we investigate how the presence of air stresses influences the variation of
 $\unicode[STIX]{x1D703}_{M}$
with feed flow rate.
$\unicode[STIX]{x1D703}_{M}$
with feed flow rate.
The variation of macroscopic contact angle
 $\unicode[STIX]{x1D703}_{M}$
with feed flow rate is shown in figure 8(a), where
$\unicode[STIX]{x1D703}_{M}$
with feed flow rate is shown in figure 8(a), where
 $\unicode[STIX]{x1D703}_{M}$
is plotted as a function of
$\unicode[STIX]{x1D703}_{M}$
is plotted as a function of
 $\hat{Q}=V/U$
at
$\hat{Q}=V/U$
at
 $Ca=0.96$
(i.e. fixing substrate speed
$Ca=0.96$
(i.e. fixing substrate speed
 $U$
and varying feed flow velocity
$U$
and varying feed flow velocity
 $V$
). Curves of
$V$
). Curves of
 $\unicode[STIX]{x1D703}_{M}$
in both air/liquid (
$\unicode[STIX]{x1D703}_{M}$
in both air/liquid (
 $\unicode[STIX]{x1D712}=7.2\times 10^{-4}$
, diamonds) and void/liquid (
$\unicode[STIX]{x1D712}=7.2\times 10^{-4}$
, diamonds) and void/liquid (
 $\unicode[STIX]{x1D712}=0$
, circles) systems show a minimum corresponding to the smallest
$\unicode[STIX]{x1D712}=0$
, circles) systems show a minimum corresponding to the smallest
 $\unicode[STIX]{x1D703}_{M}$
. This trend is consistent with the non-monotonic behaviour of the dynamic contact angle
$\unicode[STIX]{x1D703}_{M}$
. This trend is consistent with the non-monotonic behaviour of the dynamic contact angle
 $\unicode[STIX]{x1D703}_{D}$
observed experimentally (Blake et al.
Reference Blake, Bracke and Shikhmurzaev1999; Clarke & Stattersfield Reference Clarke and Stattersfield2006).
$\unicode[STIX]{x1D703}_{D}$
observed experimentally (Blake et al.
Reference Blake, Bracke and Shikhmurzaev1999; Clarke & Stattersfield Reference Clarke and Stattersfield2006).

Figure 8. (a) Variation of macroscopic contact angles at the interface IP with
 $\hat{Q}$
for viscosity ratio
$\hat{Q}$
for viscosity ratio
 $\unicode[STIX]{x1D712}=7.2\times 10^{-4}$
(diamonds) and
$\unicode[STIX]{x1D712}=7.2\times 10^{-4}$
(diamonds) and
 $\unicode[STIX]{x1D712}=0$
(circles). (b) Interface profiles for
$\unicode[STIX]{x1D712}=0$
(circles). (b) Interface profiles for
 $\unicode[STIX]{x1D712}=7.2\times 10^{-4}$
(blue diamond) and
$\unicode[STIX]{x1D712}=7.2\times 10^{-4}$
(blue diamond) and
 $\unicode[STIX]{x1D712}=0$
(red circle) when
$\unicode[STIX]{x1D712}=0$
(red circle) when
 $\hat{Q}=0.1$
. The DCL is at
$\hat{Q}=0.1$
. The DCL is at
 $y=0$
and symbols mark the IPs. Inset: interface profiles near
$y=0$
and symbols mark the IPs. Inset: interface profiles near
 $y=0$
. (c) IP radial distance
$y=0$
. (c) IP radial distance
 $r_{f}$
as a function of
$r_{f}$
as a function of
 $Ca$
for various
$Ca$
for various
 $x_{DCL}$
values when
$x_{DCL}$
values when
 $\unicode[STIX]{x1D712}=7.2\times 10^{-4}$
:
$\unicode[STIX]{x1D712}=7.2\times 10^{-4}$
:
 $x_{DCL}=1$
(squares),
$x_{DCL}=1$
(squares),
 $x_{DCL}=0.5$
(triangles),
$x_{DCL}=0.5$
(triangles),
 $x_{DCL}=0.2$
(circles) and
$x_{DCL}=0.2$
(circles) and
 $x_{DCL}=0$
(diamonds). Values of other parameters are
$x_{DCL}=0$
(diamonds). Values of other parameters are
 $\unicode[STIX]{x1D703}_{mic}=90^{\circ }$
and
$\unicode[STIX]{x1D703}_{mic}=90^{\circ }$
and
 $Ca=0.96$
.
$Ca=0.96$
.
Although the curtain height (
 $h_{curt}=1~\text{cm}$
) in our model is not the same as that studied by Wilson et al. (Reference Wilson, Summers, Gaskell, Shikhmurzaev, King and Shikhmurzaev2001, Reference Wilson, Summers, Shikhmurzaev, Clarke and Blake2006) (
$h_{curt}=1~\text{cm}$
) in our model is not the same as that studied by Wilson et al. (Reference Wilson, Summers, Gaskell, Shikhmurzaev, King and Shikhmurzaev2001, Reference Wilson, Summers, Shikhmurzaev, Clarke and Blake2006) (
 $h_{curt}=3~\text{cm}$
), the largest angle reduction predicted by our model in air/liquid displacement is around
$h_{curt}=3~\text{cm}$
), the largest angle reduction predicted by our model in air/liquid displacement is around
 $20^{\circ }$
(diamonds in figure 8
a), which is very close to the experimental value reported by Blake et al. (Reference Blake, Bracke and Shikhmurzaev1999) (
$20^{\circ }$
(diamonds in figure 8
a), which is very close to the experimental value reported by Blake et al. (Reference Blake, Bracke and Shikhmurzaev1999) (
 ${\sim}20^{\circ }$
). In contrast, the angle reduction in void/liquid displacement (
${\sim}20^{\circ }$
). In contrast, the angle reduction in void/liquid displacement (
 ${\sim}15^{\circ }$
) is smaller than that in air/liquid displacement. If we calculate an apparent contact angle at a distance of
${\sim}15^{\circ }$
) is smaller than that in air/liquid displacement. If we calculate an apparent contact angle at a distance of
 $20~\unicode[STIX]{x03BC}\text{m}$
from the DCL as done by Wilson et al. (Reference Wilson, Summers, Gaskell, Shikhmurzaev, King and Shikhmurzaev2001, Reference Wilson, Summers, Shikhmurzaev, Clarke and Blake2006), the angle reductions are smaller and closer. For air/liquid displacement, it is
$20~\unicode[STIX]{x03BC}\text{m}$
from the DCL as done by Wilson et al. (Reference Wilson, Summers, Gaskell, Shikhmurzaev, King and Shikhmurzaev2001, Reference Wilson, Summers, Shikhmurzaev, Clarke and Blake2006), the angle reductions are smaller and closer. For air/liquid displacement, it is
 ${\sim}8^{\circ }$
; whereas for void/liquid displacement, it is
${\sim}8^{\circ }$
; whereas for void/liquid displacement, it is
 ${\sim}7^{\circ }$
.
${\sim}7^{\circ }$
.
The larger reduction of
 $\unicode[STIX]{x1D703}_{M}$
in air/liquid displacement suggests that the air phase plays a crucial role in curtain coating. This is because air stresses also contribute to determining the shape of the interface near the DCL (Chan et al.
Reference Chan, Srivastava, Marchand, Andreotti, Biferale, Toschi and Snoeijer2013; Vandre et al.
Reference Vandre, Carvalho and Kumar2013) and the value of
$\unicode[STIX]{x1D703}_{M}$
in air/liquid displacement suggests that the air phase plays a crucial role in curtain coating. This is because air stresses also contribute to determining the shape of the interface near the DCL (Chan et al.
Reference Chan, Srivastava, Marchand, Andreotti, Biferale, Toschi and Snoeijer2013; Vandre et al.
Reference Vandre, Carvalho and Kumar2013) and the value of
 $\unicode[STIX]{x1D703}_{M}$
, especially near the onset of wetting failure (figure 4
a). Figure 8(b) shows the influence of the receding-phase viscosity on the interface profile. At large scales, the interface profiles in the presence and absence of air look very similar, as illustrated in the main panel. At smaller scales, however, the inset shows that the air has a significant influence on interface shape. The interface IP is closer to the DCL and the interface is more elongated when the air viscosity is included.
$\unicode[STIX]{x1D703}_{M}$
, especially near the onset of wetting failure (figure 4
a). Figure 8(b) shows the influence of the receding-phase viscosity on the interface profile. At large scales, the interface profiles in the presence and absence of air look very similar, as illustrated in the main panel. At smaller scales, however, the inset shows that the air has a significant influence on interface shape. The interface IP is closer to the DCL and the interface is more elongated when the air viscosity is included.
The migration of the IP for various feed flow rates (i.e.
 $x_{DCL}$
) is shown in figure 8(c). The solid symbols in each curve represent the radial distance
$x_{DCL}$
) is shown in figure 8(c). The solid symbols in each curve represent the radial distance
 $r_{f}$
of the IP (figure 2) at the respective
$r_{f}$
of the IP (figure 2) at the respective
 $Ca^{crit}$
. The IP for
$Ca^{crit}$
. The IP for
 $x_{DCL}=0$
(diamonds) is closer to the DCL than those in other cases, consistent with a lower value of
$x_{DCL}=0$
(diamonds) is closer to the DCL than those in other cases, consistent with a lower value of
 $\unicode[STIX]{x1D703}_{M}$
(figure 7). As the DCL moves away from
$\unicode[STIX]{x1D703}_{M}$
(figure 7). As the DCL moves away from
 $x_{DCL}=0$
(i.e.
$x_{DCL}=0$
(i.e.
 $x_{DCL}>0$
), the IP migration paths deviate from that for
$x_{DCL}>0$
), the IP migration paths deviate from that for
 $x_{DCL}=0$
and stop at smaller
$x_{DCL}=0$
and stop at smaller
 $Ca^{crit}$
values, consistent with higher values of
$Ca^{crit}$
values, consistent with higher values of
 $\unicode[STIX]{x1D703}_{M}$
. In dimensional terms, the radial distance to the IP at
$\unicode[STIX]{x1D703}_{M}$
. In dimensional terms, the radial distance to the IP at
 $Ca=0.96$
varies from
$Ca=0.96$
varies from
 ${\sim}18~\unicode[STIX]{x03BC}\text{m}$
for
${\sim}18~\unicode[STIX]{x03BC}\text{m}$
for
 $x_{DCL}=0$
to
$x_{DCL}=0$
to
 ${\sim}50~\unicode[STIX]{x03BC}\text{m}$
for
${\sim}50~\unicode[STIX]{x03BC}\text{m}$
for
 $x_{DCL}=1$
. These distances are comparable to what can be resolved experimentally.
$x_{DCL}=1$
. These distances are comparable to what can be resolved experimentally.
Although the predicted
 $Ca^{crit}$
values are of a similar order of magnitude as prior experiments (
$Ca^{crit}$
values are of a similar order of magnitude as prior experiments (
 $0.3<Ca<50$
) (Blake et al.
Reference Blake, Bracke and Shikhmurzaev1999, Reference Blake, Dobson and Ruschak2004; Marston et al.
Reference Marston, Simmons and Decent2007), the difference in curtain height between our model and experimental set-ups prevents us from drawing more definitive conclusions. However, our results suggest that accounting for the air stresses near the DCL is necessary to properly describe the experimental observations reported by Blake et al. (Reference Blake, Bracke and Shikhmurzaev1999).
$0.3<Ca<50$
) (Blake et al.
Reference Blake, Bracke and Shikhmurzaev1999, Reference Blake, Dobson and Ruschak2004; Marston et al.
Reference Marston, Simmons and Decent2007), the difference in curtain height between our model and experimental set-ups prevents us from drawing more definitive conclusions. However, our results suggest that accounting for the air stresses near the DCL is necessary to properly describe the experimental observations reported by Blake et al. (Reference Blake, Bracke and Shikhmurzaev1999).
6 Influence of insoluble surfactants on curtain coating
Motivated by the experiments of Marston et al. (Reference Marston, Hawkins, Decent and Simmons2009) discussed in § 1.3, we examine here the influence of Marangoni stresses on wetting failure in curtain coating. Marston et al. (Reference Marston, Hawkins, Decent and Simmons2009) observed that
 $U^{crit}$
could be reduced by up to
$U^{crit}$
could be reduced by up to
 ${\sim}66.7\,\%$
upon the addition of surfactants, which corresponds to a reduction in
${\sim}66.7\,\%$
upon the addition of surfactants, which corresponds to a reduction in
 $Ca^{crit}$
of
$Ca^{crit}$
of
 ${\sim}36\,\%$
. We examine here whether Marangoni stresses could be a possible mechanism for this.
${\sim}36\,\%$
. We examine here whether Marangoni stresses could be a possible mechanism for this.
Based on the parameters reported by Marston et al. (Reference Marston, Hawkins, Decent and Simmons2009), we estimate that the Marangoni number
 $M$
at the onset of wetting failure is
$M$
at the onset of wetting failure is
 $O(1)$
or smaller, and the Péclet number
$O(1)$
or smaller, and the Péclet number
 $Pe$
is
$Pe$
is
 $O(10^{5})$
(see definitions of
$O(10^{5})$
(see definitions of
 $M$
and
$M$
and
 $Pe$
in § 2.2). Thus,
$Pe$
in § 2.2). Thus,
 $M=0.15$
and
$M=0.15$
and
 $Pe=10^{3}$
are chosen as representative Marangoni and Péclet numbers in our calculation. Based on our previous work in the parallel-plate geometry,
$Pe=10^{3}$
are chosen as representative Marangoni and Péclet numbers in our calculation. Based on our previous work in the parallel-plate geometry,
 $Pe=10^{3}$
is large enough to be in the convection-dominated limit (Liu et al.
Reference Liu, Vandre, Carvalho and Kumar2016).
$Pe=10^{3}$
is large enough to be in the convection-dominated limit (Liu et al.
Reference Liu, Vandre, Carvalho and Kumar2016).
6.1 Solution paths
The solution paths for different Marangoni numbers when
 $x_{DCL}=0$
are shown in figure 9. We choose to fix
$x_{DCL}=0$
are shown in figure 9. We choose to fix
 $x_{DCL}=0$
because this is where hydrodynamic assist is maximum, in both the presence and the absence of surfactants. The solution path for
$x_{DCL}=0$
because this is where hydrodynamic assist is maximum, in both the presence and the absence of surfactants. The solution path for
 $M=0$
(circles) corresponds to the case where surfactants are absent (figure 7). Notably, the presence of Marangoni stresses (
$M=0$
(circles) corresponds to the case where surfactants are absent (figure 7). Notably, the presence of Marangoni stresses (
 $M>0$
) decreases
$M>0$
) decreases
 $Ca^{crit}$
and promotes the onset of wetting failure, suggesting a possible mechanism for the experimental observations of Marston et al. (Reference Marston, Hawkins, Decent and Simmons2009). Figure 9 also demonstrates that increasing the strength of Marangoni stresses (i.e. higher
$Ca^{crit}$
and promotes the onset of wetting failure, suggesting a possible mechanism for the experimental observations of Marston et al. (Reference Marston, Hawkins, Decent and Simmons2009). Figure 9 also demonstrates that increasing the strength of Marangoni stresses (i.e. higher
 $M$
or surfactant concentration) will further decrease
$M$
or surfactant concentration) will further decrease
 $Ca^{crit}$
, which was also experimentally observed by Marston et al. (Reference Marston, Hawkins, Decent and Simmons2009).
$Ca^{crit}$
, which was also experimentally observed by Marston et al. (Reference Marston, Hawkins, Decent and Simmons2009).

Figure 9. Solution paths for various
 $M$
when
$M$
when
 $x_{DCL}=0$
:
$x_{DCL}=0$
:
 $M=0$
(black circles),
$M=0$
(black circles),
 $M=0.15$
(red diamonds),
$M=0.15$
(red diamonds),
 $M=0.3$
(blue squares) and
$M=0.3$
(blue squares) and
 $M=0.75$
(magenta triangles). Inset: solution paths for
$M=0.75$
(magenta triangles). Inset: solution paths for
 $M=0$
(black circles) and
$M=0$
(black circles) and
 $M=0.15$
(red diamonds) when
$M=0.15$
(red diamonds) when
 $x_{DCL}=0.5$
. Values of other parameters are viscosity ratio
$x_{DCL}=0.5$
. Values of other parameters are viscosity ratio
 $\unicode[STIX]{x1D712}=7.2\times 10^{-4}$
and
$\unicode[STIX]{x1D712}=7.2\times 10^{-4}$
and
 $\unicode[STIX]{x1D703}_{mic}=90^{\circ }$
. For
$\unicode[STIX]{x1D703}_{mic}=90^{\circ }$
. For
 $x_{DCL}=0$
,
$x_{DCL}=0$
,
 $Re=30.37$
and
$Re=30.37$
and
 $Bo=1.54\times 10^{-3}$
at
$Bo=1.54\times 10^{-3}$
at
 $Ca=Ca^{crit}$
when
$Ca=Ca^{crit}$
when
 $M=0$
. For
$M=0$
. For
 $x_{DCL}=0.5$
,
$x_{DCL}=0.5$
,
 $Re=15.07$
and
$Re=15.07$
and
 $Bo=7.94\times 10^{-4}$
at
$Bo=7.94\times 10^{-4}$
at
 $Ca=Ca^{crit}$
when
$Ca=Ca^{crit}$
when
 $M=0$
.
$M=0$
.
The inset of figure 9 shows the solution paths for
 $M=0$
and
$M=0$
and
 $M=0.15$
at
$M=0.15$
at
 $x_{DCL}=0.5$
. As noted in § 5, the feed flow rate at
$x_{DCL}=0.5$
. As noted in § 5, the feed flow rate at
 $Ca^{crit}$
decreases as the DCL moves downstream. Therefore, the feed flow rates for solution paths in the inset of figure 9 are smaller than those leading to
$Ca^{crit}$
decreases as the DCL moves downstream. Therefore, the feed flow rates for solution paths in the inset of figure 9 are smaller than those leading to
 $x_{DCL}=0$
in figure 9. Notably, in going from
$x_{DCL}=0$
in figure 9. Notably, in going from
 $x_{DCL}=0$
to
$x_{DCL}=0$
to
 $x_{DCL}=0.5$
,
$x_{DCL}=0.5$
,
 $Ca^{crit}$
decreases 30 % for the surfactant-free case (i.e.
$Ca^{crit}$
decreases 30 % for the surfactant-free case (i.e.
 $M=0$
). In contrast, the reduction in
$M=0$
). In contrast, the reduction in
 $Ca^{crit}$
for
$Ca^{crit}$
for
 $M=0.15$
is only 6.3 %, suggesting that the influence of the feed flow rate on the critical substrate speeds (i.e. the degree of hydrodynamic assist) is weakened by Marangoni stresses. This decreased degree of hydrodynamic assist is similar to what is observed by Marston et al. (Reference Marston, Hawkins, Decent and Simmons2009), again indicating that Marangoni stresses may play an important role in curtain coating.
$M=0.15$
is only 6.3 %, suggesting that the influence of the feed flow rate on the critical substrate speeds (i.e. the degree of hydrodynamic assist) is weakened by Marangoni stresses. This decreased degree of hydrodynamic assist is similar to what is observed by Marston et al. (Reference Marston, Hawkins, Decent and Simmons2009), again indicating that Marangoni stresses may play an important role in curtain coating.
6.2 Mechanism of influence of surfactants
Our previous work on the parallel-plate system (figure 1 b) suggests that Marangoni stresses promote the onset of wetting failure by thinning the air film between the fluid interface and the substrate (Liu et al. Reference Liu, Vandre, Carvalho and Kumar2016). However, since curtain coating has a significantly different geometry, it is not obvious that it shares the same physical mechanism. To address this issue, we perform a stress-gradient analysis.

Figure 10. (a) Magnitude of stress gradients at the interface IP for
 $M=0$
(black circles) and
$M=0$
(black circles) and
 $M=0.15$
(red diamonds). The capillary-stress gradients (filled symbols) match the air-pressure gradients (open symbols) at
$M=0.15$
(red diamonds). The capillary-stress gradients (filled symbols) match the air-pressure gradients (open symbols) at
 $Ca^{crit}$
values denoted by dotted lines. (b) IP radial distance
$Ca^{crit}$
values denoted by dotted lines. (b) IP radial distance
 $r_{f}$
(filled symbols) and height
$r_{f}$
(filled symbols) and height
 $h_{f}$
(open symbols) as a function of
$h_{f}$
(open symbols) as a function of
 $Ca$
for
$Ca$
for
 $M=0$
(black circles) and
$M=0$
(black circles) and
 $M=0.15$
(red diamonds). Inset: the ratio between the two length scales for
$M=0.15$
(red diamonds). Inset: the ratio between the two length scales for
 $M=0$
(black circles) and
$M=0$
(black circles) and
 $M=0.15$
(red diamonds). Values of other parameters are
$M=0.15$
(red diamonds). Values of other parameters are
 $x_{DCL}=0$
, viscosity ratio
$x_{DCL}=0$
, viscosity ratio
 $\unicode[STIX]{x1D712}=7.2\times 10^{-4}$
and
$\unicode[STIX]{x1D712}=7.2\times 10^{-4}$
and
 $\unicode[STIX]{x1D703}_{mic}=90^{\circ }$
.
$\unicode[STIX]{x1D703}_{mic}=90^{\circ }$
.
Capillary-stress gradients (filled symbols) and air-pressure gradients (open symbols) at the interface IP are plotted as a function of
 $Ca$
in figure 10(a) when Marangoni stresses are absent (
$Ca$
in figure 10(a) when Marangoni stresses are absent (
 $M=0$
, black circles) and present (
$M=0$
, black circles) and present (
 $M=0.15$
, red diamonds). Similar to what we found in our previous work on the parallel-plate geometry (Liu et al.
Reference Liu, Vandre, Carvalho and Kumar2016), the presence of Marangoni stresses tends to increase the air-pressure gradient (red open diamonds) such that it matches the capillary-stress gradient (red filled diamonds) at a smaller
$M=0.15$
, red diamonds). Similar to what we found in our previous work on the parallel-plate geometry (Liu et al.
Reference Liu, Vandre, Carvalho and Kumar2016), the presence of Marangoni stresses tends to increase the air-pressure gradient (red open diamonds) such that it matches the capillary-stress gradient (red filled diamonds) at a smaller
 $Ca^{crit}$
compared to when
$Ca^{crit}$
compared to when
 $M=0$
.
$M=0$
.
Flow along the interface carries surfactant towards the DCL, creating large concentration gradients there (figure 11). The surfactant concentration is largest near the DCL, leading to a Marangoni stress directed away from the DCL. Stronger shear stresses in the air phase are required to balance Marangoni stresses along the fluid interface (see (2.6)), and this requires air velocity changes over a smaller distance (
 $\text{d}u/\text{d}y$
) near the DCL. Therefore, the air film near the DCL is thinned (i.e.
$\text{d}u/\text{d}y$
) near the DCL. Therefore, the air film near the DCL is thinned (i.e.
 $h_{f}$
decreases), increasing the magnitude of the air-pressure gradient, which scales as
$h_{f}$
decreases), increasing the magnitude of the air-pressure gradient, which scales as
 $h_{f}^{-2}$
(Vandre et al.
Reference Vandre, Carvalho and Kumar2013; Liu et al.
Reference Liu, Vandre, Carvalho and Kumar2016).
$h_{f}^{-2}$
(Vandre et al.
Reference Vandre, Carvalho and Kumar2013; Liu et al.
Reference Liu, Vandre, Carvalho and Kumar2016).
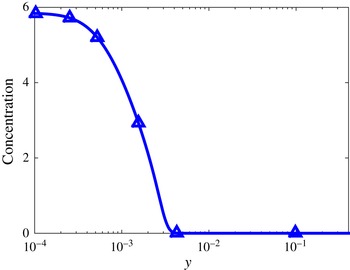
Figure 11. Surfactant concentration profile for
 $M=0.15$
and
$M=0.15$
and
 $Ca=0.93$
. The DCL is at
$Ca=0.93$
. The DCL is at
 $y=0$
. Values of other parameters are
$y=0$
. Values of other parameters are
 $x_{DCL}=0$
, viscosity ratio
$x_{DCL}=0$
, viscosity ratio
 $\unicode[STIX]{x1D712}=7.2\times 10^{-4}$
and
$\unicode[STIX]{x1D712}=7.2\times 10^{-4}$
and
 $\unicode[STIX]{x1D703}_{mic}=90^{\circ }$
.
$\unicode[STIX]{x1D703}_{mic}=90^{\circ }$
.
Figure 10(b) demonstrates the migration of the IP, where the characteristic length scales (
 $r_{f}$
, filled symbols;
$r_{f}$
, filled symbols;
 $h_{f}$
, open symbols) are plotted as a function of
$h_{f}$
, open symbols) are plotted as a function of
 $Ca$
. Notably, both
$Ca$
. Notably, both
 $r_{f}$
and
$r_{f}$
and
 $h_{f}$
are smaller when
$h_{f}$
are smaller when
 $M=0.15$
(diamonds) compared to when
$M=0.15$
(diamonds) compared to when
 $M=0$
(circles), indicating that the size of the air film shrinks in the presence of Marangoni stresses. Although smaller
$M=0$
(circles), indicating that the size of the air film shrinks in the presence of Marangoni stresses. Although smaller
 $r_{f}$
values indicate a larger interface curvature and a stronger capillary-stress gradient, the decrease of
$r_{f}$
values indicate a larger interface curvature and a stronger capillary-stress gradient, the decrease of
 $h_{f}$
(with
$h_{f}$
(with
 $Ca$
) when
$Ca$
) when
 $M=0.15$
is so drastic that the air-pressure gradient increases rapidly and becomes equal to the capillary-stress gradient at a smaller
$M=0.15$
is so drastic that the air-pressure gradient increases rapidly and becomes equal to the capillary-stress gradient at a smaller
 $Ca$
than that when
$Ca$
than that when
 $M=0$
.
$M=0$
.
The ratio between the two length scales (
 $h_{f}/r_{f}$
) for
$h_{f}/r_{f}$
) for
 $M=0$
(circles) and
$M=0$
(circles) and
 $M=0.15$
(diamonds) is shown in the inset of figure 10(b). Owing to the large reduction in
$M=0.15$
(diamonds) is shown in the inset of figure 10(b). Owing to the large reduction in
 $h_{f}$
, the ratio for
$h_{f}$
, the ratio for
 $M=0.15$
is much smaller than that for
$M=0.15$
is much smaller than that for
 $M=0$
. A smaller ratio corresponds to a larger macroscopic contact angle
$M=0$
. A smaller ratio corresponds to a larger macroscopic contact angle
 $\unicode[STIX]{x1D703}_{M}$
at the IP (figure 2), which is consistent with the larger values of
$\unicode[STIX]{x1D703}_{M}$
at the IP (figure 2), which is consistent with the larger values of
 $\unicode[STIX]{x1D703}_{M}$
in the solution paths when
$\unicode[STIX]{x1D703}_{M}$
in the solution paths when
 $M>0$
(figure 9).
$M>0$
(figure 9).
As discussed in § 4, when Marangoni stresses are absent (
 $M=0$
), the strong dependence of the capillary-stress gradient on
$M=0$
), the strong dependence of the capillary-stress gradient on
 $r_{f}$
when
$r_{f}$
when
 $x_{DCL}=0$
can be attributed to the large pressure changes near the DCL (
$x_{DCL}=0$
can be attributed to the large pressure changes near the DCL (
 ${\sim}r_{f}^{-1.5}$
in figure 10
a). When Marangoni stresses are present (
${\sim}r_{f}^{-1.5}$
in figure 10
a). When Marangoni stresses are present (
 $M=0.15$
), figure 10(a) shows that the dependence of capillary-stress gradients on
$M=0.15$
), figure 10(a) shows that the dependence of capillary-stress gradients on
 $r_{f}$
is weakened (
$r_{f}$
is weakened (
 ${\sim}r_{f}^{-1.1}$
). To understand the reason for this, flow fields at the onset of wetting failure (i.e. at the respective
${\sim}r_{f}^{-1.1}$
). To understand the reason for this, flow fields at the onset of wetting failure (i.e. at the respective
 $Ca^{crit}$
) for
$Ca^{crit}$
) for
 $M=0$
and
$M=0$
and
 $M=0.15$
are presented in figure 12.
$M=0.15$
are presented in figure 12.
Figure 12 shows (a–c) pressure contours and (d–f) velocity-magnitude contours for
 $M=0$
and
$M=0$
and
 $M=0.15$
. Panels (a,b) and (d,e) are at the onset of wetting failure, and we note that the value of
$M=0.15$
. Panels (a,b) and (d,e) are at the onset of wetting failure, and we note that the value of
 $Ca^{crit}$
when
$Ca^{crit}$
when
 $M=0$
is larger than that when
$M=0$
is larger than that when
 $M=0.15$
. Thus, panels (c,f) are for
$M=0.15$
. Thus, panels (c,f) are for
 $M=0$
at a value of
$M=0$
at a value of
 $Ca$
comparable to
$Ca$
comparable to
 $Ca^{crit}$
for
$Ca^{crit}$
for
 $M=0.15$
. In all cases,
$M=0.15$
. In all cases,
 $x_{DCL}=0$
.
$x_{DCL}=0$
.

Figure 12. (a–c) Pressure contours and (d–f) velocity-magnitude contours for
 $M=0$
(a,c,d,f) and
$M=0$
(a,c,d,f) and
 $M=0.15$
(b,e) at the onset of wetting failure. Values of other parameters are
$M=0.15$
(b,e) at the onset of wetting failure. Values of other parameters are
 $x_{DCL}=0$
, viscosity ratio
$x_{DCL}=0$
, viscosity ratio
 $\unicode[STIX]{x1D712}=7.2\times 10^{-4}$
and
$\unicode[STIX]{x1D712}=7.2\times 10^{-4}$
and
 $\unicode[STIX]{x1D703}_{mic}=90^{\circ }$
. (a,d)
$\unicode[STIX]{x1D703}_{mic}=90^{\circ }$
. (a,d)
 $Ca=2.59$
,
$Ca=2.59$
,
 $Re=30.37$
and
$Re=30.37$
and
 $Bo=1.54\times 10^{-3}$
. (b,e)
$Bo=1.54\times 10^{-3}$
. (b,e)
 $Ca=0.93$
,
$Ca=0.93$
,
 $Re=21.41$
and
$Re=21.41$
and
 $Bo=5.89\times 10^{-3}$
. (c,f)
$Bo=5.89\times 10^{-3}$
. (c,f)
 $Ca=0.96$
,
$Ca=0.96$
,
 $Re=20.94$
and
$Re=20.94$
and
 $Bo=5.3\times 10^{-3}$
.
$Bo=5.3\times 10^{-3}$
.
When
 $M=0$
(figure 12
a,d), the curtain remains nearly perpendicular to the substrate and the impinging liquid pressurizes the flow underneath the curtain. In contrast, a liquid bulge is formed at the upstream fluid interface near the DCL when
$M=0$
(figure 12
a,d), the curtain remains nearly perpendicular to the substrate and the impinging liquid pressurizes the flow underneath the curtain. In contrast, a liquid bulge is formed at the upstream fluid interface near the DCL when
 $M=0.15$
(figure 12
b,e). This liquid bulge results from the presence of Marangoni stresses, which counteract the impinging liquid and slow down the liquid velocity near the fluid interface and the DCL (figure 12
e). We note that the bulge is not as prominent when
$M=0.15$
(figure 12
b,e). This liquid bulge results from the presence of Marangoni stresses, which counteract the impinging liquid and slow down the liquid velocity near the fluid interface and the DCL (figure 12
e). We note that the bulge is not as prominent when
 $M=0$
and
$M=0$
and
 $Ca$
has a comparable value to
$Ca$
has a comparable value to
 $Ca^{crit}$
for
$Ca^{crit}$
for
 $M=0.15$
(figure 12
c,f). The low-speed region when
$M=0.15$
(figure 12
c,f). The low-speed region when
 $M=0.15$
(figure 12
e) indicates that inertial forces near the DCL are weakened, suggesting a weaker influence of the impinging liquid on the DCL compared to when
$M=0.15$
(figure 12
e) indicates that inertial forces near the DCL are weakened, suggesting a weaker influence of the impinging liquid on the DCL compared to when
 $M=0$
. This weakened influence may explain the weaker dependence of the capillary-stress gradient on
$M=0$
. This weakened influence may explain the weaker dependence of the capillary-stress gradient on
 $r_{f}$
when
$r_{f}$
when
 $M=0.15$
(figure 10
a) and also the decrease in the degree of hydrodynamic assist observed by Marston et al. (Reference Marston, Hawkins, Decent and Simmons2009).
$M=0.15$
(figure 10
a) and also the decrease in the degree of hydrodynamic assist observed by Marston et al. (Reference Marston, Hawkins, Decent and Simmons2009).
Finally, we comment on several other phenomena that may be present in the experiments but are not accounted for in our calculations. First, the surfactants used in the experiments of Marston et al. (Reference Marston, Hawkins, Decent and Simmons2009) were soluble, whereas our model assumes that the surfactants are insoluble. We expect that surfactant solubility will weaken Marangoni effects since surfactants could desorb from the fluid interface into the bulk. Second, our model does not account for the possibility that surfactants may adsorb to the substrate. Third, the introduction of surfactants will lower the mean surface tension and the microscopic contact angle, which were taken as constant in the above calculations to isolate the influence of Marangoni stresses. Lowering
 $\unicode[STIX]{x1D703}_{mic}$
would be expected to raise the value of
$\unicode[STIX]{x1D703}_{mic}$
would be expected to raise the value of
 $Ca^{crit}$
since the substrate would be more wettable. As this is the opposite of what is observed in the experiments, it is not likely to be the cause of the decrease in
$Ca^{crit}$
since the substrate would be more wettable. As this is the opposite of what is observed in the experiments, it is not likely to be the cause of the decrease in
 $Ca^{crit}$
. Accounting for these phenomena as well as larger curtain heights will be important to more fully understand the experimental observation that surfactants significantly promote the onset of wetting failure.
$Ca^{crit}$
. Accounting for these phenomena as well as larger curtain heights will be important to more fully understand the experimental observation that surfactants significantly promote the onset of wetting failure.
7 Conclusions
We have used a novel hybrid formulation of a hydrodynamic model to study dynamic wetting failure and hydrodynamic assist in curtain coating. The use of a 1D description of the air phase has allowed, for the first time, an examination of the influence of air stresses on this complicated coating flow. Indeed, without using a 1D description for the air phase, a full 2D description of the both the air and liquid phases would be computationally prohibitive.
Our model shows that inclusion of the air stresses is necessary to even predict the onset of wetting failure (§ 3). Once air stresses are included, our model is able to predict the non-monotonic behaviour of the critical capillary number with feed flow rate that has been observed experimentally (Blake et al. Reference Blake, Bracke and Shikhmurzaev1999) (§ 5). Inclusion of air stresses also leads to a larger variation of dynamic contact angle with feed flow rate, suggesting that accounting for air stresses is important to accurately describe experimental observations of the dynamic contact angle (Blake et al. Reference Blake, Bracke and Shikhmurzaev1999). In particular, our results raise the possibility that much of the behaviour observed in curtain-coating experiments can be qualitatively understood by accounting for air stresses and assuming a constant microscopic contact angle.
Our model also allows us to gain insight into the phenomenon of hydrodynamic assist (§ 4). Similar to what is observed experimentally, we find that the degree of hydrodynamic assist is largest when the DCL is right beneath the liquid curtain. The hydrodynamic pressure generated by the inertia of the impinging curtain leads to larger gradients in interface curvature near the DCL. These larger curvature gradients lead to stronger capillary-stress gradients that are more effective at pumping air away from the DCL, thus delaying the onset of wetting failure.
The influence of Marangoni stresses created by insoluble surfactants was also investigated, and we find that these stresses promote the onset of wetting failure and reduce the degree of hydrodynamic assist (§ 6). These findings are consistent with recent experimental observations (Marston et al. Reference Marston, Hawkins, Decent and Simmons2009) and suggest that Marangoni stresses are a possible mechanism. The Marangoni stresses thin the air film and increase the air-pressure gradients, making it more difficult for the capillary-stress gradients to pump the air away from the DCL.
Owing to computational limitations, some of the parameter values used in our model are quite different from those in experiments. Nevertheless, the model predictions are consistent with key experimental observations. We note that our assumption that the air can be described as a continuum in local thermodynamic equilibrium may break down as the air film becomes very thin (Sprittles Reference Sprittles2015). It may also be important to account for slip at the air–liquid interface (Sprittles Reference Sprittles2015). However, because the air film is long and slender, it may still be possible to describe its influence efficiently and accurately by using a 1D model.
The hybrid approach used here is limited principally by the degree to which the flow in the liquid phase can be resolved. Improvements in computational capacity will enable predictions of flows with parameters more representative of experimental set-ups (e.g. larger curtain heights), and thus allow for more quantitative comparisons with experimental data. If extended to 3D and transient flows, as well as to liquids with more complicated rheology, the hybrid approach may prove to be a computationally feasible way to accurately account for air stresses in these complex flows. Such an extension would be of interest not only for coating flows, but also for other problems in fluid mechanics such as rapid droplet spreading where there is a thin air layer near a DCL.
Acknowledgement
This material is based upon work supported by the National Science Foundation under grant no. CBET-1434016.
Appendix A. Finite element mesh
Figure 13 shows typical quadrilateral element meshes for two flow configurations: bead pulling (i.e.
 $x_{DCL}>0$
) and heel formation (i.e.
$x_{DCL}>0$
) and heel formation (i.e.
 $x_{DCL}<0$
). The highest concentration of elements is in the liquid domain near the DCL to resolve strong velocity and curvature gradients there. In the bead-pulling configuration, elements are stretched near the DCL. In contrast, in the heel-formation configuration, elements are stretched both near the DCL and near the transition between the falling curtain and the heel. For the same initial element arrangement, calculations do not converge in the heel-formation configuration when
$x_{DCL}<0$
). The highest concentration of elements is in the liquid domain near the DCL to resolve strong velocity and curvature gradients there. In the bead-pulling configuration, elements are stretched near the DCL. In contrast, in the heel-formation configuration, elements are stretched both near the DCL and near the transition between the falling curtain and the heel. For the same initial element arrangement, calculations do not converge in the heel-formation configuration when
 $Ca\rightarrow Ca^{crit}$
because the mesh is strongly distorted. For this reason, we are not able to obtain
$Ca\rightarrow Ca^{crit}$
because the mesh is strongly distorted. For this reason, we are not able to obtain
 $Ca^{crit}$
values in the heel-formation configuration.
$Ca^{crit}$
values in the heel-formation configuration.

Figure 13. Mesh used in curtain coating for two flow configurations: (a) bead pulling and (b) heel formation.
Appendix B. Dimensional velocities and film thicknesses
As noted in § 2.3, we fix
 $x_{DCL}$
as a flow parameter and calculate
$x_{DCL}$
as a flow parameter and calculate
 $V$
(as a dependent variable) as we trace solution paths to higher
$V$
(as a dependent variable) as we trace solution paths to higher
 $U$
. As expected, the feed flow velocity
$U$
. As expected, the feed flow velocity
 $V$
needs to increase as the substrate speed
$V$
needs to increase as the substrate speed
 $U$
increases to hold the DCL position fixed (figure 14
a). However,
$U$
increases to hold the DCL position fixed (figure 14
a). However,
 $V$
does not grow as fast as
$V$
does not grow as fast as
 $U$
, resulting in a decrease in coating-film thickness (
$U$
, resulting in a decrease in coating-film thickness (
 $h_{inf}=wV/U$
) as
$h_{inf}=wV/U$
) as
 $U$
increases (figure 14
b).
$U$
increases (figure 14
b).

Figure 14. (a) Dependence of feed flow velocity
 $V$
on substrate speed
$V$
on substrate speed
 $U$
in the absence of surfactants when
$U$
in the absence of surfactants when
 $x_{DCL}=0$
. (b) Corresponding coating-film thickness
$x_{DCL}=0$
. (b) Corresponding coating-film thickness
 $h_{inf}$
from the balance of rates shown in panel (a). The parameters used for these calculations are given in § 2.4.
$h_{inf}$
from the balance of rates shown in panel (a). The parameters used for these calculations are given in § 2.4.


