1 Introduction
The capability of a body to benefit from the added-mass variation induced by changing its shape has generated much interest, particularly in guiding the design of bioinspired propulsion systems. Reports on added-mass variation in self-propelled organisms were first documented in Daniel (Reference Daniel1984, Reference Daniel1985), and more recently various contributions have addressed the role of body-shape changes in the unsteady propulsion of aquatic organisms (Kanso Reference Kanso2009; Kanso & Newton Reference Kanso and Newton2009; Candelier, Boyer & Leroyer Reference Candelier, Boyer and Leroyer2011) based on the early work of Lighthill (Reference Lighthill1960) and Saffman (Reference Saffman1967).
The present work, however, deals with cases where shape change affects the added-mass component in the direction of translation alone, such as when volumetric pulsation or isovolumetric cross-sectional modification takes place. This kind of problem, previously accounted for in Spagnolie & Shelley (Reference Spagnolie and Shelley2009), has implications in the swimming of cephalopods (i.e. squids and octopodes) and the opportunity to exploit the benefit of their propulsion routine (Trueman & Packard Reference Trueman and Packard1968; Johnson, Soden & Trueman Reference Johnson, Soden and Trueman1972) in the frame of soft-bodied underwater vehicles (Weymouth, Subramaniam & Triantafyllou Reference Weymouth, Subramaniam and Triantafyllou2015; Giorgio-Serchi, Arienti & Laschi Reference Giorgio-Serchi, Arienti and Laschi2016).
Earlier works on the dynamics of bodies undergoing single events of rapid volume collapse reported that a burst of speed can be achieved by recovering the added-mass kinetic energy of the external flow to augment the momentum flux of the propulsive jet (Weymouth & Triantafyllou Reference Weymouth and Triantafyllou2013; Weymouth et al. Reference Weymouth, Subramaniam and Triantafyllou2015). A goal of the current work is to uncouple added-mass effects from other sources of force and to extend the analysis to periodic shape-changing routines relevant to sustained propulsion.
To that end, we study a simple spring–mass oscillator subject to prescribed periodic variation of the body volume. By immersing this system in a fluid, the volume change induces added-mass variation, and therefore effects both the effective inertia and the damping of the system. This is a novel case of parametric excitation in which ‘pumping’ of a parameter of the oscillator is used to induce resonant vibrations (Lavroskii & Formal’skii Reference Lavroskii and Formal’skii1993; Roura & Gonzalez Reference Roura and Gonzalez2010). In our system, the shape change is used to completely cancel the substantial fluid drag and drive sustained large-amplitude oscillations without any type of propelling jet or background flow. While our results concentrate on spherical bodies, our derivation applies to general isotropic volume change, and the physical principles clearly generalize to any shape change that affects the component of added mass in the direction of motion.
2 Governing equations of a volume-changing oscillator
We consider a single degree of freedom oscillator translating in
![]() $x$
, immersed in a fluid of density
$x$
, immersed in a fluid of density
![]() ${\it\rho}$
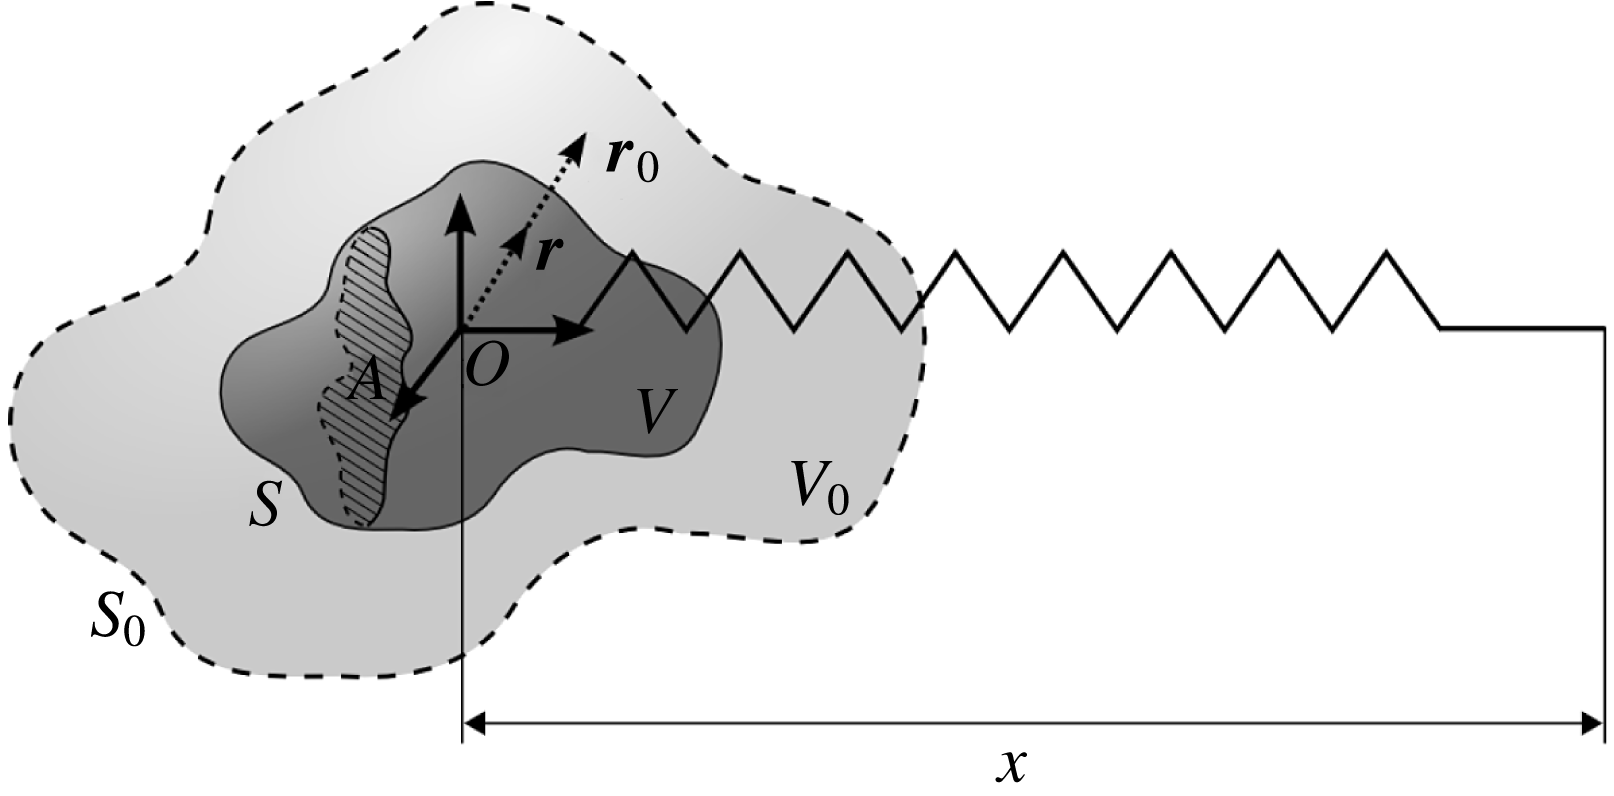
, see figure 1. The body is capable of undergoing isotropic changes to its volume
${\it\rho}$
, see figure 1. The body is capable of undergoing isotropic changes to its volume
![]() $V$
while maintaining its mass
$V$
while maintaining its mass
![]() $m$
constant. The governing equation is given by
$m$
constant. The governing equation is given by
where
![]() $k$
is the spring constant, and the fluid forcing
$k$
is the spring constant, and the fluid forcing
![]() $F$
is modelled as the combination of the rate of change of added momentum as in Weymouth & Triantafyllou (Reference Weymouth and Triantafyllou2013) and a quasi-steady drag force based on the frontal area
$F$
is modelled as the combination of the rate of change of added momentum as in Weymouth & Triantafyllou (Reference Weymouth and Triantafyllou2013) and a quasi-steady drag force based on the frontal area
![]() $A$
as in Morison et al. (Reference Morison, O’Brien, Johnson and Schaaf1950). As we consider isotropic volume change, the added-mass coefficient in the direction of motion
$A$
as in Morison et al. (Reference Morison, O’Brien, Johnson and Schaaf1950). As we consider isotropic volume change, the added-mass coefficient in the direction of motion
![]() $C_{11}$
and the drag coefficient
$C_{11}$
and the drag coefficient
![]() $C_{D}$
are idealized as constant. In the remainder of the paper we refer to this as the quasi-dynamic (QD) forcing model, it being only quasi-dynamic as it does not account for any forces that depend on the history of the wake.
$C_{D}$
are idealized as constant. In the remainder of the paper we refer to this as the quasi-dynamic (QD) forcing model, it being only quasi-dynamic as it does not account for any forces that depend on the history of the wake.
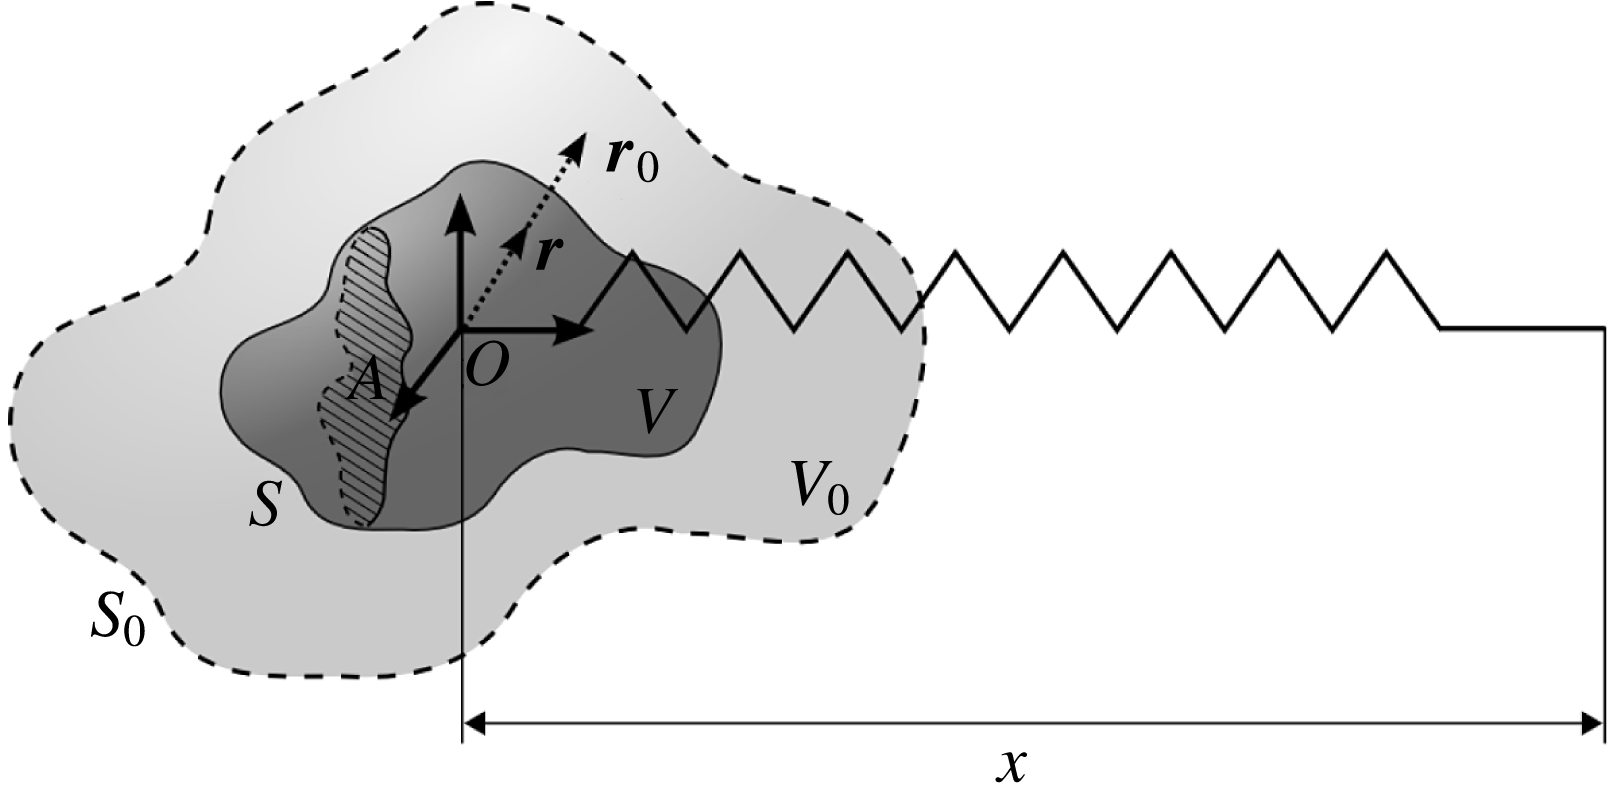
Figure 1. Sketch of the volume-changing spring–mass oscillator. Here the local frame of reference with origin
![]() $O$
is displaced by
$O$
is displaced by
![]() $x$
from the point of relaxation of the spring. The terms
$x$
from the point of relaxation of the spring. The terms
![]() $S$
,
$S$
,
![]() $V$
,
$V$
,
![]() $\boldsymbol{r}$
and
$\boldsymbol{r}$
and
![]() $A$
respectively represent the surface, volume, radius vector and cross-section of the oscillator at time
$A$
respectively represent the surface, volume, radius vector and cross-section of the oscillator at time
![]() $t$
, while subscript 0 refers to their mean state.
$t$
, while subscript 0 refers to their mean state.
Upon expansion and rearrangement, (2.1) yields
By defining the effective inertia and effective damping coefficients of the system,
equation (2.2) can be rewritten as a classical unforced oscillator,
Thus, prescribed variation in the volume pumps the oscillator coefficients
![]() $m_{e}$
and
$m_{e}$
and
![]() $c_{e}$
, and presents the opportunity for parametric excitation and resonance without external forcing.
$c_{e}$
, and presents the opportunity for parametric excitation and resonance without external forcing.
The dependence on
![]() $\dot{V}$
in (2.4) is particularly important as it implies that controlled shrinking (
$\dot{V}$
in (2.4) is particularly important as it implies that controlled shrinking (
![]() $\dot{V}<0$
) can be used to cancel the drag for any value of
$\dot{V}<0$
) can be used to cancel the drag for any value of
![]() $C_{D}$
, resulting in an undamped oscillator with natural frequency
$C_{D}$
, resulting in an undamped oscillator with natural frequency
![]() ${\it\omega}_{n}^{2}=k/(m+C_{11}{\it\rho}V_{0})$
, where
${\it\omega}_{n}^{2}=k/(m+C_{11}{\it\rho}V_{0})$
, where
![]() $V_{0}$
is the mean volume. We consider two pumping profiles to achieve this: (i) a sharp profile to cancel the drag at all times, (ii) a smooth profile which only zeroes the loss on average.
$V_{0}$
is the mean volume. We consider two pumping profiles to achieve this: (i) a sharp profile to cancel the drag at all times, (ii) a smooth profile which only zeroes the loss on average.
2.1 Sharp parametric profile
We first consider the sharp profile. As our goal is an undamped oscillator, we assume an oscillation of the form
where
![]() $X$
is the amplitude of displacement of the oscillator, see figure 1.
$X$
is the amplitude of displacement of the oscillator, see figure 1.
A radius profile for drag cancellation is readily derived by defining the body surface
![]() $S$
and a radius vector
$S$
and a radius vector
![]() $\boldsymbol{r}$
from the origin to
$\boldsymbol{r}$
from the origin to
![]() $S$
. Since isotropic shape changes ensure
$S$
. Since isotropic shape changes ensure
![]() $\dot{V}={\dot{r}}S$
, (2.4) gives
$\dot{V}={\dot{r}}S$
, (2.4) gives
![]() $c_{e}=0$
when
$c_{e}=0$
when
The proportionality to
![]() $-|{\dot{x}}|$
in (2.7) implies that the volume must continually shrink. To avoid this while maintaining zero damping, we apply a step increase in
$-|{\dot{x}}|$
in (2.7) implies that the volume must continually shrink. To avoid this while maintaining zero damping, we apply a step increase in
![]() $r(t)$
back to its maximum when
$r(t)$
back to its maximum when
![]() ${\dot{x}}=0$
, i.e. twice per oscillation. This can be conveniently expressed by defining a modulo temporal function
${\dot{x}}=0$
, i.e. twice per oscillation. This can be conveniently expressed by defining a modulo temporal function
![]() $t^{\ast }$
,
$t^{\ast }$
,
allowing us to define the radius profile as
where
![]() $r_{0}$
is the norm of the original
$r_{0}$
is the norm of the original
![]() $\boldsymbol{r}$
and
$\boldsymbol{r}$
and
![]() $a$
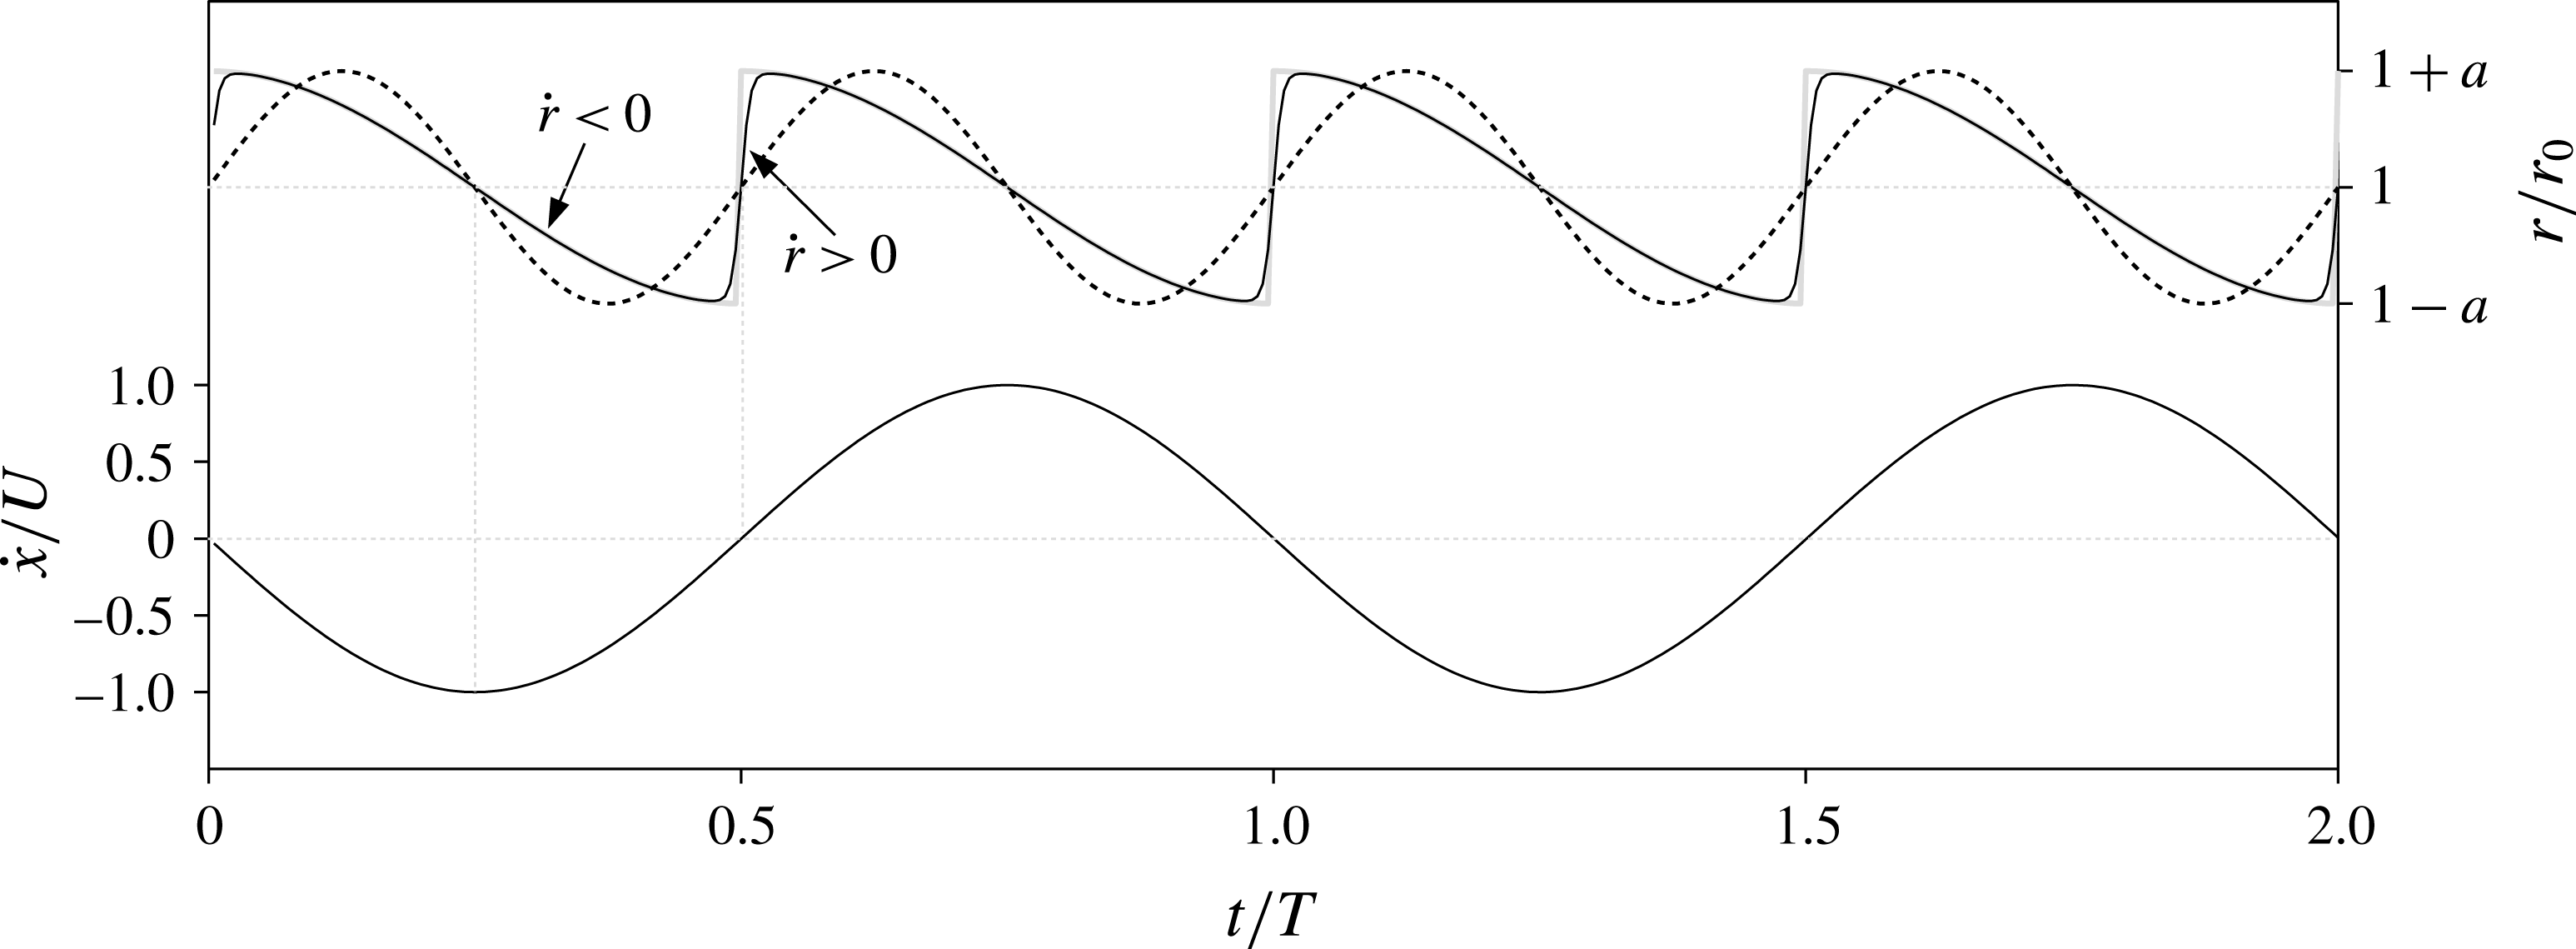
is the amplitude of oscillation. Due to the discontinuity, we call this the ‘sharp’ profile, as shown in figure 2.
$a$
is the amplitude of oscillation. Due to the discontinuity, we call this the ‘sharp’ profile, as shown in figure 2.
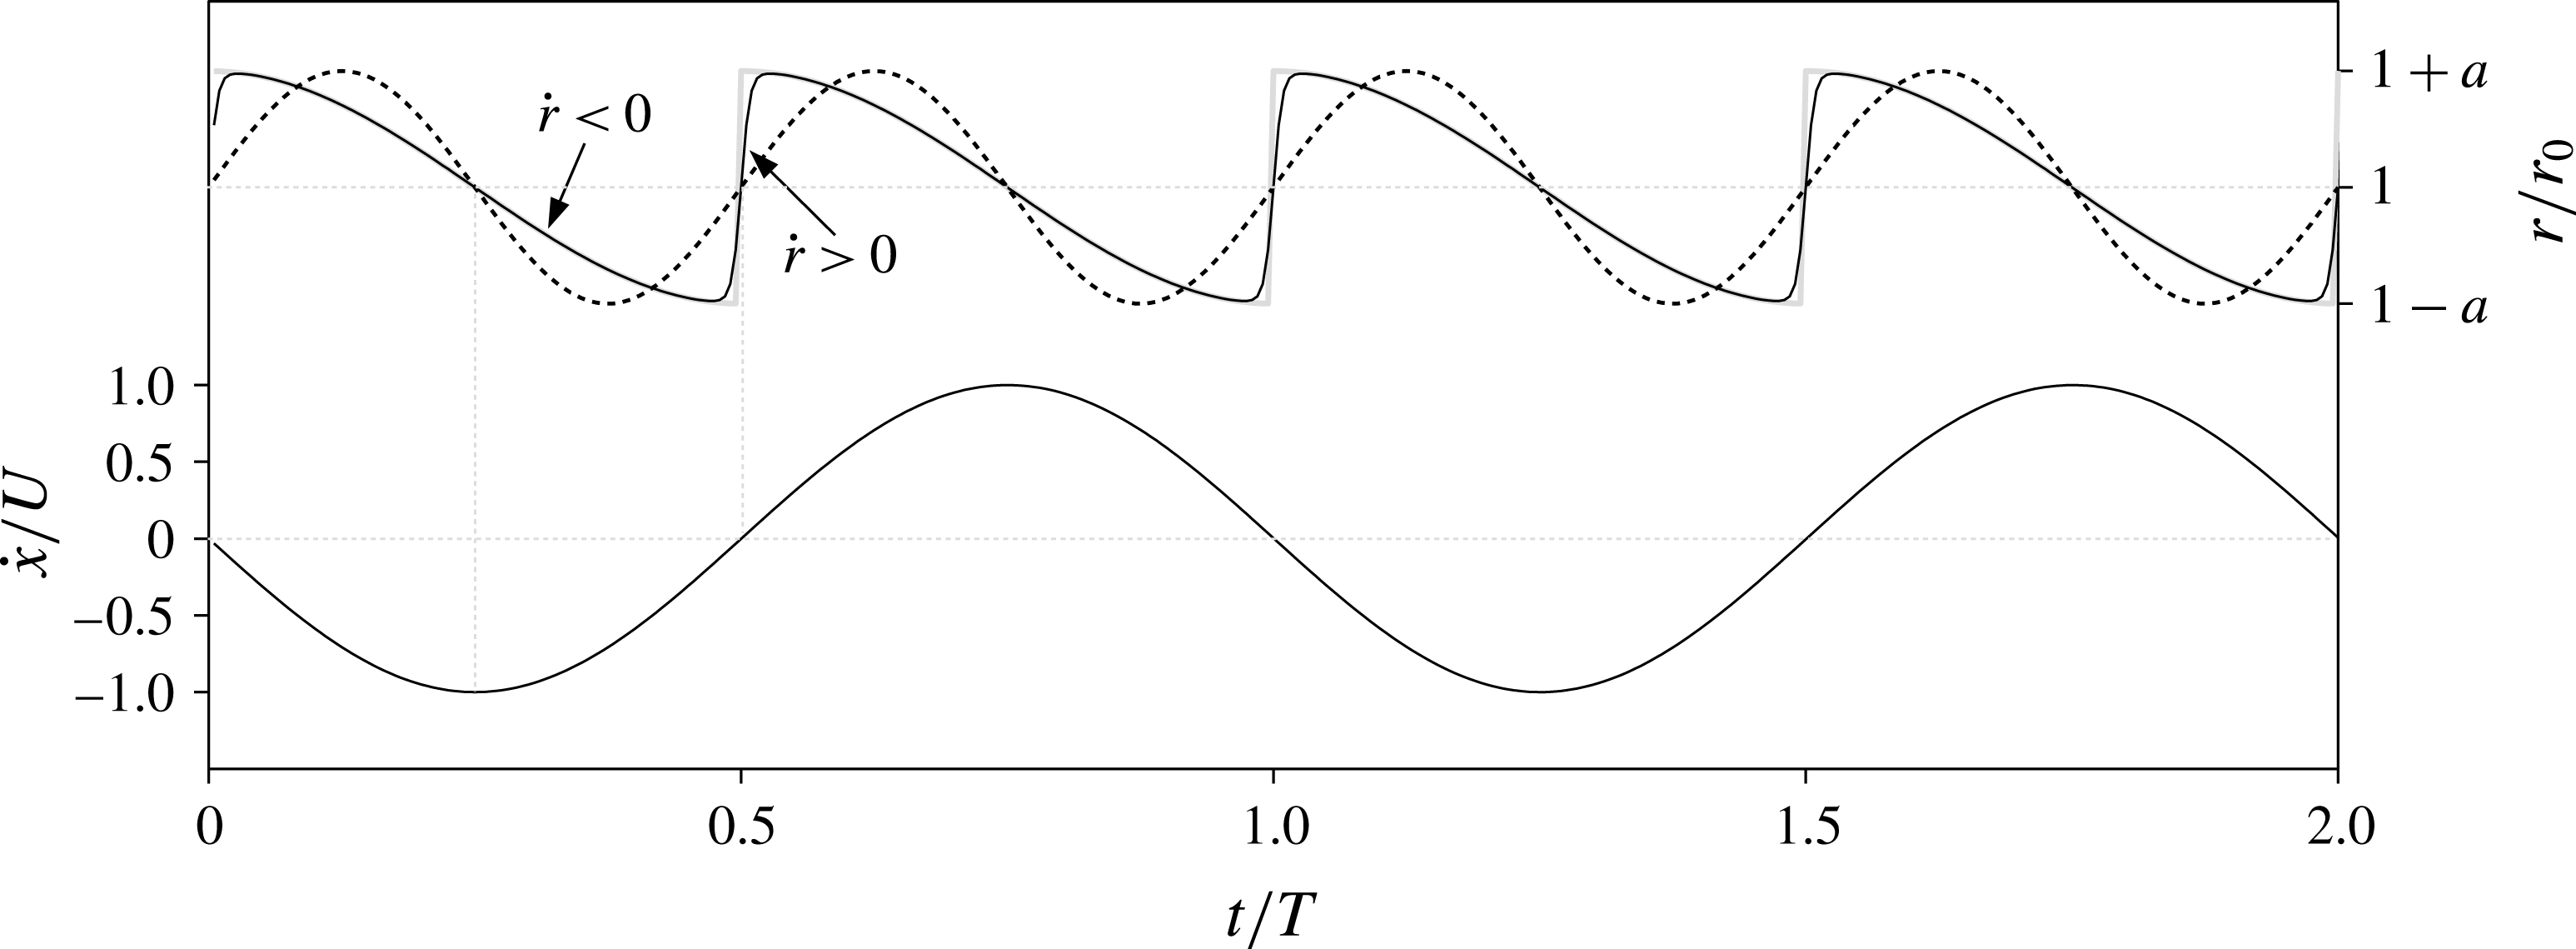
Figure 2. Upper part of the plot: profile of radius variation for a spherical oscillator pulsating around the average radius
![]() $r_{0}$
with sharp profile (2.9), grey; continuous sharp profile (3.1), black; and smooth profile (2.15), dashed black. Lower part of the plot: initially assumed velocity profile (2.6), with
$r_{0}$
with sharp profile (2.9), grey; continuous sharp profile (3.1), black; and smooth profile (2.15), dashed black. Lower part of the plot: initially assumed velocity profile (2.6), with
![]() $U={\it\omega}X$
being a reference velocity.
$U={\it\omega}X$
being a reference velocity.
The variation of
![]() $r$
will also change the effective mass proportional to
$r$
will also change the effective mass proportional to
![]() $(r/r_{0})^{3}$
,
$(r/r_{0})^{3}$
,
Assuming that the damping has been cancelled, dividing the unforced oscillator equation through by
![]() $m_{e}$
recovers the classic parametric oscillator system,
$m_{e}$
recovers the classic parametric oscillator system,
where the mass ratio is
![]() $m^{\ast }=m/({\it\rho}V_{0})$
and we have neglected nonlinear terms in
$m^{\ast }=m/({\it\rho}V_{0})$
and we have neglected nonlinear terms in
![]() $a/r_{0}$
. Pumping a parametric oscillator with a period of approximately half the natural period leads to parametric resonance and an exponential increase in oscillation amplitude (Lavroskii & Formal’skii Reference Lavroskii and Formal’skii1993). As the period of the sharp waveform (2.9) is
$a/r_{0}$
. Pumping a parametric oscillator with a period of approximately half the natural period leads to parametric resonance and an exponential increase in oscillation amplitude (Lavroskii & Formal’skii Reference Lavroskii and Formal’skii1993). As the period of the sharp waveform (2.9) is
![]() ${\rm\pi}/{\it\omega}$
due to the modulo in the definition of
${\rm\pi}/{\it\omega}$
due to the modulo in the definition of
![]() $t^{\ast }$
, this requires
$t^{\ast }$
, this requires
![]() ${\it\omega}\approx {\it\omega}_{n}$
. The window for parametric resonance is
${\it\omega}\approx {\it\omega}_{n}$
. The window for parametric resonance is
![]() ${\it\omega}^{2}/{\it\omega}_{n}^{2}=1\pm f/2$
, where
${\it\omega}^{2}/{\it\omega}_{n}^{2}=1\pm f/2$
, where
![]() $f=3(C_{11}/(m^{\ast }+C_{11}))(a/r_{0})$
is the parametric amplitude from (2.12).
$f=3(C_{11}/(m^{\ast }+C_{11}))(a/r_{0})$
is the parametric amplitude from (2.12).
When pumping within this resonant window, any initial perturbation of the system in
![]() $x$
will increase in magnitude until there is a net loss of power due to the fluid forces over a cycle,
$x$
will increase in magnitude until there is a net loss of power due to the fluid forces over a cycle,
![]() ${\rm\Delta}P=\int _{0}^{T}F{\dot{x}}\,\text{d}t$
. It should be noted that the total fluid force must be considered, not just the damping, because the added inertia contributes to the power balance. Substituting the quasi-dynamic model for
${\rm\Delta}P=\int _{0}^{T}F{\dot{x}}\,\text{d}t$
. It should be noted that the total fluid force must be considered, not just the damping, because the added inertia contributes to the power balance. Substituting the quasi-dynamic model for
![]() $F$
and setting
$F$
and setting
![]() ${\rm\Delta}P=0$
gives
${\rm\Delta}P=0$
gives
where we have used the fact that areas scale proportional to
![]() $(r/r_{0})^{2}$
and
$(r/r_{0})^{2}$
and
![]() $V_{0}=S_{0}r_{0}/3$
. Substituting the waveforms for
$V_{0}=S_{0}r_{0}/3$
. Substituting the waveforms for
![]() $x$
and
$x$
and
![]() $r$
(2.6), (2.9), we find that all of the nonlinear
$r$
(2.6), (2.9), we find that all of the nonlinear
![]() $a/r_{0}$
terms cancel and we obtain a simple linear relationship between the amplitude of pumping and the oscillation response,
$a/r_{0}$
terms cancel and we obtain a simple linear relationship between the amplitude of pumping and the oscillation response,
On plugging this relationship into the effective damping (2.4), we see that we have in fact overcompensated for the drag – the body experiences thrust throughout the cycle. This thrust is required to compensate for the power spent on pumping the added inertia.
2.2 Smooth pumping profile
The previous results generalize to cases without a discontinuous shape change. Consider instead a smooth profile that still has period
![]() ${\rm\pi}/{\it\omega}$
and amplitude
${\rm\pi}/{\it\omega}$
and amplitude
![]() $a$
,
$a$
,
As before, variation in
![]() $r$
leads to variation in
$r$
leads to variation in
![]() $m_{e}$
, and parametric resonance when pumping with
$m_{e}$
, and parametric resonance when pumping with
![]() ${\it\omega}\approx {\it\omega}_{n}$
. Using (2.15) and neglecting nonlinear terms in
${\it\omega}\approx {\it\omega}_{n}$
. Using (2.15) and neglecting nonlinear terms in
![]() $a/r_{0}$
, we find a new relationship between
$a/r_{0}$
, we find a new relationship between
![]() $X$
and
$X$
and
![]() $a$
for which
$a$
for which
![]() ${\rm\Delta}P=0$
,
${\rm\Delta}P=0$
,
Comparing with (2.14), we see that the smooth profile increases the response for a given amplitude because the rate of shrinking is double that of the sharp profile, figure 2, but the irregular cancellation of the drag over a cycle limits the increase to 18 %.
3 Results for a spherical volume-changing oscillator
We next present the nonlinear response of the volume-changing oscillator using the quasi-dynamic forcing model and fully coupled Navier–Stokes simulations. We restrict our analysis to a spherical body with mass ratio
![]() $m^{\ast }=1$
for brevity.
$m^{\ast }=1$
for brevity.
3.1 Results for the quasi-dynamic model
To apply the quasi-dynamic forcing model, we use the standard potential flow added mass for a sphere
![]() $C_{11}=1/2$
and the reference drag coefficient for oscillating spheres at intermediate Reynolds number
$C_{11}=1/2$
and the reference drag coefficient for oscillating spheres at intermediate Reynolds number
![]() $C_{D}=0.45$
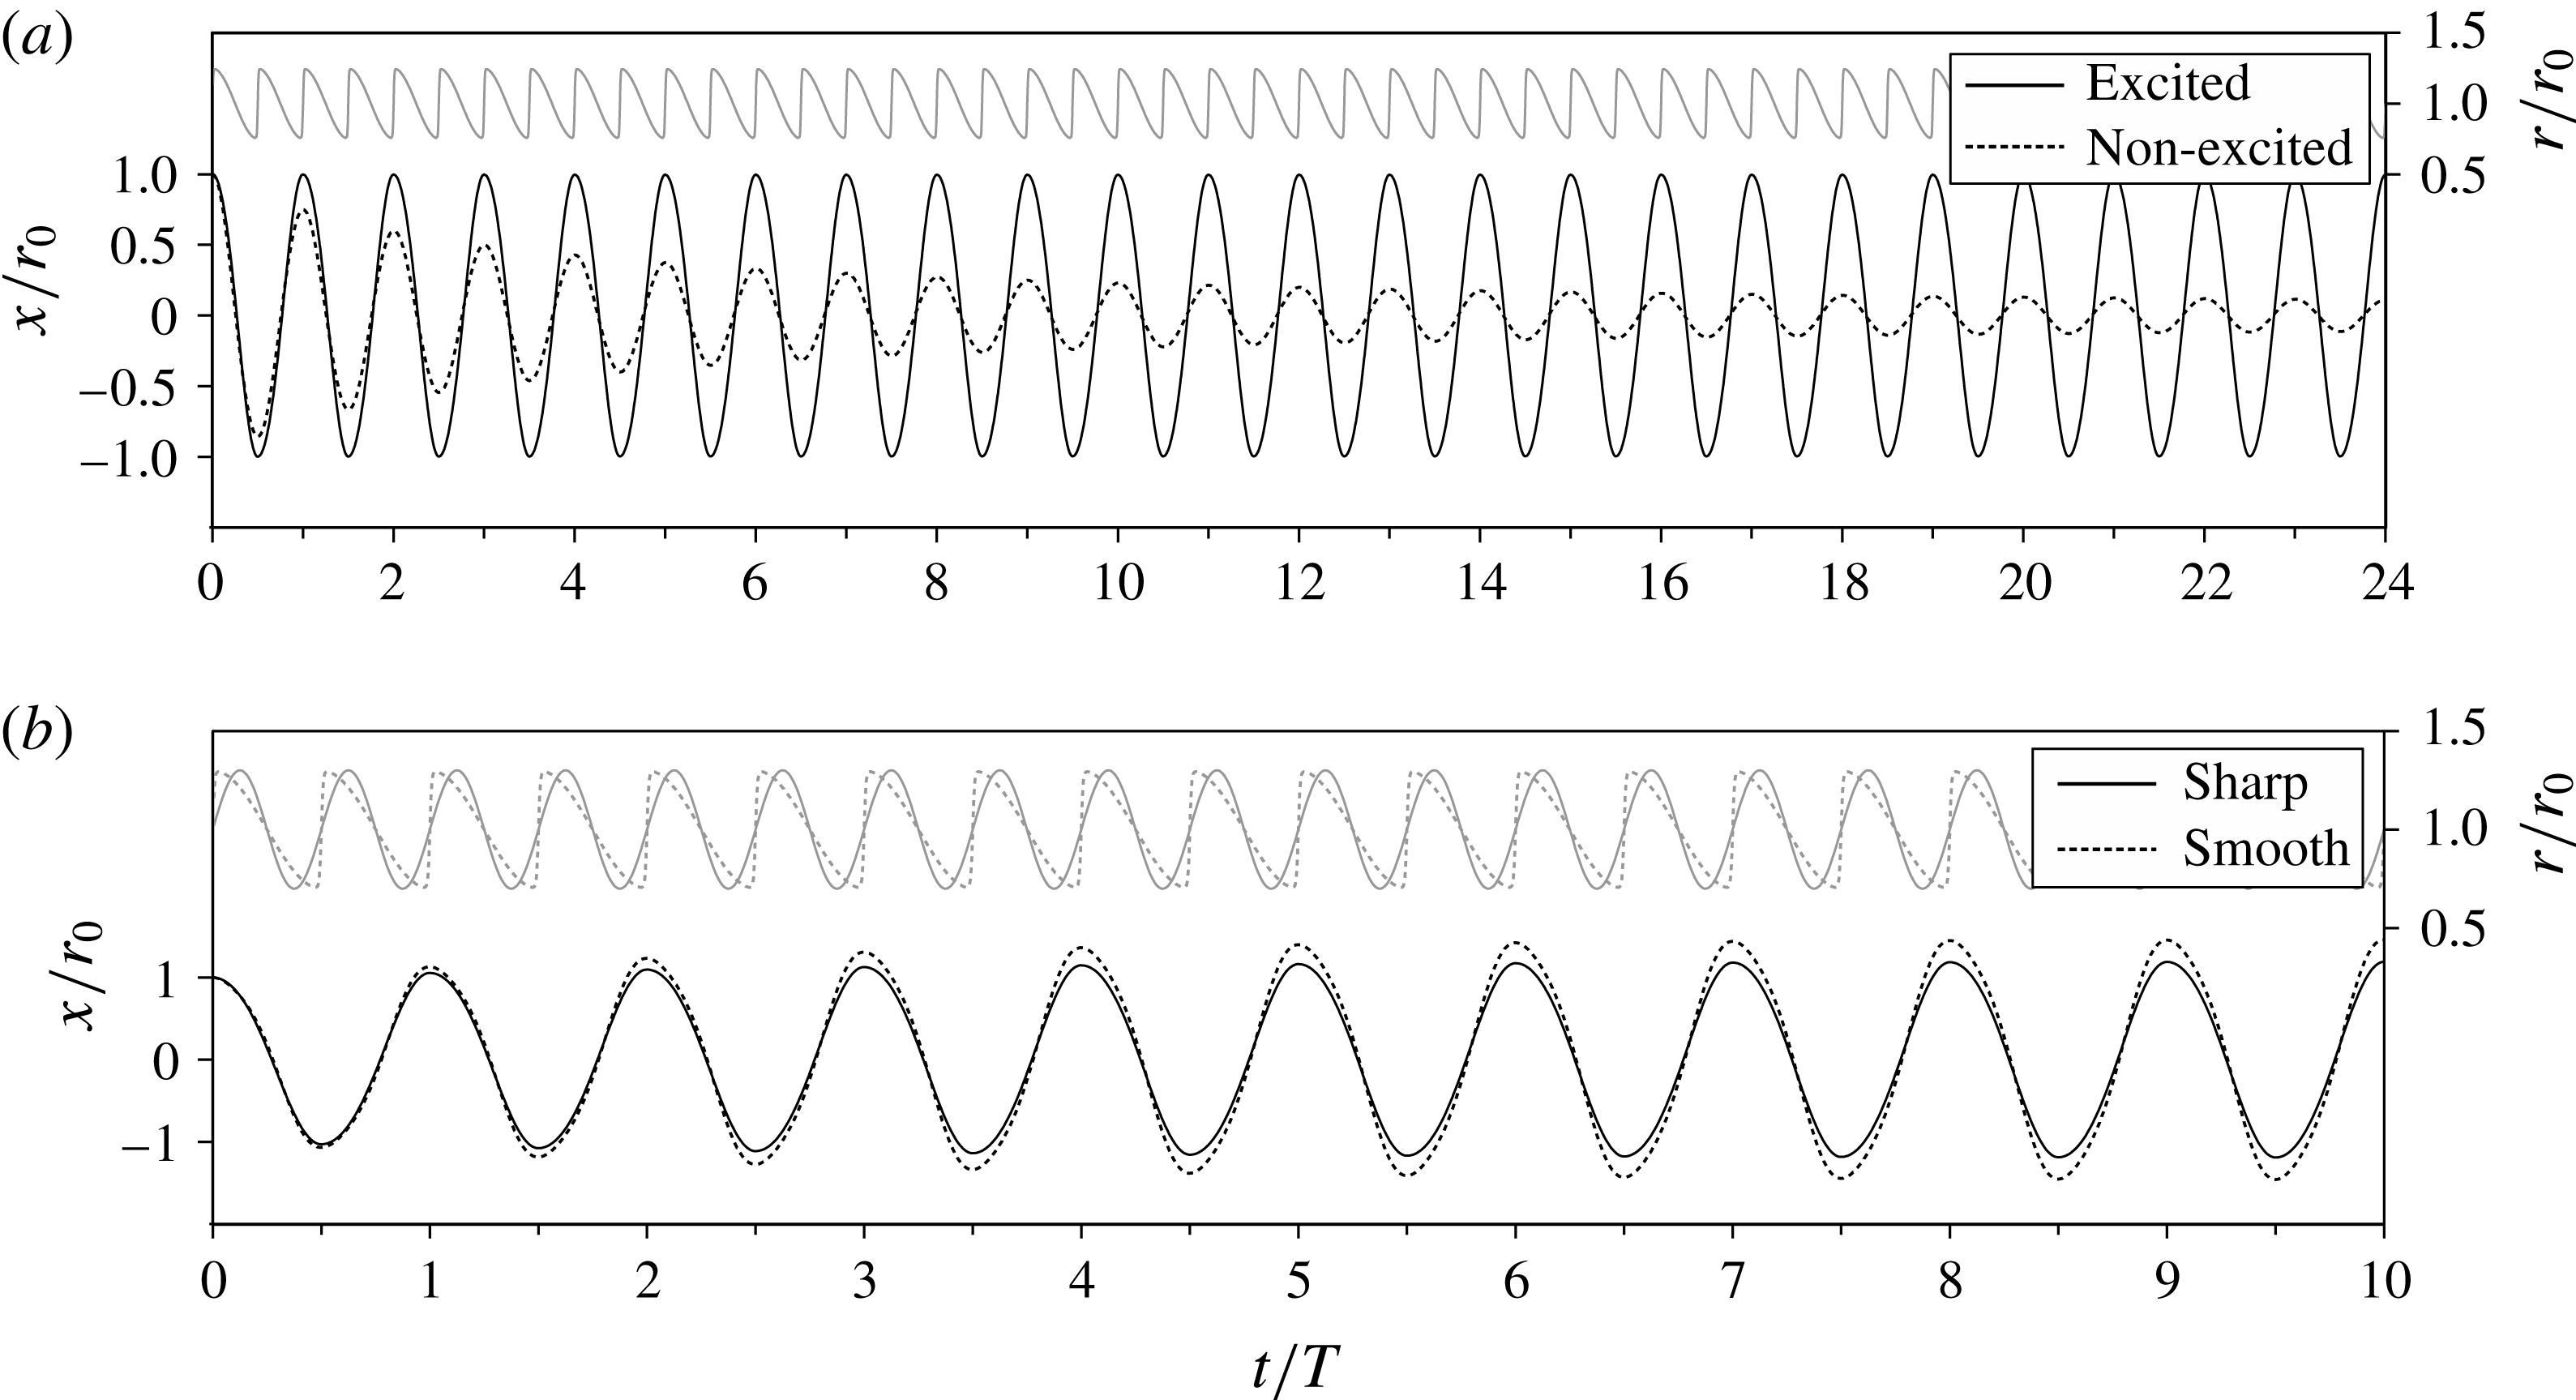
(Mei Reference Mei1994). With these values set, (2.5) is integrated numerically using a standard high-order method with adaptive time stepping. Figure 3(a) compares the response of the oscillator when not excited with the case when it is excited using the sharp pumping profile (2.9) with
$C_{D}=0.45$
(Mei Reference Mei1994). With these values set, (2.5) is integrated numerically using a standard high-order method with adaptive time stepping. Figure 3(a) compares the response of the oscillator when not excited with the case when it is excited using the sharp pumping profile (2.9) with
![]() $a/r_{0}=0.225$
and
$a/r_{0}=0.225$
and
![]() ${\it\omega}={\it\omega}_{n}$
. As expected, the unexcited oscillator exhibits the classic ‘underdamped’ response. In contrast, the pumped oscillator exhibits sustained oscillations with amplitude
${\it\omega}={\it\omega}_{n}$
. As expected, the unexcited oscillator exhibits the classic ‘underdamped’ response. In contrast, the pumped oscillator exhibits sustained oscillations with amplitude
![]() $X=r_{0}$
, in agreement with (2.14), demonstrating complete drag cancellation.
$X=r_{0}$
, in agreement with (2.14), demonstrating complete drag cancellation.

Figure 3. Comparison of radius variation (upper part) and the resulting oscillations (lower part) for (a) a non-excited spherical oscillator and an oscillator pumped using the sharp profile with
![]() $a=0.225r_{0}$
at the natural frequency, (b) oscillators excited by the sharp and smooth profiles with the same frequency and amplitude as (a).
$a=0.225r_{0}$
at the natural frequency, (b) oscillators excited by the sharp and smooth profiles with the same frequency and amplitude as (a).
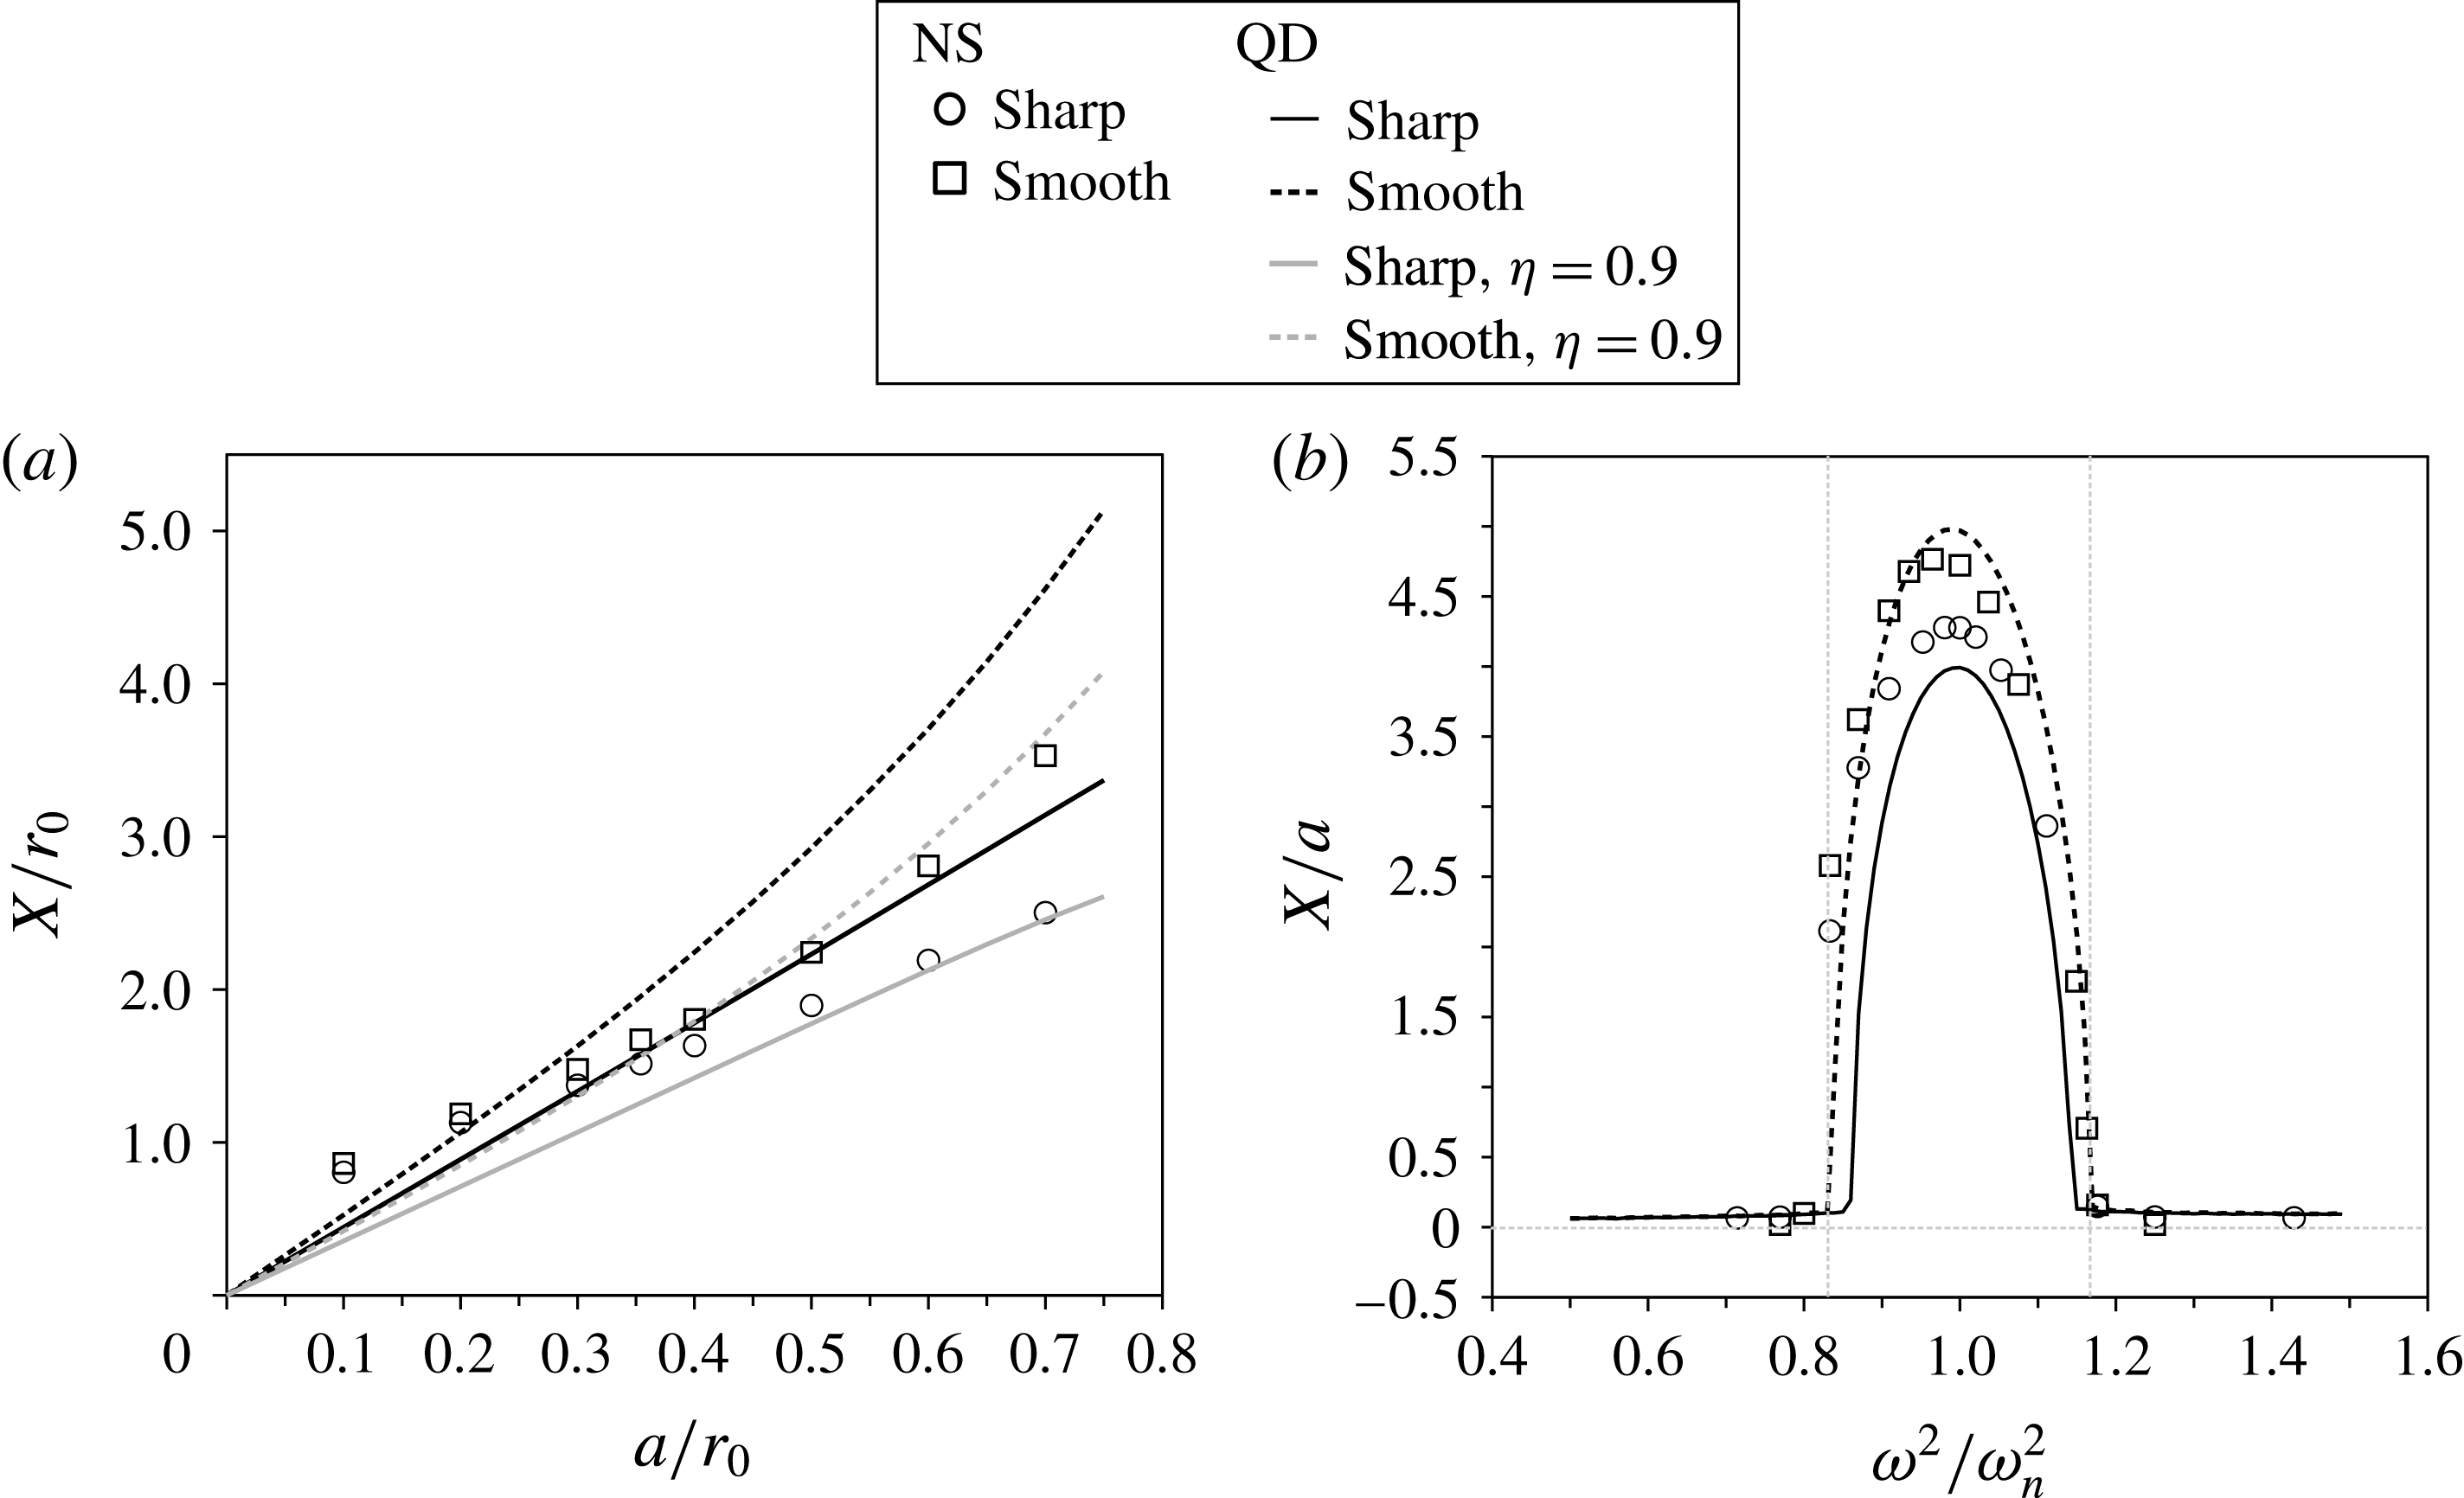
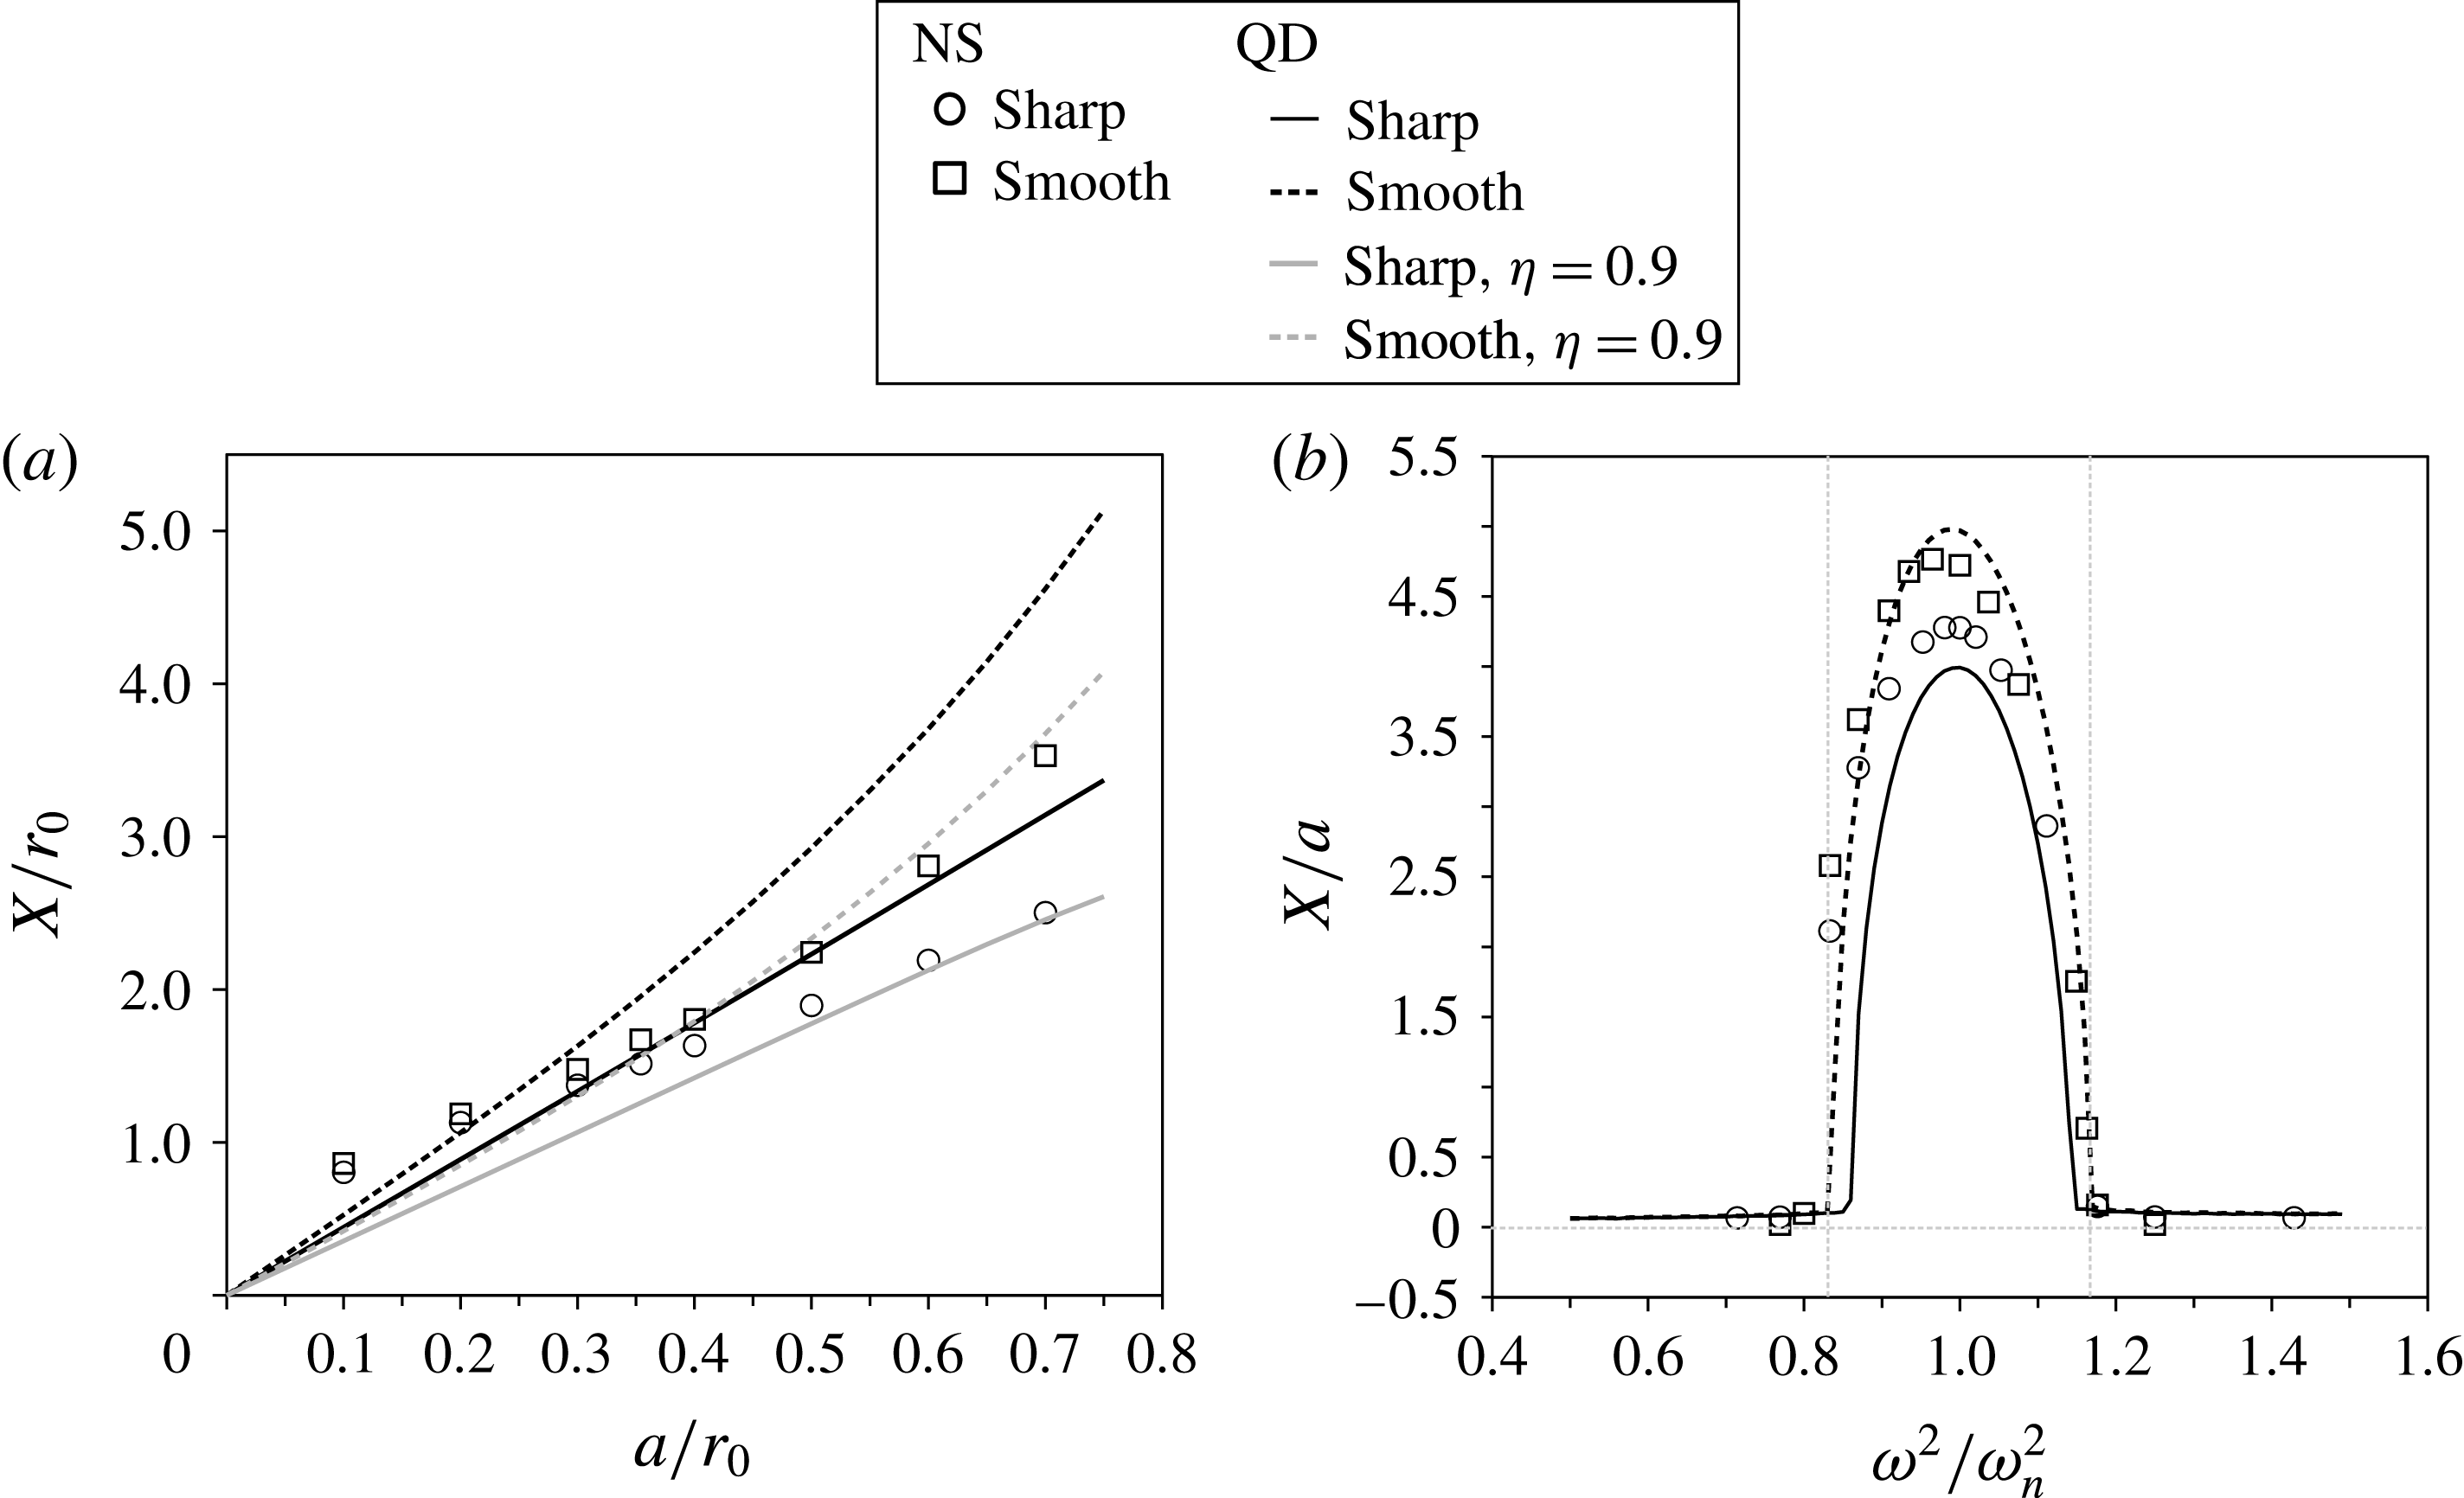
Figure 4. (a) Oscillator response to varied pumping amplitude. The symbols are the Navier–Stokes (NS) simulations, the lines are the quasi-dynamic (QD) model results. The grey
![]() ${\it\eta}=0.9$
lines are for the QD model with 90 % added-mass recovery (4.1). (b) System response to varied pumping frequency. The grey vertical lines mark the
${\it\eta}=0.9$
lines are for the QD model with 90 % added-mass recovery (4.1). (b) System response to varied pumping frequency. The grey vertical lines mark the
![]() ${\it\omega}^{2}/{\it\omega}_{n}^{2}=1\pm f/2$
envelope within which parametric resonance is expected (2.12).
${\it\omega}^{2}/{\it\omega}_{n}^{2}=1\pm f/2$
envelope within which parametric resonance is expected (2.12).
Figure 3(b) compares the oscillator response between the sharp and smooth pumping profiles using the same
![]() $a$
and
$a$
and
![]() ${\it\omega}$
. The ‘smooth’ sinusoidal profile exhibits slightly increased terminal amplitudes, in agreement with (2.16). The response also contains more evidence of higher harmonics than the ‘sharp’ response due to the application of positive and negative damping at different points in the cycle.
${\it\omega}$
. The ‘smooth’ sinusoidal profile exhibits slightly increased terminal amplitudes, in agreement with (2.16). The response also contains more evidence of higher harmonics than the ‘sharp’ response due to the application of positive and negative damping at different points in the cycle.
We extend the comparison between the sharp and smooth profiles across the amplitude range
![]() $0\leqslant a/r_{0}\leqslant 0.8$
, pumping at the natural frequency, see figure 4(a). Each case is integrated until the oscillation amplitudes attain steady values. Finally, we study the effect of out-of-phase parametric forcing in figure 4(b) by pumping across the frequency range
$0\leqslant a/r_{0}\leqslant 0.8$
, pumping at the natural frequency, see figure 4(a). Each case is integrated until the oscillation amplitudes attain steady values. Finally, we study the effect of out-of-phase parametric forcing in figure 4(b) by pumping across the frequency range
![]() $0.5\leqslant {\it\omega}^{2}/{{\it\omega}_{n}}^{2}\leqslant 1.5$
at
$0.5\leqslant {\it\omega}^{2}/{{\it\omega}_{n}}^{2}\leqslant 1.5$
at
![]() $a/r_{0}=0.35$
.
$a/r_{0}=0.35$
.
3.2 Results for fully coupled Navier–Stokes simulations
The quasi-dynamic forcing model neglects wake history effects, must be supplied with values for the added mass and drag coefficients, and assumes that all of the added momentum of the fluid is recoverable via shape change. A set of three-dimensional fully coupled Navier–Stokes simulations is used to assess the limitations of the model, and verify the ability of added-mass variation to cancel drag forces indefinitely.
To ensure relevance to high-speed biological and biomimetic systems, we use a large Stokes number,
![]() ${\it\varepsilon}=\sqrt{r_{0}^{2}{\it\omega}/2{\it\nu}}=25$
. The Reynolds number based on the maximum speed
${\it\varepsilon}=\sqrt{r_{0}^{2}{\it\omega}/2{\it\nu}}=25$
. The Reynolds number based on the maximum speed
![]() $U={\it\omega}X$
and diameter
$U={\it\omega}X$
and diameter
![]() $D=2r_{0}$
is then
$D=2r_{0}$
is then
![]() $Re=4(X/r_{0}){\it\varepsilon}^{2}$
, which depends on the response of the system but will always be less than
$Re=4(X/r_{0}){\it\varepsilon}^{2}$
, which depends on the response of the system but will always be less than
![]() $10^{4}$
. Weymouth et al. (Reference Weymouth, Subramaniam and Triantafyllou2015) introduced a shape-change rate to characterize the ability of a body to recapture added-mass energy,
$10^{4}$
. Weymouth et al. (Reference Weymouth, Subramaniam and Triantafyllou2015) introduced a shape-change rate to characterize the ability of a body to recapture added-mass energy,
![]() ${\it\sigma}^{\ast }=(\dot{V}/AU)\sqrt{Re}$
. Added-mass recovery was estimated to require
${\it\sigma}^{\ast }=(\dot{V}/AU)\sqrt{Re}$
. Added-mass recovery was estimated to require
![]() ${\it\sigma}^{\ast }>9$
, while experiments performed at
${\it\sigma}^{\ast }>9$
, while experiments performed at
![]() ${\it\sigma}^{\ast }=77$
were found to provide a measurable contribution of added-mass recovery to thrust. Application of this factor to the spherical oscillator gives
${\it\sigma}^{\ast }=77$
were found to provide a measurable contribution of added-mass recovery to thrust. Application of this factor to the spherical oscillator gives
![]() ${\it\sigma}^{\ast }=4{\dot{r}}\sqrt{Re}/({\it\omega}X)$
, which is again dependent on the magnitude of response, but will be less than 100.
${\it\sigma}^{\ast }=4{\dot{r}}\sqrt{Re}/({\it\omega}X)$
, which is again dependent on the magnitude of response, but will be less than 100.
The simulations use the boundary data immersion method (BDIM) (Weymouth & Yue Reference Weymouth and Yue2011; Maertens & Weymouth Reference Maertens and Weymouth2015), a robust immersed boundary method suitable for dynamic fluid–structure interaction (FSI) problems. This method solves both the Navier–Stokes equations and the dynamics of the volume-changing sphere as it travels through the fluid. Previous work has validated this approach for a variety of FSI problems including a deforming self-propelled model of a rapidly escaping octopus (Weymouth & Triantafyllou Reference Weymouth and Triantafyllou2013).
The computational domain extends
![]() $8r_{0}$
from the maximum excursion of the sphere in every direction. No-slip and no-penetration boundary conditions are imposed on the solid–fluid interface. Pressure outlet conditions are defined at the domain boundaries to enable fluid mass flux to compensate for the volume changes of the body. The fluid equations are solved using a second-order finite-volume method in space and an explicit second-order method in time. The solid equation is simply (2.1), with the fluid force
$8r_{0}$
from the maximum excursion of the sphere in every direction. No-slip and no-penetration boundary conditions are imposed on the solid–fluid interface. Pressure outlet conditions are defined at the domain boundaries to enable fluid mass flux to compensate for the volume changes of the body. The fluid equations are solved using a second-order finite-volume method in space and an explicit second-order method in time. The solid equation is simply (2.1), with the fluid force
![]() $F$
calculated from the fluid simulation. All simulations are performed with 64 points per diameter in the region in which the sphere travels, with exponential grid stretching applied in the far field. The choice of this degree of resolution is based on the grid convergence analysis reported in table 1.
$F$
calculated from the fluid simulation. All simulations are performed with 64 points per diameter in the region in which the sphere travels, with exponential grid stretching applied in the far field. The choice of this degree of resolution is based on the grid convergence analysis reported in table 1.
Table 1. Grid spacing
![]() $h$
convergence results using the smooth pumping profile with
$h$
convergence results using the smooth pumping profile with
![]() $a/r_{0}=0.35$
and
$a/r_{0}=0.35$
and
![]() ${\it\omega}={\it\omega}_{n}$
. The percentage error is computed relative to the finest grid.
${\it\omega}={\it\omega}_{n}$
. The percentage error is computed relative to the finest grid.
The last methodology concern is that the discontinuity in the sharp pumping profile would induce infinite forces in the fluid domain. In order to avoid this, a continuous version is formulated by parametrizing the rate of inflation,
![]() ${\it\Delta}$
, such that
${\it\Delta}$
, such that
The result is continuous, but as
![]() ${\it\Delta}\rightarrow \infty$
we recover the modulo function. We choose
${\it\Delta}\rightarrow \infty$
we recover the modulo function. We choose
![]() ${\it\Delta}=40$
such that when
${\it\Delta}=40$
such that when
![]() $\tilde{t}$
is used in (2.9) instead of
$\tilde{t}$
is used in (2.9) instead of
![]() $t^{\ast }$
, the resulting profile closely matches the sharp profile but without discontinuity, see figure 2.
$t^{\ast }$
, the resulting profile closely matches the sharp profile but without discontinuity, see figure 2.
We next present detailed results for the spherical oscillator undergoing pulsations with both ‘continuous sharp’ and ‘smooth’ profiles with
![]() $a/r_{0}=0.35$
and
$a/r_{0}=0.35$
and
![]() ${\it\omega}={\it\omega}_{n}$
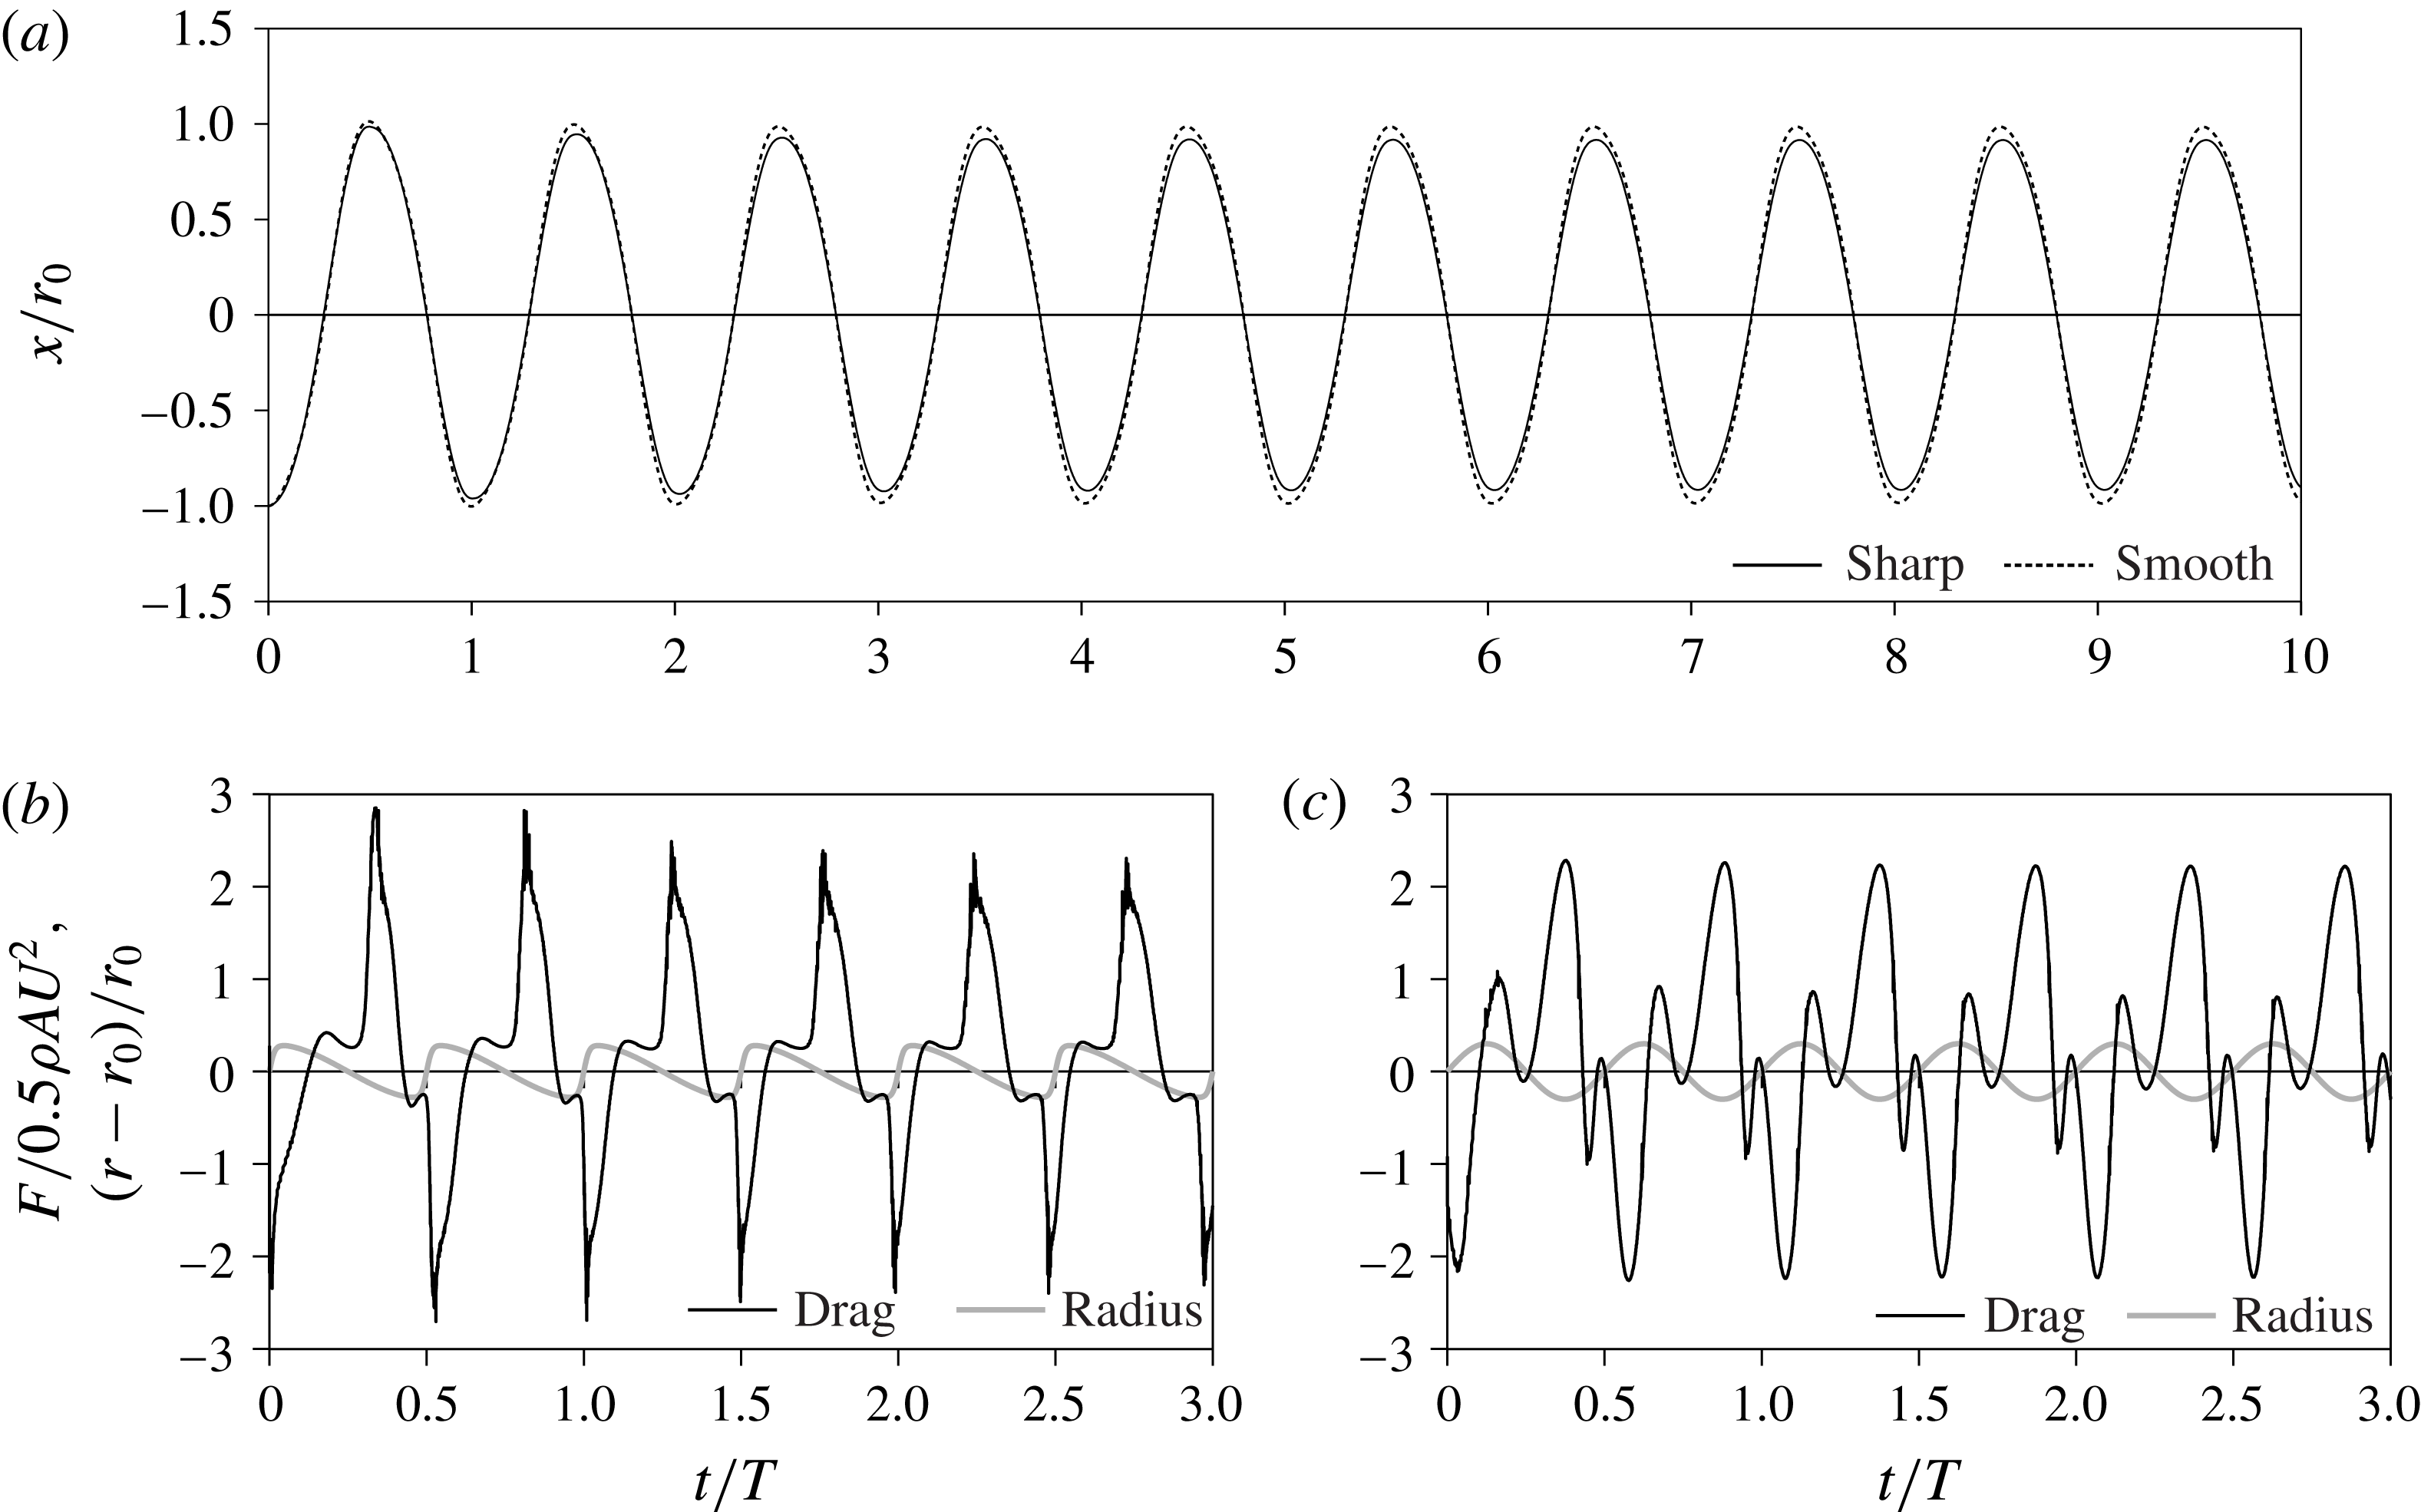
. The evolution of the displacement of the oscillator is reported in figure 5(a), confirming a rapid onset of the sustained drag cancellation regime. The time-varying net force on the oscillator is shown in figure 5(b,c). Power is transferred consistently into the body during the shrinking phase of the sharp profile (
${\it\omega}={\it\omega}_{n}$
. The evolution of the displacement of the oscillator is reported in figure 5(a), confirming a rapid onset of the sustained drag cancellation regime. The time-varying net force on the oscillator is shown in figure 5(b,c). Power is transferred consistently into the body during the shrinking phase of the sharp profile (
![]() $F>0$
), whereas power losses are found to take place intermittently when using the smooth profile. The evolution of vortex shedding throughout a late-stage period of oscillation is depicted in figure 6 by visualizing the
$F>0$
), whereas power losses are found to take place intermittently when using the smooth profile. The evolution of vortex shedding throughout a late-stage period of oscillation is depicted in figure 6 by visualizing the
![]() ${\it\lambda}_{2}$
vortex criterion of the wake for both the sharp and the smooth profiles.
${\it\lambda}_{2}$
vortex criterion of the wake for both the sharp and the smooth profiles.
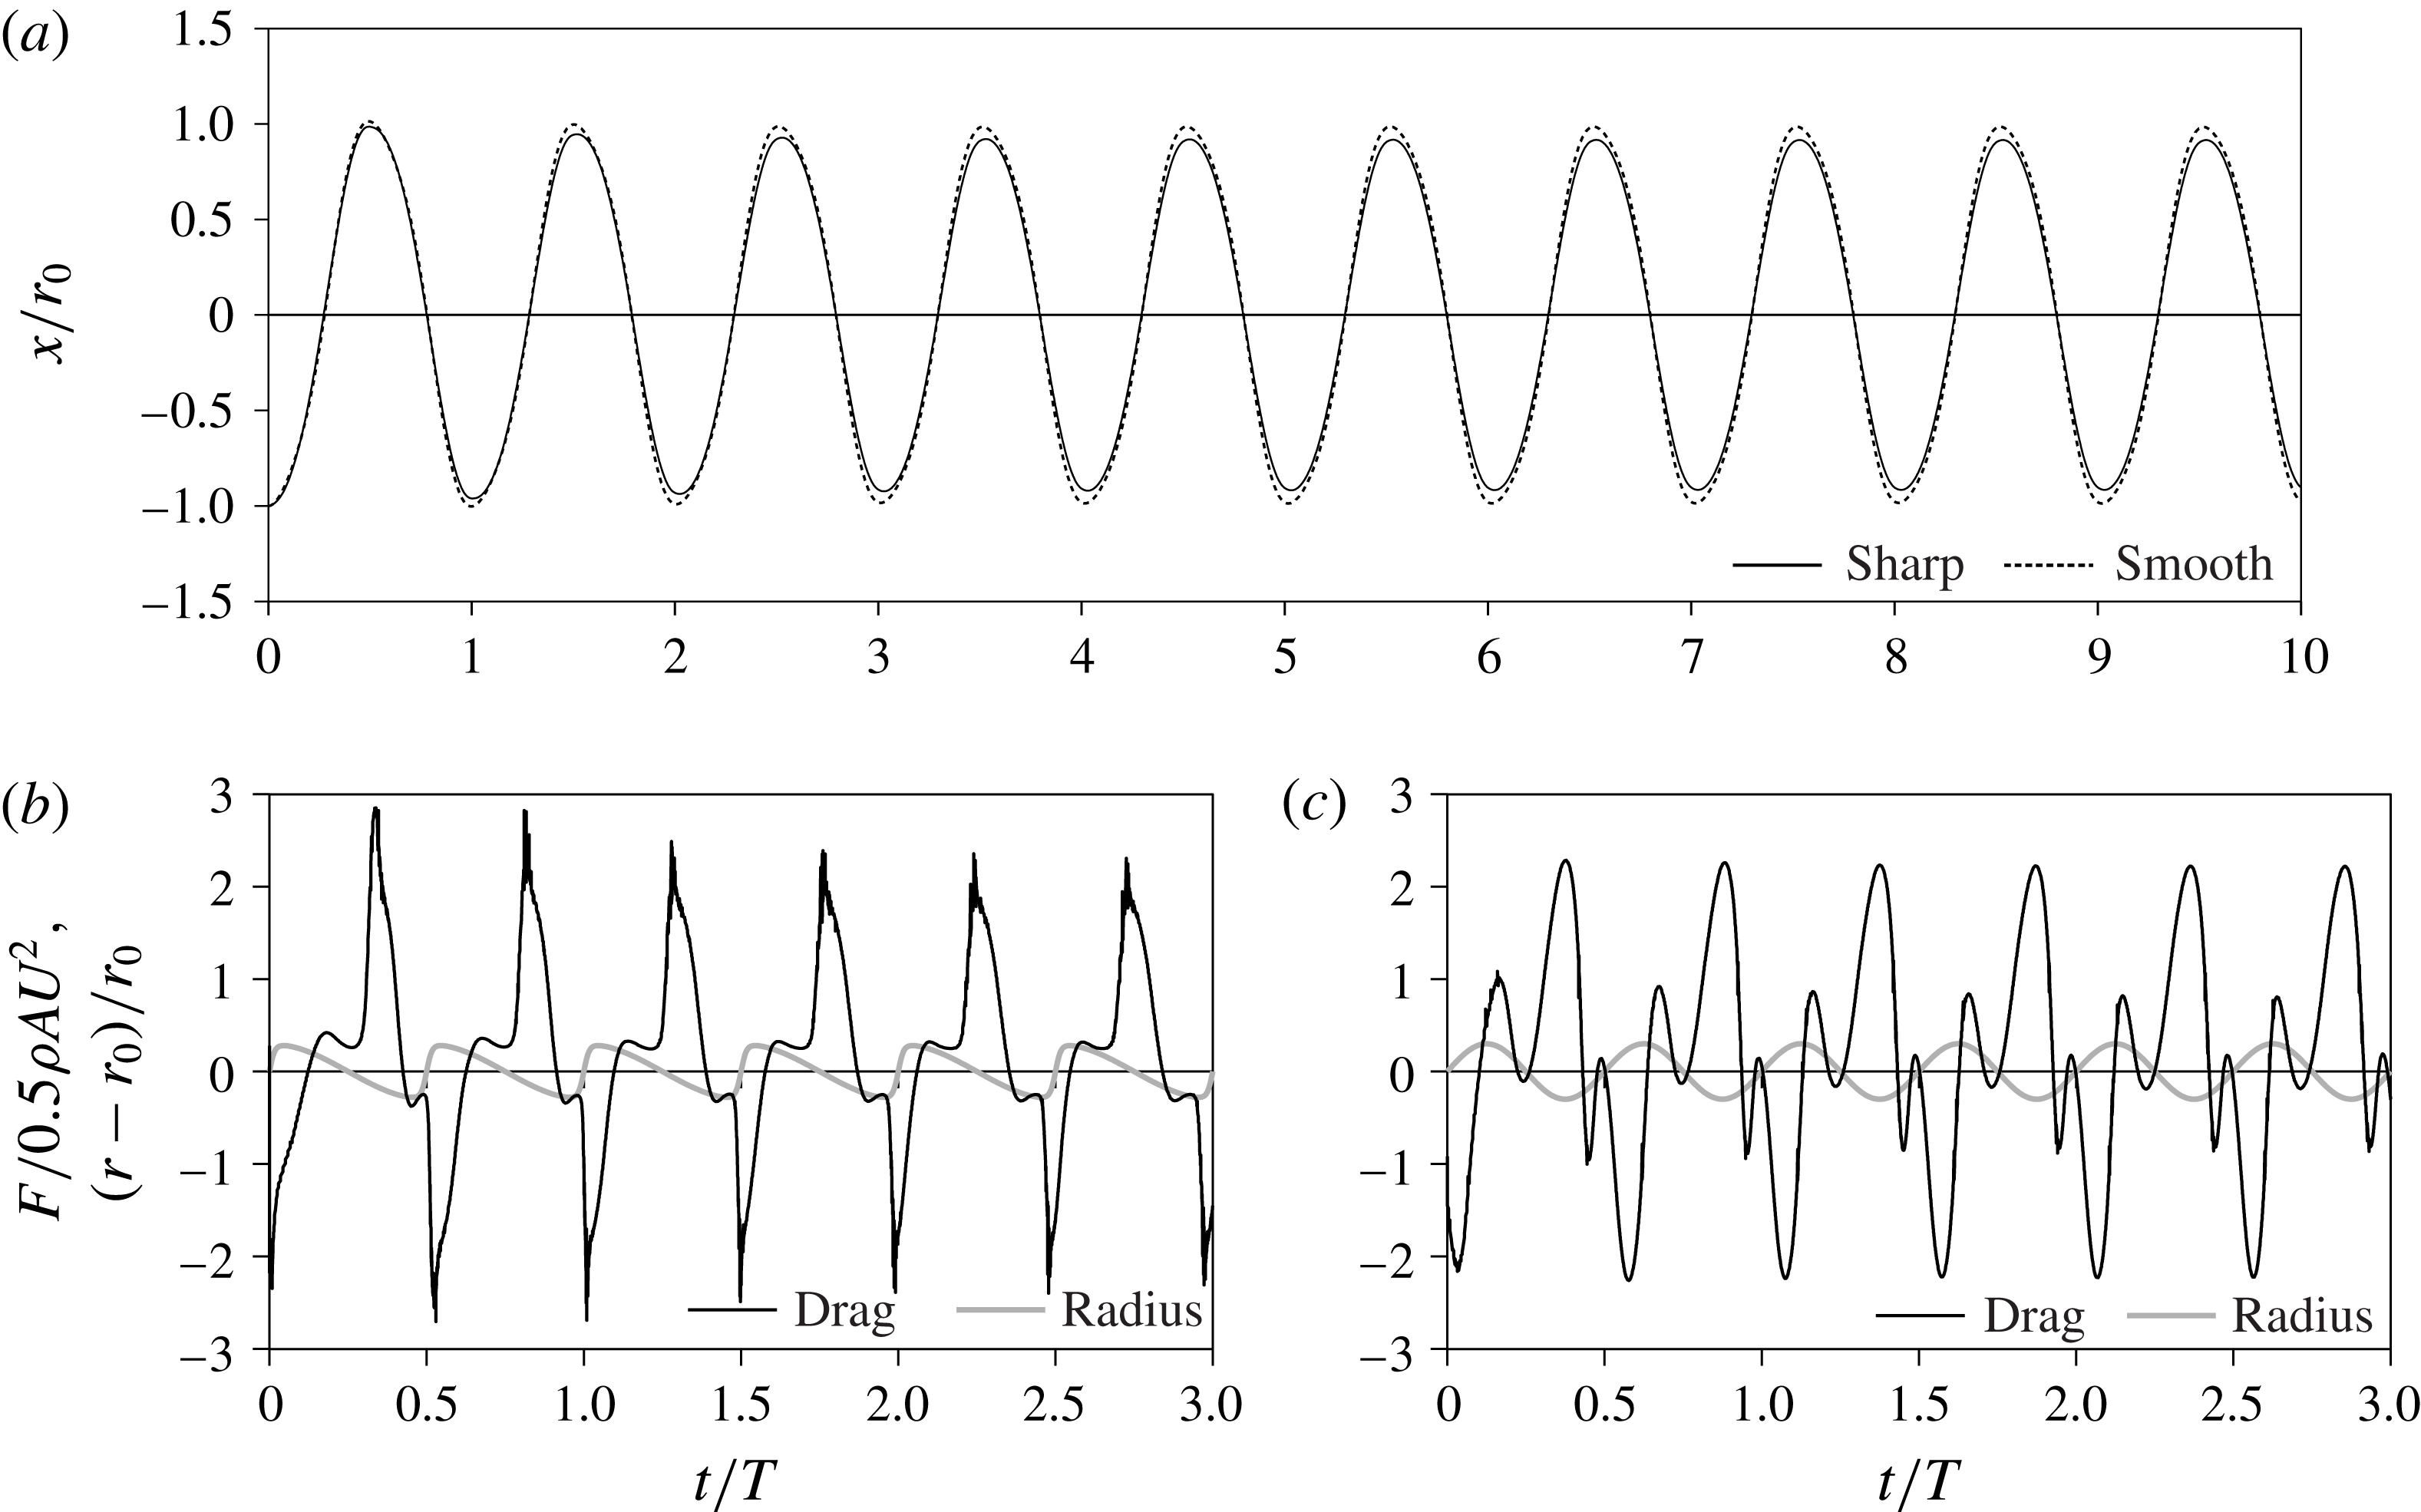
Figure 5. Results from Navier–Stokes solution of the dynamics of the shape-changing oscillator: (a) amplitude of the oscillation for the sharp and smooth pumping; (b) and (c) time-varying drag coefficient of the oscillator for the sharp (b) and smooth (c) pumping.

Figure 6. Evolution of the
![]() ${\it\lambda}_{2}$
vortex criterion during one oscillation after attainment of the zero-damping regime in response to the sharp (a,c,e,g,i) and smooth (b,d,f,h,j) radius variation profile at five moments along the cycle. See movie 1 in the supplementary material available at http://dx.doi.org/10.1017/jfm.2016.353.
${\it\lambda}_{2}$
vortex criterion during one oscillation after attainment of the zero-damping regime in response to the sharp (a,c,e,g,i) and smooth (b,d,f,h,j) radius variation profile at five moments along the cycle. See movie 1 in the supplementary material available at http://dx.doi.org/10.1017/jfm.2016.353.
Finally, we repeat the amplitude and frequency studies of the previous section using the fully coupled Navier–Stokes simulations. The results for pumping amplitude tests in the range
![]() $0.1\leqslant a/r_{0}\leqslant 0.7$
at 0.1 increments and
$0.1\leqslant a/r_{0}\leqslant 0.7$
at 0.1 increments and
![]() ${\it\omega}={\it\omega}_{n}$
are given in figure 4(a). The results of 15 simulations each for the sharp and smooth profiles for pumping frequencies of
${\it\omega}={\it\omega}_{n}$
are given in figure 4(a). The results of 15 simulations each for the sharp and smooth profiles for pumping frequencies of
![]() $0.36\leqslant {\it\omega}/{\it\omega}_{n}\leqslant 1.96$
and
$0.36\leqslant {\it\omega}/{\it\omega}_{n}\leqslant 1.96$
and
![]() $0.64\leqslant {\it\omega}/{\it\omega}_{n}\leqslant 1.7$
respectively and
$0.64\leqslant {\it\omega}/{\it\omega}_{n}\leqslant 1.7$
respectively and
![]() $a=0.35$
are given in figure 4(b).
$a=0.35$
are given in figure 4(b).
4 Discussion
The results presented for both the quasi-dynamic forcing model and the fully coupled Navier–Stokes simulations confirm the sustained cancellation of drag by added-mass pumping, see figures 3 and 5(a). Pumping drives resonant growth when the excitation frequency
![]() ${\it\omega}$
is in the range
${\it\omega}$
is in the range
![]() ${\it\omega}_{n}\sqrt{1\pm a/2r_{0}}$
, figure 4(b), in agreement with the parametric oscillator (2.12) for
${\it\omega}_{n}\sqrt{1\pm a/2r_{0}}$
, figure 4(b), in agreement with the parametric oscillator (2.12) for
![]() $C_{11}=1/2$
,
$C_{11}=1/2$
,
![]() $m^{\ast }=1$
. The limiting value of
$m^{\ast }=1$
. The limiting value of
![]() $X/a$
is approximately constant, and the limit using the smooth profile is slightly greater than that for the sharp profile, figure 4(a), in agreement with the analytic predictions (2.14) and (2.16).
$X/a$
is approximately constant, and the limit using the smooth profile is slightly greater than that for the sharp profile, figure 4(a), in agreement with the analytic predictions (2.14) and (2.16).
The deficiencies of the quasi-dynamic (QD) model can be assessed by comparing with the Navier–Stokes (NS) results. First, the QD model underpredicts the response for small pumping amplitude,
![]() $a/r_{0}<0.3$
in figure 4(a). The Kulegan–Carpenter number is simply
$a/r_{0}<0.3$
in figure 4(a). The Kulegan–Carpenter number is simply
![]() $X/r_{0}$
for this oscillator, and it seems that for these low amplitude motions, i.e. when
$X/r_{0}$
for this oscillator, and it seems that for these low amplitude motions, i.e. when
![]() $X/r_{0}<1$
, the wake history effects cannot be ignored.
$X/r_{0}<1$
, the wake history effects cannot be ignored.
Second, the QD model overpredicts the response for
![]() $a/r_{0}>0.4$
in figure 4(a). In this case, the Kulegan–Carpenter number and Reynolds number are large enough that the history effects on a sphere should be negligible and the
$a/r_{0}>0.4$
in figure 4(a). In this case, the Kulegan–Carpenter number and Reynolds number are large enough that the history effects on a sphere should be negligible and the
![]() $C_{D}$
used should be reasonably accurate (Mei Reference Mei1994). Instead, the deficiency is due to the assumption of perfect energy recovery by the process of added-mass variation implicit in the effective damping coefficient
$C_{D}$
used should be reasonably accurate (Mei Reference Mei1994). Instead, the deficiency is due to the assumption of perfect energy recovery by the process of added-mass variation implicit in the effective damping coefficient
![]() $c_{e}$
(2.4). However, not all of the kinetic energy is recoverable in a viscous fluid, and the amount depends on the shape-change rate
$c_{e}$
(2.4). However, not all of the kinetic energy is recoverable in a viscous fluid, and the amount depends on the shape-change rate
![]() ${\it\sigma}^{\ast }$
(Weymouth et al.
Reference Weymouth, Subramaniam and Triantafyllou2015). As a confirmation of this, we define a coefficient
${\it\sigma}^{\ast }$
(Weymouth et al.
Reference Weymouth, Subramaniam and Triantafyllou2015). As a confirmation of this, we define a coefficient
![]() ${\it\eta}$
that scales the recovery of added-mass energy, i.e.
${\it\eta}$
that scales the recovery of added-mass energy, i.e.
The results for
![]() ${\it\eta}=0.9$
are displayed in figure 4(a), and the excellent agreement with the NS results indicates that the process of added-mass recovery for this range of
${\it\eta}=0.9$
are displayed in figure 4(a), and the excellent agreement with the NS results indicates that the process of added-mass recovery for this range of
![]() ${\it\sigma}^{\ast }$
is approximately 90 % efficient.
${\it\sigma}^{\ast }$
is approximately 90 % efficient.
Finally, we note the difference in the wake patterns shown for the two pumping profiles in figure 6, despite using the same pumping amplitude and frequency, and responding with similar oscillation extent. While the same core structures exist in both results due to shedding of starting and stopping vortices, the complete cancellation of drag achieved when pumping with the sharp profile results in minimal and stable vortex structures. In contrast, the smooth profile, which only achieves zero power loss on average, results in a more unstable wake pattern.
5 Conclusions
In this work, a submerged body that varies its volume periodically is studied as a model system for sustained drag cancellation by added-mass pumping. While the role of added-mass variation on thrust is hard to assess in general self-propelled systems, this study successfully segregates the contribution from added-mass variation and highlights its role as a source of thrust. We find that the relationship that links oscillation amplitude and extent of the pulsation is approximately linear and weakly dependent on the kinematics of the actuation. We also find that large-scale oscillation requires that the period of actuation be approximately half that of the natural period of the system, as in classic parametric resonance.
The ‘sharp’ pumping kinematic routine which satisfies the condition for zero damping was easily derived and has a physically intuitive form, figure 2, and a striking qualitative resemblance to the propulsion routine of those organisms that are known to exploit a similar fluid dynamics phenomenon for travelling in water (Trueman & Packard Reference Trueman and Packard1968).
The results of this analysis shed light on the role of added-mass recovery in the context of aquatic propulsion and resonance. The implications associated with this phenomenon are important for a variety of real applications including the design of energy harvesting devices as well as the design and control of bioinspired underwater vehicles that exploit shape variation as a means of propulsion.
Acknowledgement
We wish to acknowledge the Lloyd’s Register Foundation for the support given to this work.
Supplementary material
Supplementary material is available at http://dx.doi.org/10.1017/jfm.2016.353.


