


1. Introduction
The backward-facing step (BFS) is one of the most common geometries used to study separated flow. It exhibits a fixed separation point, recirculation zone, reattachment zone and a slowly redeveloping boundary layer; characteristics often found in flows around more complex geometries. An abundance of systematic investigations into aspects of BFS flow over the past half-century have revealed, in detail, how this flow behaves and how variation in key parameters alters this behaviour. These key parameters include: the ratio of step height to width, termed the aspect ratio ( $AR$); the pressure gradient, primarily a function of the ratio of channel height upstream and downstream from the step, termed the expansion ratio (
 $ER$); the initial boundary-layer state; the boundary-layer thickness (
 $\delta$); and free-stream turbulence levels. Often one or more of these parameters are tailored to provide insight into a practical application of interest. For example, work on the BFS has contributed to our understanding of flow phenomena associated with combustors, buildings, vehicles and aspects of the natural environment such as flow over cliffs.
Downstream of the vertical step face (step base), the separated shear layer initially resembles that of a plane mixing layer. Significant differences are only noticeable further downstream, where the shear layer bends downward to the step floor (Chandrsuda & Bradshaw Reference Chandrsuda and Bradshaw1981). Reattachment on the step floor is not steady and can vary of the order of plus or minus one step height from the mean position. From reattachment, flow is drawn back upstream, due to an adverse pressure gradient through reattachment, as well as convected downstream (Nash Reference Nash1963). Significant activity occurs in the recirculation zone, with peak reverse flow velocities of approximately 20 % of the free stream occurring roughly half-way between the step base and mean reattachment position (Nadge & Govardhan Reference Nadge and Govardhan2014). Downstream of reattachment, the developing boundary layer only very slowly relaxes to the state of an ordinary boundary layer. Bradshaw & Wong (Reference Bradshaw and Wong1972) observed that ‘the “law of the wall” formulation is inapplicable within a downstream distance of at least 30 times the shear-layer thickness at reattachment’.
As will be explored, the characteristics of the incoming flow are of particular interest in this investigation. Using suction upstream of a BFS, Adams & Johnston (Reference Adams and Johnston1988a,Reference Adams and Johnstonb) were able to systematically vary the incoming boundary-layer thickness and observe the effects on the separated flow. They found that the reattachment pressure and the peak pressure in the reattachment zone decrease as the upstream boundary-layer thickness increases. They also observed that the pressure gradient at reattachment is a strong function of upstream boundary-layer height when it is greater than 0.4 step heights. However, they found no significant variation in the reattachment length with varying boundary-layer thickness when the boundary layer was turbulent.
In the extensive literature base, several key dynamic features of the BFS flow have been identified, including: a Kelvin–Helmholtz instability associated with the separating shear layer; a ‘step mode’ instability associated with a vortex merging process in the shear layer and interaction with the step floor (Hasan Reference Hasan1992); and a broad-band low-frequency ‘flapping’ motion of the latter half of the recirculation zone. The shear-layer instability has been shown to scale with momentum thickness ( $\theta$) at separation at a reduced frequency of
  $St_\theta =f\theta /U_{ref}\approx 0.012$, where f is the frequency of the instability and
  $U_{ref}$ is the upstream free-stream velocity. In addition, the ‘step mode’ instability scales with the step height (
 $H$) at a reduced frequency of
  $St_H=fH/U_{ref} \approx 0.185$ (Hasan Reference Hasan1992). Ma & Schröder (Reference Ma and Schröder2017) collated studies of the flapping motion and conducted their own experiments to provide further insight into the behaviour of this flow feature. They found that the shear layer flaps up and down in the latter half of the recirculation region, where its spatial development reaches a scale equivalent to the step height.
Much of the lure of investigating BFS flow lies in its rich flow features despite its geometric simplicity, and the resulting well-defined recirculation zone. However, often in practical applications, a more complex region of separated flow may exist, or multiple regions of separated flow positioned closely enough in space to interact strongly. Examples of this include: bluff bodies downstream of a BFS used to stabilise the flame in combustors (Pawar et al. Reference Pawar, Seshadri, Unni and Sujith2017); flow over ships (Syms Reference Syms2008); flow in rocket nozzles (Deng et al. Reference Deng, Han, Liu, Ding, Weng and Jiang2019); and flow over utility vehicles (or pick-up trucks) (Al-Garni & Bernal Reference Al-Garni and Bernal2010). Much of the work motivated by these applications involves the use of simplified three-dimensional representations of the actual geometry. However, unlike for simple separated flow zones modelled using a single BFS, for flows with a more complex separation zone, or multiple interacting separation zones, there are far fewer relevant fundamental studies.
Tinney & Ukeiley (Reference Tinney and Ukeiley2009) and Herry et al. (Reference Herry, Keirsbulck, Labraga and Paquet2011) conducted investigations of geometries consisting of two finite width BFSs in close proximity, i.e. a double backward-facing step (DBFS). With streamwise separation between the two steps of five single step heights, Tinney & Ukeiley (Reference Tinney and Ukeiley2009) observed reattachment on the first-step floor, at a length significantly shorter than observed for a two-dimensional single BFS. Strong three-dimensional flow structures were observed, including: the formation of horseshoe vortex structures behind each step – similar to those observed behind surface mounted cubes (e.g. Castro & Robins Reference Castro and Robins1977); the presence of strong counter-rotating streamwise vortex structures originating from the sharp leading edges of the geometry upstream of the first step; and entrainment of fluid around the sides of the body. The counter-rotating streamwise vortex structures originating from upstream induce a downwash near the centre line of the body, which in addition to the entrainment of flow from the sides, contributes to the variation in reattachment length seen for the single BFS. Herry et al. (Reference Herry, Keirsbulck, Labraga and Paquet2011) observed a bi-stability downstream of the first step. This was investigated further in the studies of Rao et al. (Reference Rao, Zhang, Minelli, Basara and Krajnović2019) and Zhang et al. (Reference Zhang, Minelli, Basara, Bensow and Krajnović2021), who employed geometries more representative of ships upstream of the first step. However, the authors are not aware of any studies that have systematically varied the streamwise separation between the two steps to study the interaction of the separated flow regions.
There appears to be only two studies that have investigated a two-dimensional DBFS. Wang et al. (Reference Wang, Burton, Sheridan and Thompson2014) conducted Reynolds-averaged Navier–Stokes simulations of DBFS flow with two steps of equal height ( $h$) at a Reynolds number based on a combined step height (
 $H$) of
  $Re_H=20\,000$. They varied the streamwise distance between the steps over
  $0\le x/h\le 10$, investigating the change in the flow structure and base pressure. The differences between the single and double BFS configurations varied significantly with step separation. The flow structure closely resembled that of a single BFS for short step separations. As the step separation increased and the second step protruded further into the recirculation zone, a more complex flow structure evolved. For large step separations, where there were two distinct recirculation zones, evidence of significant interaction between the two recirculation zones was observed up to the largest separation examined. The reattachment length reduced monotonically from the single BFS configuration to a minimum where the two steps were separated by five step heights. For step separations greater than six step heights, two distinct separation zones existed, both resembling a BFS flow structure – albeit with differences in the reattachment length on each step and the size of the counter-rotating corner vortices. There was significant variation in mean base pressure on each step over the parameter space investigated. Compared with the single BFS, the base pressure decreased on the first step and increased on the second step for all step separations. The maximum variation in base pressure from the single BFS configuration occurred – for both steps – at a step separation of six step heights, where the flow just reattaches on the first step. More recently, Deng et al. (Reference Deng, Han, Liu, Ding, Weng and Jiang2019) conducted numerical simulations of supersonic flow over a DBFS with a fixed streamwise step separation of two single step heights. They described the interaction of shock waves emanating from the step corners.
Obviously, differences between the flow structure of the two- and three-dimensional DBFS are to be expected. The flow entrainment from the sides of a finite width body significantly alters the structure of the recirculation zones compared with that of the two-dimensional case. The geometry upstream of the first step also plays an important role in the finite width case. In addition to the shortened reattachment length, the presence of the strongly three-dimensional flow structures results in increased levels of turbulence downstream of the first step. Similarities between the two- and three-dimensional cases are also apparent. Even with a complex geometry representing the bow, superstructure and funnel of a ship, the simulations of Zhang et al. (Reference Zhang, Minelli, Basara, Bensow and Krajnović2021) revealed that the second-step base pressure is significantly higher than the first. The velocity streamlines in the centreline of the finite width model of Tinney & Ukeiley (Reference Tinney and Ukeiley2009) are qualitatively comparable to those presented by Wang et al. (Reference Wang, Burton, Sheridan and Thompson2014) for large step separations, albeit without any evidence of corner vortices.
Although Wang et al. (Reference Wang, Burton, Sheridan and Thompson2014) identified the broad flow regimes that occur when the separation between the two steps is varied, an investigation is still needed to explain the observed changes to the mean-flow structure and how the dynamics of the flow is altered. This knowledge will provide a fundamental base from which more complex flows can be analysed. It will also provide an opportunity to develop targeted flow control techniques for this broadly relevant yet fundamental geometry, in a similar manner to how the BFS has been used to develop techniques for separated flows in isolation.
In this study, an experimental investigation of a two-dimensional DBFS is conducted with the streamwise separation between the two steps ( $d$) varied over
  $0h \le d \le 8h$. Surface pressure and time-resolved particle image velocimetry measurements are obtained, revealing both the time-averaged and dynamic features of the flow. Three flow regimes are identified: the first, similar to the response of the single BFS; the second being an intermediate regime, where key characteristics begin to diverge from the single BFS configuration; and the third, where the formation of two distinct, albeit interacting, separated zones arise. Key mechanisms by which the two separated zones interact in the third regime are proposed, including a description of the influence of the second step on the upstream first-step base pressure, of particular interest in many practical applications. Both the temporal and spatial characteristics of key flow features and statistics, such as a shear-layer instability and flapping motion are documented, detailing the changes that occur in comparison with the single BFS configuration. Importantly, the simple geometry and distinction of generalised flow regimes provides new insight into the interaction of separated flow zones, relevant to a broad range of practical applications.
2. Experimental methodology
The investigation was conducted in the Monash Wind-Tunnel Research Platform  $2 \times 2$ wind tunnel. The wind tunnel is a closed-circuit design with a
  $2\,{\rm m} \times 2\,{\rm m}$ test section 12 m in length. A single flow conditioning screen and a three to one contraction are located upstream of the test section. Figure 1(a,b) shows schematics of the experimental set-up. The model was installed on the floor of the wind tunnel, with the vertical face of the first step located approximately 6 m downstream of the test section entrance. Each step was 90 mm in height (
 $h$), with a combined total height of 180 mm (
 $H$). The streamwise separation between the two steps varied in distance between
  $0h\le d\le 8h$ in
  $d=1h$ increments. The model spanned the width of the test section. A false floor extended 15
 $H$ upstream of the first-step base. A ramp with a cubic spline profile connected the false floor to the wind-tunnel floor. To reduce the size of the sidewall boundary layers, splitter plates were installed 100 mm from each sidewall. The splitters were 12 mm thick with a 4:1 elliptical leading edge. They extended 2
 $H$ upstream and 15
 $H$ downstream of the first-step base to a height of 6
 $H$ above the second-step floor. One splitter was made from acrylic to allow optical access for particle image velocimetry (PIV) measurements. The expansion and aspect ratios based on the combined step height,
  $H$, are
  $ER=1.1$ and
  $AR=10$. For large step separations, a single step height,
  $h$, is likely the more relevant characteristic length, resulting in ratios of
  $ER=1.05$ and
  $AR=20$. For
  $AR\ge 10$, the flow is expected to be predominately two-dimensional over the mid-section for a single BFS (De Brederode Reference De Brederode1975). For step separations of
  $d=0h$,
  $4h$ and
  $10h$, surface flow visualisations were conducted using a paint flow mixture comprised of kaolin, fluorescent pigment and a kerosene carrier. A quasi-two-dimensional behaviour of the flow over the mid-section for
  $\pm 3$
  $h$ was verified. However, for
  $d=4h$, some small-scale three-dimensional effects were noted close to the corner of the second step, where strong reverse flow fluctuations occur.

Figure 1. (a) Schematic of the experimental set-up showing key parameters and the coordinate system used. The dashed line indicates the location of the interchangeable second step which varied in length over  $0h\le d\le 8h$. Here,
  $H$ is the combined height of the two steps,
  $h$ is a single step height,
  $d$ is the separation between the vertical faces of the two steps. Not to scale. (b) Schematic of the experimental model and PIV fields of view. The black dashed lines indicate the various second-step configurations used. The green and grey dashed lines indicate the approximate positions of the PIV fields of view. The blue dashed line indicates the streamwise measurement position of the profiles shown in (c). Not to scale. (c) Streamwise velocity profile (
 $\bigcirc$, blue), and streamwise (
 $\square$, orange) and wall-normal (
 $\triangle$, orange) components of turbulence intensity at
  $x/H=-1$, and
  $z/H=0$, from
  $y/H=0$ to the wind-tunnel roof.
The reference velocity ( $U_{ref}$), measured using a Pitot tube located at
  $x/H=-3$,
  $y/H=3$ and
  $z/H=-2.5$, was 20 ms
 $^{-1}$ for all tests. This results in a Reynolds number based on the combined step height of
  $Re_{H} = 2.36\times 10^{5}$ (
 $Re_{h} = 1.18\times 10^{5}$) and a value based on momentum thickness at separation for the single BFS configuration of
  $Re_{\theta } = 1.20\times 10^{4}$, where
  $\theta$ is the momentum thickness. The incoming boundary layer was turbulent for all test configurations. For the single BFS configuration, the boundary-layer thickness was
  $\delta /H\approx 1.1$ (
 $\delta /h\approx 2.2$), and the momentum thickness was
  $\theta /H=0.051$ (
 $\theta /h=0.102$). The mean streamwise velocity, and the streamwise and wall-normal (
 $y$-direction) turbulence intensities, on the vertical centreline of the tunnel
  $1H$ upstream of the first step, were measured using a 4-hole dynamic pressure probe (Turbulent Flow Instrumentation, Cobra Probe). These are shown in figure 1(c). An overshoot in the velocity profile near the step can be observed. This is due to the presence of the ramp upstream of the step equivalent to a single-sided contraction of the wind tunnel. Across the velocity range tested, the streamwise and wall-normal components of turbulence intensity outside the wall boundary layers remained less than 0.8 % and 1.3 % respectively.
2.1. Flow measurements
Surface pressure was measured using a synchronous 128-channel Differential Pressure Measurement System (Turbulent Flow Instrumentation, DPMS), with each channel sampled at 3000 Hz for 120 s. Frequencies of up to 250 Hz were resolved by applying amplitude and phase distortion corrections to account for tubing length (Bergh & Tijdeman Reference Bergh and Tijdeman1965). Pressure taps were located in 6 mm ( $0.067h$) increments on the base of both steps at
  $z/h=0$, along
  $-1.933\le y/h\le -1.067$ on the first-step base and
  $-0.933\le y/h\le 0.067$ on the second-step base. Pressure taps were also located in
  $0.333h$ increments on both the first- and second-step floors at
  $z/h=0$, extending downstream from the first step to between
  $14< x/h<21$, depending on the step configuration. The estimated uncertainty for the surface pressure measurements, based on the manufacturer specifications, is less than
  $\pm$5 % of the mean surface pressure for all configurations.
The streamwise ( $x$) and vertical (
 $y$) velocity components were obtained in the
  $x$–
$x$– $y$ plane at
  $z/h=0$ using two-dimensional, two-component PIV. To obtain the velocity field at the desired spatial resolution over
  $0< x/h<14.4$, a composite dataset was acquired consisting of either four or five (depending on the step configuration) individual PIV measurement regions at various downstream locations that were stitched together in post-processing. There was an overlap in each of the fields of view. In the overlap region, the same number of vectors from both the upstream and downstream datasets were removed – no averaging of the data was performed. Once these datasets were stitched together, a Gaussian filter was applied over the stitched regions to minimise any visible discontinuities. A high-speed camera (Vision Research, Phantom v1840) with a resolution reduced to
  $2048\times 1536$ pixel
 $^{2}$ and an 85 mm lens (Zeiss, Planar T* 1,4/85 mm ZF.2) was used to capture images. The magnification factor was 5.95 px mm
 $^{-1}$. The flow was illuminated by four 100 mJ 532 nm ND:YAG lasers (Innolas, Spitlight DPSS). A total of 8000 PIV snapshots were acquired at 400 Hz (equivalent to
  $T^{*}=tU_{ref}/h=0.56$ dimensionless time units). The width of the laser sheet was approximately 3 mm. A smoke machine with a propylene glycol smoke fluid was used to seed the flow. In-house cross-correlation software, originally developed by Fouras, Lo Jacono & Hourigan (Reference Fouras, Lo Jacono and Hourigan2008), was used to obtain the velocity fields. A multi-pass cross-correlation method with initial interrogation window size of
  $32 \times 32$ pixel
 $^{2}$ and final size
  $16\times 16$ pixel
 $^{2}$, with an overlap of 50 %, was employed (Hart Reference Hart2000). This corresponded to a composite velocity vector field of approximately
  $1000 \times 191$ vectors
 $^{2}$, with a spatial resolution of
  $0.03 \times 0.03$
  $h^{2}$ (
 $2.69 \times 2.69$ mm
 $^{2}$). The cross-correlation peak was determined to sub-pixel accuracy by using a least squares fit to a two-dimensional Gaussian function. For each interrogation location, erroneous vectors were detected and replaced after both correlation iterations, based on the values of the immediate surrounding vectors. The laser, camera, and surface pressure measurements were synchronised using a pulse generator (Quantum Composer, 9530 Series Delay Pulse Generator). With PIV measurements acquired at 400 Hz, frequencies of up to
  $St_h=0.9$ (
 $St_H=1.8$, 200 Hz) can theoretically be detected at the operational flow speed. As the shear-layer instability for a single BFS is expected to occur at
  $St_\theta \approx 0.012$, which corresponds to
  $St_h\approx 0.12$ (
 $St_H\approx 0.24$) (Hasan Reference Hasan1992), the key dynamic features and large-scale motions of the flow can be resolved.
To provide confidence in the PIV datasets, pointwise comparisons were made with hot-wire measurements. Additionally, uncertainty bounds of turbulence statistics were estimated. Hot-wire measurements were obtained at 3 kHz for 120 s at four locations (shown in figure 2a) using a single-wire probe (TSI, 1210-T1.5). It was found that the velocity magnitude and standard deviation converged to within  $\pm$2 % of their long-time estimates within 20 seconds (the PIV recording time) at all locations. Table 1 shows the comparison between the standard deviation of the hot-wire signal and magnitude of in-plane velocity (
 $\sqrt {u^{2}+v^{2}}$) obtained from PIV measurements at the same locations. A mean difference of 4.7 % was observed. Also of relevance, a comparison was made between power spectra obtained from hot-wire and PIV measurements for a single BFS in McQueen et al. (Reference McQueen, Burton, Sheridan and Thompson2022), with good agreement observed between the two different approaches.

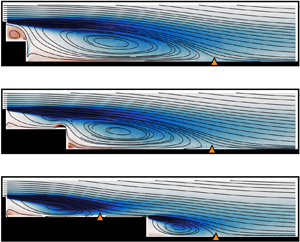
Figure 2. Streamlines of mean velocity and colour contours of out-of-plane vorticity ( $\omega _z$) for:
  $d=0h$ (a);
  $d=1h$ (b);
  $d=2h$ (c);
  $d=3h$ (d);
  $d=4h$ (e);
  $d=5h$ (f);
  $d=6h$ (g);
  $d=7h$ (h);
  $d=8h$ (i). The
  $\triangle$ (orange) markers indicate the mean reattachment location on the first (if applicable) and second steps. The orange circle markers in (a) relate to table 1.
Table 1. Comparison between turbulence intensity, calculated from hot-wire and PIV measurements. Turbulence intensity was calculated using the raw velocity measurements from the hot-wire, and the in-plane velocity magnitude ( $\sqrt {u^{2}+v^{2}}$) from PIV. The four locations at which the comparison is made are shown in figure 2(a).

The method proposed by Sciacchitano & Wieneke (Reference Sciacchitano and Wieneke2016) was used to estimate the uncertainty of the statistical quantities derived from the PIV and surface pressure data. This assumes that systematic error has been removed and provides an estimate of the random error. As the PIV and surface pressure measurements are correlated in time, an effective number of independent samples ( $N_{eff}$) that contribute to statistical convergence is determined using
 \begin{equation} N_{eff}=\frac{T}{2T_{int}}, \end{equation}
where  $T$ is the total observation time and
  $T_{int}$ is the integral time scale computed from the auto-correlations of the streamwise velocity component at each vector location. The estimated uncertainty in the mean velocity is less than
  $\pm$1.5 % across the spatial domain. The maximum estimated uncertainties in the normal and shear components of Reynolds stress are
  $\pm$16 % and
  $\pm$15 % respectively, although these maximum values were only observed in small regions close to the step. The mean estimated uncertainty across the spatial domain for both the normal and shear components of Reynolds stress is
  $\pm$8 %. The estimated uncertainty in the standard deviation of surface pressure is less than
  $\pm$2.5 %.
3. Results
In this section, time-averaged statistics and dynamic characteristics of the DBFS flow for step separations of  $0 h\le d \le 8h$ are presented, along with comparisons with the single BFS, which are reproduced from McQueen et al. (Reference McQueen, Burton, Sheridan and Thompson2022). Across the parameter space examined, the mean-flow structure varies from that of a typical single BFS, through to a recirculation zone strongly influenced by the presence of a second step, and finally to two distinct recirculation zones. The relevant characteristic length varies over this parameter space. For consistency, in all figures and in the text, the single step height (
 $h$) is used as the reference length. Results using the combined step height (
 $H$) are also listed where appropriate.
3.1. Mean-flow statistics
For the single BFS, the mean-flow structure consists of a large recirculation zone, a smaller counter-rotating corner vortex, and a single reattachment location on the step floor. These flow features can be observed in figure 2(a), which shows streamlines of the mean flow and the out-of-plane component of vorticity ( $\omega _z$). The mean reattachment location is determined by finding the point of zero mean streamwise velocity at progressively lower vertical locations, and extrapolating those points to the step floor. It should be noted that a single reattachment location exists only in the mean sense and that multiple locations of zero streamwise velocity may exist instantaneously. The variation in reattachment location on the first (
 $X_{r, 1}$) and second (
 $X_{r, 2}$) steps, and the total reattachment length (
 $X_{r,{total}}$), are shown in figure 3 (see figure 1 for a definition of the various reattachment lengths). The total length of detached flow for the one or two separated zones is also indicated by the black line in figure 3.

Figure 3. Reattachment length on the first step ( $X_{r,1}$), second step (
 $X_{r,2}$), and the total reattachment length (
 $X_{r,{total}}$) for varying step separation. The black line indicates the combined length of detached flow (i.e.
  $X_{r,{total}}$ when the flow does not reattach on the first step, and
  $X_{r,1} + X_{r,2}$ when the flow does reattach on the first step).
For separation between the steps of  $d\le 3 h$, there is no reattachment on the first step and negligible variation in the total reattachment length. Downstream of the second step, there is only minimal variation in the global flow structure. Significant differences are only found to occur close to the second-step corner and over the first-step floor. For
  $d=1 h$, the reverse flow in the primary recirculation zone moves up the base of the second step and is primarily re-injested into the shear layer that separates from the first-step top corner. A counter-rotating vortex, situated above the first-step floor, spans the entire distance between the two step bases. For
  $d=2 h$ and
  $d=3 h$, the intensity of reverse flow over the second step increases, resulting in the formation of a small vortex just upstream of the top corner of the second step (as identified for
  $d=3h$ by Wang et al. Reference Wang, Burton, Sheridan and Thompson2014). The inset in figure 2(d) provides a closer view of this vortex. With increasing step separation, the counter-clockwise rotating flow structure near the first-step base decreases in size until
  $d=3h$.
Figure 4 shows the streamwise and vertical velocity components at the second-step corner, with a maximum reverse flow of  $U/U_{ref}\approx 0.15$ occurring for
  $d=3 h$. For
  $d\le 2 h$, there is also only minimal variation in the base and step floor pressure profiles, shown in figure 5. Indeed, given the large intrusion of the second step into the recirculation zone up to
  $d=2 h$, there is little variation in any of the characteristics traditionally used to detail the global structure of the BFS flow. In particular, there are no significant changes in reattachment length, base and floor pressure profiles, or the initial development of the separated shear layer, with only some difference in base pressure on the two steps beginning to occur. For
  $d\ge 4 h$, differences in comparison with the single BFS flow rapidly evolve.

Figure 4. Streamwise (a) and  $y$-direction (b) velocity profiles at the second-step base. The dashed orange line shows the profile for the single BFS configuration.

Figure 5. Mean base pressure on the first step, second step and the two steps combined. The black dashed line shows the mean pressure for the single BFS.
By  $d=4 h$, the total reattachment length has decreased by approximately 10 % and the mean recirculation zone has almost split in two (figure 2e). The mean base pressure on each of the two steps changes rapidly, with a coefficient of pressure (
 $C_p$) gradient over
  $3 h\le d\le 5 h$ of
  $dC_p/dd\approx 0.103$ for the first-step base and
  $dC_p/dd\approx -0.030$ for the second-step base (figure 5). While the reverse flow over the second-step corner has reduced from the peak value at
  $d=3 h$, a significant component remains at
  $d=4h$ for
  $y/h<0.75$ (figure 4a). There is also a relatively large component of downward motion of the flow at the second-step corner, with a peak negative vertical velocity of
  $V/U_{ref}\approx 0.1$ at
  $y/h\approx 0$ (figure 4b). Indeed,
  $d=4h$ is the shortest step separation tested which displays a significant departure from the typical single BFS floor pressure profile, with the minimum pressure on the first-step floor occurring upstream of the second-step base for the first time (figure 6). Although the flow does not yet reattach onto the first step, this minimum pressure on the first-step floor, and subsequent pressure rise prior to the second-step base, results in a profile that is beginning to resemble that of two distinct separated zones.

Figure 6. Mean pressure on the first- and second-step floors (a) and bases (b). The black lines show the results for the single BFS.
For  $d\ge 5 h$, the flow reattaches on the first step. The reattachment length on the first step remains approximately
  $1 h$ shorter than that for the second step over
  $5 h\le d\le 8 h$, although the difference decreases with increasing step separation. It is expected that, as the separation between the steps is increased further, the two reattachment lengths (
 $X_{r,1}$ and
  $X_{r,2}$) would converge close to half the observed value for the single BFS. The total reattachment length (
 $X_{r, {total}}$) is shortened in comparison with the single BFS for
  $4 h\le d\le 6 h$, reaching a minimum at
  $d=5 h$. While a discussion on the cause of reattachment length and base pressure variation is to follow, as there is only minimal variation in the reattachment length on each step when double reattachment occurs, the shortest total reattachment length logically occurs for the shortest step separation in the double reattachment regime. For greater step separations the total reattachment length is primarily a function of the step separation, increasing monotonically past
  $d=5h$ (figure 3). Perhaps a more useful measurement in this case is the total length of detached flow, which is indicated by the black line in figure 3. This length is the combined length of the two recirculation zones when reattachment on the first step does occur, and is the same as the total reattachment length when separation on the first step does not occur. As can be seen from figure 3, the total length of detached flow reaches a minimum for
  $d=6h$, the same step separation where the second-step reattachment length is a minimum. It increases at a lower rate than the total reattachment length thereafter.
The minimum base pressure on the first step occurs for  $d=5 h$, and it increases monotonically thereafter at a rate of
  $dC_p/dd\approx 0.006$ up to
  $d=8h$ (figure 5). The variation in second-step base pressure is primarily a function of the step base location. Figure 5 shows that the profile of the second-step base pressure closely resembles the typical floor pressure profile of a single BFS, where the pressure rises through the reattachment zone and reaches a maximum just downstream of reattachment, before reducing to a final pressure recovery. For
  $d=6 h$, the peak floor pressure rise on the first step (due to the overshoot in floor pressure downstream of reattachment) aligns approximately with the position of the second-step base, resulting in a maximum base pressure. For greater step separations, the second-step base pressure is expected to continue to reduce until it reaches a constant value associated with the first-step final pressure recovery. The combined base pressure profile resembles that of the second step, with the maximum combined base pressure occurring for
  $d=6h$. This is due to the increase in the second-step base pressure being significantly greater than the reduction in the first-step base pressure over the range of step separations investigated. From the perspective of the reduction of structural loading or bluff-body drag, optimising the spacing between regions of separated flow could noticeably improve performance.
By  $d=7 h$, the peak in the first-step floor pressure profile is reached prior to the second-step base. The floor pressure profiles here resemble those of two distinct BFS flows. However, the streamwise velocity profile at separation on the second step remains far from resembling an ordinary boundary-layer profile, as can be seen in figure 4(a). As discussed by several authors (e.g. Le, Moin & Kim Reference Le, Moin and Kim1997), it takes significantly larger step separations (20–50
 $h$) for the flow to relax sufficiently to resemble a typical boundary-layer profile. For
  $d\ge 6h$, the vorticity profile downstream of the second-step base also resembles that of a typical single BFS, with a region of negative vorticity visible in the shear layer of the second recirculation zone. Over the range
  $5h\le d\le 7h$, the size of the counter-clockwise-rotating corner vortex, near the base of the first step, does not significantly vary. However, the presence of a corner vortex behind the second-step base is more difficult to detect, particularly for
  $5h\le d\le 7h$. It is not until
  $d=8h$ that a small corner vortex can clearly be observed.
For many practical applications, base pressure is a key variable of interest. Here, with closely related and interacting zones of separated flow, the base pressure variation is strongly determined by the location and presence of any reattachment points. The greatest difference in base pressure on the two steps was observed when the flow reattaches on both steps, resulting in a reduction in pressure on the first-step base and an increase on the second-step base. A greater understanding of this flow regime, including a description of the relationship between step separation, base pressure and reattachment length, is of particular value for discussion in the next sections.
3.1.1. The effect of control parameters on flow features
To be able to detail and understand the interaction between two closely spaced recirculation zones, it is first important to consider how the flow structure and statistics compare with those of a single BFS when the two steps are separated sufficiently to expect little interaction. For example, do we expect that the reattachment length for the two steps will become constant at half that of a single BFS with sufficient step separation?
For a DBFS with sufficiently large step separation, the relevant characteristic length changes from the combined step height ( $H$) to a single step height (
 $h$). This results in changes to several key parameters, including: a reduction in Reynolds number based on step height from
  $Re_{H} = 2.36\times 10^{5}$ to
  $Re_{h} = 1.18\times 10^{5}$; an increase in
  $AR$ from 10 to 20; a decrease in
  $ER$ from 1.10 to 1.05; and an increase in boundary-layer height from
  $\delta /H\approx 1.1$ to
  $\delta /h\approx 2.2$. A change in these parameters in isolation would be expected to have the following effects.
(i) Reynolds number: it is not expected that any appreciable change in the mean reattachment length or base pressure will occur with the change in Reynolds number based on step height (McQueen et al. Reference McQueen, Burton, Sheridan and Thompson2022).
(ii) Aspect ratio: De Brederode (Reference De Brederode1975) investigated the effect of
 $AR$ on reattachment length for a single BFS. Findings showed that with a turbulent incoming boundary layer, there is no significant variation in the mean reattachment length for $AR\ge 10$. They found an increase in reattachment length and base pressure of approximately 2 % moving from $AR=10$ to $AR=20$. The trend in base pressure and reattachment length variation with varying step separation observed in this study is in good agreement with the two-dimensional simulations of Wang et al. (Reference Wang, Burton, Sheridan and Thompson2014), and so it does not appear that $AR$ variation would cause significant variation in the key variables of interest.
(iii) Expansion ratio: Nadge & Govardhan (Reference Nadge and Govardhan2014) collated past results and conducted their own investigation on the effect of
$ER$ on the single BFS flow at high Reynolds numbers ($Re_H>2\times 10^{4}$). For $ER<1.8$, they found an approximately linear decrease in reattachment length with decreasing $ER$, although they only tested down to $ER=1.1$. Extrapolating their findings to $ER=1.05$, an approximate $0.25h$ reduction in reattachment length may be expected. The authors are not aware of any comprehensive studies on the effect on ER on the base pressure. However, Kim, Kline & Johnston (Reference Kim, Kline and Johnston1980) did plot floor pressure profiles for three step heights over the range $1.33\le ER\le 2$, and did not observe any significant variation in base pressure.(iv) Boundary-layer height: using suction upstream of a single BFS, Adams & Johnston (Reference Adams and Johnston1988a,Reference Adams and Johnstonb) were able to systematically vary the incoming boundary-layer height over the range
$0<\delta /H<2$. With a turbulent boundary layer, they found the reattachment length to be approximately constant, potentially with a weak decreasing trend as boundary-layer height is increased. While all pressure profiles were plotted in reduced coordinates, so that no actual base pressure values were reported, they did comment that ‘$C_{p,{min}}$ is not significantly affected by $\delta /H$’. They demonstrated that the increased ratio of boundary layer to step height in a DBFS configuration is also likely to affect the floor pressure profile, resulting in a lower peak pressure downstream of reattachment.


It is difficult to be sure of the combined influence of these parameters, however, it seems unlikely that they would combine to produce any significant variation in reattachment length or base pressure with the two steps sufficiently separated. Perhaps the most substantial effect would be a slight reduction in reattachment length on the two steps due the effects of  $ER$. Although clearly some interaction exists for the largest separation tested (
 $d=8 h$), that configuration does provide some insight. The reattachment lengths on the first (
 $X_{r,1}$) and second (
 $X_{r,2}$) steps are approximately 93 % and 80 % of the single step length in this case. In the two-dimensional simulations of Wang et al. (Reference Wang, Burton, Sheridan and Thompson2014), the reattachment lengths on the two steps were observed to continue to converge to a value of half that of a single BFS out to
  $d=10h$, the furthest separation they examined.
Given that no large-scale variation in the key characteristics is expected due to the change in the above listed parameters, any difference in reattachment length or base pressure resulting from these changes, is expected to be secondary relative to the interaction between the steps considered here.
3.1.2. Interaction between the two separated zones
As the significant reduction in base pressure on the first step is not expected to be primarily attributable to any change in the experimental parameters (as discussed in § 3.1.1), the presence of the second recirculation zone must have an influence on the upstream first recirculation zone.
Firstly, the proximity of the second step to reattachment on the first step disrupts the pressure distribution typically observed downstream of reattachment for a single BFS. Some insight into this may be drawn from studies on a single BFS. Nash (Reference Nash1963) noted that the low pressure in the recirculation zone of a single BFS has influence at an appreciable distance upstream of the step base. The extent of this influence can be seen in the simulations of Le et al. (Reference Le, Moin and Kim1997), with a reduction in surface pressure (below that of the upstream reference) for at least 2.5 step heights upstream of the step base. Separately, Adams & Johnston (Reference Adams and Johnston1988a) investigated the relationship between the separated shear-layer characteristics and pressure rise through reattachment. Their findings built upon the work of Roshko & Lau (Reference Roshko and Lau1965), and supported the idea of Chapman (Reference Chapman1958) that the pressure rise through reattachment is determined by the shear layer upstream of reattachment. Figure 7(a) shows the floor pressure profiles on the first step, plotted using the normalised coordinates of Roshko & Lau (Reference Roshko and Lau1965), with  $C_p^{*} = (C_p-C_{p,{min}})/(1-C_{p,{min}})$. By definition, these profiles collapse around the minimum pressure in the recirculation region. Importantly here, the normalisation highlights that the pressure rise through reattachment remains approximately constant with variation in step separation. This collapse of the data is expected, given that no significant variation in shear-layer characteristics of the first recirculation zone was observed, once reattachment occurred on both steps. With the close proximity of the second step causing a reduction in the pressure downstream of reattachment on the first step, it appears that the requisite pressure rise through reattachment (for given shear-layer characteristics) is maintained through a reduction in the minimum pressure in the recirculation zone (see for
  $x/h<3$ in figure 6a).

Figure 7. Pressure distribution on the first (a) and second (b) step floors in the reduced coordinates of Roshko & Lau (Reference Roshko and Lau1965). Only the results for step separations where the flow reattaches on both steps are shown. The black line shows the pressure distribution for the single BFS configuration.
In a similar manner to the localised effect of the second step, Driver & Seegmiller (Reference Driver and Seegmiller1985) imposed an additional pressure gradient to the sudden expansion of a single BFS flow. This was achieved by angling the roof of the wind tunnel to produce either a converging or diverging channel and corresponding favourable or adverse pressure gradient. They observed that the reattachment length and floor pressure profile were strongly sensitive to the imposed pressure gradient, with a decrease in reattachment length and more rapid pressure recovery occurring for a decreasing adverse pressure gradient. Although the flow is globally expanding into the larger area downstream of the second step, it appears that the localised influence of the low-pressure region behind the second-step base permeates sufficiently far upstream to have a stronger influence on the first recirculation zone. This causes reductions in base pressure and reattachment length on the first step, similar to those observed with an imposed favourable pressure gradient (Driver & Seegmiller Reference Driver and Seegmiller1985).
Concomitantly, the presence of the second step provides space for the flow external to the first-step recirculation zone to continue further in its downward motion, without inhibition from the first-step floor. As shown in figure 8, there is only minor variation in the internal structure of the first recirculation zone when the flow reattaches on the first step (for  $d\ge 5h$). A more prominent feature is the decrease in the streamwise and downward vertical velocity outside the mean recirculation zone for increasing step separation from
  $d=5h$ to
  $d=8h$. Nash (Reference Nash1963) discussed how the concave curvature of the streamlines downstream of reattachment, and the resulting increase in stream-tube area, induce the overshoot in pressure observed for the single BFS. With less inhibition from the floor downstream of reattachment for the DBFS, higher velocities, a lower increase in the stream-tube area and a resultant lower peak surface pressure are observed. This appears to further contribute to the low first-step base pressure required to maintain the requisite pressure rise through reattachment.

Figure 8. Mean streamwise (a) and  $y$-direction (b) velocity profiles on the first step. Only the results for step separations where the flow reattaches on both steps are shown. The markers show every eighth PIV measurement location for clarity.
The flow characteristics above the second-step base (figure 4) also strongly influence the second recirculation zone. Over  $5 h\le d\le 8 h$, the streamwise velocity profile present at the second-step edge is significantly different to that at the first-step edge. Perhaps more important, is the significant component of downward vertical velocity, up to approximately 12 % of the free-stream flow for
  $d=5 h$. For
  $d=5h$, the flow curves downwards, reattaching on the first-step floor just upstream of the second-step base. Without any significant length of step floor downstream of reattachment to inhibit downward motion, strong downwash is observed. As the step separation and the length of floor downstream of first-step reattachment is increased, the downwash is increasingly inhibited. Downwash reduces to a maximum of approximately 5 % at the second-step base by
  $d=8h$ (figure 4). Wu, Ren & Tang (Reference Wu, Ren and Tang2013) examined both smooth and rough BFS geometries. They observed that, when the roughness profile had a downward slope towards the step edge (resulting in a downward component of velocity at separation), the reattachment length was significantly reduced. Likewise, Miau et al. (Reference Miau, Lee, Chen and Chou1991) examined a BFS configuration where a significant downward velocity component was present at separation, due to the presence of an upstream fence. They concluded that the significant reduction in reattachment length was primarily due to the downwash motion induced by the separated flow behind the upstream fence.
The highly modified incoming flow, in comparison with a single BFS, also results in significant differences in the floor pressure variation for the second recirculation zone. Figure 7(b) shows that the floor pressure profiles behind the second step do not collapse as well around reattachment. It also shows that much lower peak pressures occur, along with a reduction in the pressure gradient through reattachment, compared with a single BFS. A return towards the typical single BFS profile is seen with increasing step separation. These results are expected, given the variation of the incoming flow with changing step separation and resultant changes to the separated shear layer (Adams & Johnston Reference Adams and Johnston1988a). From the streamwise and vertical velocity profiles of figure 9, significant differences in the structure of the second recirculation zone and the surrounding flow can be observed. In the recirculation zone, at  $x/X_r=0.5$ and
  $x/X_r=0.75$, the streamwise reverse flow near the step floor increases with step separation. Well above the step, there is close agreement in streamwise velocity for all configurations. The most significant differences occur close above the recirculation zone, where the streamwise velocity increases with step separation. Conversely, outside the recirculation zone, there is lower downward vertical velocity with increasing step separation. Unlike the streamwise component, this difference in vertical velocity extends to the top of the measurement domain. Figure 9 highlights the effect of the downwash at the second-step corner and shows how this influence diminishes moving downstream.

Figure 9. Mean streamwise (a) and  $y$-direction (b) velocity profiles on the second step. Only the results for step separations where the flow reattaches on both steps are shown. The markers show every eighth PIV measurement location, for clarity.
The interaction between the two recirculation zones is strongest around  $5h\le d\le 6h$ and causes a reduction in reattachment length on both steps. This results in the minimum detached flow length of approximately
  $8h$, which occurs for
  $d=6h$ (depicted by the black line in figure 3). It is expected that the total detached flow length should eventually stabilise at a value close to the single BFS reattachment length.
3.1.3. Reynolds stresses and standard deviation of surface pressure
For a single BFS at high Reynolds numbers, the global structure of the three components of Reynolds stress that can be resolved from the two-dimensional measurements ( $\overline {u^{\prime 2}}/U_{ref}^{2}$,
  $\overline {v^{\prime 2}}/U_{ref}^{2}$ and
  $-\overline {u^{\prime } v^{\prime }}/U_{ref}^{2}$), have been detailed by several authors (e.g. Baker Reference Baker1977; Driver & Seegmiller Reference Driver and Seegmiller1985; Nadge & Govardhan Reference Nadge and Govardhan2014; Ma & Schröder Reference Ma and Schröder2017). In summary: all three components build in intensity downstream of separation in the shear layer; peak values occur in the shear layer just upstream of the mean reattachment location; and the intensity of the three components is inhibited by the presence of the step floor as the shear layer bends down towards it. These features, along with variation for the DBFS configurations, can be seen in figures 10, 11 and 12. For the single BFS, Nadge & Govardhan (Reference Nadge and Govardhan2014) collated past results and conducted their own experimental investigation into Reynolds stress, finding good agreement in general with past studies at comparable Reynolds numbers (
 $10^{4}\lesssim Re \lesssim 10^{5}$). From the collated results, the maximum value of the streamwise component of Reynolds normal stress varied over 0.0247–0.045, and the Reynolds shear stress 0.0095–0.013. Figure 10 shows the streamwise variation of the maximum Reynolds stress components for all configurations tested in this study, along with results from Nadge & Govardhan (Reference Nadge and Govardhan2014) and Baker (Reference Baker1977). Relatively good agreement can be seen between the two reference studies and this study's results for the single BFS. In regard to the DBFS, for
  $d\le 3h$ the streamwise variation of maximum Reynolds stress closely matches that of the single BFS. For
  $d\ge 4h$, the peak in all three components occurs at
  $x/h\approx 4$. Downstream of the second step, a second, smaller, peak can be observed.

Figure 10. Streamwise variation of  $\overline {u^{\prime 2}}/U_{ref}^{2}$,
  $\overline {v^{\prime 2}}/U_{ref}^{2}$ and
  $-\overline {u^{\prime } v^{\prime }}/U_{ref}^{2}$. Every thirtieth measurement position is shown for clarity. The streamwise position of the results of Baker (Reference Baker1977) and Nadge & Govardhan (Reference Nadge and Govardhan2014) have been scaled so that the reattachment length coincides with that for the single BFS configuration in this study. This allows comparison with both the single BFS and DBFS results. Key parameters of the Baker (Reference Baker1977) study are
  $ER=1.1$,
  $AR=18$,
  $Re_{H}=5\times 10^{4}$ and
  $\delta /H=0.7$. Key parameters of the Nadge & Govardhan (Reference Nadge and Govardhan2014) study are
  $ER=1.3$,
  $AR=20$,
  $Re_{H}=6.5\times 10^{4}$ and
  $\delta /H=0.2$.

Figure 11. Normalised streamwise component of Reynolds stress ( $\overline {u^{\prime 2}}/U_{ref}^{2}$) for:
  $d=0h$ (a);
  $d=1h$ (b);
  $d=2h$ (c);
  $d=3h$ (d);
  $d=4h$ (e);
  $d=5h$ (f);
  $d=6h$ (g);
  $d=7h$ (h);
  $d=8h$ (i). The
  $\triangle$ (orange) markers indicate the mean reattachment location on the first (if applicable) and second steps.

Figure 12. Normalised shear stress component of Reynolds stress ( $-\overline {u^{\prime }v^{\prime }}/U_{ref}^{2}$) for:
  $d=0h$ (a);
  $d=1h$ (b);
  $d=2h$ (c);
  $d=3h$ (d);
  $d=4h$ (e);
  $d=5h$ (f);
  $d=6h$ (g);
  $d=7h$ (h);
  $d=8h$ (i). The
  $\triangle$ (orange) markers indicate the mean reattachment location on the first (if applicable) and second steps. The
  $\bigcirc$ (orange) markers indicate the locations used for power spectral density plots in figure 14.
Figures 11 and 12 show the spatial distribution of  $\overline {u^{\prime 2}}/U_{ref}^{2}$ and
  $-\overline {u^{\prime } v^{\prime }}/U_{ref}^{2}$. The results for
  $\overline {v^{\prime 2}}/U_{ref}^{2}$ are not shown, as the topology is very similar to
  $\overline {u^{\prime 2}}/U_{ref}^{2}$. The main feature observable in the spatial distributions is the shift from a single region of high stress (downstream of the second step) to a region of high stress downstream of both steps, for
  $d\ge 4h$. Adams & Johnston (Reference Adams and Johnston1988a) suggested that the streamwise turbulent fluctuations decrease with increasing boundary-layer thickness. For the largest step separation, no significant variation compared with the single BFS, was found over the first step, even though the boundary-layer to step-height ratio is effectively twice as large as for the single BFS configuration. There is, however, a reduction in the magnitude of the three components of Reynolds stress downstream of the second step, which experiences highly modified incoming flow. The largest difference in the peak of the components over each of the two steps occurs for
  $d=6h$. The downwash over the second step and associated disruption of the shear-layer growth is likely a factor. Wu et al. (Reference Wu, Ren and Tang2013) observed decreased levels of both
  $\overline {v^{\prime 2}}/U_{ref}^{2}$ and
  $-\overline {u^{\prime } v^{\prime }}/U_{ref}^{2}$ for a rough step that sloped downward towards the base, inducing downwash. Like other statistics, differences in the Reynolds stress profiles over the two steps diminish with increasing step separation, once the flow reattaches on both steps.
With no reattachment on the first-step floor (for  $d<5h$), the standard deviation of floor pressure downstream of the second step retains a consistent a peak value of
  $\sigma _{C_p}\approx 0.04$ (figure 13a). For
  $3h\le d\le 4h$, where the second step begins to intrude on the separated shear layer, there are increased floor pressure fluctuations near the second-step corner. However, the magnitudes of the fluctuations do not reach those observed further downstream. When the flow does reattach on the first step (for
  $d\ge 5h$), there is a consistent distribution of the standard deviation of pressure on the first-step floor. On the second step in this regime, while the pressure profiles have similar distributions, the peak fluctuation levels increase with step separation. This is consistent with the reduced Reynolds stress components over the second step, particularly around
  $d=6h$. As may be expected after examining the floor pressure profiles, there is also an increased level of base pressure fluctuation on the second step, for all step separations (figure 13b). Peak values of base pressure fluctuation occur for
  $d=4h$, with a monotonic increase from the second-step floor up to the second-step top corner. For
  $d\le 3h$, reduced fluctuation in comparison with the single BFS occurs for the first-step base. This is likely a result of the reduction in reverse flow that reaches the first-step base for these short step separations.

Figure 13. Standard deviation of pressure on the first and second step floors (a) and bases (b). The solid black lines show the results for the single BFS configuration.
3.2. Dynamic flow characteristics
3.2.1. Spectral power
Examining the three resolvable Reynolds stress components and the standard deviation of wall pressure, it is evident that, as for the mean-flow characteristics, the fluctuating components of pressure and velocity will vary. This variation occurs as the global flow structure moves through regimes resembling: the single BFS configuration; a predominately separated although strongly interacting separated zone; and finally, to two distinct separated zones. To further our understanding of the variation in the fluctuating components of velocity with changing step separation, power spectral density (PSD) estimates obtained from the PIV measurements are examined. As indicated previously, with a PIV acquisition frequency of 400 Hz, frequencies up to  $St_h=0.9$ (
 $St_H=1.8$) can be resolved. The PSD estimates were calculated using Welch's method (Welch Reference Welch1967), with a Hanning window with sample lengths of 1000 data points and 50 % overlap. Using the same experimental set-up and measurement techniques, McQueen et al. (Reference McQueen, Burton, Sheridan and Thompson2022) compared the PSD estimates obtained from PIV measurements with those obtained using a hot-wire, and found overall good agreement for the single BFS configuration. By using the PIV measurements to obtain PSD estimates, indicative distributions of both the power and phase of key frequencies across the spatial domain can be obtained. As discussed in the introduction, several key instabilities have been identified for the single BFS configuration. Namely, the shear-layer instability, the step-mode instability and a low-frequency broad-band flapping motion. The step-mode instability was observed in the latter half of the recirculation region, and associated with a vortex merging process in the shear layer and its related interaction with the step floor. However, when the flow reattaches on the first-step floor for large step separations, the incoming boundary-layer to step-height ratio is relatively large. According to the scaling proposed by Hasan (Reference Hasan1992), the shear-layer instability frequency will be lower than the step-mode instability frequency for these configurations. This suggests that the step-mode instability, as distinct from the shear-layer instability, will not be present for large step separations. This is because the shear-layer instability will not grow sufficiently quickly for the shear-layer interaction with the step floor to occur, on the scale of the step height.
Figure 14 shows PSD estimates, calculated at the locations shown in figure 12, for four step configurations ( $d=0h$,
  $d=4h$,
  $d=6h$ and
  $d=8h$). These locations show typical distributions of spectral power for the frequencies associated with the key instabilities. The locations are not necessarily dynamically similar for all step separations. Location 1 is positioned in the separated shear layer, a short distance downstream of the first step, and provides an indication of the shear-layer instability. Location 2 is located near reattachment for
  $d=0h$ and
  $d=4h$, or near reattachment on the first step for
  $d=6h$ and
  $d=8h$, and is representative of the dynamics around reattachment, including the step-mode instability and flapping motion. Location 3 is located in the second-step shear layer and location 4 near reattachment on the second step.

Figure 14. PSD estimates of the streamwise velocity for step separations of  $d=0h$ (a),
  $d=4h$ (b),
  $d=6h$ (c) and
  $d=8h$ (d) at the three locations shown figure 12. Each PSD estimate is separated by two decades. The blue bands indicate regions over which the average power was plotted across the spatial domain in figure 15.
To assist in the visualisation of the spatial distribution of the flapping motion and shear-layer instability, the power spectra have been split into low-, mid- and high-frequency ranges, depicted by the blue bands in figure 14. While these frequency ranges do not solely depict the distribution of a particular instability, for the single BFS the low-frequency range provides a good indication of the distribution of the flapping motion, and the high-frequency range the shear-layer instability. For the single BFS geometry, most authors have found the low-frequency flapping motion to be broadband, with no distinct peak in the power spectra expected for this instability. For  $d=0h$ and
  $d=4h$, there is significant spectral power associated with low frequencies, indicated by the blue band that spans
  $0.01< St_H<0.08$ (
 $0.005< St_h<0.04$) in figure 14(a,b). At location 1 a peak in the spectra (indicated by the orange arrow centred around
  $St_\theta \approx 0.015$ (
 $St_H\approx 0.3$)) for the single BFS (figure 14a) is in good agreement with the
  $St_\theta \approx 0.012$ shear-layer instability frequency identified by Hasan (Reference Hasan1992). For
  $d=4h$, the peak has moved to
  $St_\theta \approx 0.025$ (
 $St_H\approx 0.5$). For
  $d=6h$ and
  $d=8h$, there is also a slight rise in the power spectra around
  $St_\theta \approx 0.025$ indicative of the shear-layer instability, although this is less distinct than for the shorter step separations. The PIV measurements do indicate a reduction in momentum thickness at the first-step base for step separations centred around
  $d\approx 6h$, which would align with the trend of an increase in the shear-layer instability frequency. However, comprehensive measurements of momentum thickness for the DBFS configuration could not be obtained with the current experimental set-up. As such, while the variation in the shear-layer instability frequency appears to be primarily attributable to a change in momentum thickness, whether other, smaller influences could contribute to the variation is unknown. In the shear layer downstream of the second step, at location 3, a broad peak in the spectra occurs in the mid-frequency band, spanning
  $0.1< St_H<0.22$ (
 $0.05< St_h<0.11$). For these larger step separations, where the single step height,
  $h$, is the relevant characteristic length, this mid-frequency band is around the expected frequency range of the flapping motion. The strong power in this frequency band, in the second recirculation zone shear layer for
  $d=6h$ and
  $d=8h$, is most likely a result of flow structures in the upstream separation zone remaining strong as they convect downstream.
The spatial distribution of power in the frequency bands depicted in figure 14 is shown in figure 15. For the single BFS, power associated with the low-frequency band ( $0.01< St_H<0.08$) is distributed in the latter half of the recirculation zone, where the flapping motion has previously been observed. For a single BFS, Ma & Schröder (Reference Ma and Schröder2017) identified that the shear layer begins to flap up and down from the middle of the recirculation zone. This is likely a result of an absolute instability, with amplification in the recirculation zone – approximately half-way between the step base and reattachment, where the mean reverse flow is a maximum (Wee et al. Reference Wee, Yi, Annaswamy and Ghoniem2004). For a step separation of
  $d=4h$, there are two distinct regions of high power in the low-frequency band distribution. The first region is located above the first-step floor, near the corner of the second step. The second larger region is located above the second-step floor, with a distribution related to the mean reattachment location, similar to a single BFS. For step separations of
  $d=6h$ and
  $d=8h$, where there are two distinct separation zones, the mid-frequency band is more relevant when considering the flapping motion, due to the change in scaling based on step height. A distinct region of power around and upstream of reattachment on each step can be observed in figure 15(c,d). For
  $d=6h$ in particular, there is higher power associated with the first-step recirculation zone.

Figure 15. Spatial distribution of spectral power of the streamwise velocity component for step separations of  $d=0h$ (a),
  $d=4h$ (b),
  $d=6h$ (c) and
  $d=8h$ (d). The spatial power is averaged across three frequency ranges:
  $0.01< St_H<0.08$ (
 $0.005< St_h<0.04$) (i);
  $0.1< St_H<0.22$ (
 $0.05< St_h<0.11$) (ii); and
  $0.25< St_H<1$ (
 $0.125< St_h<0.5$) (iii). Power has been normalised by the peak power across the spatial domain. See figure 14 for a visual representation of these frequency ranges. The orange markers indicate the mean reattachment location on the first (if applicable) and second steps.
The high-frequency band, primarily associated with the shear-layer instability (at least for the single BFS), follows a similar trend to the flapping motion. Up to  $d=4h$, the distribution of high-frequency power does not vary significantly from the single BFS, with high levels of power close to separation from the first step in the shear layer. For
  $d=6h$ and
  $d=8h$, the distribution on the first step closely resembles that of the single BFS, and like for the flapping motion, there is less power downstream of the second step.
From the spatial distributions of spectral power over the second step, it is evident that the shear-layer instability and, to a lesser extent, the flapping motion of the recirculation zone, are both sensitive to incoming flow conditions. Even though the differences in the distributions over each step diminish with increasing step separation, it appears unlikely that the second separation zone shear layer will closely resemble the first until significantly greater step separations.
3.2.2. Spectral proper orthogonal decomposition
From figure 15, variation in the distribution of spectral power associated with low-, mid- and high-frequency bands was observed. To get an indication of the phase of these frequencies across the spatial domain, spectral proper orthogonal decomposition (SPOD) was conducted on individual PIV datasets (figure 16). SPOD is a space–time formulation of proper orthogonal decomposition (POD), where the POD is performed on data in the frequency domain. The technique is described in detail by Towne, Schmidt & Colonius (Reference Towne, Schmidt and Colonius2018). Rather than performing the POD on raw PIV snapshots, several instances of the Fourier transform of the velocity field are used, resulting in a series of modes that oscillate at a single frequency. The Welch method was employed to calculate the Fourier transforms, with the same parameters as used for figures 14 and 15. As for spatial-only POD, the first mode provides the best first-order reconstruction of the flow field and, as such, is the only mode examined. Figure 16 captures both the intensity and phase information of each mode, by scaling the figure transparency in proportion to intensity and depicting phase with a cyclic colour map (as performed by Smith et al. Reference Smith, Venning, Pearce, Young and Brandner2020). Several closely spaced frequencies were examined, and it was found that the SPOD modes were not sensitive to the exact frequency selection.

Figure 16. Phase map of the first SPOD mode for step separations and frequencies listed in each plot. The transparency of each plot is proportional to the spectral power of the first mode.
Figures 16(a), 16(c) and 16(e) provide an indication of the space–time dynamics of the shear-layer instability for various step separations. For the single BFS, a clear evolution of phase is visible as the shear layer develops downstream of separation. This first highly coherent mode captures 25 % of the flow energy at this frequency for the single BFS, and is evidence of the cyclic development of vortex structures in the shear layer due to the Kelvin–Helmholtz instability. For  $d=4h$, and even more so for
  $d=8h$, a reduction in coherence occurs towards the downstream edge of the PIV frame. This is likely due to the influence of the step corner on the shear-layer development for
  $d=4h$, and interaction with the first-step floor as the flow bends downwards and reattaches for
  $d=8h$. The coherence in the phase of the shear-layer instability for the single BFS also reduces as the flow nears the step floor in subsequent PIV frames (not shown here). For
  $d=8h$, the development of the second recirculation zone shear layer is disrupted by the highly turbulent upstream flow. Rather than a peak at the shear-layer instability frequency, a peak in the power spectra around
  $St_h\approx 0.1$ is dominant, which is related to the influence of the upstream fluctuations. As such, the SPOD mode for this frequency is shown (figure 16g). This first SPOD mode indicates that fluctuations, due to the flapping motion of the first recirculation zone, persist sufficiently far downstream of reattachment on the first step to influence the development of the second-step shear layer, causing the shear layer to fluctuate in phase.
Figures 16(b), 16(d), 16(f) and 16(h) provide an indication of the space–time dynamics of the low-frequency fluctuations associated with the flapping motion of the recirculation zone. For all step separations, the first mode is particularly coherent in the streamwise direction, evidence of the strong flapping motion of the latter half of the recirculation zone. This mode is also highly representative of the flow dynamics capturing 44 %, 54 % and 38 % of the energy for  $d=0h$,
  $d=4h$ and the first step for
  $d=8h$, respectively. This is indicative of low-rank dynamics at this frequency (Towne et al. Reference Towne, Schmidt and Colonius2018). Unfortunately, for
  $d=8h$, reattachment on the second-step floor for this configuration is near the edge of two PIV frames, so that a more complete picture of the flapping behaviour near reattachment is unavailable.
3.2.3. Instantaneous reattachment
When the flow reattaches on the first step, for  $d\ge 5h$, a reduction in the turbulent fluctuations downstream of the second step was observed. In addition, the spatial distributions of spectral power revealed that, near reattachment on the second step, this reduction could primarily be attributed to a reduction in low-frequency energy content, associated with the flapping motion of the recirculation zone. McQueen et al. (Reference McQueen, Burton, Sheridan and Thompson2022) demonstrated that for the single BFS, variation in the intensity of the flapping motion altered the characteristics of the instantaneous reattachment location. The same method is employed here to determine any change in the characteristics of instantaneous reattachment with varying step separation. The instantaneous reattachment positions were determined by calculating the streamwise positions of zero streamwise velocity at
  $y/h=-1.95$ (for the first step) and
  $y/h=-0.95$ (for the second step), averaged in time over 10 PIV snapshots (
 $T^{*}\approx 5$). The results are shown in figure 17. Note that the four or five individual PIV measurements, compiled to show the whole spatial domain of interest for a particular configuration, are not correlated in time. As such, each panel of instantaneous reattachment shown in figure 17 only provides an indication of the magnitude and general trend of variation in reattachment length. Furthermore, multiple instantaneous reattachment locations are often identified at a single instance in time. The multiple locations are often a result of small ‘pockets’ of forward or reverse flow near the step floor. As these pockets either grow or dissipate, the multiple instantaneous reattachment locations either converge or diverge. This results in the marker locations that appear at certain instances to move backward in time (figure 17). No appreciable difference in the characteristics of the instantaneous reattachment fluctuations could be observed for
  $d\le 4h$. Where the flow reattaches on the first step, for
  $d\ge 5h$, a clear reduction in the magnitude of reattachment position fluctuation is evident. For a single BFS, Le et al. (Reference Le, Moin and Kim1997) observed a time scale of the reattachment position fluctuations of
  $tU_{ref}/H\approx 17$. Although difficult to ascertain from the current measurements, the primary time scale of the fluctuations here appears similar to that for a single BFS configuration. To quantify the magnitude of the reattachment position fluctuations, the standard deviation of the instantaneous reattachment position (
 $\sigma _{X_r,inst/h}$) was calculated (figure 17j). For the single BFS, the standard deviation is
  $\sigma _{X_r,inst/h}\approx 0.8$. This remains approximately constant up to
  $d=4h$. Thereafter it decreases to a value of
  $\sigma _{X_r,inst/h}\approx 0.4$ once reattachment occurs on the first step. This is a comparable value to the single BFS, considering the more relevant scaling of combined step height for shorter separations. The standard deviation of reattachment on the first step was also determined, and is depicted by the purple markers in figure 17(j). Note that for
  $d=5h$, while the flow generally reattached on the first step, there were intermittent periods where it did not. These periods were not included in the calculation of standard deviation, which results in the reduced value seen for
  $d=5h$.

Figure 17. Instantaneous reattachment length for:  $d=0h$ (a);
  $d=1h$ (b);
  $d=2h$ (c);
  $d=3h$ (d);
  $d=4h$ (e);
  $d=5h$ (f);
  $d=6h$ (g);
  $d=7h$ (h);
  $d=8h$ (i). Note that the two fields-of-view compiled for each panel are not correlated in time. Each compiled plot merely provides an indication of the extent of reattachment length variation over time. The orange lines indicate the mean reattachment location. The standard deviation of instantaneous reattachment (
 $\sigma _{X_r/h}$) on the first (
 $\triangle$, blue) and second (
 $\square$, purple) steps is shown in (j). For (h,i), instantaneous reattachment can be seen around
  $x/h\approx 8$, which is related to the counter-rotating corner vortex. This reattachment close to the step base was not used for calculations of the standard deviation.
4. Flow regimes
Varying the streamwise step separation from  $d=0h$ to
  $d=8h$ revealed several different global flow structures for the DBFS geometry. Key trends in the variation of important variables characterising these global flow structures were identified, including reattachment length, surface pressure, Reynolds stress components and the spatial distribution of spectral power. It is expected that the variation in these key variables (in relation to specific step separations) will vary to some extent with changes in the experimental set-up that affect typical BFS flows, including:
  $ER$,
$ER$,  $AR$, Reynolds number and upstream boundary-layer characteristics. However, the experimental set-up for this study was developed to ensure that none of these parameters were in sensitive regimes that would potentially cause large changes to the flow structure when moving from a single to double BFS configuration. This also ensured that the observations provided here offer a relatively general description of the flow characteristics, relevant to a wide range of practical applications. In light of this, three generalised flow regimes for the DBFS flow, over the parameter space
  $0h\le d\le 8h$, have been identified and presented in figure 18. The intent of figure 18 is to provide a visual representation of the large-scale changes to the global flow structure that occur with varying step separation. Smaller details, such as the variation in the reverse flow over the second step, are not depicted. Key features of these three flow regimes are as follows.

Figure 18. Diagrams depicting the three identified regimes of the DBFS flow.
(i) Single reattachment: for
$d\le 3h$, aside from differences in the localised area near the second-step base, only minimal variation in the global flow structure is observed, in comparison with that of the single BFS (figure 2). There is no appreciable change in the reattachment length (figure 3), and only minor variation in the distribution and magnitude of Reynolds stress downstream of the second-step base (figures 11 and 12). For $d\le 2h$, there is only minor variation in the base and floor pressure profiles on the two steps, and, even by $d=3h$, only minor variation on the first step (figures 5 and 6). In summary, of particular interest in the single reattachment regime is the lack of variation in the traditional flow characteristics, given the significant protrusion of the second step into the recirculation zone as depicted in figure 18(a).(ii) Intermediate regime: for
$d=4h$, the flow does not yet reattach on the first step, yet there are appreciable differences in key flow characteristics. In comparison with the single BFS, the reattachment length has reduced by approximately $1h$ (figure 3). The base pressure has also reduced on the first step and increased on the second step (figure 5), and the peak in Reynolds stress components is situated above the second-step base. The mean and fluctuating floor pressure profiles also vary significantly from those of the single BFS (figures 6 and 13). This regime is associated with intermittent reattachment on the first step, and strong interaction between regions of a predominately separate recirculation zone (figure 18b). No abrupt shifts in the characteristics of the flow occur through this regime. Rather, a relatively consistent (smooth) variation, particularly in reattachment length and base pressure, from the single reattachment to the double reattachment regime is observed.(iii) Double reattachment: in this regime, the flow reattaches on the first step, as depicted in figure 18(c). For the most part, the flow structure can be described as two independent separated zones. There are no large variations in the flow characteristics in this regime, and any difference diminishes with increasing step separation. There are, however, some notable interactions between the two separated zones of particular interest. Firstly, the second step experiences a vastly different incoming flow to that of the first step. Several authors have noted the long distances (downstream of reattachment for a single BFS) that the flow takes to relax back towards that of a typical boundary-layer profile. In line with this, the influence of the first step on the second step was noted up to the largest step separation tested. A highly altered boundary-layer profile, with a significant component of downwash, resulted in a noticeable reduction in the reattachment length on the second-step floor. Concurrently, a reduction in the second-step floor pressure fluctuations and an increase in the mean base pressure were observed. The variation in second-step base pressure may be primarily attributed to the position of the second-step base, in relation to the first-step pressure distribution. Perhaps more interesting is the influence of the second step on the first. As discussed in § 3.1, and depicted in the bottom diagram of figure 18(c), the proximity of the low second-step base pressure, and additional space for the flow above the first recirculation zone to continue its downward motion behind the second step, appear to contribute to the low first-step base pressure. The mechanism that seems to enable this far upstream influence is the pressure rise through reattachment on the first step, which is primarily dictated by the characteristics of the shear layer. This ‘fixed’ pressure rise (for given shear layer characteristics) acts as a link between the two low-pressure zones near the base of each step. As a result of the proximity of the low second-step base pressure (L2 in figure 18c), the base pressure of the first step (L1 in figure 18c) must be reduced to maintain the required pressure rise through reattachment. The lack of a step floor downstream of reattachment on the first step also appears to contribute to this base pressure reduction. As the flow external to the first recirculation zone has room to continue in its downward motion behind the second step, without inhibition from the first step floor, a lower peak pressure downstream of reattachment occurs. In the double reattachment regime, all Reynolds stress components, as well as the spectral power associated with both the shear-layer instability and flapping motion, are strongest in the first recirculation zone. The interaction between the two steps in this regime also results in the minimum detached length of flow of approximately
$8h$, which occurs for $d=6h$.


5. Conclusion
The DBFS flow with separation of  $0h\le d\le 8h$ between two steps of equal height was investigated experimentally. Time-resolved PIV and surface pressure measurements were acquired to reveal both the time-averaged and dynamic features of the flow. Three flow regimes were identified and characterised based on variation of key flow descriptors, including the reattachment length, base pressure, turbulence statistics and spatial distributions of spectral power. A single reattachment regime was defined for
  $1h\le d\le 3h$. Even though in this regime the second step protrudes significantly into the recirculation zone, there is only minimal variation in reattachment length, base pressure, and the general flow structure downstream of the second step. An intermediate regime was defined for
  $d=4h$, where the flow does not yet reattach on the first step, yet significant differences in comparison with the single BFS occur. These differences include: a reduction in reattachment length of
  $x/h\approx 1$; significant departure of the mean and standard deviation floor pressure profiles from the typical single BFS response; and peaks in the Reynolds stress components occurring above the second-step base. Concerning the latter, this is an area where the recirculation zone (that is essentially split in two) is characterised by strong turbulent fluctuations. Finally, a double reattachment regime is defined by the occurrence of reattachment on both steps in the mean sense (for
  $d\ge 5h$). Once reattachment on the first step occurs, there are no large variations in the flow characteristics, and any differences diminish with increasing step separation. The highly modified incoming flow to the second step causes a reduction in reattachment length and turbulent fluctuations, primarily due to the downwash induced by the first recirculation zone. The presence of the second step in proximity to the first step causes a significant reduction in the first-step base pressure. A mechanism was proposed whereby the structure of the BFS recirculation zone, which dictates a requisite pressure rise through reattachment for given shear-layer characteristics, enables the low second-step base pressure to influence the upstream first-step base pressure. For the DBFS, the lack of a step floor downstream of reattachment provides room for the flow, external to the first recirculation region, to continue in its downward motion, resulting in a lower peak pressure downstream of reattachment on the first step.
Care was taken to ensure that the main governing experimental parameters, including aspect ratio ( $AR$), expansion ration (
 $ER$) and upstream boundary-layer thickness (
 $\delta /h$), were not in sensitive ranges. This was to ensure that these parameters are unlikely to cause significant variation to the results with the introduction of a second step. As such, the regimes identified should provide a generalised description of the flow for a broad range of experimental set-ups and practical applications. Analysis of spatial distributions of spectral power, as well as the phase distributions of SPOD modes, revealed the variation in dynamic characteristics of key instabilities in the flow. No significant variation in either the shear-layer instability or the low-frequency flapping motion of the recirculation zone occurred for
  $d\le 3$. When the flow reattaches on the first step, it was shown that the second recirculation zone shear layer and flapping motion become more sensitive to the incoming flow characteristics. In particular, it appears that large-scale turbulent fluctuations of the first recirculation zone persist downstream of the second step, influencing the development of the second recirculation zone. No complex trends in the reattachment location dynamics were found, with a comparable standard deviation of instantaneous reattachment in the single reattachment and double reattachment regimes.
The identification and description of the three generalised flow regimes provide new understanding of the fundamental interactions of regions of separated flow. Several key findings were identified, potentially relevant to a broad range of practical applications, such as flame stabilisers in combustors, the flow over decks of large ships, to the drag on utility vehicles. Of note, the findings show minimal variation in the global flow structure and key statistics when a second step protrudes into the recirculation zone up to a distance of approximately two single step heights. This, as well as the interrelated influences of multiple closely spaced recirculation zones, provides useful insights into applications with more complex geometries. Both the maximum combined base pressure and minimum length of detached flow occurred for a step separation of  $d=6h$. From a practical perspective of assessing and optimising bluff-body drag or structural loading, while moving from a two- to three-dimensional geometry must play role, these results offer insight into the optimal spacing of multiple regions of separated flow to enhance aerodynamic performance. Future work will examine the effect of imposed perturbations on the identified flow regimes, broadening our understanding of the sensitivity of the flow dynamics to upstream flow forcing.
Funding
This research used equipment that was partially funded by the Australian Government through the Australian Research Council's Linkage Infrastructure, Equipment and Facilities programme (project number: LE170100203). T.M. acknowledges the financial support of an Australian Government Research Training Program Scholarship.
Declaration of interests
The authors report no conflict of interest.


