


1 Introduction
A fundamental flow configuration that can be employed to study flow separation while circumventing the requirement of a complex boundary layer analysis was first conceived by Chapman, Kuehn & Larson (Reference Chapman, Kuehn and Larson1958). The configuration was proposed as a limiting case in separations behind rearward-facing steps and compression corners when the distance from the leading edge to the point of separation approaches zero. In that way, a boundary layer can be assumed to have zero initial thickness and the incoming flow undergoes separation as soon as it reaches the surface of the configuration. Separation is therefore fully decoupled from any pre-existing boundary layer development. This simplification paved the way for theoretical investigations of the separated region. Chapman et al. (Reference Chapman, Kuehn and Larson1958) used this model to propose a theoretical correlation between the dead-air pressure in the separated region and the outer inviscid flow pressure after reattachment. The theoretical concept was then validated through a series of experiments conducted at Mach numbers ranging from 1.5 to 3.0 and Reynolds numbers of 5000–20 000, with a characteristic length taken as the distance from the leading edge to the corner.
Even though the model has demonstrated significance for the study of separation, it has not been widely used in hypersonic flow investigations. In fact, it went into a hiatus coincidentally with the emergence of aerodynamic designs subjected to hypersonic flows. One of the reasons for this is that a pure leading-edge separation concept is not viable in hypersonic flows due to strong viscous effects. Flow separations generally occur very close to, but at a finite distance downstream of, the leading edge. This can lead to a small growth of the boundary layer before separation and the growth would be affected by complexities such as rarefaction and thermal non-equilibrium. The prevailing physics then defeats the purpose as the onset of separation would be influenced by these effects. Also, research interests swayed towards more practical configurations as hypersonic flow research gained momentum in the 1960s and 1970s. This resulted in numerous experimental and theoretical works based on compression corners (Holden Reference Holden1971, Reference Holden1978), hollow cylinder flares (Gray Reference Gray1965), flat plates (Needham & Stollery Reference Needham and Stollery1966; Cheng et al. Reference Cheng, Hall, Golian and Hertzberg1961) and other separated flow geometries that would be encountered in flight. However, flow separation with all these practical configurations had the ubiquitous influence of a pre-existing boundary layer. At the same time, no reasonable attempts were made towards investigating the applicability of leading-edge separation models at higher-Mach-number ranges than those employed by Chapman et al. (Reference Chapman, Kuehn and Larson1958). In practical hypersonic applications, small geometrical imperfections can trigger flow separations, and it is important in the design of control surfaces and in base flows to understand the effects of such imperfections. By employing a fundamental model to study separation, insights into the separated flow behaviour can be obtained, which can then be used for the improvement or optimisation of more practical but more complex designs. As such, the problem is of intrinsic fundamental fluid mechanics interest. The present work, therefore, is a comprehensive study of leading-edge separation over a ‘tick’-shaped configuration in low-density hypersonic flows, investigating the flow behaviour through computational, analytical and experimental methods.
The leading-edge separation or ‘tick’ configuration has recently attracted renewed interest among researchers worldwide as a result of general hypersonic separated flow studies initiated by the Hypersonics Group at the University of New South Wales (UNSW) Canberra. The computational efforts trace back to the earlier works of Moss et al. (Reference Moss, O’Byrne, Deepak and Gai2012) and Moss, O’Byrne & Gai (Reference Moss, O’Byrne and Gai2014), who used the direct simulation Monte Carlo (DSMC) tool of Graeme Bird, called DS2V (Bird Reference Bird2011), to investigate the characteristics of flow separation over this configuration when subjected to hypersonic flows. A free-stream flow condition with high enthalpy and low density (designated as condition A with a specific flow total enthalpy of
 $13~\text{MJ}~\text{kg}^{-1}$
) was employed based on concurrent experiments at the T-ADFA free-piston shock tunnel (O’Byrne et al.
Reference O’Byrne, Kaseman, Krishna, Gai, Kleine and Neely2014) at UNSW Canberra. In Moss et al. (Reference Moss, O’Byrne, Deepak and Gai2012), predictions from DSMC for a sharp leading-edge configuration were compared against similar results obtained using a no-slip Navier–Stokes (NS) code. Significant differences were observed in the size of the separation region and magnitudes of surface parameters. DSMC predicted an incipient separation whereas NS predicted a much larger separated region. Both results agreed on the occurrence of separation downstream of the leading edge. The flow deflection at the leading edge induces rarefaction and slip effects in the flow prior to separation, and resolving these effects is important in computational investigations of separation and the shear layer after separation. The underlying first-order approximations in the NS equations may not be adequate to accurately resolve the flow with slip effects without an additional phenomenological slip model imposed at the surface. The phenomenological modelling based on molecular interactions in DSMC has no such limitations and is a more appropriate tool in studying transitional and rarefied flows such as leading-edge separation at the conditions considered here.
$13~\text{MJ}~\text{kg}^{-1}$
) was employed based on concurrent experiments at the T-ADFA free-piston shock tunnel (O’Byrne et al.
Reference O’Byrne, Kaseman, Krishna, Gai, Kleine and Neely2014) at UNSW Canberra. In Moss et al. (Reference Moss, O’Byrne, Deepak and Gai2012), predictions from DSMC for a sharp leading-edge configuration were compared against similar results obtained using a no-slip Navier–Stokes (NS) code. Significant differences were observed in the size of the separation region and magnitudes of surface parameters. DSMC predicted an incipient separation whereas NS predicted a much larger separated region. Both results agreed on the occurrence of separation downstream of the leading edge. The flow deflection at the leading edge induces rarefaction and slip effects in the flow prior to separation, and resolving these effects is important in computational investigations of separation and the shear layer after separation. The underlying first-order approximations in the NS equations may not be adequate to accurately resolve the flow with slip effects without an additional phenomenological slip model imposed at the surface. The phenomenological modelling based on molecular interactions in DSMC has no such limitations and is a more appropriate tool in studying transitional and rarefied flows such as leading-edge separation at the conditions considered here.
Recently, Prakash, Gai & O’Byrne (Reference Prakash, Gai and O’Byrne2018) published a detailed computational study on the characteristics of flow separation over the same configuration with a sharp leading edge using the DSMC tool SPARTA (Plimpton & Gallis Reference Plimpton and Gallis2016), which is developed by Sandia National Laboratories, USA. A free-stream flow condition with moderate enthalpy and low density (designated as condition E with a specific flow total enthalpy of
 $3.7~\text{MJ}~\text{kg}^{-1}$
) is used in this study. This flow condition is also used for experimental studies in the T-ADFA free-piston shock tunnel, as this particular condition promotes separation close to the leading edge. Computations predicted separation at a distance of 0.5 mm from the leading edge but rarefaction effects seem significant even within this short distance. Salient features of separation, reattachment, boundary layer growth up to separation, flow structure in the recirculation region and surface parameters are investigated in detail in this work. Also, the strong dependence of the temporal evolution of flow structures in the separated region on wall-to-stagnation-temperature ratio has been explored. In conjunction with computational efforts, useful strides with analytical investigations are also presented using linearised NS equations from the studies of Oswatitsch (Reference Oswatitsch1957), Inger (Reference Inger1977) and Inger & Moss (Reference Inger and Moss2007). These studies aimed to determine geometrical characteristics of the dividing streamline at separation and reattachment, such as the angle with respect to the surface, shape and radius of curvature. These analytical investigations further highlight the influence of rarefaction effects on separation and also ascertain the differences in boundary layer growth leading to separation relative to the aforementioned theoretical studies that are based on traditional no-slip, Blasius-type boundary layer development.
$3.7~\text{MJ}~\text{kg}^{-1}$
) is used in this study. This flow condition is also used for experimental studies in the T-ADFA free-piston shock tunnel, as this particular condition promotes separation close to the leading edge. Computations predicted separation at a distance of 0.5 mm from the leading edge but rarefaction effects seem significant even within this short distance. Salient features of separation, reattachment, boundary layer growth up to separation, flow structure in the recirculation region and surface parameters are investigated in detail in this work. Also, the strong dependence of the temporal evolution of flow structures in the separated region on wall-to-stagnation-temperature ratio has been explored. In conjunction with computational efforts, useful strides with analytical investigations are also presented using linearised NS equations from the studies of Oswatitsch (Reference Oswatitsch1957), Inger (Reference Inger1977) and Inger & Moss (Reference Inger and Moss2007). These studies aimed to determine geometrical characteristics of the dividing streamline at separation and reattachment, such as the angle with respect to the surface, shape and radius of curvature. These analytical investigations further highlight the influence of rarefaction effects on separation and also ascertain the differences in boundary layer growth leading to separation relative to the aforementioned theoretical studies that are based on traditional no-slip, Blasius-type boundary layer development.
Another interesting finding is the reasonable agreement between computed and semi-analytical profiles of velocity and temperature at the beginning of interaction and separation. Semi-analytical profiles have been generated using computed slip and jump values of velocity and temperature at the wall as boundary conditions in the theoretical boundary layer model proposed by Cohen & Reshotko (Reference Cohen and Reshotko1956). Even though good agreement is obtained for the velocity profiles and close to the wall for the temperature profiles, noticeable differences occurred in temperature profiles around its maximum within the boundary layer. This has been attributed to the inadequacy of the linear viscosity–temperature relationship, as used in theory, in the presence of thermal non-equilibrium. With an overall reduction in the flow region subjected to strong rarefaction effects compared with the higher-enthalpy low-density conditions in the initial simulations of Moss et al. (Reference Moss, O’Byrne, Deepak and Gai2012), it is expected that predictions from DSMC and NS should show better agreement. When comparing DSMC results with the steady-state NS computations of Khraibut et al. (Reference Khraibut, Gai, Brown and Neely2017) on the same configuration and at a wall temperature of 300 K, it was found that the flow structure in the separated recirculation region is markedly different. The presence of large asymmetric secondary vortex structures within the primary recirculation region is established in NS computations, whereas DSMC results at a physical flow time of 1.25 ms present only a small secondary vortex at the corner lying under the primary recirculation region. At the same time, both approaches agreed well on the respective predictions of the size of the separated region. High-fidelity DSMC computations (Tumuklu, Levin & Theofilis Reference Tumuklu, Levin and Theofilis2017) using the SMILE DSMC code also found an enlarged asymmetric secondary structure by continuing computations up to a physical flow time of 2.5 ms with a larger number of simulated particles and number of collision cells than those used in Prakash et al. (Reference Prakash, Gai and O’Byrne2018). In light of these differences, obtaining experimental steady-state data and validation of computational results become a formidable task, and the present work is an attempt to achieve this objective.
The computational part of the present work focuses on a configuration with a leading-edge bluntness radius of
 $20~\unicode[STIX]{x03BC}\text{m}$
rather than a sharp leading edge as studied in Prakash et al. (Reference Prakash, Gai and O’Byrne2018). The purpose is to effectively compare and validate computational results against experimental surface heat-flux and flow visualisation data attained using manufactured models with leading-edge radius in the range of 10–
$20~\unicode[STIX]{x03BC}\text{m}$
rather than a sharp leading edge as studied in Prakash et al. (Reference Prakash, Gai and O’Byrne2018). The purpose is to effectively compare and validate computational results against experimental surface heat-flux and flow visualisation data attained using manufactured models with leading-edge radius in the range of 10–
 $30~\unicode[STIX]{x03BC}\text{m}$
. Using the sharp leading-edge configuration as the base case, changes induced in the flow and surface parameters due to such a small leading-edge bluntness are explained in detail from a fluid dynamic perspective, emphasising possible causes of observed differences. In addition to computational heat flux, which is validated against experiments, other surface parameters such as pressure, skin friction and gas velocity at the wall are also analysed in detail. The analytical portion of this work centres on the separated shear layer based on the work by Baum, King & Deninson (Reference Baum, King and Deninson1964). As executed in Prakash et al. (Reference Prakash, Gai and O’Byrne2018), the theoretical concept will be supplemented with computational initial conditions so as to obtain semi-analytical profiles of the shear and enthalpy functions and the dividing streamline. Similar profiles from computations are then compared against these semi-analytical profiles and profiles from experimental flow-field data.
$30~\unicode[STIX]{x03BC}\text{m}$
. Using the sharp leading-edge configuration as the base case, changes induced in the flow and surface parameters due to such a small leading-edge bluntness are explained in detail from a fluid dynamic perspective, emphasising possible causes of observed differences. In addition to computational heat flux, which is validated against experiments, other surface parameters such as pressure, skin friction and gas velocity at the wall are also analysed in detail. The analytical portion of this work centres on the separated shear layer based on the work by Baum, King & Deninson (Reference Baum, King and Deninson1964). As executed in Prakash et al. (Reference Prakash, Gai and O’Byrne2018), the theoretical concept will be supplemented with computational initial conditions so as to obtain semi-analytical profiles of the shear and enthalpy functions and the dividing streamline. Similar profiles from computations are then compared against these semi-analytical profiles and profiles from experimental flow-field data.
Investigating hypersonic separated flow using quantitative experimental measurements is paramount in deepening the understanding of fluid dynamics associated with such regions and the influence of said flows on surrounding bodies. Separated region studies, particularly pertaining to the measurement of heat flux, have been an area of continuous exploration since early investigations of hypersonic flows (Holden Reference Holden1971; Wieting Reference Wieting1975; Merzkirch, Page & Fletcher Reference Merzkirch, Page and Fletcher1988). Rearward-facing steps, cavities, compression corners and base regions of bodies have found utility in reproducing conditions in the separated flow regions of hypersonic vehicles, with the majority of experimental studies focused on these fundamental geometries (Merzkirch et al. Reference Merzkirch, Page and Fletcher1988). Various experimental methods have been used for the quantitative measurement of surface heat flux within high-enthalpy hypersonic flows (Olivier et al. Reference Olivier, Vetter, Jessen and Grönig1993; Simmons Reference Simmons1995). The use of thin-film temperature sensors or thermocouples has become commonplace in impulsive hypersonic facilities due to their ability to respond to high-speed transient flow processes whilst providing quantitative measurements, with the design and construction of such gauges discussed in the seminal work of Schultz & Jones (Reference Schultz and Jones1973). Thermocouples have proven to be effective in regions of flow stagnation, as the robust nature of the device allows for a combination of fast response and survivability in high temperatures (Gai Reference Gai1992; Park, Gai & Neely Reference Park, Gai and Neely2010a ). Examples of thin-film gauges employed for heat-flux measurements are numerous, as their size and sensitivity make them ideal for measurements where temperature change during flow duration is small (O’Byrne Reference O’Byrne2002). Unlike coaxial thermocouples, the surface of a thin-film gauge is typically planar, limiting measurement locations to flat surfaces, or surfaces with large body radii where gauge diameter is sufficiently small such that flow disturbance is kept to a minimum. An example of such an application can be found in Wadhams et al. (Reference Wadhams, Mundy, MacLean and Holden2008). Previous application of thin-film gauges to high-enthalpy rarefied flows range from flat plates (Neely, Stalker & Paull Reference Neely, Stalker and Paull1991), the study of wake flows of rearward-facing steps and bluff bodies (Hayne et al. Reference Hayne, Mee, Morgan, Gai and Mclntyre2003; Park et al. Reference Park, Gai and Neely2010a ; Park, Gai & Neely Reference Park, Gai and Neely2010b ), etc. The present work emulates these studies by employing resistive temperature thin-film gauges (TFGs) to obtain quantitative surface heat-flux results in the T-ADFA free-piston shock tunnel.
Planar laser-induced fluorescence (PLIF) measurement is a non-intrusive technique that can generate spatially resolved two-dimensional mapping of flow velocities and temperatures. This is accomplished using the fluorescence of nitric oxide, which is formed in measurable quantities in the nozzle reservoir at the end of the shock tube in the reflected shock tunnel.
A brief presentation of the flow configuration, free-stream conditions, leading-edge separation concept and computational as well as experimental model set-up is given in § 2. Computational results with descriptive interpretations are laid out in § 3, for surface and flow-field characteristics. Discussion of the theoretical model of Baum et al. (Reference Baum, King and Deninson1964) and calculation of semi-analytical profiles are carried out in § 4. Details of the facility and experiments conducted for heat-flux and PLIF measurements are given in § 5, which also includes the post-processing methods employed. Comparison and validation of computational results against experimental data are presented in § 6. Finally, some conclusions are drawn in § 7.
2 Flow configuration
Experiments on the leading-edge separation configuration have been carried out in the T-ADFA free-piston shock tunnel, and free-stream conditions are based on a moderate-enthalpy flow (designated as condition E) in the tunnel test section (Kaseman Reference Kaseman2017). Details of free-stream flow conditions and important flow features over the experimental model at this flow condition, the geometric configuration of the experimental model and the computational domain for DSMC simulations are presented here. Only the test-section flow parameters are discussed here and a more elaborate discussion of the experimental facility is provided in § 5.1.
2.1 Free-stream conditions
High-speed flow is realised in typical impulse facilities by expanding the test gas through a convergent–divergent nozzle. Such a sudden expansion typically results in a vibrationally non-equilibrium or vibrationally frozen flow in the test section because the vibrational relaxation time of gas molecules is much larger relative to the translational and rotational relaxation times. Therefore, depending on the physical flow time scale, a suddenly expanded flow has a higher probability to be in a vibrationally non-equilibrium (or frozen) state. Reservoir and free-stream conditions based on experiments conducted at the T-ADFA free-piston shock tunnel are listed in table 1.
Table 1. Reservoir and free-stream conditions for the experiments.

As shown in table 1, the respective vibrational temperatures of the constituent species of the free-stream gas are different from the translational and rotational temperatures, because of the vibrational non-equilibrium state of the free stream.
2.2 Leading-edge separation model
A schematic of the main flow features over a leading-edge separation model is shown in figure 1. The incoming hypersonic flow interacts with the leading edge and generates a leading-edge shock. Thereafter, the convex flow deflection of the incoming stream over the surface results in a strong expansion close to the leading edge. The onset of separation is dictated by the balance between this expansion and the adverse pressure gradient induced by the presence of the corner. Thus, the extent of expansion along the surface after the leading edge depends on density as well as the enthalpy of the incoming free stream and the geometric flow deflection angle at the corner. For a fixed geometric flow deflection angle at the corner, the higher the enthalpy and the lower the density of the free stream, the larger the extent of expansion before the occurrence of separation (Prakash, Gai & O’Byrne Reference Prakash, Gai and O’Byrne2017). For the present free-stream conditions in table 1, the adverse pressure gradient from the corner is felt far upstream and separation occurs very close to the leading edge. Even though labelled as a leading-edge separation, strong viscous effects associated with hypersonic flows prevent separation from occurring at the leading edge. It is rather pushed downstream to a location depending on the aforementioned free-stream and geometric parameters.

Figure 1. Schematic of the hypersonic leading-edge separation.
The shear layer that separates after expansion generates a separation shock. The leading-edge shock is relatively weaker compared to the separation shock and it dissipates faster further away from the surface. The separated shear layer eventually reattaches on the compression surface and is characterised by a region of high compression. The separated shear layer and the model surface then encompass a well-defined recirculation region. Owing to local vorticity and temperature gradients within the recirculation region, the single primary vortex structure may break down and coexist with further secondary and tertiary vortices. It has been theoretically proven that a small corner eddy, known as the Moffat eddy (Moffat Reference Moffat1964), will always be present in any corner-induced separated flow when the corner angle is
 ${\leqslant}146^{\circ }$
. After reattachment, the shear layer is turned parallel to the compression surface, creating a reattachment shock. The separation shock meets the reattachment shock at the triple point and, if both are of the same family, a series of expansion wavelets emanate from the triple point and impinge on the surface. This type of interaction is classified as Edney type VI (Edney Reference Edney1968) and results in a local reduction in surface properties such as pressure, heat flux, etc. after reattachment.
${\leqslant}146^{\circ }$
. After reattachment, the shear layer is turned parallel to the compression surface, creating a reattachment shock. The separation shock meets the reattachment shock at the triple point and, if both are of the same family, a series of expansion wavelets emanate from the triple point and impinge on the surface. This type of interaction is classified as Edney type VI (Edney Reference Edney1968) and results in a local reduction in surface properties such as pressure, heat flux, etc. after reattachment.
The geometric configuration of the experimental model and its support structure used in the tunnel are shown in figure 2(a). The two-dimensional computational model with boundary conditions is shown in figure 2(b). The model has a span of 200 mm, giving an aspect ratio (AR) of 10 based on the expansion surface length, and this is adequate (
 $\text{AR}\geqslant 6$
) for a nominally two-dimensional flow in the mid-span region (Kubota, Lees & Lewis Reference Kubota, Lees and Lewis1968).
$\text{AR}\geqslant 6$
) for a nominally two-dimensional flow in the mid-span region (Kubota, Lees & Lewis Reference Kubota, Lees and Lewis1968).

Figure 2. Model details: (a) experimental and (b) computational models.
3 Computations
A sharp leading edge is a theoretical limit, as there will always be bluntness induced due to machining processes involved in manufacturing experimental models. The replaceable leading edges prepared for the present study were measured to have a leading-edge radius of the order of 10–
 $30~\unicode[STIX]{x03BC}\text{m}$
. Such geometrical imperfections, even though in the scale of the free-stream mean free path (MFP),
$30~\unicode[STIX]{x03BC}\text{m}$
. Such geometrical imperfections, even though in the scale of the free-stream mean free path (MFP),
 $\unicode[STIX]{x1D706}_{\infty }$
, can significantly alter the flow structure around the leading edge when compared to the idealised perfectly sharp leading edge (Moss et al.
Reference Moss, O’Byrne and Gai2014; Prakash et al.
Reference Prakash, Gai and O’Byrne2017). In the present configuration, separation and further flow development downstream are dictated by expansion and rarefaction occurring close to the leading edge. Therefore, bluntness affects the characteristics of separation and the shear layer. This is also important when computational results need to be compared against experiments. Taking bluntness effects into account, two computational models are used in the present study, with leading-edge radii corresponding to 0 (sharp) and
$\unicode[STIX]{x1D706}_{\infty }$
, can significantly alter the flow structure around the leading edge when compared to the idealised perfectly sharp leading edge (Moss et al.
Reference Moss, O’Byrne and Gai2014; Prakash et al.
Reference Prakash, Gai and O’Byrne2017). In the present configuration, separation and further flow development downstream are dictated by expansion and rarefaction occurring close to the leading edge. Therefore, bluntness affects the characteristics of separation and the shear layer. This is also important when computational results need to be compared against experiments. Taking bluntness effects into account, two computational models are used in the present study, with leading-edge radii corresponding to 0 (sharp) and
 $20~\unicode[STIX]{x03BC}\text{m}$
. The latter case (with the
$20~\unicode[STIX]{x03BC}\text{m}$
. The latter case (with the
 $20~\unicode[STIX]{x03BC}\text{m}$
radius) will be subsequently described as the ‘blunt’ case. A detailed study on effects of leading-edge bluntness is outside the scope of this work. The present paper focuses on general fluid dynamic characteristics of leading-edge separation and the comparison with heat-flux and PLIF measurements. However, differences between computed cases as a result of the finite bluntness are identified and discussed.
$20~\unicode[STIX]{x03BC}\text{m}$
radius) will be subsequently described as the ‘blunt’ case. A detailed study on effects of leading-edge bluntness is outside the scope of this work. The present paper focuses on general fluid dynamic characteristics of leading-edge separation and the comparison with heat-flux and PLIF measurements. However, differences between computed cases as a result of the finite bluntness are identified and discussed.
A detailed presentation on grid sensitivity for the same model, with a sharp leading edge, as well as free-stream conditions has been performed by Prakash et al. (Reference Prakash, Gai and O’Byrne2018). An identical grid adaptation strategy is used in the present study with a blunt leading-edge model, so relevant details need not be repeated here. The final grid is obtained through successive refinements of the initial cell distribution over the flow domain and is based on the local Knudsen number (
 $Kn_{loc}=\unicode[STIX]{x1D706}_{loc}/\unicode[STIX]{x0394}x_{cell}$
), which is the ratio of the local MFP (
$Kn_{loc}=\unicode[STIX]{x1D706}_{loc}/\unicode[STIX]{x0394}x_{cell}$
), which is the ratio of the local MFP (
 $\unicode[STIX]{x1D706}_{loc}$
) to the local cell size (
$\unicode[STIX]{x1D706}_{loc}$
) to the local cell size (
 $\unicode[STIX]{x0394}x_{cell}$
), as the adaptation criterion. Boyd, Chen & Candler (Reference Boyd, Chen and Candler1995) proposed a local gradient-based Knudsen number (
$\unicode[STIX]{x0394}x_{cell}$
), as the adaptation criterion. Boyd, Chen & Candler (Reference Boyd, Chen and Candler1995) proposed a local gradient-based Knudsen number (
 $Kn_{GLL}=(\unicode[STIX]{x1D706}_{loc}/Q)(\text{d}Q/\unicode[STIX]{x0394}x_{cell})$
, where
$Kn_{GLL}=(\unicode[STIX]{x1D706}_{loc}/Q)(\text{d}Q/\unicode[STIX]{x0394}x_{cell})$
, where
 $Q$
is a macroscopic property such as density or temperature), that can also be employed as an adaptation criterion. The final grid, in turn, has 29 million collision cells and 205 million simulated particles. Computations are carried out on the National Computing Infrastructure’s (NCI) Raijin cluster (NCI 2017) and employed 496 processors for each run. Using a time step of
$Q$
is a macroscopic property such as density or temperature), that can also be employed as an adaptation criterion. The final grid, in turn, has 29 million collision cells and 205 million simulated particles. Computations are carried out on the National Computing Infrastructure’s (NCI) Raijin cluster (NCI 2017) and employed 496 processors for each run. Using a time step of
 $2.5\times 10^{-9}$
s, a physical flow time of 0.25 ms takes approximately 11 000 computational hours.
$2.5\times 10^{-9}$
s, a physical flow time of 0.25 ms takes approximately 11 000 computational hours.
The quality of the adapted grid is evaluated in terms of
 $Kn_{loc}$
, particles-per-cell (PPC) and the local mean collision time distributions at a physical flow time of 1 ms. Firstly, we will examine the
$Kn_{loc}$
, particles-per-cell (PPC) and the local mean collision time distributions at a physical flow time of 1 ms. Firstly, we will examine the
 $Kn_{loc}$
distribution over the domain, and this is shown in figure 3.
$Kn_{loc}$
distribution over the domain, and this is shown in figure 3.

Figure 3. The
 $Kn_{loc}$
distribution over the domain for the blunt leading-edge model.
$Kn_{loc}$
distribution over the domain for the blunt leading-edge model.
It is seen that
 $Kn_{loc}\geqslant 1$
is achieved for the region under the separated shear layer up to the reattachment location (at
$Kn_{loc}\geqslant 1$
is achieved for the region under the separated shear layer up to the reattachment location (at
 $x/x_{c}\approx 2.85$
in figure 3). A slightly smaller
$x/x_{c}\approx 2.85$
in figure 3). A slightly smaller
 $Kn_{loc}$
(
$Kn_{loc}$
(
 ${\approx}0.7$
) in the undisturbed free stream should not pose any influence on the surface results. However, a thin layer seems to evolve over the expansion surface and towards the corner with
${\approx}0.7$
) in the undisturbed free stream should not pose any influence on the surface results. However, a thin layer seems to evolve over the expansion surface and towards the corner with
 $Kn_{loc}$
in the range of
$Kn_{loc}$
in the range of
 ${\approx}0.8$
–0.9. This is due to the development of tertiary vortex structures close to the expansion surface (see figure 14), which results in a denser flow close to the surface. Resolving such flows accurately would require further division of parent cells in this region. An exponential rise in the number of cells then results, along with a proportional requirement for the total number of particles to maintain a reasonable number of PPC. An efficient way to tackle this would be to define a local region around the expansion surface that encompasses the layer with
${\approx}0.8$
–0.9. This is due to the development of tertiary vortex structures close to the expansion surface (see figure 14), which results in a denser flow close to the surface. Resolving such flows accurately would require further division of parent cells in this region. An exponential rise in the number of cells then results, along with a proportional requirement for the total number of particles to maintain a reasonable number of PPC. An efficient way to tackle this would be to define a local region around the expansion surface that encompasses the layer with
 $Kn_{loc}<1$
and locally adapt the cells within this region. Such an adaptation is effective only if the tertiary vortex development that causes this local phenomenon is steady so that the local region can be defined in such a way that it fully contains the layer with
$Kn_{loc}<1$
and locally adapt the cells within this region. Such an adaptation is effective only if the tertiary vortex development that causes this local phenomenon is steady so that the local region can be defined in such a way that it fully contains the layer with
 $Kn_{loc}<1$
. However, for an enlarging or unsteady tertiary vortex development, this may not be possible unless the area of the local region is also made time-dependent. This would then result in a similar exponential rise in number of cells. Considering that only a thin layer region is affected and that the
$Kn_{loc}<1$
. However, for an enlarging or unsteady tertiary vortex development, this may not be possible unless the area of the local region is also made time-dependent. This would then result in a similar exponential rise in number of cells. Considering that only a thin layer region is affected and that the
 $Kn_{loc}$
is not significantly smaller than 1, further refinements are not attempted here. The region downstream of the reattachment is affected due to the limited cell refinement, and systematic errors in results are expected. Therefore, results downstream of reattachment can only be treated as qualitative. The PPC distribution, based on the resulting adapted grid structure and total number of particles, is shown in figure 4. A
$Kn_{loc}$
is not significantly smaller than 1, further refinements are not attempted here. The region downstream of the reattachment is affected due to the limited cell refinement, and systematic errors in results are expected. Therefore, results downstream of reattachment can only be treated as qualitative. The PPC distribution, based on the resulting adapted grid structure and total number of particles, is shown in figure 4. A
 $\text{PPC}\geqslant 6$
is reasonably maintained everywhere except within the various shocks and along the edge of the separated shear layer. Relative to the sharp leading edge, the leading-edge shock is stronger and thicker due to the bluntness and, therefore,
$\text{PPC}\geqslant 6$
is reasonably maintained everywhere except within the various shocks and along the edge of the separated shear layer. Relative to the sharp leading edge, the leading-edge shock is stronger and thicker due to the bluntness and, therefore,
 $\unicode[STIX]{x1D706}_{loc}$
is smaller within the shock. This results in smaller local cell size, which depends on
$\unicode[STIX]{x1D706}_{loc}$
is smaller within the shock. This results in smaller local cell size, which depends on
 $\unicode[STIX]{x1D706}_{loc}$
through
$\unicode[STIX]{x1D706}_{loc}$
through
 $Kn_{loc}$
, and requires more particles in this region to maintain the same PPC.
$Kn_{loc}$
, and requires more particles in this region to maintain the same PPC.

Figure 4. PPC distribution over the domain for the blunt leading-edge model.
It is also interesting to examine the local mean collision time as shown in figure 5. It is observed that, except for the region after reattachment and under the reattachment shock (the fore body region before the leading edge is not relevant), the local mean collision times are larger than the time step used by a factor of nearly 3. This again points out the possibility of systematic errors induced in the results after the reattachment from the combined effects of inadequacies in number of cells and time step. At the same time, the time step of
 $2.5\times 10^{-9}$
s seems reasonable elsewhere.
$2.5\times 10^{-9}$
s seems reasonable elsewhere.

Figure 5. Local mean collision time distribution over the domain for the blunt leading-edge model.
Even in situations when DSMC requirements regarding the collision cells, PPC and time steps are fully met based on the problem, the choice of appropriate collision and reaction models can still influence the results. Molecular interaction and reaction models used in the present computations have been chosen based on physical appropriateness at the temperatures involved and also considering the required computational time. For collision models, SPARTA uses either the variable hard sphere (VHS) or variable soft sphere (VSS) models (Bird Reference Bird1994). Only the VHS model is used in the present study. Even though both models are capable of reproducing the temperature dependence of viscosity when compared against measurements, VSS models can reproduce the measured coefficient of diffusion as well. However, as pointed out in Bird (Reference Bird1994), the use of the VSS model requires accurate knowledge of an exponential term,
 $\unicode[STIX]{x1D6FC}$
, in the expression for deflection angle. Within standard temperature ranges, this stays as a constant but not necessarily when the temperatures are significantly large. Also, there might be the possibility that any difference induced would be absorbed within the usual statistical scattering in the results. Some preliminary computations on the present geometry have shown only marginal difference in results (
$\unicode[STIX]{x1D6FC}$
, in the expression for deflection angle. Within standard temperature ranges, this stays as a constant but not necessarily when the temperatures are significantly large. Also, there might be the possibility that any difference induced would be absorbed within the usual statistical scattering in the results. Some preliminary computations on the present geometry have shown only marginal difference in results (
 ${<}2\,\%$
) between the models but longer computational times when the VSS model is employed. The choice of the VHS model for the present study is based on these considerations.
${<}2\,\%$
) between the models but longer computational times when the VSS model is employed. The choice of the VHS model for the present study is based on these considerations.
Based on the rotational relaxation model by Haas et al. (Reference Haas, Hash, Bird, Lumpkin and Hassan1994), Bird (Reference Bird1994) points out that, for realistic gas species in air, the rotational collision number varies between 3 and 7. Therefore, a variable collision number is not used in the present study, but a constant value of 5 is used for all the diatomic species (N
 $_{2}$
, O
$_{2}$
, O
 $_{2}$
and NO) so as to reduce the computational time by avoiding the need to solve an additional temperature-dependent equation. Similar to the rotational relaxation, a constant vibrational collision number (different for each species) is used in the present study. This constant value is based on the Millikan & White (Reference Millikan and White1963) vibrational relaxation model and using the species’ characteristic vibrational temperatures (
$_{2}$
and NO) so as to reduce the computational time by avoiding the need to solve an additional temperature-dependent equation. Similar to the rotational relaxation, a constant vibrational collision number (different for each species) is used in the present study. This constant value is based on the Millikan & White (Reference Millikan and White1963) vibrational relaxation model and using the species’ characteristic vibrational temperatures (
 $\unicode[STIX]{x1D703}_{vib}$
). This approximation is reasonable in the sense that any amount of vibrational excitation occurs only when the translational temperature (
$\unicode[STIX]{x1D703}_{vib}$
). This approximation is reasonable in the sense that any amount of vibrational excitation occurs only when the translational temperature (
 $T_{tr}$
) is of the order of
$T_{tr}$
) is of the order of
 $\unicode[STIX]{x1D703}_{vib}$
. As such, the constant collision numbers used are 17 900, 52 600 and 123 406 for O
$\unicode[STIX]{x1D703}_{vib}$
. As such, the constant collision numbers used are 17 900, 52 600 and 123 406 for O
 $_{2}$
, N
$_{2}$
, N
 $_{2}$
and NO, respectively.
$_{2}$
and NO, respectively.
For molecular surface interactions, a fully diffuse surface with full surface accommodation is used. This is chosen based on the surface conditions of the manufactured experimental models. Even though the surface of a practically manufactured model approximates a partially diffusive and partially specular one, the probability is to be predominantly diffusive due to the surface polishing limitations and also due to the erosion from using the same model over many tunnel runs in experiments. A parametric study to evaluate the influence of these molecular modelling choices on results is not undertaken at this stage.
3.1 Leading-edge flow structure
The flow structure around the leading edge for both models is shown in figure 6. The leading-edge shock appears stronger for the blunt leading edge relative to the sharp case. Even though the blunt leading-edge shock is stronger, it is still an attached shock rather than a detached bow shock, which might be the case for leading-edge radii an order of magnitude larger relative to the bluntness considered here. Also, for both cases, the leading-edge shock is weaker than the separation shock and dissipates faster. For a sharp leading edge, the expansion is solely due to the flow deflection of the incoming hypersonic stream. Meanwhile, for the blunt leading edge in a viscous-dominated flow (see § 3.2.1), the flow undergoes an acceleration over the curved geometry before the leading-edge shock. This increases the kinetic energy locally within the boundary layer but also gets affected by the upstream influence of a stronger leading-edge shock. Detailed physical characteristics of flow separation and reattachment for both cases are discussed in §§ 3.2 and 3.3.

Figure 6. Numerical schlieren visualisations showing flow structure in the vicinity of (a) sharp and (b) blunt leading edges. Spatial coordinates in the streamwise (
 $x$
) and normal (
$x$
) and normal (
 $y$
) directions are normalised with respect to the streamwise distance to the corner from the leading edge (
$y$
) directions are normalised with respect to the streamwise distance to the corner from the leading edge (
 $x_{c}$
).
$x_{c}$
).
3.2 Surface characteristics
Computations were performed up to a physical flow time of 1.25 ms, with statistical averaging taken during the sampling interval of 1–1.25 ms. The physical flow time of 1.25 ms is chosen based on the steady-state flow time available in experiments, which is approximately 1 ms (O’Byrne et al.
Reference O’Byrne, Kaseman, Krishna, Gai, Kleine and Neely2014). The main surface characteristics of interest are pressure, heat flux, skin friction (or shear stress) and gas velocity at the wall or surface. Fluid dynamic behaviours of these parameters are explained in detail in this section. The non-dimensional surface parameters for pressure (
 $C_{p}$
), shear stress (
$C_{p}$
), shear stress (
 $C_{f}$
) and heat flux (
$C_{f}$
) and heat flux (
 $C_{h}$
) are defined as
$C_{h}$
) are defined as
 $$\begin{eqnarray}\displaystyle & \displaystyle C_{p},C_{f}=\frac{p_{w},\unicode[STIX]{x1D70F}_{w}}{0.5\unicode[STIX]{x1D70C}_{\infty }u_{\infty }^{2}}, & \displaystyle\end{eqnarray}$$
 $$\begin{eqnarray}\displaystyle & \displaystyle C_{h}=\frac{q_{w}}{0.5\unicode[STIX]{x1D70C}_{\infty }u_{\infty }^{3}}, & \displaystyle\end{eqnarray}$$
 $p$
,
$p$
,
 $\unicode[STIX]{x1D70F}$
and
$\unicode[STIX]{x1D70F}$
and
 $q$
are pressure, shear stress and heat flux, respectively, and the subscript
$q$
are pressure, shear stress and heat flux, respectively, and the subscript
 $w$
indicates values at the wall (or surface).
$w$
indicates values at the wall (or surface).3.2.1 Pressure
The distribution of pressure over the model surface is shown in figure 7. The tick surface shown in figures is not scaled with the right aspect ratio in the
 $y$
coordinate but included for representation purposes only. For correct surface dimensions, refer to figure 2. Both models exhibit similar features such as a pressure plateau and a dip from the peak before attaining a constant value further downstream. The establishment of a pressure plateau after separation is a characteristic of well-separated flows. The dip from the peak exemplifies an Edney type VI interaction at the triple point as explained in § 2.2. Such a dip in surface parameters as a result of shock interactions is a typical characteristic of hypersonic flows (Holden Reference Holden1971). Separation and reattachment locations are marked in figure 7 but physical aspects underlying these particular locations are described in § 3.2.3.
$y$
coordinate but included for representation purposes only. For correct surface dimensions, refer to figure 2. Both models exhibit similar features such as a pressure plateau and a dip from the peak before attaining a constant value further downstream. The establishment of a pressure plateau after separation is a characteristic of well-separated flows. The dip from the peak exemplifies an Edney type VI interaction at the triple point as explained in § 2.2. Such a dip in surface parameters as a result of shock interactions is a typical characteristic of hypersonic flows (Holden Reference Holden1971). Separation and reattachment locations are marked in figure 7 but physical aspects underlying these particular locations are described in § 3.2.3.

Figure 7. Normalised pressure distribution along the wall.
A noticeable feature is that the plateau pressure is higher for the blunt leading edge. This indicates stronger vorticity gradients within the recirculation region. Another vorticity-generated phenomenon is the slight dip in pressure just after the plateau region and before rising towards the reattachment. This is noticeable in both cases but occurs slightly earlier for the sharp case (at
 $x/x_{c}=1.32$
) relative to the blunt model (at
$x/x_{c}=1.32$
) relative to the blunt model (at
 $x/x_{c}=1.40$
). A possible reason for this dip is the presence of a Moffat eddy at the corner (Moffat Reference Moffat1964; Korolev, Gajjar & Ruban Reference Korolev, Gajjar and Ruban2002). Over the compression surface, the high-speed reverse flow of the primary recirculation streamlines close to the surface and extending from the reattachment towards the corner generates significant shear. This results in a continual drop in reverse-flow kinetic energy as the streamlines move towards the corner. If the shear is large, the available kinetic energy would not be able to overcome this and reach the corner. Dissipative effects then result in breaking down the primary recirculation region into a primary vortex and a secondary vortex (Moffat eddy) at the corner. Thus, the formation and evolution of the secondary corner vortex occur through vorticity-enhanced energy transfer from the primary recirculation region. This feeding of energy into the secondary vortex occurs at its downstream end. Thus, within the secondary vortex region, the local velocity at the downstream end tends to be higher and causes a dip in pressure. A shallower and spatially delayed dip for the blunt case, therefore, indicates a relatively enlarged secondary structure (see figure 14). The aforementioned rationale will be explored and elucidated further in § 3.3.2 while discussing the vorticity distribution over the flow domain.
$x/x_{c}=1.40$
). A possible reason for this dip is the presence of a Moffat eddy at the corner (Moffat Reference Moffat1964; Korolev, Gajjar & Ruban Reference Korolev, Gajjar and Ruban2002). Over the compression surface, the high-speed reverse flow of the primary recirculation streamlines close to the surface and extending from the reattachment towards the corner generates significant shear. This results in a continual drop in reverse-flow kinetic energy as the streamlines move towards the corner. If the shear is large, the available kinetic energy would not be able to overcome this and reach the corner. Dissipative effects then result in breaking down the primary recirculation region into a primary vortex and a secondary vortex (Moffat eddy) at the corner. Thus, the formation and evolution of the secondary corner vortex occur through vorticity-enhanced energy transfer from the primary recirculation region. This feeding of energy into the secondary vortex occurs at its downstream end. Thus, within the secondary vortex region, the local velocity at the downstream end tends to be higher and causes a dip in pressure. A shallower and spatially delayed dip for the blunt case, therefore, indicates a relatively enlarged secondary structure (see figure 14). The aforementioned rationale will be explored and elucidated further in § 3.3.2 while discussing the vorticity distribution over the flow domain.
The enhanced vorticity and the resulting enlargement of secondary structures within the primary recirculation region displace the reattachment location downstream and lead to an overall increase in the separation region size. This is illustrated in figure 7, in which the reattachment for the blunt model is further downstream relative to the sharp case. When the reattachment is displaced downstream, the bending of the shear layer parallel to the compression surface occurs gradually and results in a shallower angle between the surface and stacks of compression waves that coalesce to form the recompression shock. The strength of the recompression shock is barely affected, as evidenced by similar peak magnitudes, but the region of compression waves gets wider and results in a relatively smoother and extended peak region.
The inset in figure 7 depicts the region close to the leading edge within a distance of
 $x/x_{c}=0.1$
. The non-dimensional distance to separation from the leading edge is increased by 40 % for the blunt case relative to a sharp leading edge. This is consistent with the beginning of interaction at
$x/x_{c}=0.1$
. The non-dimensional distance to separation from the leading edge is increased by 40 % for the blunt case relative to a sharp leading edge. This is consistent with the beginning of interaction at
 $x/x_{c}=0.025$
and 0.032 for sharp and blunt cases, respectively. It is interesting to note that, regardless of the curvature induced by the bluntness and the inherent local flow acceleration, the pressure is higher for the blunt leading edge. This indicates that the flow in the vicinity of the leading edge is strongly influenced by viscous interactions between the leading-edge shock and the boundary layer rather than effects of a finite bluntness. A characteristic parameter determining the flow physics over surfaces with a finite leading-edge radius is the combined bluntness–viscous interaction parameter
$x/x_{c}=0.025$
and 0.032 for sharp and blunt cases, respectively. It is interesting to note that, regardless of the curvature induced by the bluntness and the inherent local flow acceleration, the pressure is higher for the blunt leading edge. This indicates that the flow in the vicinity of the leading edge is strongly influenced by viscous interactions between the leading-edge shock and the boundary layer rather than effects of a finite bluntness. A characteristic parameter determining the flow physics over surfaces with a finite leading-edge radius is the combined bluntness–viscous interaction parameter
 $\unicode[STIX]{x1D6FD}$
, which is given as (Cheng et al.
Reference Cheng, Hall, Golian and Hertzberg1961; Holden Reference Holden1971; Mallinson, Gai & Mudford Reference Mallinson, Gai and Mudford1996)
$\unicode[STIX]{x1D6FD}$
, which is given as (Cheng et al.
Reference Cheng, Hall, Golian and Hertzberg1961; Holden Reference Holden1971; Mallinson, Gai & Mudford Reference Mallinson, Gai and Mudford1996)
 $$\begin{eqnarray}\unicode[STIX]{x1D6FD}=\frac{\overline{\unicode[STIX]{x1D712}}_{\unicode[STIX]{x1D700}}}{\unicode[STIX]{x1D705}_{\unicode[STIX]{x1D700}}^{2/3}},\end{eqnarray}$$
where
 $$\begin{eqnarray}\displaystyle & \displaystyle \overline{\unicode[STIX]{x1D712}}_{\unicode[STIX]{x1D700}}=\unicode[STIX]{x1D700}\left(0.664+1.73\frac{h_{w}}{h_{0}}\right)M_{e}^{3}\sqrt{\frac{C^{\ast }}{Re_{s_{p}}}}, & \displaystyle\end{eqnarray}$$
 $$\begin{eqnarray}\displaystyle & \displaystyle \unicode[STIX]{x1D705}_{\unicode[STIX]{x1D700}}=\unicode[STIX]{x1D700}M_{e}^{3}\frac{C_{D}}{s_{p}/d}, & \displaystyle\end{eqnarray}$$
 $$\begin{eqnarray}\displaystyle & \displaystyle C^{\ast }=\frac{\unicode[STIX]{x1D707}^{\ast }T_{e}}{\unicode[STIX]{x1D707}_{e}T^{\ast }}, & \displaystyle\end{eqnarray}$$
 $h$
,
$h$
,
 $M$
,
$M$
,
 $\unicode[STIX]{x1D707}$
and
$\unicode[STIX]{x1D707}$
and
 $T$
the enthalpy, Mach number, viscosity and temperature, respectively. The subscripts
$T$
the enthalpy, Mach number, viscosity and temperature, respectively. The subscripts
 $w$
,
$w$
,
 $0$
and
$0$
and
 $e$
indicate values at the wall, stagnation and boundary layer edge, respectively. In the above,
$e$
indicate values at the wall, stagnation and boundary layer edge, respectively. In the above,
 $\overline{\unicode[STIX]{x1D712}}_{\unicode[STIX]{x1D700}}$
is the modified hypersonic viscous interaction parameter;
$\overline{\unicode[STIX]{x1D712}}_{\unicode[STIX]{x1D700}}$
is the modified hypersonic viscous interaction parameter;
 $\unicode[STIX]{x1D705}_{\unicode[STIX]{x1D700}}$
is the modified bluntness parameter;
$\unicode[STIX]{x1D705}_{\unicode[STIX]{x1D700}}$
is the modified bluntness parameter;
 $C^{\ast }$
is the Chapman–Rubesin parameter (Anderson Reference Anderson2006) evaluated at Eckert’s reference temperature
$C^{\ast }$
is the Chapman–Rubesin parameter (Anderson Reference Anderson2006) evaluated at Eckert’s reference temperature
 $T^{\ast }$
;
$T^{\ast }$
;
 $Re$
is the Reynolds number measured along the surface-parallel distance (
$Re$
is the Reynolds number measured along the surface-parallel distance (
 $s_{p}$
) from the leading edge; and
$s_{p}$
) from the leading edge; and
 $C_{D}$
and
$C_{D}$
and
 $d$
are geometrical values representing the drag coefficient and diameter of a hemispherical leading edge. For
$d$
are geometrical values representing the drag coefficient and diameter of a hemispherical leading edge. For
 $\unicode[STIX]{x1D6FD}\leqslant 0.1$
, the leading-edge flow is bluntness-dominated and for
$\unicode[STIX]{x1D6FD}\leqslant 0.1$
, the leading-edge flow is bluntness-dominated and for
 $\unicode[STIX]{x1D6FD}>0.1$
it is viscous-dominated. Using a
$\unicode[STIX]{x1D6FD}>0.1$
it is viscous-dominated. Using a
 $C_{D}$
of 0.4, as applicable to hemispherical leading edges, the
$C_{D}$
of 0.4, as applicable to hemispherical leading edges, the
 $\unicode[STIX]{x1D6FD}$
parameter with a characteristic length equal to the expansion surface length is found to be 2.1 for the blunt case. This indicates that the flow development is dictated by viscous interactions, which is possibly the case when the leading-edge shock is still an attached one as shown in figure 6(b).
$\unicode[STIX]{x1D6FD}$
parameter with a characteristic length equal to the expansion surface length is found to be 2.1 for the blunt case. This indicates that the flow development is dictated by viscous interactions, which is possibly the case when the leading-edge shock is still an attached one as shown in figure 6(b). Even though the flow is dominated by viscous effects at the leading edge, the introduction of a finite bluntness plays a role in shaping the viscous interactions that determine the boundary layer growth and its separation. This is the reason behind the differences in the behaviour close to the leading edge between the two models. Compared to a sharp case, the
 $20~\unicode[STIX]{x03BC}\text{m}$
leading-edge shock is stronger, and this generates a stronger entropy gradient in the shock layer. However, the strongest entropy changes in the surface-normal direction are not large enough to completely submerge the boundary layer, contrary to bluntness-dominated flows such as behind a detached bow shock that typically sits in front of significantly blunted leading edges. Since the leading-edge shock attenuates rapidly away from the surface for the bluntness considered here, the stronger entropy region would then be confined much closer to the surface. This causes the initial part of the streamwise boundary layer growth in the vicinity of the merged layer affected by the entropy gradient. The extent of entropy outside the boundary layer edge, within this region of its initial growth stage, facilitates a continuous energy transfer from the outer inviscid flow to lower layers of the boundary layer through viscous interactions. This transfer energises the lower part and, thereby, increases the resistance to adverse pressure gradients that initiate separation and results in a delayed separation for the blunt case, as shown in figure 7. A consequential effect of this energy input into the lower part of the boundary layer is reflected as a gradual reduction in gas velocity slip over the surface, after the leading-edge shock, for a blunt case as compared to the sharp case (see figure 13). Further downstream and away from the merged layer but well before separation, disturbances triggered by the region of strong surface-normal entropy generated by the leading-edge shock are fully consumed within the growing boundary layer. These disturbances within the boundary layer then accentuate viscous interactions with the surface and expedite the boundary layer growth (see figure 16).
$20~\unicode[STIX]{x03BC}\text{m}$
leading-edge shock is stronger, and this generates a stronger entropy gradient in the shock layer. However, the strongest entropy changes in the surface-normal direction are not large enough to completely submerge the boundary layer, contrary to bluntness-dominated flows such as behind a detached bow shock that typically sits in front of significantly blunted leading edges. Since the leading-edge shock attenuates rapidly away from the surface for the bluntness considered here, the stronger entropy region would then be confined much closer to the surface. This causes the initial part of the streamwise boundary layer growth in the vicinity of the merged layer affected by the entropy gradient. The extent of entropy outside the boundary layer edge, within this region of its initial growth stage, facilitates a continuous energy transfer from the outer inviscid flow to lower layers of the boundary layer through viscous interactions. This transfer energises the lower part and, thereby, increases the resistance to adverse pressure gradients that initiate separation and results in a delayed separation for the blunt case, as shown in figure 7. A consequential effect of this energy input into the lower part of the boundary layer is reflected as a gradual reduction in gas velocity slip over the surface, after the leading-edge shock, for a blunt case as compared to the sharp case (see figure 13). Further downstream and away from the merged layer but well before separation, disturbances triggered by the region of strong surface-normal entropy generated by the leading-edge shock are fully consumed within the growing boundary layer. These disturbances within the boundary layer then accentuate viscous interactions with the surface and expedite the boundary layer growth (see figure 16).
It is worthwhile at this stage to point out a possibility that can occur if the bluntness is increased further, but still within a viscous-dominated flow as per (3.2). The aforementioned energy transfer mechanism to the lower part of the boundary layer works well in situations where the flow outside the boundary layer is not significantly affected by the surface-normal entropy generated by the leading-edge shock. However, if the bluntness is increased, the leading-edge shock gets stronger and the effect of entropy would be stretched further outwards in the surface-normal direction. This then affects the flow outside the boundary layer edge. The resulting lower kinetic energy of the outer flow then cannot energise the lower part of the boundary layer as before. In such circumstances, even though the viscous interaction between the boundary layer and the outer inviscid flow is enhanced by a stronger entropy, the energy available for transfer from the outer flow to the lower part of the boundary layer is reduced. Thus, there is an overall reduction in flow kinetic energy within the boundary layer, which then makes it more prone to separation.
3.2.2 Heat flux
Surface heat-flux distributions for both sharp and blunt leading edges are shown in figure 8. Similar trends to surface pressure behaviour are seen in heat-flux data, for both sharp and blunt leading edges. From the leading edge, there is an initial sharp reduction, followed by a rise to a local maximum (indicated as max 1 in the inset). After the first local maximum, another sharp fall occurs and then a gradual reduction along the expansion surface until it starts to rise again to a second local maximum (indicated as max 2) just before the corner. Thereafter, it dips to a minimum at the corner and then starts to rise towards the peak along the compression surface. The effect of expansion waves from the triple point is reflected in the heat flux as a dip from the peak value. After that, it steadily decreases further downstream, implying the presence of a developing boundary layer.

Figure 8. Normalised heat-flux distribution along the surface.
Many DSMC-based hypersonic flow studies on shock–boundary layer interactions, such as over a two-dimensional flat plate–ramp model by Moss, Price & Chun (Reference Moss, Price and Chun1991), over a hollow cylinder–flare model by Markelov, Kudryavtsev & Ivanov (Reference Markelov, Kudryavtsev and Ivanov2000) and over a forward-facing step model by Leite & Santos (Reference Leite and Santos2014), have all shown a coincidence between the local rise in heat flux and separation. However, Leite & Santos (Reference Leite and Santos2014) point out the existence of multiple local peaks under situations when the primary recirculation region breaks down into secondary and tertiary vortices. In the case of a sharp leading edge, the presence of such a local rise in heat flux at separation is computationally shown and its existence explained from a molecular perspective in Prakash et al. (Reference Prakash, Gai and O’Byrne2018). The reason is due to a local confinement of molecules close to the surface at the separation location as a result of the local directional change of reverse-flow streamlines. The flow direction is changed from being parallel to the expansion surface, and flowing towards the location of separation, to being pulled away from the surface and turning parallel to the separated shear layer. Such a local confinement due to compression of turning streamlines results in a local increase in incident number flux to the surface, which manifests as a local rise in vorticity and temperature gradients on a macroscopic scale. This causes a local rise in heat flux to the surface. The prominence of this local rise depends on the kinetic energy of the reverse-flow streamlines close to the surface and the nature of the surface itself. For a diffuse surface with low wall-to-stagnation-temperature ratio (
 $T_{w}/T_{0}\ll 1$
) and full surface accommodation, as in the present cases, local peaks can be noticeable due to the larger relative difference in energy between that of incident molecules and those reflected with an energy corresponding to the cold wall temperature. A similar mechanism occurs close to the corner also as a result of the interaction between the streamlines of the primary and secondary vortices. This promotes a second local maximum in the heat flux and provides a further evidence about the existence of a secondary vortex at the corner.
$T_{w}/T_{0}\ll 1$
) and full surface accommodation, as in the present cases, local peaks can be noticeable due to the larger relative difference in energy between that of incident molecules and those reflected with an energy corresponding to the cold wall temperature. A similar mechanism occurs close to the corner also as a result of the interaction between the streamlines of the primary and secondary vortices. This promotes a second local maximum in the heat flux and provides a further evidence about the existence of a secondary vortex at the corner.
Owing to the combined effects of flow expansion and a weaker separation shock in the case of a sharp leading edge, the shear layer after separation possesses a higher kinetic energy relative to that of the blunt case. Therefore, the aforementioned confinement of molecules close to the separation gets a relieving effect due to the inertial pull from the shear layer to move away from the surface. This results in the first local maximum not coinciding with the separation location, but to occur slightly downstream for the sharp leading edge (see inset of figure 8). Owing to a stronger separation shock in the blunt case, this inertial effect is reduced. The occurrence of a local rise is then almost instantaneous with the separation location and similar to the trend observed over sharp leading-edge flat plates at zero angle of incidence (no flow expansion) in the studies of Moss et al. (Reference Moss, Price and Chun1991), Markelov et al. (Reference Markelov, Kudryavtsev and Ivanov2000) and Leite & Santos (Reference Leite and Santos2014).
The physical explanations behind the relatively delayed or downstream shift in separation, reattachment and peak as well as the smoothness and stretching of the peak for the blunt model are all similar to that explained for the pressure behaviour. However, there are some perceptible differences between the respective heat-flux distributions that can provide further physical insights into the flow development. The inset of figure 8 shows that the heat flux close to the leading edge is larger for the blunt case. With a very small molecular number flux prevailing in the close vicinity of the leading edge, the heat flux is dictated fully by the kinetic energy of incident molecules, as the contribution from reflected molecules is not significant here. Proceeding downstream from the leading edge, the incident number flux increases and, consequently, the fractional proportion of reflected molecules also increases. Thus, reflected molecules slowly start to impose their influence on the heat flux by carrying away more and more energy from the surface. This results in the initial reduction in heat flux for both models as the flow moves downstream from the leading edge. As explained in § 3.2.1, the viscous energy drain from outer flow instigated by the surface-normal entropy of a relatively stronger leading-edge shock for the blunt case energises the incident molecules in this region and thereby increases the total incident energy to the wall. The incident energy for the blunt case is affected by both the viscous energising effect and the overall downstream increase in the number flux. For a wall with full surface accommodation, the energy of each individual reflected molecule is solely dependent on the wall temperature. Therefore, the total reflected energy is dictated only by the reflected number flux and not by any viscous effects.
In a molecular sense, the entropy-generated viscous effects can be considered as a disturbance mechanism that augments the local collision rate. The collision rate (
 $\unicode[STIX]{x1D708}$
) in a dilute gas (Bird Reference Bird1994) is slightly modified here to get an expression for the rate of collision of molecules with the surface as follows:
$\unicode[STIX]{x1D708}$
) in a dilute gas (Bird Reference Bird1994) is slightly modified here to get an expression for the rate of collision of molecules with the surface as follows:
 $$\begin{eqnarray}\unicode[STIX]{x1D708}=\unicode[STIX]{x03C0}d^{2}n_{w}|c_{th}|,\end{eqnarray}$$
where
 $$\begin{eqnarray}|c_{th}|=\left(\frac{8}{3\unicode[STIX]{x03C0}}\right)^{1/2}\left(\frac{3kT_{ov}}{m}\right)^{1/2}.\end{eqnarray}$$
In (3.4) and (3.5),
 $d$
represents the average molecular diameter,
$d$
represents the average molecular diameter,
 $n_{w}$
the average number of particles hitting the wall,
$n_{w}$
the average number of particles hitting the wall,
 $c_{th}$
the mean thermal speed of the molecules,
$c_{th}$
the mean thermal speed of the molecules,
 $k$
the Boltzmann constant,
$k$
the Boltzmann constant,
 $m$
the average molecular mass and
$m$
the average molecular mass and
 $T_{ov}$
the overall gas kinetic temperature defined below in (3.6). Instead of using the mean relative velocity of colliding particles, as in the original equation of Bird (Reference Bird1994), the mean thermal speed has been used, as the surface is stationary and molecules then collide with the surface with a relative velocity equivalent to the mean thermal speed. Using (3.4), the molecular surface collision rate at a location downstream of the merged layer is found to be
$T_{ov}$
the overall gas kinetic temperature defined below in (3.6). Instead of using the mean relative velocity of colliding particles, as in the original equation of Bird (Reference Bird1994), the mean thermal speed has been used, as the surface is stationary and molecules then collide with the surface with a relative velocity equivalent to the mean thermal speed. Using (3.4), the molecular surface collision rate at a location downstream of the merged layer is found to be
 $3.70\times 10^{-5}~\text{s}^{-1}$
and
$3.70\times 10^{-5}~\text{s}^{-1}$
and
 $8.26\times 10^{-5}~\text{s}^{-1}$
for sharp and blunt models, respectively. The distribution of
$8.26\times 10^{-5}~\text{s}^{-1}$
for sharp and blunt models, respectively. The distribution of
 $n_{w}$
over the surface is shown in figure 9. The overall increase in the incident number flux is evident for the blunt case. This increase in incident flux results in higher heat flux over the blunt model. This also facilitates a gradual reduction in gas velocity over the surface, as the relatively larger number of higher-energy incident molecules travel a larger distance to dissipate their kinetic energy.
$n_{w}$
over the surface is shown in figure 9. The overall increase in the incident number flux is evident for the blunt case. This increase in incident flux results in higher heat flux over the blunt model. This also facilitates a gradual reduction in gas velocity over the surface, as the relatively larger number of higher-energy incident molecules travel a larger distance to dissipate their kinetic energy.

Figure 9. Average number of incident particles hitting the surface.
After separation and the sharp fall soon after, both trends exhibit a gradual reduction along the expansion surface before rising towards the second local maximum. However, the blunt case displays a slightly more irregular behaviour, indicating the presence of larger vorticity and temperature gradients close to the wall. These enhanced gradients absorb the kinetic energy of the reverse-flow streamlines as the flow moves towards separation. The reverse-flow boundary layer over the expansion surface is affected by the adverse pressure gradient as it moves towards the separation location and may not be able to overcome this pressure gradient. This can lead to small local separations that would then manifest as tertiary vortex structures, as shown in figure 14. The formation of additional vortices within the primary recirculation region redistributes the energy and, thereby, makes the local rise to the second maximum smoother and more gradual. In contrast, the rise is more abrupt and the local peak is sharper for a sharp leading edge, where such tertiary structures do not seem to be present.
Having discussed the relative differences between the results close to the leading edge, it is worthwhile to explore this region further. To this end, the most important parameter that influences the heat flux, i.e. the gas temperature close to the surface, is examined. To explain this, it is necessary to introduce the concept of an overall gas kinetic temperature in a thermally non-equilibrium gas. The sudden expansion of the test gas through a convergent–divergent nozzle results in a thermally non-equilibrium flow in the test section (Bray Reference Bray1959). This means that the internal energy modes – translational, rotational and vibrational – are not the same. In the present instance, the hypersonic free stream that is only in vibrational non-equilibrium (see table 1) is further expanded due to flow deflection over the model surface. This accentuates the level of non-equilibrium in the flow close to the surface after the leading edge. In such a situation, the commonly used thermodynamic temperature (or equilibrium temperature) loses its significance, and an overall gas non-equilibrium or kinetic temperature (
 $T_{ov}$
) should be used as defined by (Bird Reference Bird1994)
$T_{ov}$
) should be used as defined by (Bird Reference Bird1994)
 $$\begin{eqnarray}T_{ov}=\frac{\unicode[STIX]{x1D701}_{tr}T_{tr}+\unicode[STIX]{x1D701}_{rot}T_{rot}+\unicode[STIX]{x1D701}_{vib}T_{vib}}{\unicode[STIX]{x1D701}_{tr}+\unicode[STIX]{x1D701}_{rot}+\unicode[STIX]{x1D701}_{vib}},\end{eqnarray}$$
where
 $\unicode[STIX]{x1D701}$
is the (number of) degrees of freedom (DOF) and the subscripts
$\unicode[STIX]{x1D701}$
is the (number of) degrees of freedom (DOF) and the subscripts
 $tr$
,
$tr$
,
 $rot$
and
$rot$
and
 $vib$
indicate translational, rotational and vibrational modes, respectively.
$vib$
indicate translational, rotational and vibrational modes, respectively.
Both translational and rotational modes are fully excited (with three and two DOF, respectively) at the prevailing free-stream conditions, but the vibrational mode is only partially excited, as it requires temperatures of the order of the species’ characteristic vibrational temperature (
 $\unicode[STIX]{x1D703}_{vib}$
) to attain full excitation. However, a partially excited vibrational mode of each species can still contribute towards the overall kinetic temperature of the gas mixture. Based on Bird (Reference Bird1994), the effective vibrational DOF of a partially excited gas mixture can be determined by
$\unicode[STIX]{x1D703}_{vib}$
) to attain full excitation. However, a partially excited vibrational mode of each species can still contribute towards the overall kinetic temperature of the gas mixture. Based on Bird (Reference Bird1994), the effective vibrational DOF of a partially excited gas mixture can be determined by
 $$\begin{eqnarray}\displaystyle & \displaystyle \unicode[STIX]{x1D701}_{vib}=\frac{2\unicode[STIX]{x1D703}_{vib}/T_{vib}}{\exp (\unicode[STIX]{x1D703}_{vib}/T_{vib})-1}, & \displaystyle\end{eqnarray}$$
 $$\begin{eqnarray}\displaystyle & \displaystyle \frac{\unicode[STIX]{x1D703}_{vib}}{T_{vib}}=\mathop{\sum }_{i=1}^{sp}\unicode[STIX]{x1D71B}_{i}\left(\frac{\unicode[STIX]{x1D703}_{vib,i}}{T_{vib,i}}\right), & \displaystyle\end{eqnarray}$$
 $sp$
indicates each constituent species of the mixture. The overall gas properties are calculated based on mass fractions (
$sp$
indicates each constituent species of the mixture. The overall gas properties are calculated based on mass fractions (
 $\unicode[STIX]{x1D71B}$
) of individual species. Using (3.6), the overall kinetic gas temperature thus computed is shown in figure 10 for both models. For a better understanding and ease of explanation, several regions of interest are delineated in these plots.
$\unicode[STIX]{x1D71B}$
) of individual species. Using (3.6), the overall kinetic gas temperature thus computed is shown in figure 10 for both models. For a better understanding and ease of explanation, several regions of interest are delineated in these plots.

Figure 10. Temperature jump at the surface in the vicinity of the leading edge for (a) sharp and (b) blunt cases. Temperatures are normalised with respect to the wall temperature (
 $T_{w}=300$
K). The top scale shows the streamwise distance normalised by free-stream MFP.
$T_{w}=300$
K). The top scale shows the streamwise distance normalised by free-stream MFP.
Previous studies on hypersonic flow over flat plates with sharp leading edges and at zero angle of incidence (Moss et al.
Reference Moss, Price and Chun1991; Markelov et al.
Reference Markelov, Kudryavtsev and Ivanov2000; Babinsky & Harvey Reference Babinsky and Harvey2013) have highlighted the presence of a kinetic region close to the leading edge, followed by a merged layer and then the strong and weak viscous interaction regions. It is also shown that, close to the leading edge of flat plates within the kinetic region, surface parameters tend towards free-molecular limit values. However, the physical mechanism is slightly different in the present case due to the large negative angle of incidence to the incoming stream (
 $-30^{\circ }$
), which results in a very low incident number flux to the surface. Based on free-stream parameters, the non-dimensional incident number flux on the surface at this angle of incidence is found to be
$-30^{\circ }$
), which results in a very low incident number flux to the surface. Based on free-stream parameters, the non-dimensional incident number flux on the surface at this angle of incidence is found to be
 $1.257\times 10^{-5}$
(Prakash et al.
Reference Prakash, Gai and O’Byrne2018). It has been pointed out by Bird (Reference Bird1994) that the free-molecular theory loses its significance at such low levels of incident number fluxes and gas properties in the kinetic region would then be dictated solely by the kinetic energy of the incident molecules, even for a diffuse surface reflection condition. The diffuse part is stressed here due to the fact that, from a molecular perspective, even hypersonic streams can have upstream propagation of disturbance through the possibility of incident molecules on the surface to reflect back in a non-specular manner. In such a situation, when the intermolecular collisions are negligible, collisionless flow properties are calculated by a bimodal distribution of incident molecules at free-stream temperature and reflected molecules at a temperature corresponding to the wall for full surface accommodation as considered here. Such superpositions of streams with high relative velocity give rise to high kinetic temperatures in the close vicinity of the leading edge. This abrupt rise at the leading edge is clearly visible for the sharp leading-edge model in figure 10(a), within
$1.257\times 10^{-5}$
(Prakash et al.
Reference Prakash, Gai and O’Byrne2018). It has been pointed out by Bird (Reference Bird1994) that the free-molecular theory loses its significance at such low levels of incident number fluxes and gas properties in the kinetic region would then be dictated solely by the kinetic energy of the incident molecules, even for a diffuse surface reflection condition. The diffuse part is stressed here due to the fact that, from a molecular perspective, even hypersonic streams can have upstream propagation of disturbance through the possibility of incident molecules on the surface to reflect back in a non-specular manner. In such a situation, when the intermolecular collisions are negligible, collisionless flow properties are calculated by a bimodal distribution of incident molecules at free-stream temperature and reflected molecules at a temperature corresponding to the wall for full surface accommodation as considered here. Such superpositions of streams with high relative velocity give rise to high kinetic temperatures in the close vicinity of the leading edge. This abrupt rise at the leading edge is clearly visible for the sharp leading-edge model in figure 10(a), within
 $x/\unicode[STIX]{x1D706}_{\infty }=3$
–4.
$x/\unicode[STIX]{x1D706}_{\infty }=3$
–4.
As evident in figure 10, significant differences between the energy modes indicate that flow is in a state of full thermal non-equilibrium up to the separation location. The extent of the kinetic region for the present models is determined on the basis of characteristic behaviours of gas temperature and velocity at the wall. For a sharp leading edge, the flow within the kinetic region after the initial fall is characterised by a gradual rise in temperature. This is due to more and more particles interacting with the surface as the flow proceeds downstream. However, the rise is not steep due to the low incident number flux prevailing there. This is contrary to the steep rise shown for a flat plate with a sharp leading edge at zero angle of incidence (Moss et al. Reference Moss, Price and Chun1991). Similar to the flat plate, the rise continues until the start of the merged layer. The kinetic region of the blunt case is not a well-defined one. The leading-edge shock for the blunt case is stronger and located relatively closer to the leading edge. This is expected, as a further increase in bluntness would have resulted in the leading-edge shock detaching and forming a bow shock. However, it is still possible to discern a small region very close to the leading edge that shows a rise in temperature. In the case of flat plates, a steady reduction in temperature occurs after the beginning of the merged layer due to the continuous reduction in flow kinetic energy close to the wall. However, this is compensated to a great extent by flow expansion in the present models and, therefore, all the temperature modes remain approximately constant until the beginning of interaction of the pressure gradient from the corner. Thereafter, the upstream influence from separation strongly affects the molecular interaction and results in faster relaxation towards equilibrium. An interesting aspect to note is that the level of non-equilibrium is higher for the sharp case. This again shows the significance of the local entropy-induced viscous effects. These disturbances increase the local collision rate and, therefore, the level of non-equilibrium tends to be smaller for the blunt case.
An interesting feature observed in figure 10 is the close agreement of the vibrational temperature with the overall temperature. This gives the impression that the vibrational relaxation is occurring at a faster rate than the rotational relaxation. This cannot be physically true, as the relaxation process takes place through molecular collisions and consequential translational–rotational/vibrational energy exchange. As only very few collisions are needed for translation–rotational energy exchange, rotational temperature always equilibrates faster. Another notable feature in figure 10(a) is that, at the leading edge, the vibrational temperature has reduced to approximately 1200 K from a free-stream value of 2181 K. In addition, the vibrational temperature stays below the translational value all the way to equilibrium. The reason behind these characteristics is the significant dissociation of O
 $_{2}$
molecules to O atoms close to the leading edge (Babinsky & Harvey Reference Babinsky and Harvey2013). This is shown in figure 11.
$_{2}$
molecules to O atoms close to the leading edge (Babinsky & Harvey Reference Babinsky and Harvey2013). This is shown in figure 11.
Figure 11. Mass fraction of O atoms close to the sharp leading edge.
Since the vibrational temperature is frozen upstream of the leading edge (in the free stream), non-equilibrium at the leading edge is mainly manifested as a difference between translational and rotational temperatures. Close to the leading edge, dissociation brings down the vibrational temperature and it extends up to halfway between the beginning of the interaction (marked as
 $I$
) and the separation locations. Owing to the free-molecular nature of the flow within the kinetic region, the flow characteristic is very diffuse so that the rotational temperature lags far below the translational value as a consequence of reduced collision frequency and only reaches equilibrium once it reaches the near-continuum denser flow interaction and separation regions. Based on the empirical correlation of Millikan & White (Reference Millikan and White1963) for vibrational–translational energy exchange, it is found that the vibrational relaxation times in the region closer to the wall and within the merged layer are of the order of
$I$
) and the separation locations. Owing to the free-molecular nature of the flow within the kinetic region, the flow characteristic is very diffuse so that the rotational temperature lags far below the translational value as a consequence of reduced collision frequency and only reaches equilibrium once it reaches the near-continuum denser flow interaction and separation regions. Based on the empirical correlation of Millikan & White (Reference Millikan and White1963) for vibrational–translational energy exchange, it is found that the vibrational relaxation times in the region closer to the wall and within the merged layer are of the order of
 $O$
(10 ms), whereas the corresponding cell residential times are of the order of
$O$
(10 ms), whereas the corresponding cell residential times are of the order of
 $O$
(10 ns), which is based on velocity slip values and corresponding cell widths of the order of the free-stream MFP. This means that the vibration is essentially frozen, and changes in the vibrational temperature are brought about solely by the dissociation process. The vibrational temperature, after being reduced as a result of strong O
$O$
(10 ns), which is based on velocity slip values and corresponding cell widths of the order of the free-stream MFP. This means that the vibration is essentially frozen, and changes in the vibrational temperature are brought about solely by the dissociation process. The vibrational temperature, after being reduced as a result of strong O
 $_{2}$
dissociation at the leading edge, requires many more collisions in order to change and, therefore, should relax slowly compared to the translational temperature. However, figure 10(a) shows a steady reduction in vibrational temperature between the end of the kinetic region and the beginning of the interaction, wherein the translational temperature remains nearly constant. The expansion process reduces the collision rate in this region and, as a result, no significant energy exchange occurs between the translational and other internal energy modes. At the same time, dissociation instigates a steady reduction in vibrational temperature in this region. The dissociation of O
$_{2}$
dissociation at the leading edge, requires many more collisions in order to change and, therefore, should relax slowly compared to the translational temperature. However, figure 10(a) shows a steady reduction in vibrational temperature between the end of the kinetic region and the beginning of the interaction, wherein the translational temperature remains nearly constant. The expansion process reduces the collision rate in this region and, as a result, no significant energy exchange occurs between the translational and other internal energy modes. At the same time, dissociation instigates a steady reduction in vibrational temperature in this region. The dissociation of O
 $_{2}$
reduces as the flow moves towards separation, while the collision rate increases, and the vibrational relaxation starts to occur more gradually, as it should occur as a result of vibrational–translational energy exchange.
$_{2}$
reduces as the flow moves towards separation, while the collision rate increases, and the vibrational relaxation starts to occur more gradually, as it should occur as a result of vibrational–translational energy exchange.
3.2.3 Skin friction and gas velocity at the surface
These two surface parameters are discussed together so as to provide a better insight into discerning separation and reattachment locations on the surface. The traditional approach of identifying separation and reattachment as locations where the skin friction changes sign (positive to negative and vice versa) is not followed here. Rather, similar sign changes in the distribution of gas velocity at the surface (
 $u_{gw}$
), which in a molecular description corresponds to the average velocity of particles in the first layer of cells close to the surface, is chosen. The reason is as follows. In the continuum NS set of equations, shear stress is approximated as proportional to the first-order gradient of velocity and, therefore, it goes to zero at separation (and reattachment) as the velocity also goes to zero. In slip or transitional flow regimes, such linear first-order approximations become inadequate and higher-order terms become relevant. In DSMC, such higher-order effects are properly accounted for by computing the surface shear stress based on the overall tangential momentum difference between incident and reflected molecules in the first layer of cells. However, on a physical basis of momentum development, such inertial effects are felt only when the shear between fluid layers in a cell starts to be strongly altered by the adverse pressure gradient. Small perturbations in shear are masked in the overall momentum changes. On the other hand,
$u_{gw}$
), which in a molecular description corresponds to the average velocity of particles in the first layer of cells close to the surface, is chosen. The reason is as follows. In the continuum NS set of equations, shear stress is approximated as proportional to the first-order gradient of velocity and, therefore, it goes to zero at separation (and reattachment) as the velocity also goes to zero. In slip or transitional flow regimes, such linear first-order approximations become inadequate and higher-order terms become relevant. In DSMC, such higher-order effects are properly accounted for by computing the surface shear stress based on the overall tangential momentum difference between incident and reflected molecules in the first layer of cells. However, on a physical basis of momentum development, such inertial effects are felt only when the shear between fluid layers in a cell starts to be strongly altered by the adverse pressure gradient. Small perturbations in shear are masked in the overall momentum changes. On the other hand,
 $u_{gw}$
is based on the average directional flow of all particles in a cell, so that any change in flow direction is promptly reflected in its behaviour. In a well-separated flow, as in the present instance, differences between these two predictions of separation and reattachment based on
$u_{gw}$
is based on the average directional flow of all particles in a cell, so that any change in flow direction is promptly reflected in its behaviour. In a well-separated flow, as in the present instance, differences between these two predictions of separation and reattachment based on
 $C_{f}$
and
$C_{f}$
and
 $u_{gw}$
distributions are not very significant. However, in the case of incipient and small separated flows, such differences can be significant (Prakash, Gai & O’Byrne Reference Prakash, Gai and O’Byrne2015) and
$u_{gw}$
distributions are not very significant. However, in the case of incipient and small separated flows, such differences can be significant (Prakash, Gai & O’Byrne Reference Prakash, Gai and O’Byrne2015) and
 $u_{gw}$
might be a better or the only possible parameter to determine the existence and size of separation. The behaviours of
$u_{gw}$
might be a better or the only possible parameter to determine the existence and size of separation. The behaviours of
 $C_{f}$
and
$C_{f}$
and
 $u_{gw}$
over the surface are shown in figure 12.
$u_{gw}$
over the surface are shown in figure 12.

Figure 12. Surface characteristics of (a) skin friction coefficient and (b) gas velocity. Gas velocity at the surface is normalised with respect to the free-stream velocity (
 $u_{\infty }$
).
$u_{\infty }$
).
From the leading edge, a steep fall in both properties occurs up to the separation location (see insets in figure 12). The non-dimensional separation locations based on the
 $u_{gw}$
distribution are 0.052 and 0.07, respectively, for sharp and blunt leading edges. The corresponding locations based on
$u_{gw}$
distribution are 0.052 and 0.07, respectively, for sharp and blunt leading edges. The corresponding locations based on
 $C_{f}$
are 0.053 and 0.075, respectively. The prediction of reattachment locations, based on
$C_{f}$
are 0.053 and 0.075, respectively. The prediction of reattachment locations, based on
 $u_{gw}$
and
$u_{gw}$
and
 $C_{f}$
, are 2.715 and 2.716 for the sharp leading edge and 2.852 and 2.845 for the blunt leading edge. Thus, there is a good agreement in predictions of separation and reattachment from
$C_{f}$
, are 2.715 and 2.716 for the sharp leading edge and 2.852 and 2.845 for the blunt leading edge. Thus, there is a good agreement in predictions of separation and reattachment from
 $C_{f}$
and
$C_{f}$
and
 $u_{gw}$
, as expected in a well-separated flow.
$u_{gw}$
, as expected in a well-separated flow.
After separation, both
 $C_{f}$
and
$C_{f}$
and
 $u_{gw}$
stay negative due to the reverse flow in the recirculating region. Both change sign (
$u_{gw}$
stay negative due to the reverse flow in the recirculating region. Both change sign (
 $-$
to
$-$
to
 $+$
) close to the corner for the sharp case and midway along the expansion surface for the blunt case, indicating the formation of secondary vortices. Soon after the corner, the sign again changes (
$+$
) close to the corner for the sharp case and midway along the expansion surface for the blunt case, indicating the formation of secondary vortices. Soon after the corner, the sign again changes (
 $+$
to
$+$
to
 $-$
), indicating the downstream end of the secondary vortex. These effects are shown as insets in figure 12. Thereafter,
$-$
), indicating the downstream end of the secondary vortex. These effects are shown as insets in figure 12. Thereafter,
 $C_{f}$
steadily reduces to a minimum before starting to rise again just before reattachment, which is again represented by a change in sign (
$C_{f}$
steadily reduces to a minimum before starting to rise again just before reattachment, which is again represented by a change in sign (
 $-$
to
$-$
to
 $+$
). The two distinct local minima in
$+$
). The two distinct local minima in
 $C_{f}$
, one after separation and the other just before reattachment, are a characteristic of large-scale separation. The peak of
$C_{f}$
, one after separation and the other just before reattachment, are a characteristic of large-scale separation. The peak of
 $C_{f}$
exhibits a double-lobed structure, which has also been found in no-slip NS computations (Khraibut et al.
Reference Khraibut, Gai, Brown and Neely2017). At the same time,
$C_{f}$
exhibits a double-lobed structure, which has also been found in no-slip NS computations (Khraibut et al.
Reference Khraibut, Gai, Brown and Neely2017). At the same time,
 $u_{gw}$
is negative and stable after the corner and attains positive values after reattachment. It is interesting to note that, even after reattachment, there is some slip present. It has been commented by Bird (Reference Bird1994) that the slip velocity over the surface does not vanish completely but gradually reduces as the local flow-gradient-based Knudsen number (
$u_{gw}$
is negative and stable after the corner and attains positive values after reattachment. It is interesting to note that, even after reattachment, there is some slip present. It has been commented by Bird (Reference Bird1994) that the slip velocity over the surface does not vanish completely but gradually reduces as the local flow-gradient-based Knudsen number (
 $Kn_{grad}$
) attains values less than 0.01.
$Kn_{grad}$
) attains values less than 0.01.
There are some notable differences between the results. A few of these differences have already been addressed in §§ 3.2.1 and 3.2.2, such as the delay in separation and the downstream shift in reattachment and peak locations for the blunt leading edge. However, two unique characteristic differences between the models that show up in the
 $C_{f}$
and
$C_{f}$
and
 $u_{gw}$
distributions require further attention. Firstly, the magnitude of the local minimum just after separation is found to be larger for the sharp case. Secondly, with the sharp leading-edge case there is only a small secondary vortex in the close vicinity of the corner, whereas the blunt leading edge shows an extended secondary structure starting midway along the expansion surface and terminating just downstream of the corner. In order to ascertain the reasons for these differences, the behaviour of gas velocity at the surface close to the leading edge is examined.
$u_{gw}$
distributions require further attention. Firstly, the magnitude of the local minimum just after separation is found to be larger for the sharp case. Secondly, with the sharp leading-edge case there is only a small secondary vortex in the close vicinity of the corner, whereas the blunt leading edge shows an extended secondary structure starting midway along the expansion surface and terminating just downstream of the corner. In order to ascertain the reasons for these differences, the behaviour of gas velocity at the surface close to the leading edge is examined.
The
 $u_{gw}$
distribution close to the leading edge for both cases is shown in figure 13, with regions delineated based on the discussion of figure 10. Within the kinetic region, a sharp rise in the gas velocity is observed from the leading edge due to collisionless flow and the increasing number of molecules colliding with the surface as the flow proceeds downstream along the surface. The rise continues until the merged layer. Unlike on a flat plate at zero angle of incidence, here the boundary layer development occurs within a strong viscous interactive environment characterised by rarefaction and thermal non-equilibrium. This results in a non-Blasius type of boundary layer growth.
$u_{gw}$
distribution close to the leading edge for both cases is shown in figure 13, with regions delineated based on the discussion of figure 10. Within the kinetic region, a sharp rise in the gas velocity is observed from the leading edge due to collisionless flow and the increasing number of molecules colliding with the surface as the flow proceeds downstream along the surface. The rise continues until the merged layer. Unlike on a flat plate at zero angle of incidence, here the boundary layer development occurs within a strong viscous interactive environment characterised by rarefaction and thermal non-equilibrium. This results in a non-Blasius type of boundary layer growth.

Figure 13. Gas velocity at the surface close to the leading edge for (a) sharp and (b) blunt cases.
A notable feature in figure 13 is the difference in magnitudes of gas velocity at the tip. For a blunt leading edge, the origin (
 $x/x_{c}=0$
) is chosen at the start of the flat expansion surface. Therefore, for the blunt case, fluid layers would be locally accelerated by the surface curvature of the hemispherical tip before the origin. This results in the incident molecules possessing higher kinetic energy within the kinetic region. At the same time, the peak value attained at the end of the kinetic region is lower for a blunt case. This is due to the stronger leading-edge shock moving upstream and resulting in a reduction in the extent of the kinetic region, which then limits the total number of incident molecules eventually interacting with the surface within this collisionless region. After the kinetic region, there is a continuous fall in velocity towards zero at separation for the sharp case. As explained earlier, due to the viscous energised lower layers of the boundary layer, the reduction in gas velocity at the wall is relatively gradual for the blunt case from the end of the kinetic region to the beginning of interaction. As a result, the upstream influence is felt further downstream at
$x/x_{c}=0$
) is chosen at the start of the flat expansion surface. Therefore, for the blunt case, fluid layers would be locally accelerated by the surface curvature of the hemispherical tip before the origin. This results in the incident molecules possessing higher kinetic energy within the kinetic region. At the same time, the peak value attained at the end of the kinetic region is lower for a blunt case. This is due to the stronger leading-edge shock moving upstream and resulting in a reduction in the extent of the kinetic region, which then limits the total number of incident molecules eventually interacting with the surface within this collisionless region. After the kinetic region, there is a continuous fall in velocity towards zero at separation for the sharp case. As explained earlier, due to the viscous energised lower layers of the boundary layer, the reduction in gas velocity at the wall is relatively gradual for the blunt case from the end of the kinetic region to the beginning of interaction. As a result, the upstream influence is felt further downstream at
 $x/x_{c}=0.035$
, compared to
$x/x_{c}=0.035$
, compared to
 $x/x_{c}=0.025$
for the sharp leading edge. Even after the beginning of interaction, the overall energy increase in the boundary layer for a blunt leading edge offers larger resistance to the adverse pressure gradient and it starts to be seriously affected only after
$x/x_{c}=0.025$
for the sharp leading edge. Even after the beginning of interaction, the overall energy increase in the boundary layer for a blunt leading edge offers larger resistance to the adverse pressure gradient and it starts to be seriously affected only after
 $x/x_{c}=0.045$
. This results in delayed separation at
$x/x_{c}=0.045$
. This results in delayed separation at
 $x/x_{c}=0.07$
for the blunt leading edge (figure 12).
$x/x_{c}=0.07$
for the blunt leading edge (figure 12).
As explained previously, the strong entropy gradient region of the leading-edge shock extends only a small distance in the surface-normal direction and, therefore, generated disturbances get submerged progressively within the boundary layer as it grows. This results in a thicker boundary layer for the blunt case, as evidenced by the profile plots in figure 16(a) and 16(b). The thicker boundary layer at separation results in a stronger separation shock. The energy of the shear layer after separation is determined by the strength of the separation shock through which it traverses. The energy of the dividing streamline and layers close to it will be lower as they pass through a stronger separation shock, relative to a weaker separation shock in the sharp leading-edge case. The formation and evolution of the primary recirculation region is solely dependent on the energy supply from the outer inviscid flow through the shear layer. Therefore, when the shear layer is at a lower energy as a result of a stronger separation shock, less energy would be available to impart to the recirculation region. The outer streamlines of the primary recirculation region then attain a lower energy for the blunt case relative to the sharp case. These outer layers eventually flow closer to the surface by first turning parallel to the compression surface and then moving parallel to the expansion surface and towards separation. Reverse-flow streamlines encounter shear from the surface as well as adverse pressure from the corner and this can only be overcome by possessing a higher kinetic energy in the streamlines. So, the primary recirculation region of the blunt case with lower kinetic energy would result in breakdown of the primary recirculation into secondary and tertiary structures. On the contrary, the reverse-flow streamlines of the sharp case will have sufficient energy to overcome the shear and as a result the primary recirculation region is more stable. This higher energy is signified as larger negative values of
 $u_{gw}$
after separation for a sharp case relative to the blunt case in figure 12(b). The expansion of the secondary vortex at the corner and the breakdown of the primary recirculation region over the expansion surface to form tertiary vortex structures is illustrated in figure 14(b) for the blunt case.
$u_{gw}$
after separation for a sharp case relative to the blunt case in figure 12(b). The expansion of the secondary vortex at the corner and the breakdown of the primary recirculation region over the expansion surface to form tertiary vortex structures is illustrated in figure 14(b) for the blunt case.

Figure 14. Streamlines superimposed on translational temperature contours for (a) sharp and (b) blunt cases. Separation and reattachment shocks are traced as dashed lines for better visualisation. A zoomed view of the secondary vortex is also shown.
3.3 Flow-field characteristics
The spatial distribution of flow properties can provide details about the prevailing flow structures and fluid dynamic interactions behind the formation as well as the evolution of these structures. The spatial features of interest here are streamlines, vorticity and local profiles of velocity, pressure and temperature.
3.3.1 Streamlines
Flow streamlines superimposed on the distribution of translational temperature are shown in figure 14 for both models. For better visualisation of the primary recirculation region, the domain is limited to the start of the reattachment shock. The propagation of the separation shock can be seen until it interacts with the reattachment shock, which starts slightly downstream of the reattachment. A triple point is formed by this interaction of separation and reattachment shocks (Edney type VI interaction), resulting in the emanation of expansion wavelets that impinge on the surface and cause the local reduction in surface parameters as discussed previously.
The most interesting aspect in streamline patterns is the structure of secondary and tertiary vortex formations. Only a single secondary vortex that is confined within the close vicinity of the corner is present for the sharp case. The blunt case not only has an expanded secondary vortex but also multiple tertiary vortex structures. In the direction of reverse flow, tertiary structures seem to develop gradually along the expansion surface. It originates as a trail of irregular structures starting just before the secondary vortex on the expansion surface and evolving into a pronounced shape halfway from the leading edge. The local changes in flow directions as a characteristic of these flow structures are well reflected in the behaviour of
 $C_{f}$
and
$C_{f}$
and
 $u_{gw}$
(see figure 12). It has been mentioned that the reason behind the formation of additional vortex structures in a blunt case, contrary to the sharp case, is due to lower flow energy of recirculation streamlines. It is, therefore, unable to overcome the shear at the wall and the adverse pressure from separation, thereby breaking down into smaller structures that characterise local separations. The flow mechanism that instigates such a reduction in reverse-flow energy will become apparent in the next section.
$u_{gw}$
(see figure 12). It has been mentioned that the reason behind the formation of additional vortex structures in a blunt case, contrary to the sharp case, is due to lower flow energy of recirculation streamlines. It is, therefore, unable to overcome the shear at the wall and the adverse pressure from separation, thereby breaking down into smaller structures that characterise local separations. The flow mechanism that instigates such a reduction in reverse-flow energy will become apparent in the next section.
3.3.2 Vorticity
The vorticity distribution provides a better insight into the dissipative viscous energy transfer mechanism prevailing in the domain and is shown in figure 15.

Figure 15. Vorticity distribution for (a) sharp and (b) blunt cases.
The shear layer forms a large vorticity sheet (of negative magnitude) between separation and reattachment. The primary recirculation region draws energy from the outer inviscid flow through this vorticity sheet. The outer streamlines of the primary recirculation region gain the maximum energy before the vorticity is continually reduced in the direction of the vortex core. However, the intensity of this energy transfer from the inviscid flow varies along the dividing streamline. A higher rate of energy transfer occurs at two locations: close to separation and at reattachment. Vorticity is high (of positive magnitude) in these locations due to the compression created by turning streamlines. Close to reattachment, this is also amplified by the growth of a reverse-flow boundary layer. These high-vorticity regions facilitate a higher rate of energy transfer from the inviscid side. Referring to figure 15(b), less energy would be available for infusing into recirculation streamlines from an outer flow that traverses a stronger separation shock as in the case of a blunt leading edge and, therefore, the total energy received by the recirculation region will be lower. The lower energy results in a faster dissipation due to shear from the wall as the reverse streamlines flow towards the corner from the reattachment. This is shown in figure 15(b), in which the large positive vorticity is seen to be dissipating as it approaches the corner. Meanwhile, this dissipation occurs very close to the corner for the sharp case, in which the reverse streamlines possess higher resistance against both shear from the wall and the adverse pressure from the corner. The dissipation effects are nothing but an energy feeding mechanism into the secondary vortex. Therefore, faster dissipation in the blunt case leads to an enhancement of the secondary structure.
In the blunt case, a large part of the reverse-flow energy is dissipated into the secondary structure and not much is left for the flow that proceeds over to the expansion surface. These streamlines will then not be able to overcome the shear over the expansion surface and result in breaking down into smaller tertiary vortices. For the sharp case, on the other hand, dissipative effects are smaller and therefore energy is carried to streamlines that proceed over to the expansion surface. Therefore, the reverse flow close to the surface has sufficient strength to withstand the shear and adverse pressure gradient from separation.
3.3.3 Flow profiles
It is interesting to examine the profiles of various flow parameters to analyse the spatial evolution of the flow. The chosen locations are at the beginning of interaction, at separation, at the corner and at reattachment. Firstly, let us examine the velocity profiles at these locations as shown in figure 16.

Figure 16. Velocity profiles at (a) beginning of interaction, (b) separation, (c) corner and (d) reattachment.
Profiles at the beginning of interaction and separation exhibit significant differences between the cases. At the corner and at reattachment, relative variations are small and are expected due to the slight increase in the overall size of the respective recirculation regions and the resultant downstream shift in the reattachment location. At the beginning of the interaction, the gas velocity at the wall has a magnitude corresponding to approximately 15 % of the free-stream velocity for both cases. The boundary layer appears to be fuller for the sharp case. Typically, a fuller boundary layer possesses larger velocities close to the surface and a thinner subsonic layer, which reduces the upstream influence from adverse pressure gradients (Babinsky & Harvey Reference Babinsky and Harvey2013). This implies that the sharp leading edge should provide higher resistance to separation, but this is not the case seen here. The blunt leading edge with a less full profile is shown to have separation occurring further downstream than for the sharp case. The reason for this is the energising of the lower layers of the boundary layer due to viscous effects infused into the initial part of the boundary layer growth by a stronger leading-edge shock. This is reflected in the behaviour of surface-normal velocity gradients (
 $\unicode[STIX]{x2202}u/\unicode[STIX]{x2202}s_{n}$
) within a non-dimensional surface-normal distance of approximately 0.01 at the beginning of interaction. In this region, the gradients are larger for the blunt case but reduce further away from the surface, as the viscous effects then stimulate boundary layer thickening, which results in a thicker and less full profile. The profiles at separation also show a similar trend in the surface-normal velocity gradient within this distance. This gives the blunt leading edge higher resistance against separation even with an overall less full boundary layer growth. A thicker boundary layer at separation also leads to a stronger separation shock.
$\unicode[STIX]{x2202}u/\unicode[STIX]{x2202}s_{n}$
) within a non-dimensional surface-normal distance of approximately 0.01 at the beginning of interaction. In this region, the gradients are larger for the blunt case but reduce further away from the surface, as the viscous effects then stimulate boundary layer thickening, which results in a thicker and less full profile. The profiles at separation also show a similar trend in the surface-normal velocity gradient within this distance. This gives the blunt leading edge higher resistance against separation even with an overall less full boundary layer growth. A thicker boundary layer at separation also leads to a stronger separation shock.
The comparison of pressure profiles at these locations is shown in figure 17. The pressure is not constant across the developing boundary layer from the leading edge to separation. The boundary layer growth leading to separation is affected by expansion and rarefaction, which results in a non-Blasius type of development. The pressure profiles are consistent with velocity profiles in that the blunt leading edge shows higher pressures corresponding to less full boundary layers at the beginning of interaction and separation. The larger bumps in pressure for the blunt leading edge indicate a stronger leading-edge shock. As observed in the velocity profile at the beginning of interaction, the surface-normal pressure gradients (
 $\unicode[STIX]{x2202}p/\unicode[STIX]{x2202}s_{n}$
) within a non-dimensional surface-normal distance of approximately 0.01 is smaller for the blunt leading edge and consistent with the higher surface-normal velocity gradients observed in this region. At the corner and at reattachment, the profiles for both cases are qualitatively the same but the magnitude is higher for the blunt case. This is due to the lower overall velocity in the recirculation region that consists of primary, secondary and tertiary vortex structures.
$\unicode[STIX]{x2202}p/\unicode[STIX]{x2202}s_{n}$
) within a non-dimensional surface-normal distance of approximately 0.01 is smaller for the blunt leading edge and consistent with the higher surface-normal velocity gradients observed in this region. At the corner and at reattachment, the profiles for both cases are qualitatively the same but the magnitude is higher for the blunt case. This is due to the lower overall velocity in the recirculation region that consists of primary, secondary and tertiary vortex structures.
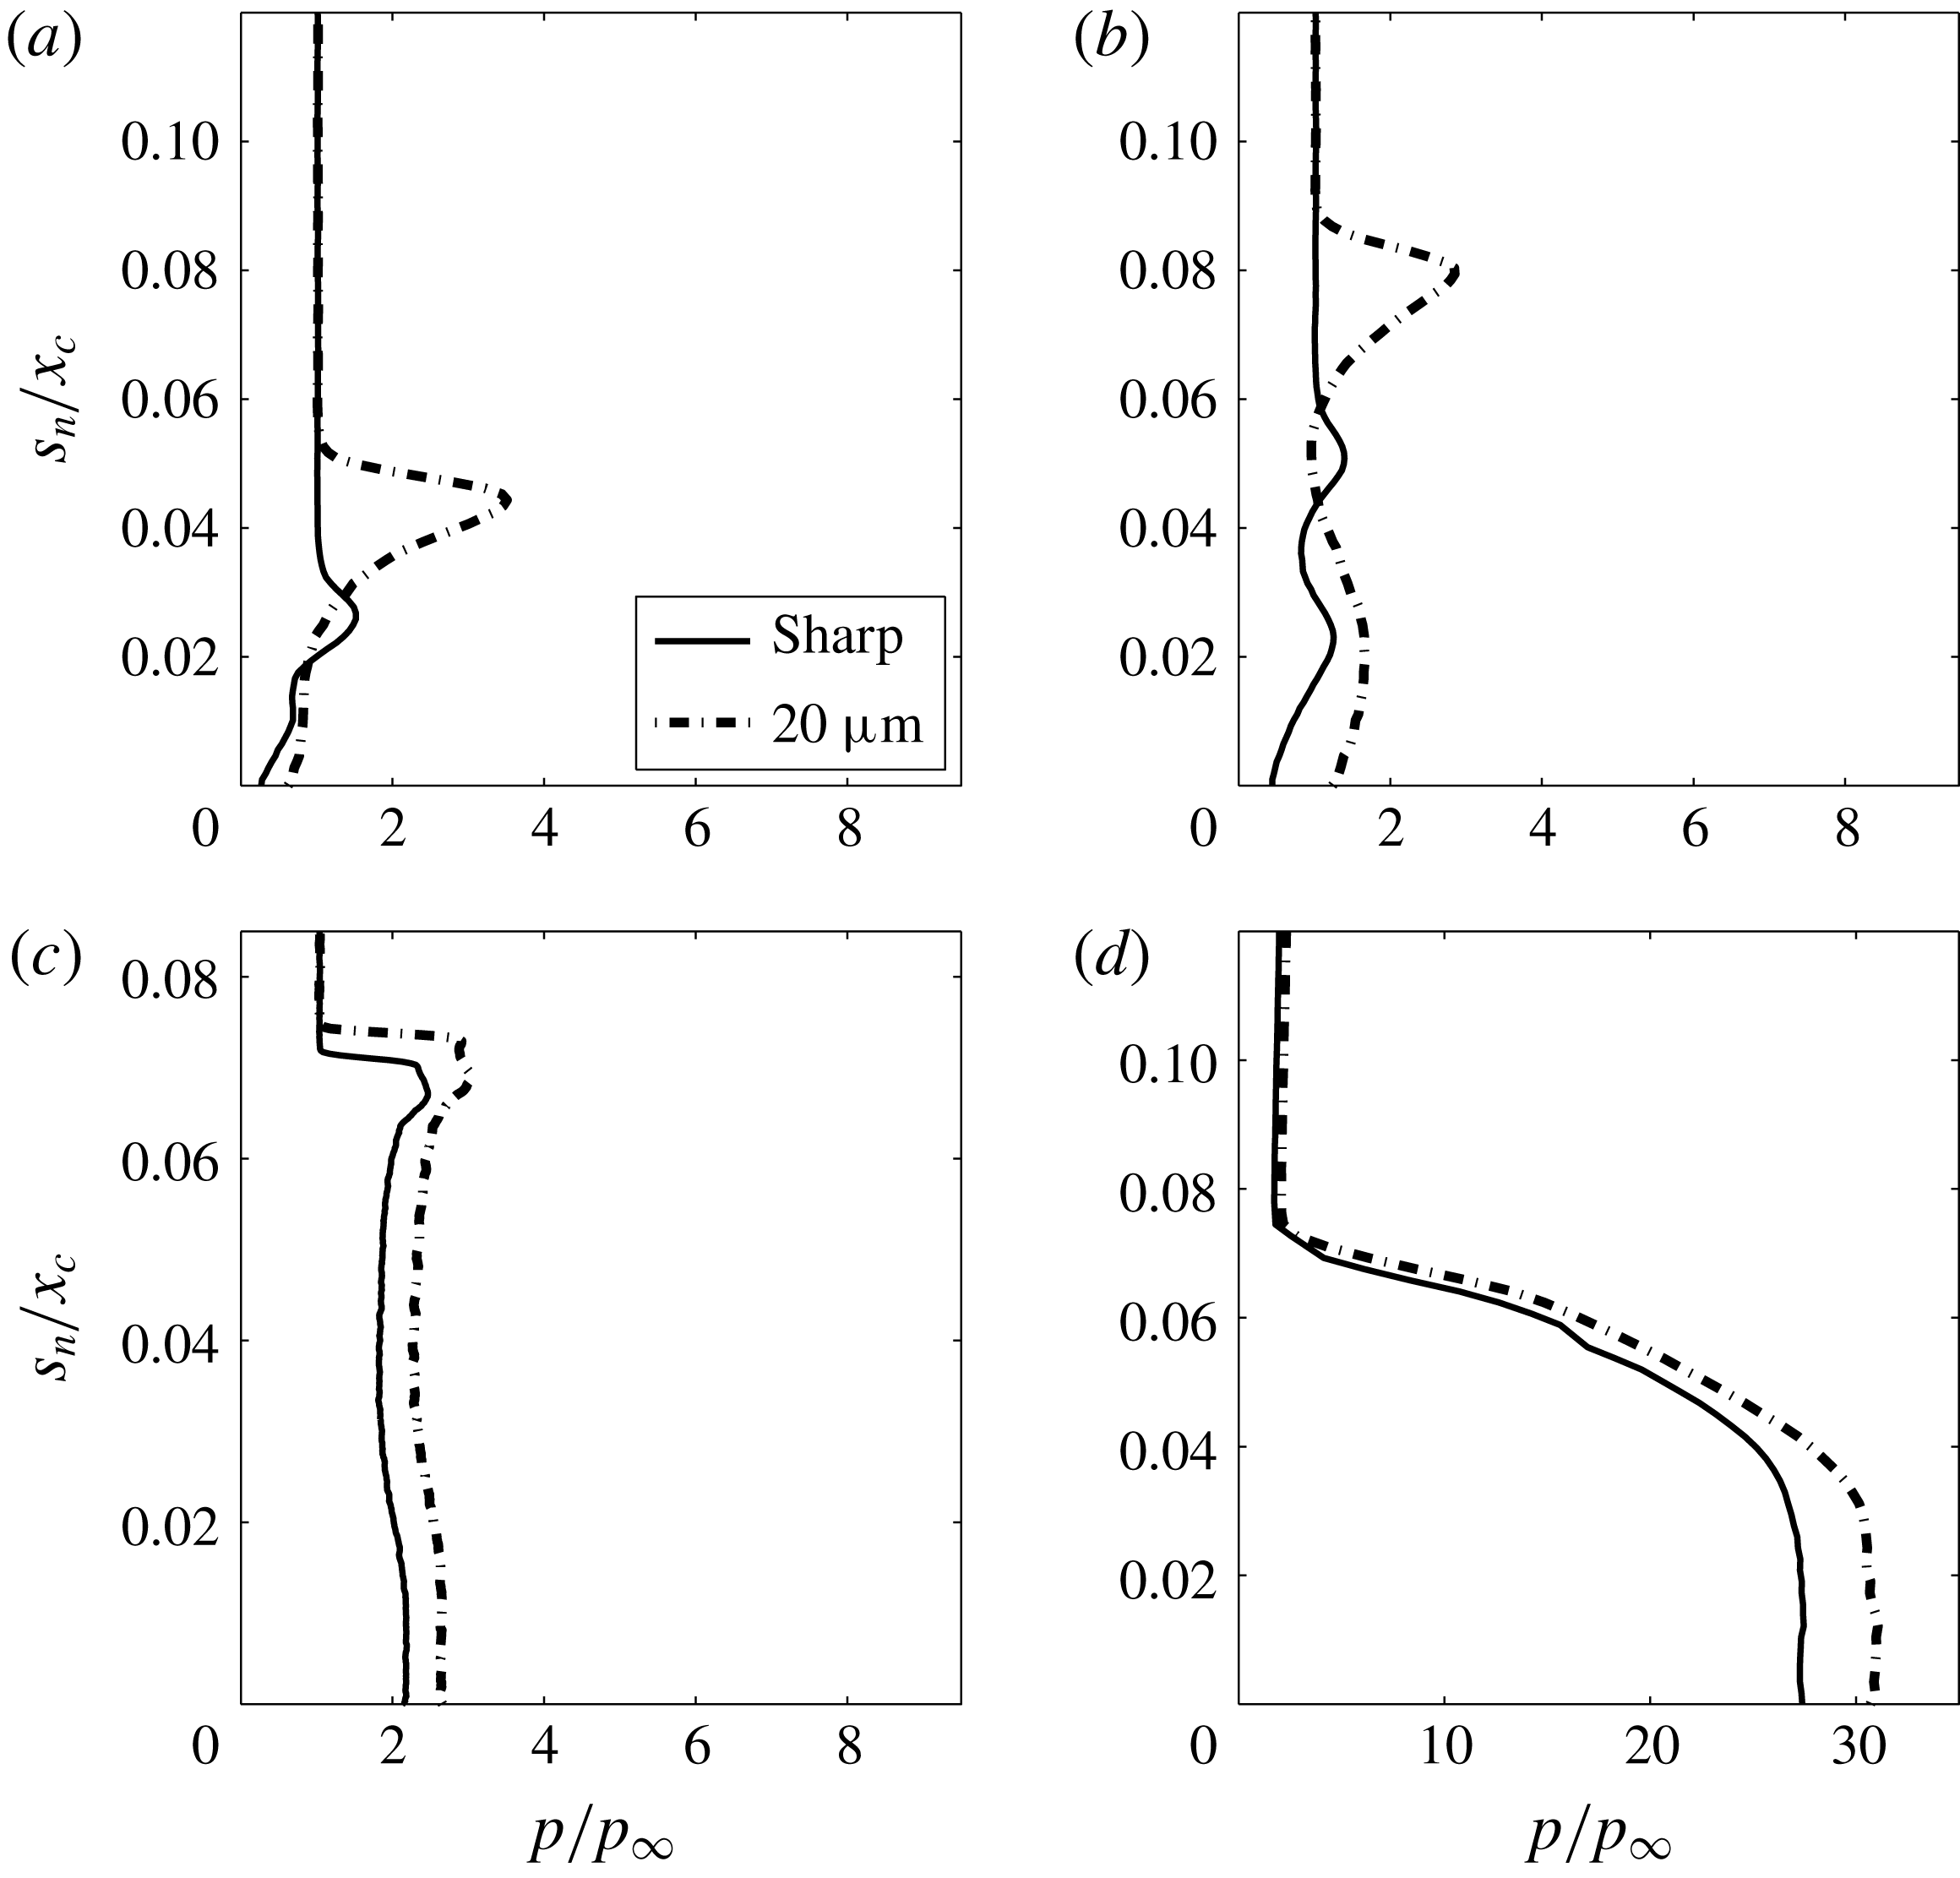
Figure 17. Pressure profiles at (a) beginning of interaction, (b) separation, (c) corner and (d) reattachment.
Similar to velocity and pressure, significant differences between temperature profiles are limited to the beginning of interaction and separation, as shown in figure 18. At the beginning of interaction, the temperature jump at the wall is 35 % lower for the blunt leading edge relative to the sharp case. At separation, it is only 18 % lower. Owing to the entropy generated by a stronger leading-edge shock in the blunt case, higher collisional interactions occur between molecules and the surface, as discussed in § 3.2.2 based on (3.4). The temperature jump, which is the average temperature of molecules in the first layer of cells close to the surface, is a resultant of the net contribution of heat imparted to the surface by the incoming molecules and that carried away from the surface by the reflected molecules. Such higher interactions between the incoming molecules and that of reflected molecules from the surface with an energy corresponding to the wall temperature result in the gas temperature jump being smaller for the blunt case relative to the sharp case. The entropy-enhanced viscous interactions for the blunt case push the location of the maximum in temperature further away from the surface and also make it smoother as well as wider. This makes the thermal boundary layer thicker for the blunt case. The differences are insignificant for the profiles at the corner and reattachment.

Figure 18. Temperature profiles at (a) beginning of interaction, (b) separation, (c) corner and (d) reattachment.
4 Theoretical analysis
Theoretical analysis is imperative to ascertain the reasons for particular numerical or experimental results by comparing existing applicable theories to the problem at hand. However, in light of the nonlinearities involved in hypersonic separated flows and the aptness of approximations made in developing theoretical relations, this may not always be possible. Nevertheless, even in highly nonlinear problems, comparison with theory can still be important, as it could pave the way towards a more comprehensive fluid dynamic understanding.
As a precursor to the theoretical analysis carried out in this section, profiles of velocity and temperature for the sharp leading edge at the beginning of interaction and separation were compared against semi-theoretical profiles in Prakash et al. (Reference Prakash, Gai and O’Byrne2018). With the conservative no-slip and no-jump conditions at the wall, Cohen & Reshotko (Reference Cohen and Reshotko1956) developed a theoretical self-similar boundary layer concept that is also applicable to boundary layers at separation. By replacing the conservative boundary conditions with slip as well as jump conditions obtained from computations, and by solving the resulting equations, semi-theoretical profiles have been obtained and compared against the computed profiles. The interesting theoretical part in the present work is not the boundary layer but the separated shear layer. For that, the theoretical analysis proposed by Baum et al. (Reference Baum, King and Deninson1964) is considered here. The approach followed will be similar to that in Prakash et al. (Reference Prakash, Gai and O’Byrne2018) and the objective is to obtain semi-theoretical profiles to compare against the corresponding numerical and experimental counterparts.
Using a Blasius profile for velocity and the Crocco integral relation for enthalpy as initial conditions, Baum et al. (Reference Baum, King and Deninson1964) obtained the following set of equations for momentum and energy:
 $$\begin{eqnarray}\displaystyle & \displaystyle u^{\ast }\left(\frac{\unicode[STIX]{x2202}F}{\unicode[STIX]{x2202}S^{\ast }}\right)=F^{2}\left(\frac{\unicode[STIX]{x2202}^{2}F}{\unicode[STIX]{x2202}u^{\ast ^{2}}}\right), & \displaystyle\end{eqnarray}$$
 $$\begin{eqnarray}\displaystyle & \displaystyle u^{\ast }\left(\frac{\unicode[STIX]{x2202}H}{\unicode[STIX]{x2202}S^{\ast }}\right)=F^{2}\left(\frac{\unicode[STIX]{x2202}^{2}H}{\unicode[STIX]{x2202}u^{\ast ^{2}}}\right), & \displaystyle\end{eqnarray}$$
 $$\begin{eqnarray}\displaystyle & \displaystyle u^{\ast }=\frac{u}{u_{e}}, & \displaystyle\end{eqnarray}$$
 $$\begin{eqnarray}\displaystyle & \displaystyle S=\int _{0}^{x}C_{w}\unicode[STIX]{x1D70C}_{e}u_{e}\unicode[STIX]{x1D707}_{e}\,\text{d}x, & \displaystyle\end{eqnarray}$$
 $$\begin{eqnarray}\displaystyle & \displaystyle S_{w}=\int _{0}^{s_{p}}C_{w}\unicode[STIX]{x1D70C}_{e}u_{e}\unicode[STIX]{x1D707}_{e}\,\text{d}s_{p}, & \displaystyle\end{eqnarray}$$
 $$\begin{eqnarray}\displaystyle & \displaystyle S^{\ast }=\frac{S}{S_{w}}, & \displaystyle\end{eqnarray}$$
 $$\begin{eqnarray}\displaystyle & \displaystyle C_{w}=\frac{\unicode[STIX]{x1D707}_{w}\unicode[STIX]{x1D70C}_{w}}{\unicode[STIX]{x1D707}_{e}\unicode[STIX]{x1D70C}_{e}}, & \displaystyle\end{eqnarray}$$
 $$\begin{eqnarray}\displaystyle & \displaystyle Y=u_{e}\unicode[STIX]{x1D70C}_{e}\int _{0}^{y}\frac{\unicode[STIX]{x1D70C}}{\unicode[STIX]{x1D70C}_{e}}\,\text{d}y, & \displaystyle\end{eqnarray}$$
 $$\begin{eqnarray}\displaystyle & \displaystyle F=\frac{\unicode[STIX]{x2202}u^{\ast }}{\unicode[STIX]{x2202}Y}S_{w}^{1/2}. & \displaystyle\end{eqnarray}$$
 $e$
and
$e$
and
 $w$
indicate values at the edge of the boundary layer and at the wall, respectively;
$w$
indicate values at the edge of the boundary layer and at the wall, respectively;
 $F(S^{\ast },u^{\ast })$
is the shear function;
$F(S^{\ast },u^{\ast })$
is the shear function;
 $H(S^{\ast },u^{\ast })$
is the total enthalpy;
$H(S^{\ast },u^{\ast })$
is the total enthalpy;
 $S$
is the reduced streamwise distance measured from the separation point;
$S$
is the reduced streamwise distance measured from the separation point;
 $C$
is the Chapman–Rubesin constant; and
$C$
is the Chapman–Rubesin constant; and
 $Y$
is the transformed normal distance. The streamwise and normal coordinates are measured from the location of separation (
$Y$
is the transformed normal distance. The streamwise and normal coordinates are measured from the location of separation (
 $x=0,y=0$
);
$x=0,y=0$
);
 $S_{w}$
is measured from the leading edge to separation along the wall; and
$S_{w}$
is measured from the leading edge to separation along the wall; and
 $s_{p}$
indicates the surface-parallel distance to separation.
$s_{p}$
indicates the surface-parallel distance to separation.In order to solve (4.1), boundary and initial conditions are required. Also, the boundary layer edge values must be known a priori. In typical flat-plate geometries at zero angle of incidence, the boundary layer edge values can be assumed to be equal to those of the undisturbed free stream as the leading-edge shock is weak. In the absence of any preceding flow expansion before separation, a Blasius boundary layer profile was chosen as the initial profile that undergoes separation in the shear layer analysis presented by Baum et al. (Reference Baum, King and Deninson1964). For the present case, it is obvious that the boundary layer edge is affected by flow expansion and thermal non-equilibrium, so the flow will be different. Therefore, profiles of velocity and enthalpy at separation that are obtained from computations are chosen as initial profiles. The boundary layer edge values needed in (4.2) are determined at the edge of these profiles. These are listed in table 2, along with wall properties for the blunt case. Similar properties are also extracted for the sharp case but not shown here.
Table 2. Boundary layer edge properties at separation for the blunt leading-edge case.

Following (3.7b
), static enthalpies at the boundary layer edge (
 $h_{e}$
) and wall (
$h_{e}$
) and wall (
 $h_{w}$
) are calculated based on local mass fractions of constituent species in the mixture using
$h_{w}$
) are calculated based on local mass fractions of constituent species in the mixture using
 $$\begin{eqnarray}\displaystyle & \displaystyle h_{e,w}=c_{p_{e,w}}T_{ov_{e,w}}, & \displaystyle\end{eqnarray}$$
 $$\begin{eqnarray}\displaystyle & \displaystyle c_{p_{e,w}}=\frac{R_{mix_{e,w}}}{1-\displaystyle \frac{1}{\unicode[STIX]{x1D6FE}_{e,w}}}, & \displaystyle\end{eqnarray}$$
 $$\begin{eqnarray}\displaystyle & \displaystyle R_{mix_{e,w}}=R_{u}\mathop{\sum }_{i=1}^{sp}\frac{\unicode[STIX]{x1D71B}_{i}}{MW_{i}}, & \displaystyle\end{eqnarray}$$
 $$\begin{eqnarray}\displaystyle & \displaystyle \unicode[STIX]{x1D6FE}_{e,w}=\frac{\unicode[STIX]{x1D701}_{tr_{e,w}}+\unicode[STIX]{x1D701}_{rot_{e,w}}+\unicode[STIX]{x1D701}_{vib_{e,w}}+2}{\unicode[STIX]{x1D701}_{tr_{e,w}}+\unicode[STIX]{x1D701}_{rot_{e,w}}+\unicode[STIX]{x1D701}_{vib_{e,w}}}, & \displaystyle\end{eqnarray}$$
 $R_{u}$
is the universal gas constant and
$R_{u}$
is the universal gas constant and
 $MW$
the molecular weight of each of the constituent species,
$MW$
the molecular weight of each of the constituent species,
 $i$
. The ratio of specific heats (
$i$
. The ratio of specific heats (
 $\unicode[STIX]{x1D6FE}$
) is calculated based on the excited degrees of freedom as per (3.6) and (3.7).
$\unicode[STIX]{x1D6FE}$
) is calculated based on the excited degrees of freedom as per (3.6) and (3.7). For viscosity (
 $\unicode[STIX]{x1D707}$
) in table 2, a power-law-based relationship with temperature is used as follows:
$\unicode[STIX]{x1D707}$
) in table 2, a power-law-based relationship with temperature is used as follows:
 $$\begin{eqnarray}\displaystyle & \displaystyle \unicode[STIX]{x1D707}_{e,w}=\unicode[STIX]{x1D707}_{ref}\left(\frac{T_{ov_{e,w}}}{T_{ref}}\right)^{\unicode[STIX]{x1D714}}, & \displaystyle\end{eqnarray}$$
 $$\begin{eqnarray}\displaystyle & \displaystyle \unicode[STIX]{x1D707}_{ref}=\frac{15\sqrt{\unicode[STIX]{x03C0}mkT_{ref}}}{2\unicode[STIX]{x03C0}d_{ref}^{2}(5-2\unicode[STIX]{x1D714})(7-2\unicode[STIX]{x1D714})}, & \displaystyle\end{eqnarray}$$
 $\unicode[STIX]{x1D714}$
) and diameter (
$\unicode[STIX]{x1D714}$
) and diameter (
 $d_{ref}$
) are based on a VHS model and adjusted based on species mass fractions (
$d_{ref}$
) are based on a VHS model and adjusted based on species mass fractions (
 $\unicode[STIX]{x1D71B}_{i}$
). These correspond to approximately 0.75 and
$\unicode[STIX]{x1D71B}_{i}$
). These correspond to approximately 0.75 and
 $4.14\times 10^{-10}$
m at a reference temperature (
$4.14\times 10^{-10}$
m at a reference temperature (
 $T_{ref}$
) of 273 K.
$T_{ref}$
) of 273 K.The momentum equation (4.1a ) is uncoupled from the energy equation so it can be solved immediately, with inner and outer edge boundary conditions as follows:
 $$\begin{eqnarray}\displaystyle F(S^{\ast },0)=0,\quad F(S^{\ast },1)=0. & & \displaystyle\end{eqnarray}$$
Using a second-order-accurate implicit finite difference scheme (Skeel & Berzins Reference Skeel and Berzins1990), calculations are performed with 500 mesh points for
 $u^{\ast }$
and 812 for
$u^{\ast }$
and 812 for
 $S^{\ast }$
. Doubling the mesh points produced negligible differences. Semi-theoretical profiles of shear function thus calculated are shown in figure 19 at various
$S^{\ast }$
. Doubling the mesh points produced negligible differences. Semi-theoretical profiles of shear function thus calculated are shown in figure 19 at various
 $S^{\ast }$
locations.
$S^{\ast }$
locations.

Figure 19. Shear function profiles at various
 $S^{\ast }$
locations for the non-similar leading-edge separation profile: (a) sharp and (b) blunt.
$S^{\ast }$
locations for the non-similar leading-edge separation profile: (a) sharp and (b) blunt.
As observed in figure 19, differences in shear between the models occur close to the separation location (at
 $S^{\ast }=0$
and 0.01), where the shear in the separated streamlines of the sharp case is higher than in the blunt case. This is consistent with the previous finding that the reverse-flow streamlines tend to possess higher velocity for the sharp case due to a relatively weaker separation shock. It is pointed out by Baum et al. (Reference Baum, King and Deninson1964) that an initial profile distortion that produces a fuller profile results in a greater rate of velocity buildup with distance along the dividing streamline. In the present instance, as evident in figure 16(b), a sharp leading edge results in a fuller profile relative to the blunt case. Therefore,
$S^{\ast }=0$
and 0.01), where the shear in the separated streamlines of the sharp case is higher than in the blunt case. This is consistent with the previous finding that the reverse-flow streamlines tend to possess higher velocity for the sharp case due to a relatively weaker separation shock. It is pointed out by Baum et al. (Reference Baum, King and Deninson1964) that an initial profile distortion that produces a fuller profile results in a greater rate of velocity buildup with distance along the dividing streamline. In the present instance, as evident in figure 16(b), a sharp leading edge results in a fuller profile relative to the blunt case. Therefore,
 $u^{\ast }$
along the dividing streamline grows at a higher rate for the sharp case.
$u^{\ast }$
along the dividing streamline grows at a higher rate for the sharp case.
For energy, equation (4.1b
) is coupled to the momentum equation. Also, the enthalpy at the core of the separated region (
 $H_{c}=H(S^{\ast },0)$
) is an unknown. In order to solve this, a method similar to that described in Baum et al. (Reference Baum, King and Deninson1964) is followed here by replacing
$H_{c}=H(S^{\ast },0)$
) is an unknown. In order to solve this, a method similar to that described in Baum et al. (Reference Baum, King and Deninson1964) is followed here by replacing
 $H$
with a non-dimensional enthalpy function
$H$
with a non-dimensional enthalpy function
 $W$
defined via
$W$
defined via
 $$\begin{eqnarray}\displaystyle H-H_{e}=(H_{w}-H_{e})W+(H_{c}-H_{e})(W-W_{0}), & & \displaystyle\end{eqnarray}$$
where
 $$\begin{eqnarray}\displaystyle W_{0}=(H-H_{e})/(H_{w}-H_{e}) & & \displaystyle\end{eqnarray}$$
is the initial enthalpy at separation (
 $S^{\ast }=0$
), which is taken as the numerical profile from figure 18(b). The boundary conditions in
$S^{\ast }=0$
), which is taken as the numerical profile from figure 18(b). The boundary conditions in
 $H$
now reformulated in terms of
$H$
now reformulated in terms of
 $W$
read as
$W$
read as
 $$\begin{eqnarray}\displaystyle W(S^{\ast },0)=0,\quad W(S^{\ast },1)=0. & & \displaystyle\end{eqnarray}$$
Calculations are then carried out similar to those for the shear function and the resulting non-dimensional enthalpy profiles are shown in figure 20. The enthalpy function shows that the shear layer of the blunt leading edge possesses a higher temperature. This is due to the stronger separation shock that is traversed by the streamlines in the shear layer.

Figure 20. Enthalpy function profiles at various
 $S^{\ast }$
locations for the non-similar leading-edge separation profile: (a) sharp and (b) blunt.
$S^{\ast }$
locations for the non-similar leading-edge separation profile: (a) sharp and (b) blunt.
The variation of the non-dimensional dividing streamline velocity for both cases is shown in figure 21. Initially, the buildup of
 $u_{d}^{\ast }$
is the same in both cases, but after
$u_{d}^{\ast }$
is the same in both cases, but after
 $S^{\ast }=10^{-2}$
, the velocity increases at a higher rate for the sharp case. In other words, a larger rate in
$S^{\ast }=10^{-2}$
, the velocity increases at a higher rate for the sharp case. In other words, a larger rate in
 $u^{\ast }$
buildup with
$u^{\ast }$
buildup with
 $S^{\ast }$
can also be interpreted as a larger rate of
$S^{\ast }$
can also be interpreted as a larger rate of
 $F^{\ast }$
buildup with
$F^{\ast }$
buildup with
 $S^{\ast }$
. This is evident in figure 19, in which the growth rate of shear (
$S^{\ast }$
. This is evident in figure 19, in which the growth rate of shear (
 $\text{d}F/\text{d}u^{\ast }$
) from the inner edge towards the dividing streamline is larger for the sharp case. The difference tends to be small beyond
$\text{d}F/\text{d}u^{\ast }$
) from the inner edge towards the dividing streamline is larger for the sharp case. The difference tends to be small beyond
 $S^{\ast }=10^{2}$
, when both profiles asymptotically approach the Chapman limit (
$S^{\ast }=10^{2}$
, when both profiles asymptotically approach the Chapman limit (
 $u_{d}^{\ast }=0.587$
). The evolution of dividing streamline velocities from initial non-similar profiles towards the asymptote shows that the Chapman limit is valid regardless of the initial conditions if the shear layer is allowed to develop fully.
$u_{d}^{\ast }=0.587$
). The evolution of dividing streamline velocities from initial non-similar profiles towards the asymptote shows that the Chapman limit is valid regardless of the initial conditions if the shear layer is allowed to develop fully.

Figure 21. Semi-theoretical dividing streamline velocity variation for non-similar leading-edge separation profiles.
Figure 22 shows the comparison between the dividing streamline velocity variation along the separated shear layer based on the semi-theoretical approach and its fully computational counterpart, both for the blunt leading edge. Several interesting features can be seen. Firstly, the rate of growth is faster with the computed profile although its evolution begins much later than the semi-theoretical profile. More importantly, after reaching a maximum at
 $u_{d}^{\ast }\approx 0.55$
, there is a steep drop towards zero at
$u_{d}^{\ast }\approx 0.55$
, there is a steep drop towards zero at
 $S^{\ast }\approx 10^{2}$
, which indicates reattachment. Thus, while the asymptote profile indicates reattachment at
$S^{\ast }\approx 10^{2}$
, which indicates reattachment. Thus, while the asymptote profile indicates reattachment at
 $S^{\ast }\rightarrow \infty$
, the actual reattachment process is far from asymptotic. It indicates that the process of reattachment is viscous-dominated and Reynolds-number-dependent unlike the Chapman isentropic reattachment. As Chapman’s theory is still the dominant analytical theory for separated flows, it is apparent from this analysis that it may not be as valid for hypersonic flows as it is for the high-Reynolds-number supersonic cases where it has traditionally been used.
$S^{\ast }\rightarrow \infty$
, the actual reattachment process is far from asymptotic. It indicates that the process of reattachment is viscous-dominated and Reynolds-number-dependent unlike the Chapman isentropic reattachment. As Chapman’s theory is still the dominant analytical theory for separated flows, it is apparent from this analysis that it may not be as valid for hypersonic flows as it is for the high-Reynolds-number supersonic cases where it has traditionally been used.

Figure 22. Comparison between computational and semi-theoretical dividing streamline velocity variations.
An estimate of the maximum
 $u_{d}^{\ast }$
can be made using the analysis of Messiter, Hough & Feo (Reference Messiter, Hough and Feo1973) based on the separating shear layer past a rearward-facing step in laminar supersonic flow. This gives the value of velocity on the dividing streamline prior to reattachment as
$u_{d}^{\ast }$
can be made using the analysis of Messiter, Hough & Feo (Reference Messiter, Hough and Feo1973) based on the separating shear layer past a rearward-facing step in laminar supersonic flow. This gives the value of velocity on the dividing streamline prior to reattachment as
 $$\begin{eqnarray}\displaystyle (u_{d}^{\ast })_{max}^{2}\sim 2a_{1}^{4/3}k_{0}^{5/3}\left(\frac{x_{f}}{L}\right)^{2/3}, & & \displaystyle\end{eqnarray}$$
where
 $a_{1}$
is the shear constant, which is 0.332 for a Blasius boundary layer,
$a_{1}$
is the shear constant, which is 0.332 for a Blasius boundary layer,
 $k_{0}$
is a positive constant,
$k_{0}$
is a positive constant,
 $x_{f}$
is the length of the shear layer and
$x_{f}$
is the length of the shear layer and
 $L$
is a characteristic dimension. Here we take the length of the expansion surface (0.02 m) as the characteristic dimension. Messiter et al. (Reference Messiter, Hough and Feo1973) determined the value of
$L$
is a characteristic dimension. Here we take the length of the expansion surface (0.02 m) as the characteristic dimension. Messiter et al. (Reference Messiter, Hough and Feo1973) determined the value of
 $k_{0}$
as
$k_{0}$
as
 $0.6\leqslant k_{0}\leqslant 0.73$
based on experimental and numerical data. The value of the shear constant, however, will be dependent on the velocity profile. For a non-Blasius developing boundary layer as in the present case, it will be different from 0.332, which is used by Messiter et al. (Reference Messiter, Hough and Feo1973). Instead, here we take the boundary layer properties at the beginning of interaction for the blunt leading edge and calculate the shear constant as
$0.6\leqslant k_{0}\leqslant 0.73$
based on experimental and numerical data. The value of the shear constant, however, will be dependent on the velocity profile. For a non-Blasius developing boundary layer as in the present case, it will be different from 0.332, which is used by Messiter et al. (Reference Messiter, Hough and Feo1973). Instead, here we take the boundary layer properties at the beginning of interaction for the blunt leading edge and calculate the shear constant as
 $$\begin{eqnarray}\displaystyle a_{1}=\frac{C_{f,i}}{2}\sqrt{Re_{i}}, & & \displaystyle\end{eqnarray}$$
where
 $C_{f,i}$
is the skin friction and
$C_{f,i}$
is the skin friction and
 $Re_{i}$
the Reynolds number based on boundary layer edge properties at the beginning of interaction. For
$Re_{i}$
the Reynolds number based on boundary layer edge properties at the beginning of interaction. For
 $Re_{i}$
, the characteristic length is chosen the same (
$Re_{i}$
, the characteristic length is chosen the same (
 $L$
) as in (4.8). This gives a value of 0.25 for the shear constant.
$L$
) as in (4.8). This gives a value of 0.25 for the shear constant.
Based on locations of separation (
 $x/x_{c}=0.07$
) and reattachment (
$x/x_{c}=0.07$
) and reattachment (
 $x/x_{c}=2.852$
), the streamwise length of the shear layer is found to be 0.048 m. For hypersonic flows, it is found that
$x/x_{c}=2.852$
), the streamwise length of the shear layer is found to be 0.048 m. For hypersonic flows, it is found that
 $k_{0}\leqslant 0.655$
(Gai Reference Gai2010). Putting these values into (4.8) results in a
$k_{0}\leqslant 0.655$
(Gai Reference Gai2010). Putting these values into (4.8) results in a
 $(u_{d}^{\ast })_{max}$
of 0.53. This agrees with the computed
$(u_{d}^{\ast })_{max}$
of 0.53. This agrees with the computed
 $(u_{d}^{\ast })_{max}$
of 0.55 as shown in figure 22.
$(u_{d}^{\ast })_{max}$
of 0.55 as shown in figure 22.
5 Experiments
This section gives details about experiments carried out as part of the present study. It starts with an overview of the experimental facility in § 5.1, including details of flow enthalpies and test times. Section 5.2 deals with heat-flux experiments, describing the preparation of TFGs, gauge calibration and post-processing of the heat-flux data. Section 5.3 explains similar aspects of flow visualisation experiments using PLIF.
5.1 Shock tunnel facility
Free-piston shock tunnels have been operating since the late 1960s (Stalker Reference Stalker1967) and are one of the primary facility types used for ground-based generation of high-enthalpy flow to simulate characteristics of hypersonic flight (Gai Reference Gai1992; Lu & Marren Reference Lu and Marren2002). Several large-scale free-piston shock tunnels have been constructed globally, which include facilities such as HIEST at the National Aerospace Laboratory in Kakuda, Japan (Takahashi et al. Reference Takahashi, Ueda, Komuro, Sato, Tanno and Itoh1999), HEG at the German Aerospace Centre in Gottingen, Germany (Eitelberg, McIntyre & Beck Reference Eitelberg, McIntyre and Beck1992), the T4 facility at the University of Queensland, Australia (Paull & Stalker Reference Paull and Stalker2001), and the T5 shock tunnel at Caltech in the USA (Hornung Reference Hornung, Sturtevant, Belanger, Sanderson, Brouillette and Jenkins1992). Smaller facilities have also been used in hypervelocity flow research, as these enable a shorter turnaround time, which is particularly advantageous when developing experimental techniques or carrying out measurements that require a considerable number of runs (O’Byrne Reference O’Byrne2002). However, their respective usable flow test time is limited compared to larger facilities.
The T-ADFA free-piston shock tunnel is a smaller-scale facility capable of generating flows with total enthalpies ranging from approximately 3 to
 $13~\text{MJ}~\text{kg}^{-1}$
, with a usable test time range of approximately
$13~\text{MJ}~\text{kg}^{-1}$
, with a usable test time range of approximately
 $550~\unicode[STIX]{x03BC}\text{s}$
to 1 ms, depending on the flow condition. T-ADFA consists of five sections, the partial dimensions and components of which are shown diagrammatically in a schematic of the facility provided in figure 23.
$550~\unicode[STIX]{x03BC}\text{s}$
to 1 ms, depending on the flow condition. T-ADFA consists of five sections, the partial dimensions and components of which are shown diagrammatically in a schematic of the facility provided in figure 23.

Figure 23. Schematic of the T-ADFA free-piston shock tunnel and details of the assembly.
The primary (steel) diaphragm initially separates the driver gas in the compression tube and the test gas in the shock tube. Air in the high-pressure reservoir accelerates the piston, which in turn compresses the driver gas in the compression tube. Once the primary diaphragm bursts due to the sudden compression of the driver gas by the piston, a shock wave is generated that travels along the shock tube towards the nozzle reservoir. It reflects back from the shock tube end and compresses the test gas at room temperature to the desired nozzle reservoir conditions. The shock speed and nozzle reservoir pressure are monitored using five pressure transducers (PTs) mounted along the length of the shock tube. At the desired nozzle reservoir conditions, the mylar diaphragm bursts and the compressed test gas expands through the nozzle.
Nozzle reservoir conditions are calculated using the code ESTC (McIntosh Reference McIntosh1968), which uses the shock speed, initial temperature and pressure of the shock tube and the thermochemical properties of the test gas as inputs to calculate the pressure, temperature and gas composition behind the reflected shock. Assuming an isentropic expansion, the gas is expanded until it matches the experimentally measured nozzle pressure. The resulting flow properties at the nozzle reservoir conditions are then supplied as inputs to the quasi-one-dimensional nozzle code STUBE (Vardavas Reference Vardavas1984), which calculates the nozzle expansion and the resulting free-stream conditions at the test section. This approach of obtaining free-stream conditions has been reported in the previous investigations of Palma (Reference Palma1999), O’Byrne (Reference O’Byrne2002) and Park (Reference Park2010). The free-stream conditions (see table 1) are not explicitly calculated in the present study but are taken from Kaseman (Reference Kaseman2017), who followed the same approach. Conditions given at a location 41 mm downstream of the nozzle exit are used, which is regarded as close to the location of the experimental model at 30 mm. Uncertainties at the chosen location in the test section are found to be within
 $\pm 15\,\%$
.
$\pm 15\,\%$
.
The surface measurements are recorded using a National Instruments (NI) PXI-1036 chassis with two NI PXI-6133 data acquisition cards, each having eight simultaneously sampled channels. The first card is used for pressure transducers and the second one for the heat-flux data acquisition. The system is triggered at the time of passage of the reflected shock over the nozzle reservoir pressure transducer by setting the trigger voltage level to 0.5 V (equivalent to 3.4 MPa) and with a pre-trigger sampling set at 5000 samples. This provided sufficient sampling data for determining the initial shock arrival at all the pressure transducers. The data sampling rate is set at 2.5 MHz, deemed sufficient to collect the sensor data of interest.
The steady-state flow establishment time can be determined from the nozzle pressure variation as shown in figure 24. The first overshoot in pressure indicates the arrival of the primary shock, and the time scale is shown as elapsed from this instant. The two legs of the reflected shock indicate a bifurcation of the shock foot, similar to that reported by Sanderson (Reference Sanderson1969) and Mallinson (Reference Mallinson1994). Soon after the passage of the second leg, the mylar diaphragm bursts and an unsteady expansion of the test gas through the nozzle occurs. A quasi-steady flow is achieved by an elapsed time of 0.5 ms. However, the flow takes a little longer to reach the leading edge, the time for which is determined based on the average primary-shock speed at the nozzle reservoir.

Figure 24. Nozzle reservoir pressure variation (error bars show the standard deviations based on the number of runs).
The average measured shock speed at the nozzle reservoir PT is found to be
 $1900\pm 18~\text{m}~\text{s}^{-1}$
based on the number of tunnel runs. Based on the distance from the mylar diaphragm to the model location (1.14 m), the elapsed arrival time for the test gas at the model location is 0.783 ms. Once the flow reaches the leading edge, two streamwise flow lengths’ time (approximately 0.08 ms) is shown to be required for initial disturbances to diminish, leading to the start of the steady-state test flow time at 0.87 ms. The end of the steady-state flow is characterised by the continual decrease in pressure, which starts at 1.27 ms, due to the drainage of flow through the nozzle. This leaves a useful test flow window of 0.4 ms.
$1900\pm 18~\text{m}~\text{s}^{-1}$
based on the number of tunnel runs. Based on the distance from the mylar diaphragm to the model location (1.14 m), the elapsed arrival time for the test gas at the model location is 0.783 ms. Once the flow reaches the leading edge, two streamwise flow lengths’ time (approximately 0.08 ms) is shown to be required for initial disturbances to diminish, leading to the start of the steady-state test flow time at 0.87 ms. The end of the steady-state flow is characterised by the continual decrease in pressure, which starts at 1.27 ms, due to the drainage of flow through the nozzle. This leaves a useful test flow window of 0.4 ms.
5.2 Heat-flux measurements
Fabrication of thin-film gauges largely followed the methods discussed extensively in the literature (Vidal Reference Vidal1956; Schultz & Jones Reference Schultz and Jones1973; Kinnear & Lu Reference Kinnear and Lu1998). A cylindrical quartz substrate was employed, as the material was readily available and offered predictable and desirable thermal properties. The thickness of the substrate was chosen based on a semi-infinite one-dimensional heat transfer assumption (Kinnear & Lu Reference Kinnear and Lu1998), exposure time and mechanical handling requirements. As suggested by Kinnear & Lu (Reference Kinnear and Lu1998), less than 1 % deviation from the semi-infinite assumption can be achieved with a substrate thickness of 3 mm for an exposure time of
 ${<}1$
s.
${<}1$
s.
Static and dynamic calibrations of thin-film gauges were performed in accordance with the procedures described in Kinnear & Lu (Reference Kinnear and Lu1998). Out of the six thin-film gauges used for measurements, three were manufactured using a different grade of metal–organic platinum than was initially available. The grade used initially was similar to that from the previous studies of Park (Reference Park2010), in which the thermal coefficients of resistance obtained were similar in range to that of Kinnear & Lu (Reference Kinnear and Lu1998). Owing to its unavailability, a different metal–organic had to be sought for the later batch of gauges. This had the disadvantage of lower thermal coefficient of resistance by an order of magnitude, implying reduced sensitivity. Owing to the fewer (only three) number of higher-sensitivity gauges, these were not subjected to dynamic calibration, but the thermal product is assumed to be the same as in Park (Reference Park2010), which is
 $1500\pm 120~\text{W}~\text{K}^{-1}~\text{m}^{-2}~\text{s}^{-1/2}$
. This agrees with the value of Schultz & Jones (Reference Schultz and Jones1973), which is
$1500\pm 120~\text{W}~\text{K}^{-1}~\text{m}^{-2}~\text{s}^{-1/2}$
. This agrees with the value of Schultz & Jones (Reference Schultz and Jones1973), which is
 $1400~\text{W}~\text{K}^{-1}~\text{m}^{-2}~\text{s}^{-1/2}$
, but is lower than that in Kinnear & Lu (Reference Kinnear and Lu1998) of approximately
$1400~\text{W}~\text{K}^{-1}~\text{m}^{-2}~\text{s}^{-1/2}$
, but is lower than that in Kinnear & Lu (Reference Kinnear and Lu1998) of approximately
 $2000~\text{W}~\text{K}^{-1}~\text{m}^{-2}~\text{s}^{-1/2}$
. Dynamic calibration was performed on a single sample sensor from the less-sensitive gauges and followed a similar procedure to that described in Kinnear & Lu (Reference Kinnear and Lu1998). The resulting thermal product was found to be
$2000~\text{W}~\text{K}^{-1}~\text{m}^{-2}~\text{s}^{-1/2}$
. Dynamic calibration was performed on a single sample sensor from the less-sensitive gauges and followed a similar procedure to that described in Kinnear & Lu (Reference Kinnear and Lu1998). The resulting thermal product was found to be
 $744~\text{W}~\text{K}^{-1}~\text{m}^{-2}~\text{s}^{-1/2}$
. A standard deviation could not be estimated, as the calibration was performed only on a single sensor. However, previous studies (Kinnear & Lu Reference Kinnear and Lu1998; Park Reference Park2010) have shown it to be within 10 %, which should be reflected in the heat-flux measurements.
$744~\text{W}~\text{K}^{-1}~\text{m}^{-2}~\text{s}^{-1/2}$
. A standard deviation could not be estimated, as the calibration was performed only on a single sensor. However, previous studies (Kinnear & Lu Reference Kinnear and Lu1998; Park Reference Park2010) have shown it to be within 10 %, which should be reflected in the heat-flux measurements.

Figure 25. Measured signals at two streamwise sensor locations: (a) at
 $x/x_{c}=1.34$
and (b) at
$x/x_{c}=1.34$
and (b) at
 $x/x_{c}=2.36$
.
$x/x_{c}=2.36$
.
A typical measured signal during one of the runs at two streamwise sensor locations is shown in figure 25. It is evident from figure 25 that the heat flux to the surface is not constant during the test flow window. The time-dependent heat flux to the surface is given as (Schultz & Jones Reference Schultz and Jones1973)
 $$\begin{eqnarray}\displaystyle q(t)=\frac{\sqrt{\unicode[STIX]{x1D70C}c_{p}k}}{\sqrt{\unicode[STIX]{x03C0}}\unicode[STIX]{x1D6FC}_{R}V_{0}}\left[\frac{\unicode[STIX]{x0394}V(t)}{\sqrt{t}}+\frac{1}{2}\int _{0}^{t}\frac{\unicode[STIX]{x0394}V(t)-\unicode[STIX]{x0394}V(\unicode[STIX]{x1D70F})}{(t-\unicode[STIX]{x1D70F})^{3/2}}\,\text{d}\unicode[STIX]{x1D70F}\right], & & \displaystyle\end{eqnarray}$$
where
 $\unicode[STIX]{x0394}V$
is the measured voltage difference,
$\unicode[STIX]{x0394}V$
is the measured voltage difference,
 $\sqrt{\unicode[STIX]{x1D70C}c_{p}k}$
is the thermal product,
$\sqrt{\unicode[STIX]{x1D70C}c_{p}k}$
is the thermal product,
 $V_{0}$
is the supplied voltage to the gauge,
$V_{0}$
is the supplied voltage to the gauge,
 $\unicode[STIX]{x1D6FC}_{R}$
is the thermal coefficient of resistance and
$\unicode[STIX]{x1D6FC}_{R}$
is the thermal coefficient of resistance and
 $\unicode[STIX]{x1D70F}$
is an integration variable. Using the piecewise linear approximation of Cook & Felderman (Reference Cook and Felderman1966), a discretised form of (5.1) is obtained for the time history of heat flux to the surface (Schultz & Jones Reference Schultz and Jones1973) as follows:
$\unicode[STIX]{x1D70F}$
is an integration variable. Using the piecewise linear approximation of Cook & Felderman (Reference Cook and Felderman1966), a discretised form of (5.1) is obtained for the time history of heat flux to the surface (Schultz & Jones Reference Schultz and Jones1973) as follows:
 $$\begin{eqnarray}\displaystyle q(t_{n}) & = & \displaystyle \frac{\sqrt{\unicode[STIX]{x1D70C}c_{p}k}}{\sqrt{\unicode[STIX]{x03C0}}\unicode[STIX]{x1D6FC}_{R}V_{0}}\left[\frac{\unicode[STIX]{x0394}V(t_{n})}{\sqrt{t_{n}}}+\mathop{\sum }_{i=1}^{n-1}\left(\frac{\unicode[STIX]{x0394}V(t_{n})-\unicode[STIX]{x0394}V(t_{i})}{(t_{n}-t_{i})^{1/2}}-\frac{\unicode[STIX]{x0394}V(t_{n})-\unicode[STIX]{x0394}V(t_{i-1})}{(t_{n}-t_{i-1})^{1/2}}\right.\right.\nonumber\\ \displaystyle & & \displaystyle +\left.\left.2\frac{\unicode[STIX]{x0394}V(t_{i})-\unicode[STIX]{x0394}V(t_{i-1})}{(t_{n}-t_{i})^{1/2}+(t_{n}-t_{i-1})^{1/2}}\right)+\frac{\unicode[STIX]{x0394}V(t_{n})-\unicode[STIX]{x0394}V(t_{n-1})}{(\sqrt{\unicode[STIX]{x0394}t})}\right].\end{eqnarray}$$
5.3 PLIF measurements
The laser-induced fluorescence (LIF) technique is a useful and well-understood method for measuring temperatures, species concentrations and velocities, and it has been deployed now for a number of years in the area of hypersonic flows, having initially been developed as a combustion diagnostic technique. LIF can be described as the process of a laser light source tuned to a resonance transition of an atomic or molecular absorber exciting a certain fraction of the particles in a given rovibronic state into a higher-energy state and monitoring the radiative de-excitation from that excited state. This fluorescence occurs after some characteristic lifetime inherent to the excited state, returning to either the original or an intermediate energy state, via a rovibronic transition. The complexity of this process is traditionally discussed using a two-level model of the molecular or atomic transition, which sufficiently incorporates the majority of important spectroscopic features of LIF.
LIF can be applied as a pointwise technique, but has been extended to a two-dimensional imaging method by using a planar sheet of laser light, in which form it is termed planar laser-induced fluorescence (PLIF). The theoretical principles remain identical to LIF, in that, at any pixel location within the imaged laser sheet, the total fluorescence intensity in the two-dimensional probed field is given by
 $$\begin{eqnarray}S\propto Nf_{B}B_{J^{\prime \prime }J^{\prime }}EG\unicode[STIX]{x1D6F7}C,\end{eqnarray}$$
where
 $S$
is the fluorescence signal,
$S$
is the fluorescence signal,
 $N$
is the number density of the probed species,
$N$
is the number density of the probed species,
 $f_{B}$
is the Boltzmann fraction of molecules present in the ground state of the probed transition,
$f_{B}$
is the Boltzmann fraction of molecules present in the ground state of the probed transition,
 $B_{J^{\prime \prime }J^{\prime }}$
is the Einstein coefficient for photon absorption,
$B_{J^{\prime \prime }J^{\prime }}$
is the Einstein coefficient for photon absorption,
 $E$
is the laser pulse energy,
$E$
is the laser pulse energy,
 $G$
is the spectral overlap integral of the laser line shape with the transition line shape,
$G$
is the spectral overlap integral of the laser line shape with the transition line shape,
 $\unicode[STIX]{x1D6F7}$
is the fluorescence yield, and
$\unicode[STIX]{x1D6F7}$
is the fluorescence yield, and
 $C$
is a multiplicative factor that accounts for the optical collection efficiency of the detection system. While some of these parameters, such as
$C$
is a multiplicative factor that accounts for the optical collection efficiency of the detection system. While some of these parameters, such as
 $C$
, are difficult to quantify for predicting absolute fluorescence signals, ratios of the signals obtained by exciting different rotational levels of molecules, for example, can be directly related to values of state variables. Thus the fluorescence can be used as an effective flow-field measurement tool. PLIF has the added benefit of being highly spatially and temporally resolved.
$C$
, are difficult to quantify for predicting absolute fluorescence signals, ratios of the signals obtained by exciting different rotational levels of molecules, for example, can be directly related to values of state variables. Thus the fluorescence can be used as an effective flow-field measurement tool. PLIF has the added benefit of being highly spatially and temporally resolved.
To obtain the separated flow-field rotational temperature distribution, the multi-line planar thermometry technique is employed, by acquiring PLIF images from pumped transitions originating from multiple spectral lines, providing information concerning the population distribution over the laser-excited rotational energy states. The experiment-dependent terms in (5.3),
 $G$
and
$G$
and
 $C$
, are held constant for measurements at the different rotational states being investigated, and the slope of the relationship, which is independent of these parameters, can be related to the rotational temperature of the nitric oxide in the flow, by exciting the flow with pulsed laser radiation at a wavelength of 226 nm.
$C$
, are held constant for measurements at the different rotational states being investigated, and the slope of the relationship, which is independent of these parameters, can be related to the rotational temperature of the nitric oxide in the flow, by exciting the flow with pulsed laser radiation at a wavelength of 226 nm.
The velocity field is calculated from PLIF imaging of the flow using the Doppler-shift velocimetry technique. In this technique, the laser wavelength is tuned relative to the fluorescence peak wavelength at zero velocity for a particular isolated transition of the nitric oxide molecule in the ultraviolet at 226 nm. The relative detuning of the laser is set randomly at discrete wavelengths, with a different detuning set for each tunnel run. Over several tunnel runs (typically between 30 and 60 per velocity component, depending on the desired signal-to-noise ratio of the velocity component measurement), each pixel in the PLIF image provides a wavelength scan around the fluorescence peak. This sampled wavelength scan can be fitted with a Gaussian distribution to determine the fluorescence peak, and the wavelength displacement of this fluorescence peak from the known zero-velocity peak can be used to determine the flow velocity. Two components of velocity were measured in this way: perpendicular to the free-stream flow direction and parallel to the compression surface. These components were resolved to orthogonal component measurements, which could then be used to determine streamlines in the flow field. The use of Doppler-shift velocimetry in hypersonic flows has been successfully implemented to image the two-component velocity distribution of the near-wake flow around a generic planetary entry probe by Hruschka, O’Byrne & Kleine (Reference Hruschka, O’Byrne and Kleine2010). By mapping both rotational temperature and velocity using these techniques, a new set of two-dimensional and spatially resolved experimental data for hypersonic flow is made available for comparison against computational results. Full details of implementing the PLIF technique to explore the leading-edge separated flow is given in Le Page & O’Byrne (Reference Le Page and O’Byrne2017). In this paper we are concerned with the direct comparison between experimental measurement and flow-field computations.
6 Experimental comparison
The computational results presented in § 3 can now be compared against theoretical and experimental results detailed in §§ 4 and 5. For practical reasons associated with the limitations of fabricating leading edges, only the blunt leading-edge model is considered.
6.1 Comparison with heat flux
Computational surface heat flux is shown together with the experimental data points (at
 $x/x_{c}=1.34$
, 1.68, 2.07, 2.36, 2.73 and 3.04) in figure 26 along with run-to-run standard deviations. A good comparison is obtained over the compression surface up to reattachment. The close vicinity of reattachment is a region of complex shock interactions due to the confluence of separation and reattachment shocks at the triple point and the emergence of expansion waves as a result of Edney type VI shock interaction. The subsequent flow development downstream occurring under the reattachment shock is also characterised by high compression. Significant computational resources are needed from a DSMC perspective to accurately resolve the flow effects in these regions. This means using a number of particles and collision cells an order of magnitude higher relative to those used in the present computations. Owing to computational resource limitations, such high-fidelity computations were not possible as part of the present study and, therefore, the results after reattachment must be treated as qualitative. This is also the reason for not including more data locations after reattachment in the experimental model. Close to the corner, an overprediction of heat flux is observed. As discussed previously, the vorticity and temperature gradients close to the corner are enhanced by the development of a secondary vortex. As such, further cell refinement is needed at the corner to accurately resolve these effects. An overprediction due to insufficient cell resolution at the corner has been reported in the double-cone investigations of Moss & Bird (Reference Moss and Bird2005).
$x/x_{c}=1.34$
, 1.68, 2.07, 2.36, 2.73 and 3.04) in figure 26 along with run-to-run standard deviations. A good comparison is obtained over the compression surface up to reattachment. The close vicinity of reattachment is a region of complex shock interactions due to the confluence of separation and reattachment shocks at the triple point and the emergence of expansion waves as a result of Edney type VI shock interaction. The subsequent flow development downstream occurring under the reattachment shock is also characterised by high compression. Significant computational resources are needed from a DSMC perspective to accurately resolve the flow effects in these regions. This means using a number of particles and collision cells an order of magnitude higher relative to those used in the present computations. Owing to computational resource limitations, such high-fidelity computations were not possible as part of the present study and, therefore, the results after reattachment must be treated as qualitative. This is also the reason for not including more data locations after reattachment in the experimental model. Close to the corner, an overprediction of heat flux is observed. As discussed previously, the vorticity and temperature gradients close to the corner are enhanced by the development of a secondary vortex. As such, further cell refinement is needed at the corner to accurately resolve these effects. An overprediction due to insufficient cell resolution at the corner has been reported in the double-cone investigations of Moss & Bird (Reference Moss and Bird2005).

Figure 26. Experimental comparison of normalised surface heat flux.
6.2 Comparison with PLIF measurements
This section attempts to draw useful comparison of global flow-field features between computations and PLIF images. The flow-field streamlines from both are shown in figure 27. A good agreement in the overall flow structure is evident. The core of the primary recirculation region (or vortex) is located downstream relative to the corner location in the computation, whereas it is approximately in line at the corner location in the experiment. A plausible reason for this could be the unsteadiness in flow development. Within the useful test flow time of less than 1 ms in PLIF measurements, the separated flow structure would still be developing compared to the computational result taken in the sampling interval of 1–1.25 ms. It is also important to note that the velocity measurements, because they are obtained over a large number of tunnel runs, represent an average of the flow velocity over these tests. Any variability or instability in the vortex from one tunnel run to the next, or during a single tunnel run, manifests as an uncertainty in the peak fluorescence location, and hence in the velocity component measurement. It is interesting to note the existence of tertiary vortices in both results on the expansion surface. It is shown as a confined structure in PLIF but is more dispersed in computations. PLIF shows an enlarged secondary vortex whereas computations exhibit a smaller one that is connected to the trail of tertiary vortices on the expansion side. This enlarged structure could be the reason for a lower heat flux close to the corner in experiments as seen in figure 26.

Figure 27. Comparison of flow-field features: top, PLIF; bottom, DSMC.

Figure 28. Comparison of flow-field profiles: (a) rotational temperature and (b) velocity. (Standard deviations are shown for PLIF measurements.)
Based on thermometry and velocimetry PLIF measurements of the spatial distribution of rotational temperature and velocity, interpolative profile plots along a line at the corner have been generated and compared against similar computational profiles in figure 28. For rotational temperature, the difference is within the experimental uncertainty limits close to the corner but then becomes significant and goes to a maximum at a non-dimensional distance of 0.25, which corresponds to the outer edge of the secondary vortex at the corner (see PLIF image in figure 27). Thereafter, the differences drop and the agreement becomes better through the primary vortex and towards the free stream. The agreement between measured free-stream rotational temperature and the result of the one-dimensional computation of the flow is within 7 K. The differences between measured and computed temperature within the vortex are outside the range of the uncertainties in the measurement technique, with the experiment being hotter than the computed solution. This may perhaps be due to the non-established flow in the experimental result, which was a necessary result of the limited test time of the facility at these conditions. Close to the corner, the structure and size of the secondary vortex are different between PLIF measurements and computations. In computations, the secondary vortex is seen to be more confined and compressed close to the corner by the primary vortex, and this possibly influences the rotational energy of the molecules, whereas it is shown as a relatively enlarged and less compressed structure in the experimental results.
For velocity, differences are significant within the secondary vortex region. Measurements close to the surface are compromised by laser backscattering and it increases the uncertainty. Away from the surface, the measurement uncertainty is lower and computations show reasonable agreement with velocity measurements. At the corner, computations show a stationary region of zero velocity within a non-dimensional finite distance of approximately 0.1. This possibly indicates the presence of an additional vortex lying at the corner under the secondary vortex. The velocity rise within the secondary vortex (extending to 0.2) occurs only after this region, whereas the experiment shows a constant finite velocity within the whole secondary vortex. Differences between the results become significant after a non-dimensional distance of 0.5 and further into the primary vortex, but the agreement gets better as free stream is approached.
The three-dimensionality of PLIF measurements is also possibly one of the contributing factors behind the discrepancies between two-dimensional computations and PLIF results in figure 28. However, the influence of this three-dimensionality is not quantitatively estimated at this stage. Finally, the interpolative dividing streamline data extracted from flow fields of computations and PLIF are compared in figure 29. Owing to backscattering from the surface and local unsteadiness surrounding separation, quality measurements were not possible close to separation (
 $S^{\ast }<1$
). Therefore, the initial buildup of
$S^{\ast }<1$
). Therefore, the initial buildup of
 $u_{d}^{\ast }$
could not be traced in measurements. Reattachment occurs slightly downstream in experiments relative to the computed profile. However, there is good agreement between respective peak values of
$u_{d}^{\ast }$
could not be traced in measurements. Reattachment occurs slightly downstream in experiments relative to the computed profile. However, there is good agreement between respective peak values of
 $u_{d}^{\ast }$
and close agreement with the Chapman limit at large
$u_{d}^{\ast }$
and close agreement with the Chapman limit at large
 $S^{\ast }$
, as shown in figure 22.
$S^{\ast }$
, as shown in figure 22.

Figure 29. Comparison of dividing streamline velocities from PLIF and computations.
7 Conclusions
A comprehensive study is carried out combining computational, theoretical and experimental investigations of the hypersonic leading-edge separation problem. Computations were performed on an infinitely sharp leading-edge model and with a leading-edge radius of
 $20~\unicode[STIX]{x03BC}\text{m}$
in order to show the difference between comparisons of idealised representations of these sensitive flow fields and what can be achieved with fabricated experimental models. Differences in results between the models have been analysed in detail and demonstrated the importance of obtaining a close match between a manufactured experimental model and its computational counterpart when experimental validation is the prime objective. Even with a small leading-edge radius, as in the present instance, flow characteristics around the leading edge exhibited significant differences. These differences affected not only the separation but also the flow development in the separated shear layer and reattachment. The effectiveness of quantitative comparisons is also limited by the finite duration of the tunnel flow, particularly in the range of total enthalpies that can be simulated in free-piston shock tunnels. The limitation in the test time means that the experiments are performed during the establishment of the flow, when the flow is not completely steady. The averaging required for determination of both temperature and velocity maps will not therefore resolve the run-to-run variations in flow parameters. This shows the need for new diagnostic techniques for these facilities that are both temporally and spatially resolved so that variations in time and space during the facility flow time can be quantified.
$20~\unicode[STIX]{x03BC}\text{m}$
in order to show the difference between comparisons of idealised representations of these sensitive flow fields and what can be achieved with fabricated experimental models. Differences in results between the models have been analysed in detail and demonstrated the importance of obtaining a close match between a manufactured experimental model and its computational counterpart when experimental validation is the prime objective. Even with a small leading-edge radius, as in the present instance, flow characteristics around the leading edge exhibited significant differences. These differences affected not only the separation but also the flow development in the separated shear layer and reattachment. The effectiveness of quantitative comparisons is also limited by the finite duration of the tunnel flow, particularly in the range of total enthalpies that can be simulated in free-piston shock tunnels. The limitation in the test time means that the experiments are performed during the establishment of the flow, when the flow is not completely steady. The averaging required for determination of both temperature and velocity maps will not therefore resolve the run-to-run variations in flow parameters. This shows the need for new diagnostic techniques for these facilities that are both temporally and spatially resolved so that variations in time and space during the facility flow time can be quantified.
With the
 $20~\unicode[STIX]{x03BC}\text{m}$
leading-edge radius, the flow characteristics at the leading edge are found to be viscous-dominated rather than bluntness-dominated. The attenuation of rarefaction effects from a stronger leading-edge shock is not observed here even though the shock strength is increased for the blunt model. Rather, the stronger entropy generated by the stronger leading-edge shock aided in stabilising the boundary layer by accentuating the energy transfer from the inviscid free stream, thereby energising the lower layers of the boundary layer. This resulted in a delayed separation for the blunt leading edge, in contrast to what would have been expected for a bluntness-dominated flow.
$20~\unicode[STIX]{x03BC}\text{m}$
leading-edge radius, the flow characteristics at the leading edge are found to be viscous-dominated rather than bluntness-dominated. The attenuation of rarefaction effects from a stronger leading-edge shock is not observed here even though the shock strength is increased for the blunt model. Rather, the stronger entropy generated by the stronger leading-edge shock aided in stabilising the boundary layer by accentuating the energy transfer from the inviscid free stream, thereby energising the lower layers of the boundary layer. This resulted in a delayed separation for the blunt leading edge, in contrast to what would have been expected for a bluntness-dominated flow.
Separation and reattachment locations are identified based on the behaviour of gas velocity at the wall rather than the traditionally employed zero skin-friction criterion. For the blunt leading edge, separation occurs 1.4 mm downstream of the leading edge, whereas it occurs earlier for the sharp case at 1 mm (at 166 and 119, respectively, when normalised with
 $\unicode[STIX]{x1D706}_{\infty }$
). Reattachment locations are not significantly different. Both skin friction and gas velocity at the wall identify the presence of primary and secondary vortex structures within the separated region of both computed and experimental flow fields. In addition, these respective behaviours indicate the presence of tertiary vortex structures over the expansion surface for the blunt leading-edge case but these are absent for the sharp leading-edge case. Tertiary structures create strong vorticity and temperature gradients that are reflected in the heat-flux and pressure distributions over the expansion surface of the blunt leading-edge model.
$\unicode[STIX]{x1D706}_{\infty }$
). Reattachment locations are not significantly different. Both skin friction and gas velocity at the wall identify the presence of primary and secondary vortex structures within the separated region of both computed and experimental flow fields. In addition, these respective behaviours indicate the presence of tertiary vortex structures over the expansion surface for the blunt leading-edge case but these are absent for the sharp leading-edge case. Tertiary structures create strong vorticity and temperature gradients that are reflected in the heat-flux and pressure distributions over the expansion surface of the blunt leading-edge model.
The boundary layer growth from the leading edge to separation is affected by complex flow phenomena such as rarefaction, thermal non-equilibrium and viscous interaction. These result in a non-similar and non-Blasius type of boundary layer growth leading to separation. Differences in leading-edge characteristics between the models are reflected in the flow profiles of velocity, pressure and temperature at the beginning of interaction and separation. The sharp leading-edge model has fuller profiles whereas the blunt leading-edge model shows thicker profiles.
The theoretical shear layer analysis, employing computed profiles of velocity and temperature as initial conditions, shows that the semi-theoretical profile approaches the Chapman limit if the shear layer is allowed to develop infinitely. However, the computed profile of the dividing streamline shows that the reattachment process is dominated by viscous effects and is Reynolds-number-dependent, unlike the isentropic reattachment proposed in Chapman’s isentropic recompression theory.
Computations show good agreement with the experimental heat-flux data obtained from shock tunnel measurements. Experimental data locations are compared only up to the reattachment due to computational resource limitations in obtaining high-fidelity DSMC data after reattachment. Flow structure comparison with PLIF also shows good overall agreement and confirms, for the first time, the presence of tertiary vortex structures in a large separated flow.
Acknowledgements
This study forms part of the Australian Research Council Grant, DP-140100842, and this support is gratefully acknowledged. We would also like to acknowledge the generous support from the National Computational Infrastructure (NCI), which is supported by the Australian Government. We would like to thank Dr M. Gallis at Sandia National Laboratories for his helpful advice in running the SPARTA code at various stages of the work. We also express our sincere thanks to Mr M. Barrett for facilitating the tunnel runs during the experimental campaign.


