


1. Introduction
The friction drag, mostly associated with turbulent boundary layers, accounts for approximately  $50\,\%$ of the total aerodynamic drag for long-range commercial aircraft (Gad-el Hak Reference Gad-el Hak1994; Abbas, de Vicente & Valero Reference Abbas, de Vicente and Valero2013). Therefore, any optimization of the flow close to the surface and thus the friction drag provides great potential for drag reduction and energy saving. Among the diverse control strategies for turbulent boundary layers, such as addition of long-chain polymers, oscillating walls, superhydrophobic surfaces and riblets (White & Mungal Reference White and Mungal2008; Touber & Leschziner Reference Touber and Leschziner2012; Rastegari & Akhavan Reference Rastegari and Akhavan2015; Li Reference Li2020; Ran, Zare & Jovanović Reference Ran, Zare and Jovanović2021), mass blowing and suction is a promising method to control the friction drag or flow transition in wall-bounded turbulence (Kim, Sung & Chung Reference Kim, Sung and Chung2002; Kametani & Fukagata Reference Kametani and Fukagata2011).
Experiments have shown that uniform blowing from smooth perforated surfaces can reduce the turbulent friction drag with a net energy saving (Hwang Reference Hwang1996, Reference Hwang2004). Given the proper blowing intensity, porosity and effective roughness, the net energy saving holds for a wide range of conditions, including both zero- and adverse-pressure-gradient (ZPG and APG) turbulent boundary layers (TBLs) (Welch et al. Reference Welch, Larosiliere, Hwang and Wood2001). However, uniform suction will increase the turbulent friction drag but can be employed for separation control, transition delay and lift enhancement. Direct numerical simulation (DNS) and large-eddy simulation (LES) of uniform blowing and suction applied to turbulent boundary layers have also been performed (Park & Choi Reference Park and Choi1999; Kim et al. Reference Kim, Sung and Chung2002; Kametani & Fukagata Reference Kametani and Fukagata2011; Kametani et al. Reference Kametani, Fukagata, Örlü and Schlatter2015; Bobke, Örlü & Schlatter Reference Bobke, Örlü and Schlatter2016). In most cases, these simulations were carried out in zero-pressure-gradient conditions to investigate the effects of blowing and suction on dynamics of wall-bounded turbulence. For instance, Stroh et al. (Reference Stroh, Hasegawa, Schlatter and Frohnapfel2016) compared uniform blowing and suction with body-force damping (as a model of opposition control), and introduced the concept of a virtual origin to describe blowing and suction effects in the downstream of the control region.
Recently, blowing and suction control of TBLs on wing sections have gained interest among researchers. Using mass suction at the leading edge of a Clark-Z airfoil to provide pressurized air for blowing, Kornilov (Reference Kornilov2017) studied uniform blowing on the pressure side of the airfoil at Reynolds number  $Re_c=U_\infty c / \nu =840\,000$, where
  $U_{\infty }$ is the incoming flow velocity,
  $c$ is the chord length and
  $\nu$ is the fluid kinematic viscosity. Eto et al. (Reference Eto, Kondo, Fukagata and Tokugawa2019) studied the effects of active blowing on the suction side of a Clark-Y airfoil at
  $Re_c=1\,500\,000$, followed by their passive blowing study under the similar conditions (Hirokawa et al. Reference Hirokawa, Ohashi, Eto, Fukagata and Tokugawa2020). Kornilov, Kavun & Popkov (Reference Kornilov, Kavun and Popkov2019) employed blowing on the pressure side and suction on the suction side of an NACA0012 airfoil, and later they provided an estimation of the control energy cost under the same conditions (Kornilov Reference Kornilov2021). Mahfoze et al. (Reference Mahfoze, Moody, Wynn, Whalley and Laizet2019) used Bayesian optimization to discuss how to benefit from downstream effects of blowing when the control region is separated into individual areas. The first high-fidelity numerical simulation of a wing section with uniform blowing was reported by Vinuesa & Schlatter (Reference Vinuesa and Schlatter2017), albeit at a low Reynolds number (
 $Re_c=100\,000$). Soon after, Atzori et al. (Reference Atzori, Vinuesa, Fahland, Stroh, Gatti, Frohnapfel and Schlatter2020) presented a dataset of a highly resolved LES of an NACA4412 airfoil at
  $Re_c=200\,000$ and
  $400\,000$ with various configurations of uniform blowing and suction, using the simulation carried out by Vinuesa et al. (Reference Vinuesa, Negi, Atzori, Hanifi, Henningson and Schlatter2018) as a reference. This dataset was later employed by Fahland et al. (Reference Fahland, Stroh, Frohnapfel, Atzori, Vinuesa, Schlatter and Gatti2021) to validate Reynolds-averaged Navier–Stokes (RANS) simulations, and it is also considered in the present paper.
The key objective of this study is to investigate the control effects on mean friction drag on a wing section with uniform blowing and suction. Although the mean friction drag is a wall property, as can be directly calculated from the normal gradient of the mean tangential velocity at the wall, it is connected to the statistical turbulence quantities across the wall layer and can be further decomposed into various physics-informed components according to different mathematical derivations and physical interpretations (Li et al. Reference Li, Fan, Modesti and Cheng2019; Fan, Cheng & Li Reference Fan, Cheng and Li2019a; Fan, Li & Pirozzoli Reference Fan, Li and Pirozzoli2019b). So far, there have been three kinds of friction-drag decomposition methods, derived from the momentum, vorticity and energy balance, respectively. The first is the so-called Fukagata–Iwamoto–Kasagi (FIK) identity (Fukagata, Iwamoto & Kasagi Reference Fukagata, Iwamoto and Kasagi2002), in which a triple integration is performed on the mean momentum balance equation and gives a direct relationship between the skin-friction coefficient and the Reynolds shear stress profile. The FIK identity has been widely used and extended for more complex situations over the years, e.g. Mehdi & White (Reference Mehdi and White2011), Mehdi et al. (Reference Mehdi, Johansson, White and Naughton2014), Modesti et al. (Reference Modesti, Pirozzoli, Orlandi and Grasso2018), Peet & Sagaut (Reference Peet and Sagaut2009) and Bannier, Garnier & Sagaut (Reference Bannier, Garnier and Sagaut2015), to name a few. Kametani et al. (Reference Kametani, Fukagata, Örlü and Schlatter2015) and Stroh et al. (Reference Stroh, Frohnapfel, Schlatter and Hasegawa2015) applied the FIK identity to quantify the variation of skin-friction coefficients caused by blowing and suction in ZPG-TBLs. Inspired by the mathematical derivation of the FIK identity, Yoon et al. (Reference Yoon, Ahn, Hwang and Sung2016) derived a vorticity-based formula relating the mean friction-drag generation with the motion of vortical structures, by performing a triple integration on the mean spanwise vorticity transport equation. They later used this method to analyse the contribution of outer large-scale motions to the friction-drag generation in a moderate APG-TBL (Yoon, Hwang & Sung Reference Yoon, Hwang and Sung2018). Finally, an energy-based decomposition method was proposed by Renard & Deck (Reference Renard and Deck2016) from the perspective of streamwise kinetic energy balance. Under an absolute reference frame where the wall is moving, the friction drag develops a non-zero power, which is characterized as the energy transferred from the wall to the fluid, by means of molecular viscosity dissipation, turbulence kinetic energy (TKE) production and spatial growth of the flow. This method is referred to as the RD identity hereafter. The RD identity has been used to analyse the friction-drag generation in channel flows, ZPG/APG-TBLs, turbulent square-duct flows and pipe flows (Wei Reference Wei2018; Fan et al. Reference Fan, Cheng and Li2019a,Reference Fan, Li and Pirozzolib, Reference Fan, Li, Atzori, Pozuelo, Schlatter and Vinuesa2020a; Fan, Li & Pirozzoli Reference Fan, Li and Pirozzoli2020b). Li et al. (Reference Li, Fan, Modesti and Cheng2019) and Fan et al. (Reference Fan, Li and Pirozzoli2019b) generalized the RD identity to a compressible form to quantify the compressibility effects on the friction-drag generation. All these three methods (Fukagata et al. Reference Fukagata, Iwamoto and Kasagi2002; Renard & Deck Reference Renard and Deck2016; Yoon et al. Reference Yoon, Ahn, Hwang and Sung2016) are mathematically correct and have been widely validated. In the present study, we only adopt the RD identity, because it directly reflects the physical processes, such as production and dissipation, in the turbulent boundary layer, and relates them to the generation of skin-friction drag (Renard & Deck Reference Renard and Deck2016; Fan et al. Reference Fan, Cheng and Li2019a).
The turbulent boundary layers on the suction/pressure sides of the wing section are subjected to adverse/favourable pressure gradients. The pressure gradients have significant impacts on the scales of coherent structures across the wall layer. For instance, inner–outer scale separation is more evident in APG-TBLs than in ZPG-TBLs, even at relatively low Reynolds numbers, owing to the enhancement of outer-scale motions (Tanarro, Vinuesa & Schlatter Reference Tanarro, Vinuesa and Schlatter2020). Additionally, a significant increment of small-scale energy was found in the outer region, as the vertical motion induced by the APG transports small scales from the near-wall region to the outer layer (Vinuesa et al. Reference Vinuesa, Negi, Atzori, Hanifi, Henningson and Schlatter2018; Tanarro et al. Reference Tanarro, Vinuesa and Schlatter2020). In the present study, we also aim to quantify the contribution of structures with different scales to the generation of friction drag on the wing section with/without blowing and suction. To this end, an appropriate approach to separate the multi-scale coherent structures is required. Typically, Fourier analysis might be a tempting tool to decompose the raw signals into modes with given wavelengths, yet it relies on an a priori definition of the cutoff wavelength and suffers from difficult applicability to complex and transient signals (Cheng et al. Reference Cheng, Li, Lozano-Durán and Liu2019). Another frequently used method is the proper orthogonal decomposition (POD) (Lumley Reference Lumley1967; Wu & Christensen Reference Wu and Christensen2010), which sorts the contribution of velocity fluctuations to the turbulence kinetic energy. However, Wang, Pan & Wang (Reference Wang, Pan and Wang2018, Reference Wang, Pan and Wang2019) pointed out that the energy-ranking spatial modes cannot fully recover the dynamics of turbulent motions in different length scales. In contrast, empirical mode decomposition (EMD), proposed by Huang et al. (Reference Huang, Shen, Long, Wu, Shih, Zheng, Yen, Tung and Liu1998), provides an adaptive, data-driven and a posteriori technique to delineate the transient and local characteristics of signals. It is, in principle, free from pre-established basis functions and represents the original signal as a superposition of several intrinsic mode functions and a residual, with the characteristic wavelengths of the signals automatically determined. Although EMD suffers from some criticism, e.g. non-orthogonal modes and the mode-mixing problem, it has been successfully applied in turbulence-scale separation. With EMD, Huang et al. (Reference Huang, Schmitt, Lu and Liu2008) studied the scaling properties and intermittency of homogeneous turbulence, and Ansell & Balajewicz (Reference Ansell and Balajewicz2017) analysed the features of large-scale vortical structures in a turbulent mixing layer. Agostini & Leschziner (Reference Agostini and Leschziner2014, Reference Agostini and Leschziner2016) used bidimensional empirical mode decomposition (BEMD) to analyse the modulation of large-scale motions on the small-scale eddies in the near-wall region, and later they discussed the scale-specific contributions of large- and small-scale structures to the friction-drag generation by means of the FIK and RD identities (Agostini & Leschziner Reference Agostini and Leschziner2019) in channel flows. Dogan et al. (Reference Dogan, Örlü, Gatti, Vinuesa and Schlatter2019) used EMD to characterize the inner–outer interaction based on the modulation coefficient. Cheng et al. (Reference Cheng, Li, Lozano-Durán and Liu2019) adopted BEMD to identify attached eddies in turbulent channel flows and quantify their relationship with the friction-drag generation. However, no relevant study has been found in the open literature to analyse the scale-specific contribution of turbulent motions to friction-drag generation on the wing section with/without blowing and suction.
This paper is organized as follows. In § 2, we introduce the friction-drag decomposition method and the database of flow over an NACA4412 airfoil. The decomposition results on the suction and pressure side of the NACA4412 are discussed in §§ 3 and 4, respectively. Concluding remarks are given in § 5.
2. Friction-drag decomposition method and the database of flow over the NACA4412 airfoil
Assuming that the flow is statistically steady in time and homogeneous in the spanwise direction, the skin-friction coefficient  $C_f$ of a turbulent boundary layer can be decomposed with the RD identity (Renard & Deck Reference Renard and Deck2016):
 \begin{align} C_{f}&=\underbrace{\frac{2}{U_e^3}\int_{0}^{\infty}\nu \left(\frac{\partial U}{\partial y}\right)^2 \textrm{d} y}_{C_{f,V}}+\underbrace{\frac{2}{U_e^3}\int_{0}^{\infty}-\langle u'v'\rangle \frac{\partial U}{\partial y}\,\textrm{d} y}_{C_{f,T}}\nonumber\\ &\quad +\underbrace{\frac{2}{U_e^3}\int_{0}^{\infty}(U-U_e)\frac{\partial}{\partial y}\left(\nu\frac{\partial U}{\partial y}-\langle u'v'\rangle \right) \textrm{d} y}_{C_{f,G}}, \end{align}
where  $\langle \cdot \rangle$ is the Reynolds averaging operator,
  $x$ and
  $y$ represent the directions tangential and normal to the wall surface, respectively,
  $U$ and
  $V$ are the corresponding Reynolds-averaged velocity components, and
  $u'$ and
  $v'$ are the velocity fluctuations with respect to the averaged velocities (i.e.
  $U$ and
  $V$). Here,
  $U_e$ is the velocity at the boundary-layer edge, and the 99 % boundary-layer thickness
  $\delta _{99}$ is identified with the method proposed by Vinuesa et al. (Reference Vinuesa, Bobke, Örlü and Schlatter2016) based on the concept of diagnostic scaling (Alfredsson, Segalini & Örlü Reference Alfredsson, Segalini and Örlü2011). The derivation of the RD identity can be retrieved in Renard & Deck (Reference Renard and Deck2016).
Three contributive friction constituents are obtained in (2.1): (i)  $C_{f,V}$ represents the direct molecular viscous dissipation; (ii)
  $C_{f,T}$ represents the power spent for TKE production; (iii)
  $C_{f,G}$ accounts for the spatial growth of the flow, which is also interpreted as the rate of gain of the mean streamwise kinetic energy by the fluid in the absolute frame. Note that the integrand in
  $C_{f,G}$ has been substituted with local information which only depends on the well-documented wall-normal profiles (Renard & Deck Reference Renard and Deck2016). This is especially applicable for the cases where the accurate calculation of explicit streamwise derivatives is unfeasible.
For adverse-/favourable-pressure-gradient turbulent boundary layers around an airfoil, the roles of the wall-normal convection and pressure gradient are of particular importance and should be individually discussed, thus a further decomposition of  $C_{f,G}$ is carried out, viz.
 \begin{align} C_{f,G}&= \underbrace{\frac{2}{U_e^3}\int_{0}^{\infty}(U-U_e)\left(V\frac{\partial U}{\partial y}\right) \textrm{d} y}_{C_{f,C}} +\underbrace{\frac{2}{U_e^3}\int_{0}^{\infty}(U-U_e)I_x\,\textrm{d} y}_{C_{f,D}}\nonumber\\ &\quad +\underbrace{\frac{2}{U_e^3}\int_{0}^{\infty}(U-U_e)\left(\frac{\textrm{d} p/\rho}{\textrm{d}\kern0.06em x}\right) \textrm{d} y}_{C_{f,P}}, \end{align}
where  $I_x={\partial \langle u'u'\rangle }/{\partial x}+U{\partial U}/{\partial x}-\nu {\partial ^2 U}/{\partial x^2}$,
  $p$ is the static pressure and
  $\rho$ is the density. Contributions of the mean wall-normal convection (
 $C_{f,C}$), streamwise development (
 $C_{f,D}$) and the pressure gradient (
 $C_{f,P}$) are separated in (2.2). Note that in (2.1) and (2.2), we set the limits of integration as
  $y=0-\infty$, as in the study of Renard & Deck (Reference Renard and Deck2016), to take into account the turbulent fluctuations located above the edge of the boundary layer (if they are non-zero). However, in practice, the wall-normal location
  $y\approx 5\delta _{99}$ is chosen to be the upper integration limit, which was validated to be sufficiently far away from the wall for the decomposition to provide robust results. Details of the effects of the upper integration limit on the decomposed results can be found in Appendix A.
We consider a set of well-resolved LESs of an NACA4412 airfoil at an angle of attack of  $5^\circ$ at two chord Reynolds numbers, i.e.
  $Re_c=200\,000$ and
  $400\,000$. The simulations were performed with the spectral-element code Nek5000, developed by Fischer, Lottes & Kerkemeier (Reference Fischer, Lottes and Kerkemeier2008). The spatial derivatives in the incompressible Navier–Stokes equations are discretized employing a Garlerkin method, following the
  $P_N-P_{N-2}$ formulation by Patera (Reference Patera1984), and the solution is expressed within each spectral element in terms of a nodal-base of Legendre polynomials on the Gauss–Lobatto–Legendre (GLL) quadrature points. The discretization of the time derivatives is explicit for the nonlinear terms and implicit for the viscous term, employing an extrapolation and a backward differentiation scheme, respectively, both of the third order. To trigger transition to turbulence, we employed tripping through a volume force implemented, as proposed by Schlatter & Örlü (Reference Schlatter and Örlü2012), at
  $x/c=0.1$ on both suction and pressure sides.
The cases with/without control, listed in table 1, include various configurations of uniform blowing and suction applied on the suction side and uniform blowing applied on the pressure side. The relative proportions of pressure drag and skin-friction drag determine the control effects on the total drag, denoted by  $c_d$. At these moderate Reynolds numbers, pressure drag is relatively high and uniform blowing on the suction side increases it by an amount that is high enough to overcome the skin-friction reduction, eventually leading to higher
  $c_d$. In contrast, uniform suction increases skin-friction drag, but it decreases the pressure drag enough to result in lower
  $c_d$. When applied on the suction side, uniform blowing decreases lift (
 $c_l$), while suction increases it. Uniform blowing on the pressure side has different effects on the pressure distribution around the airfoil, decreasing both skin friction and pressure drag and increasing lift. Details of the control effects on the skin-friction and pressure components of the total drag can be found in Atzori et al. (Reference Atzori, Vinuesa, Fahland, Stroh, Gatti, Frohnapfel and Schlatter2020). The friction Reynolds numbers (
 $Re_\tau =u_\tau \delta _{99}/\nu$) and the Rotta–Clauser pressure-gradient parameters (Rotta Reference Rotta1950; Clauser Reference Clauser1954, Reference Clauser1956) (
 $\beta =\delta ^*/\tau _w\,\textrm {d}P_e/\textrm {d} x$) are also listed in table 1. Note that
  $u_\tau =\sqrt {(\tau _w/\rho )}$ is the friction velocity,
  $\delta ^*$ is the displacement thickness,
  $\tau _w$ is the wall shear stress and
  $\textrm {d}P_e/\textrm {d} x$ is the streamwise pressure gradient at the edge of the boundary layer. For a more complete description of the numerical set-up, we refer to Vinuesa et al. (Reference Vinuesa, Negi, Atzori, Hanifi, Henningson and Schlatter2018) and Atzori et al. (Reference Atzori, Vinuesa, Fahland, Stroh, Gatti, Frohnapfel and Schlatter2020).
Table 1. Cases with/without control considered in the present paper and the relative changes of the total lift and drag coefficients (denoted by  $\Delta (c_l)$ and
  $\Delta (c_d)$, respectively) and aerodynamic efficiency (denoted by
  $\Delta (L/D)$) with respect to the reference case. Note that
  $Re200k$ and
  $Re400k$ are the chord Reynolds numbers (
 $Re_c$) of each case, ‘
 $ss$’ and ‘
 $ps$’ denote the suction and pressure side, and ‘
 $blw$’ and ‘
 $sct$’ represent the control strategy of uniform blowing and suction, respectively. Here,
  $V_{wall}/U_\infty$ is the control intensity,
  $Re_\tau$ denotes the friction Reynolds number and
  $\beta$ is the Rotta–Clauser pressure-gradient parameter.

3. Friction-drag decomposition on the suction side
In this section, we first discuss the decomposition results based on (2.1) and (2.2), and quantitatively investigate the effects of different control strategies on friction contributions in § 3.1. Attention is paid to the wall-normal sources of skin-friction generation in § 3.2. Moreover, in § 3.3, EMD is carried out to study the scale-specific contributions and the influences on the small- and large-scale motions by uniform blowing/suction.
3.1. The control effects
Using the database, we first show the distribution of the skin-friction coefficients and their variation with regard to the reference cases on the suction side of an NACA4412 wing section in figure 1. It can be easily found that uniform blowing causes friction-drag reduction whereas suction causes friction-drag increase, regardless of the Reynolds number and streamwise position on the control surface. A stronger intensity of blowing/suction leads to a larger drag-reduction/increase rate, as expected. Such phenomena are consistent with previous studies (Kametani & Fukagata Reference Kametani and Fukagata2011; Kametani et al. Reference Kametani, Fukagata, Örlü and Schlatter2015; Atzori et al. Reference Atzori, Vinuesa, Fahland, Stroh, Gatti, Frohnapfel and Schlatter2020). The mechanisms of the drag reduction/increase by blowing/suction can be possibly classified as: (i) direct effect by the excess/defect of displacement thickness arising from the wall flux; (ii) indirect effect associated with the interactions between the ‘cross-stream’ and quasi-streamwise vortical structures in the near-wall region, which probably enhance/dampen the behaviour of sweep/ejection events and yield modifications of the mean velocity profiles (Park & Choi Reference Park and Choi1999; Kim et al. Reference Kim, Sung and Chung2002; Hwang Reference Hwang2004; Kornilov Reference Kornilov2015). The variation of turbulent dynamics in the near-wall region leads to a redistribution of the turbulence kinetic energy and alteration of the turbulent momentum transport across the wall layer. The vortical structures in the outer layer will also be influenced by the near-wall blowing/suction, especially in the downstream of the control surface. Consequently, the generation of the skin-friction drag, which is linked to the turbulence statistics across the wall layer, will be correspondingly changed.

Figure 1. Skin-friction coefficients on the suction side of an NACA4412 wing section at ( $a$)
$a$)  $Re_c=200\,000$ and (
 $b$)
$b$)  $Re_c=400\,000$. Variation of
  $C_f$ with regards to the reference case on the suction side of an NACA4412 wing section at (
 $c$)
$c$)  $Re_c=200\,000$ and (
 $d$)
$d$)  $Re_c=400\,000$. (The superscript of ‘ref ’ represents the reference case without control.).
To clarify such control effects, we conduct the decomposition of skin-friction coefficients on the suction side (within  $0.2\le x/c \le 0.85$) of NACA4412 by the RD identity. Note that the relative errors,
  $(C_{f,V}+C_{f,T}+C_{f,G}-C_f)/C_f$, where
  $C_f$ is directly calculated with the normal gradient of tangential velocity at the wall surface (i.e.
  $C_f=(\mu \partial U/\partial y)|_{wall}/(0.5\rho U_e^2)$), are well confined within
  $\pm 0.12\,\%$ for all cases considered, which confirms the reliability of the decomposition method.
Figure 2 shows the variations of  $C_{f,V}$,
  $C_{f,T}$ and
  $C_{f,G}$ induced by uniform blowing and suction with regard to the reference case, at
  $Re_c=200\,000$ (figure 2a–c) and
  $Re_c=400\,000$ (figure 2d–f). With blowing, the friction contribution of direct viscous dissipation (
 $C_{f,V}$) is reduced at both Reynolds numbers. Possibly, both the displacement-thickness increase and the outward wall-normal convection may be responsible for the
  $C_{f,V}$ reduction. With blowing, an increase of the generation of turbulence kinetic energy production (
 $C_{f,T}$) is found in figures 2(b) and 2(e). The variations of
  $C_{f,V}$ and
  $C_{f,T}$ are essentially associated with the influences on the wall-normal profiles of mean viscous shear stress and Reynolds shear stress across the wall layer.

Figure 2. Variation of ( $a$,
$a$, $d$)
$d$)  $C_{f,V}$, (
 $b$,
$b$, $e$)
$e$)  $C_{f,T}$ and (
 $c$,
$c$, $f$)
$f$)  $C_{f,G}$ with regard to the reference case on the suction side of an NACA4412 wing section at (
 $a$–
$a$– $c$)
$c$)  $Re_c=200\,000$ and (
 $d$–
$d$– $f$)
$f$)  $Re_c=400\,000$. (The legend in panel (a) refers to panels (
 $a$–
$a$– $c$), while that in panel (d) refers to panels (
 $d$–
$d$– $f$).).
As for the generation of the spatial growth ( $C_{f,G}$), it is decreased by the blowing and the influence on
  $C_{f,G}$ is stronger than that on
  $C_{f,V}$ and
  $C_{f,T}$. To further clarify the cause of such variation, we trace back to its sub-constituents in (2.2) and plot the variations of
  $C_{f,C}$,
  $C_{f,D}$ and
  $C_{f,P}$ in figure 3.

Figure 3. Variation of ( $a$,
$a$, $d$)
$d$)  $C_{f,C}$, (
 $b,e$)
  $C_{f,D}$ and (
 $c$,
$c$, $f$)
$f$)  $C_{f,P}$ with regard to the reference case on the suction side of an NACA4412 wing section at (
 $a$–
$a$– $c$)
$c$)  $Re_c=200\,000$ and (
 $d$–
$d$– $f$)
$f$)  $Re_c=400\,000$.
In the case with blowing, the generation of wall-normal convection ( $C_{f,C}$) is significantly decreased, owing to the amplified wall-normal velocity
  $V$ in the
  $C_{f,C}$ integrand. Vinuesa & Schlatter (Reference Vinuesa and Schlatter2017) pointed out that the effects of uniform blowing on the inner-scaled velocity profiles are similar to those of APG enhancement, which lead to a higher wall-normal velocity and stronger wall-normal convection in the wake region (Vinuesa et al. Reference Vinuesa, Negi, Atzori, Hanifi, Henningson and Schlatter2018). In the meanwhile, in the inner region, the wall-normal velocity is also increased as a direct consequence of the wall-normal mass flux. In the absolute reference frame with the local mean velocity being
  $U-U_e$, the work done by the wall-normal convection of
  $V\partial U/\partial y$ is negative. The enhanced wall-normal-velocity profile by blowing yields a negative (i.e. decreased) contribution to the generation of skin friction. Such a phenomenon is also observed as the magnitude of the pressure gradient increases, as shown in figure 12 in Senthil et al. (Reference Senthil, Kitsios, Sekimoto, Atkinson and Soria2020). In figure 3(b,e), the contribution by streamwise gradients is shown to be increased by blowing, which results from the stronger streamwise development of boundary layer thickness. This is consistent with the von Kármán integral momentum equation (von Kármán Reference von Kármán1921; Goldschmied Reference Goldschmied1951; Stroh et al. Reference Stroh, Hasegawa, Schlatter and Frohnapfel2016), where the streamwise derivative of the momentum thickness acts as a positive contribution to
  $C_f$ and will increase
  $C_f$ when it is increased by blowing. At last,
  $C_{f,P}$, which plays a significant role and contributes negatively to
  $C_f$ in strong APG-TBLs (Senthil et al. Reference Senthil, Kitsios, Sekimoto, Atkinson and Soria2020), is observed to be decreased by blowing, owing to the direct effect of an increased adverse pressure gradient. A slight increase of
  $C_{f,P}$ is observed near the trailing edge for the blowing cases (see figure 3c), which is associated with the fact that the boundary layer is approaching the condition of mean separation (Atzori et al. Reference Atzori, Vinuesa, Fahland, Stroh, Gatti, Frohnapfel and Schlatter2020). Generally, the positive variation of
  $C_{f,D}$ is overcome by the negative influence on
  $C_{f,C}$ and
  $C_{f,P}$, which consequently leads to the overall reduction of
  $C_{f,G}$ by blowing (Mahfoze et al. Reference Mahfoze, Moody, Wynn, Whalley and Laizet2019), as shown in figures 2(c) and 2(f).
In § 3.2, we will further analyse the wall-normal distributions of these friction constituents to better relate them to control-induced changes of the boundary layer properties. With mass suction, the control effects on the  $C_f$ constituents shown in figures 2 and 3 are opposite to those with blowing. Results of control effects on the contribution of
  $C_{f,V}$,
  $C_{f,T}$,
  $C_{f,G}$ and its constituents are summarized in table 2. Here we did not add more discussions on the suction cases for brevity.
Table 2. Summary of control effects on the generation of skin friction and its decomposed constituents on the suction side of the NACA4412 case.
To assess the control effects on the streamwise integrated skin-friction drag over the control surface, a parameter  $\bar {D}_{f,i}$ is introduced:
 \begin{equation} \bar{D}_{f,i}=\int_{\varOmega_{ctr}}{\tau_{w,i}}(\boldsymbol{t} \boldsymbol{\cdot} \boldsymbol{k})\,\textrm{d}\xi, \end{equation}
where  ${\tau _{w,i}}=C_{f,i}\cdot (0.5\rho U_e^2)$ is the decomposed component of wall-shear stress, with the subscript ‘i’ working as a label to denote each
  $C_f$ constituent, i.e. ‘V ’, ‘T’, ‘G’, ‘C’, ‘D’ and ‘P’ as mentioned in (2.1) and (2.2),
  $\boldsymbol {t}$ and
  $\boldsymbol {k}$ denote the unit vectors tangential to the airfoil surface and along the free-stream direction, respectively,
  $\xi$ is the curvilinear coordinate along the airfoil surface and
  $\varOmega _{ctr}$ represents the area of the control surface. The change rate of
  $\bar {D}_{f,i}$, with respect to the uncontrolled reference case, is then defined as
 \begin{equation} R_i=\frac{(\bar{D}_{f,i}-\bar{D}_{f,i}^{ref})}{\bar{D}_{f}^{ref}}. \end{equation}
 Figure 4 shows the result of  $R_i$ under different control schemes at
  $Re_c=200\,000$ and
  $400\,000$. It can be seen that
  $R_i$ appears to scale linearly, for the chosen low actuation amplitudes within
  $-40.2\,\% \leq V_{wall}/U_\infty \leq 0.2\,\%$, with the control intensity of the blowing/suction. However, note that this might not always be true when
  $V_{wall}/U_\infty$ becomes much larger and needs to be validated in the future work. Among the decomposed constituents, the most significant control effect lies on the friction constituent of spatial growth of the flow (
 $C_{f,G}$), with its sub-constituents primarily correlated with the convection, streamwise growth and pressure gradient in the outer region (Fan et al. Reference Fan, Li, Atzori, Pozuelo, Schlatter and Vinuesa2020a). This reveals that the drag control via blowing and suction significantly influences the turbulence properties in the outer layer. Moreover, weak-Reynolds-number effects are found, especially for
  $R_V$ and
  $R_G$, where a stronger control effect is achieved at higher Reynolds number which, to some extent, validates the theoretical estimation by Kametani & Fukagata (Reference Kametani and Fukagata2011).

Figure 4. The change rate of streamwise integrated friction drag over the control surface, as a function of control intensity ( $V_{wall}/U_\infty$), on the suction side of an NACA4412 wing section.
3.2. Wall-normal distributions of the  $C_f$ constituents

To answer the question about how uniform blowing/suction specifically influences the sources of skin-friction generation, the wall-normal distributions of the decomposed  $C_f$ constituents across the boundary layer are investigated. As
  $C_f$ and its constituents vary along the streamwise direction on the wing surface, we only discuss the wall-normal contributions of the
  $C_f$ constituents at
  $x/c \approx 0.75$, where the friction Reynolds numbers are
  $Re_\tau \approx 224$,
  $205$,
  $180$,
  $237$,
  $245$,
  $362$,
  $332$ and
  $387$ in the cases of ‘
 $Re200k, ss, ref$’, ‘
 $Re200k, ss, blw1$’, ‘
 $Re200k, ss, blw2$’, ‘
 $Re200k, ss, sct1$’, ‘
 $Re200k, ss, sct2$’, ‘
 $Re400k, ss, ref$’, ‘
 $Re400k, ss, blw1$’ and ‘
 $Re400k, ss, sct1$’, respectively. Similar conclusions can be drawn at other positions within
  $0.2\le x/c \le 0.85$, and the results are not shown here for simplicity.
The  $C_f$ constituents are expressed in inner scales as
 $$\begin{gather} {C_{f,V}} = 2/U_e^{{+}3}\int_{0}^{\infty}\left(\frac{\partial U^+}{\partial y^+}\right)^2\textrm{d} y^+, \end{gather}$$
 $$\begin{gather}{C_{f,T}} = 2/U_e^{{+}3} \int_{0}^{\infty}\langle -u'v'\rangle ^+\frac{\partial U^+}{\partial y^+}\,\textrm{d} y^+, \end{gather}$$
 $$\begin{gather}{C_{f,G}} = 2/U_e^{{+}3} \int_{0}^{\infty}(U^+{-}U_e^+)\frac{\partial}{\partial y^+}\left(\frac{\partial U^+}{\partial y^+}-\langle u'v'\rangle ^+\right)\textrm{d} y^+, \end{gather}$$
where the superscript  $+$ denotes normalization by viscous units, i.e. friction velocity
  $u_\tau$ and viscous length scale
  $\delta _\nu =\nu /u_\tau$.
Figure 5 shows the wall-normal distributions of the pre-multiplied integrand of  $C_{f,V}$,
  $C_{f,T}$ and
  $C_{f,G}$ in (3.3)–(3.5) as a function of
  $y^+$. The semi-logarithmic plots retain the advantage that the areas beneath the curves directly yield the total generation of the constituents. Comparisons among figures 5(a)–5(c) for the cases at
  $Re_c=200\,000$ and 5(d)–5(f) for the cases at
  $Re_c=400\,000$ confirm that the Reynolds number variation does not change the conclusions, which will be presented in the following from a qualitative perspective.

Figure 5. Pre-multiplied integrands of ( $a$,
$a$, $d$)
$d$)  $C_{f,V}$, (
 $b$,
$b$, $e$)
$e$)  $C_{f,T}$ and (
 $c$,
$c$, $f$)
$f$)  $C_{f,G}$ at
  $x/c\approx 0.75$ as a function of
  $y^+$ on the suction side of an NACA4412 wing section at (
 $a$–
$a$– $c$)
$c$)  $Re_c=200\,000$ and (
 $d$–
$d$– $f$)
$f$)  $Re_c=400\,000$.
For the distribution of  $C_{f,V}$ contributions, two peaks are respectively observed in the near-wall and outer region of the APG-TBLs. Most of the
  $C_{f,V}$ contributions come from the inner region (
 $y^+<30$), which indicates that the viscous dissipation is mostly concentrated in the near-wall region, as expected. In the meantime, a secondary peak appears in the outer region, which probably arises from the energy enhancement by APG (Sanmiguel Vila et al. Reference Sanmiguel Vila, Vinuesa, Discetti, Ianiro, Schlatter and Örlü2020; Tanarro et al. Reference Tanarro, Vinuesa and Schlatter2020). The secondary peak is absent in the ZPG-TBLs even at higher friction Reynolds number up to
  $Re_\tau =1270$ (Fan et al. Reference Fan, Li and Pirozzoli2019b). When uniform blowing/suction is applied, the locations of the inner peaks are fixed at a wall-normal distance of
  $y^+\approx 5.0 - 6.0$, regardless of the control scheme. In the blowing cases, the inner peak of
  $C_{f,V}$ contributions is reduced whereas the outer peak is increased, suggesting a lowered mean shear in the near-wall region while this is enhanced in the outer region owing to the lifting-up of the boundary layer (Kornilov Reference Kornilov2015), which is also validated by showing the wall-normal gradient of the tangential velocity in figures 6(a) and 6(c). This reveals that blowing has different actions in different sub-layers, namely inhibiting the contribution of inner-layer dynamics to skin-friction generation while promoting that of outer-layer dynamics. When the blowing intensity is increased up to 0.2 %, the outer-layer contributions seem to be comparable to the inner-layer contributions. However, suction behaves quite the opposite for all constituents, which will not be repeated hereafter.

Figure 6. Profiles of ( $a$,
$a$, $c$) wall-normal velocity gradient and (
 $b$,
$b$, $d$) Reynolds shear stress on the suction side of an NACA4412 wing section at (
 $a$,
$a$, $b$)
$b$)  $Re_c=200\,000$ and (
 $c$,
$c$, $d$)
$d$)  $Re_c=400\,000$.
Similar inner and outer peaks are also observed in the pre-multiplied distribution of  $C_{f,T}$ contributions, as shown in figures 5(b) and 5(e), with the former well collapsed at the inner-scaled wall-normal distance
  $y^+\approx 16.0 - 17.0$. It can be found that the outer-layer motions dominate the contributions of
  $C_{f,T}$, although the
  $Re_\tau$ is lower than
  $400$, which is very different from the features in the ZPG-TBLs (Fan et al. Reference Fan, Li and Pirozzoli2019b). The prominent peak in the outer region suggests the energization of large-scale outer motions by APGs (Harun et al. Reference Harun, Monty, Mathis and Marusic2013). When blowing is applied, the inner peak of the
  $C_{f,T}$ contributions is reduced, while the outer peak is increased. This phenomenon is linked to the wall-normal distributions of the wall-normal velocity gradient and Reynolds shear stress, as shown in figure 6. With blowing, the wall-normal velocity gradients are suppressed significantly in the near-wall region, which probably results from the lifting-up of the boundary layer. In the outer region, the amplified Reynolds shear stress is observed by blowing, which partially arises from the process where the near-wall small-scale structures are convected to the outer layer (Tanarro et al. Reference Tanarro, Vinuesa and Schlatter2020). However, the mean shear in the outer region is increased, which also contributes to the production of Reynolds stress, because the velocity difference across the mean shear can basically yield coherent structures that are larger than the Corrsin scale and thus promotes the kinetic energy of turbulence fluctuations (Corrsin Reference Corrsin1958; Dong et al. Reference Dong, Lozano-Durán, Sekimoto and Jiménez2017; Jiménez Reference Jiménez2018). These two actions of mean velocity and Reynolds stress are consequently responsible for the changes of the inner and outer peaks in the distribution of
  $C_{f,T}$ contributions.
As for the distribution of  $C_{f,G}$ contributions in figures 5(c) and 5(f), negative contributions are observed in the region
  $y^+\lesssim 80$ for the uncontrolled reference case at
  $Re_c=200\,000$ (
 $y^+\lesssim 130$ at
  $Re_c=400\,000$) and positive values are observed beyond this region. This differs from the result in the ZPG-TBLs, for which
  $C_{f,G}$ always remains positive across the wall layer (Fan et al. Reference Fan, Li, Atzori, Pozuelo, Schlatter and Vinuesa2020a). Blowing enhances both the negative and positive distributions, as the strengthened adverse pressure gradient promotes a more pronounced growth of the boundary layer and a more prominent outer region (Vinuesa et al. Reference Vinuesa, Negi, Atzori, Hanifi, Henningson and Schlatter2018).
In contrast to the wall-normal distributions as a function of  $y^+$ shown in figure 5, figure 7 plots their profiles as a function of
  $y/\delta _{99}$. The outer-peak locations of
  $C_{f,V}$,
  $C_{f,T}$ and
  $C_{f,G}$ contributions normalized by the outer scale are well collapsed at
  $y/\delta _{99}\approx 0.7$,
  $0.53$ and
  $0.65$, respectively, as marked with vertical dashed lines in figure 7, regardless of the control scheme and Reynolds number. These phenomena are consistent with our previous finding (Fan et al. Reference Fan, Li, Atzori, Pozuelo, Schlatter and Vinuesa2020a), i.e. the inner-peak locations (in
  $C_{f,V}$ and
  $C_{f,T}$ contributions) exhibit good scaling in the inner unit (
 $\delta _\nu$), and the outer-peak locations in the outer unit (
 $\delta _{99}$), regardless of the friction Reynolds number, the magnitude of the APG and its development history. This finding suggests that self-similarity is exhibited in the inner or outer scales for the turbulence statistics associated with the friction-drag generation.

Figure 7. Pre-multiplied integrands of ( $a$,
$a$, $d$)
$d$)  $C_{f,V}$, (
 $b$,
$b$, $e$)
$e$)  $C_{f,T}$ and (
 $c$,
$c$, $f$)
$f$)  $C_{f,G}$ as a function of
  $y/\delta _{99}$, on the suction side of an NACA4412 wing section at (
 $a$–
$a$– $c$)
$c$)  $Re_c=200\,000$ and (
 $d$–
$d$– $f$)
$f$)  $Re_c=400\,000$.
The generation of  $C_{f,G}$ results from a counterbalance between the negative work done by
  $C_{f,C}$ and
  $C_{f,P}$ and the positive work by
  $C_{f,D}$. Figure 8 quantifies their wall-normal distributions and only the outer scaling by
  $\delta _{99}$ is applied herein. Good collapses of the peak locations are also observed at
  $y/\delta _{99}\approx 0.59$,
  $0.56$ and
  $0.43$ for
  $C_{f,C}$,
  $C_{f,D}$ and
  $C_{f,P}$ contributions, respectively. In the blowing cases, the APG effects are strengthened, a fact that promotes the population/energization of outer-layer structures (Harun et al. Reference Harun, Monty, Mathis and Marusic2013). Meanwhile, the wall-normal convection and the streamwise boundary-layer growth are intensified in the outer region (Vinuesa et al. Reference Vinuesa, Negi, Atzori, Hanifi, Henningson and Schlatter2018). Therefore, in an absolute sense, the generations of the components (
 $C_{f,C}$,
  $C_{f,D}$ and
  $C_{f,P}$) are all enhanced. Thereinto, as the convection and pressure gradient do negative work for the friction-drag generation, blowing acts to reduce the
  $C_{f,C}$ and
  $C_{f,P}$ contributions. However, the positive contribution of
  $C_{f,D}$ is increased, as shown in figures 8(b) and 8(e). These three components counterbalance each other, as summarized in table 3. Consequently, the negative
  $C_{f,C}$ and
  $C_{f,P}$ contributions are responsible for the
  $C_{f,G}$ reduction in the near-wall region, whereas the positive
  $C_{f,D}$ contributions are responsible for the increase of
  $C_{f,G}$ in the outer region, as seen in figures 5(c) and 5(f).

Figure 8. Pre-multiplied integrands of ( $a$,
$a$, $d$)
$d$)  $C_{f,C}$, (
 $b$,
$b$, $e$)
$e$)  $C_{f,D}$ and (
 $c$,
$c$, $f$)
$f$)  $C_{f,P}$ as a function of
  $y/\delta _{99}$, on the suction side of an NACA4412 wing section at (
 $a$–
$a$– $c$)
$c$)  $Re_c=200\,000$ and (
 $d$–
$d$– $f$)
$f$)  $Re_c=400\,000$.
Table 3. Summary of control effects on the wall-normal distribution of  $C_{f,G}$ and its constituents.

3.3. Contributions of small- and large-scale structures to the friction-drag generation
First, we use EMD (Huang et al. Reference Huang, Shen, Long, Wu, Shih, Zheng, Yen, Tung and Liu1998) to identity the small- and large-scale turbulence structures. EMD is an adaptive mode-decomposition technique, which extracts characteristic wavelengths of non-stationary signals automatically without a priori basis functions. It has been applied for wall-bounded turbulence (Agostini & Leschziner Reference Agostini and Leschziner2014, Reference Agostini and Leschziner2019; Cheng et al. Reference Cheng, Li, Lozano-Durán and Liu2019; Dogan et al. Reference Dogan, Örlü, Gatti, Vinuesa and Schlatter2019) and details of the methodology of EMD can be found in Huang et al. (Reference Huang, Shen, Long, Wu, Shih, Zheng, Yen, Tung and Liu1998). Here we just describe EMD very briefly.
With EMD, a raw temporal or spatial signal  $f(t)$ is decomposed into a sum of multiple intrinsic mode functions (IMFs) with a residual
  $R(t)$:
 \begin{equation} f(t)=\sum_{i=1}^{m}\textrm{IMF}_i(t)+R(t), \end{equation}
where  $m$ is the number of IMFs. The IMFs are obtained through a sifting procedure in a data-driven manner. They represent components with different wavelengths or scales in the full field. In this study, the velocity fluctuations (
 $u'$ and
  $v'$) at the streamwise location
  $x/a\approx 0.75$ are decomposed into four modes (three IMFs with a final residual). The first two modes represent the small-scale structures and the others characterize the large scales, which is justified based on a preliminary analysis (similar to the studies of Agostini & Leschziner Reference Agostini and Leschziner2014, Reference Agostini and Leschziner2019).
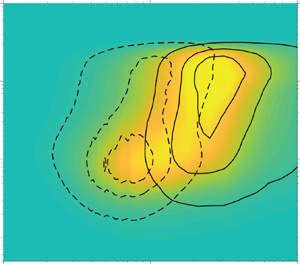
The contours of spanwise pre-multiplied spectra of  $u'$ and
  $v'$ scaled with friction velocities are plotted in figure 9 for the
  $Re_c=400\,000$ cases. Similar features can also be found in the low-Reynolds-number (
 $Re_c=200\,000$) cases, which are not shown here for brevity. In figure 9, the iso-contour levels marked with dashed and solid lines represent the spectra of small- and large-scale velocity fluctuations, respectively. These contour lines indicate 0.12, 0.42 and 0.72 of their maxima, from outside to inside. For the reference case, as shown in figure 9(a), the spectra of small-scale
  $u'$ structures peak at the wall-normal distance
  $y^+\approx 10$ with a spanwise wavelength
  $\lambda _z^+\approx 80$, and those of large-scale
  $u'$ structures peak at
  $y^+\approx 100$ (
 $y/\delta _{99}\approx 0.28$) with
  $\lambda _z^+\approx 310$ (
 $\lambda _z / \delta _{99}\approx 0.85$). This observation is consistent with the study of Cheng et al. (Reference Cheng, Li, Lozano-Durán and Liu2019), where small-scale
  $u'$ structures identified by EMD are representative of the near-wall coherent motions, whereas the large-scale
  $u'$ structures characterize large-scale motions.

Figure 9. Spanwise pre-multiplied spectra of the tangential and normal velocity fluctuations on the suction side of an NACA4412 wing section at  $Re_c=400\,000$ (
 $a$,
$a$, $d$) without control, with (
 $b$,
$b$, $e$) uniform blowing and (
 $c$,
$c$, $f$) uniform suction. The nephogram represents the spectra of the full field; the dashed and solid contour lines represent those of small and large scales, respectively.
When blowing/suction is applied on the airfoil surface, such energy spectra are affected, as seen in figures 9(b) and 9(c). In the case of blowing, the small-scale structures are enhanced and penetrate deeper into the outer region. The peaks of the spectra locate at  $(\lambda _z^+,y^+)\approx (80,8)$. Whereas suction has an opposite influence on the amplitude of small scales, with the peak locations only slightly influenced at
  $(\lambda _z^+,y^+)\approx (90,10)$. As for the large-scale structures, they are enhanced by blowing, which agrees well with the conclusion drawn by Kametani et al. (Reference Kametani, Fukagata, Örlü and Schlatter2015). The peaks of the large-scale spectra locate at
  $(\lambda _z/\delta _{99},y/\delta _{99})\approx (0.96,0.33)$. As shown in figure 9(c), suction trends to diminish the secondary peak in the outer region with the peak at
  $(\lambda _z/\delta _{99},y/\delta _{99})\approx (0.93, 0.35)$.
As for the  $v'$ structures shown in figures 9(d)–9(f), the small- and large-scale structures have approximately the same spanwise wavelengths as the
  $u'$ structures, which is consistent with the EMD results of channel flows (Cheng et al. Reference Cheng, Li, Lozano-Durán and Liu2019), suggesting that the decomposed two scales of
  $u'$ and
  $v'$ structures can be characterized with the same spanwise wavelength. Both the small- and large-scale
  $v'$ structures are greatly enhanced by blowing while they are reduced by suction. However, the wall-normal locations of the
  $v'$ structures are much different from those of
  $u'$ structures, because the presence of the wall prevents the normal velocity fluctuations from extending close to the near-wall region, in contrast to the wall-parallel component
  $u'$. As shown in figures 9(d)–9(f), the small-scale spectra of
  $v'$ are more intense beyond the buffer layer at
  $y^+\approx 50$, with the spanwise wavelength scale
  $\lambda _z^+$ peaking at approximately
  $80$–
$80$– $100$ for all of the three cases, and the large-scale
  $v'$ spectra peak at approximately
  $(\lambda _z/\delta _{99},y/\delta _{99})\approx (0.9,0.35)$.
Hereafter, we denote the small- and large-scale tangential and wall-normal velocity fluctuations as  $u_s'$,
  $u_l'$,
  $v_s'$ and
  $v_l'$, respectively. Then the Reynolds stress is decomposed as
 \begin{equation} -\langle u'v'\rangle ={-}\langle u_s'v_s'\rangle -\langle u_s'v_l'\rangle -\langle u_l'v_s'\rangle -\langle u_l'v_l'\rangle , \end{equation}
where  $-\langle u_s'v_s'\rangle$ represents the Reynolds stress carried by small-scale structures,
  $-\langle u_l'v_l'\rangle$ represents the Reynolds stress associated with large-scale structures, and
  $-\langle u_s'v_l'\rangle$ and
  $-\langle u_l'v_s'\rangle$ denote the scale interactions from small- to large- and from large- to small-scale structures, respectively. Their wall-normal profiles, normalized by outer units, are plotted in figure 10. Significant modifications are observed in the outer region, especially for the large-scale motions. Blowing enhances the generation of large-scale motions in the outer region, whereas suction weakens it, in accordance with the phenomenon in figure 9. Meanwhile, the Reynolds stress carried by small scales is also amplified/suppressed by blowing/suction in the outer region. Within the region of
  $y/\delta _{99}<0.1$, the control impact is hardly recognizable, as directly perceived in figure 6(d).

Figure 10. Profiles of Reynolds shear stress and its decomposed components in (3.7) on the suction side of an NACA4412 wing section at  $Re_c=400\,000$: (
 $a$) without control; with (
 $b$) uniform blowing and (
 $c$) uniform suction.
Substituting these Reynolds-stress components into (3.4), the term of TKE production ( $C_{f,T}$) can be further divided into four parts, viz.
 $$\begin{gather} {C_{f,T,s\text{-}s}} = 2/U_e^{{+}3}\int_{0}^{\infty}\langle -u_s'v_s'\rangle ^+\frac{\partial U^+}{\partial y^+}\,\textrm{d} y^+, \end{gather}$$
 $$\begin{gather}{C_{f,T,s\text{-}l}} = 2/U_e^{{+}3}\int_{0}^{\infty} \langle -u_s'v_l'\rangle ^+\frac{\partial U^+}{\partial y^+}\,\textrm{d} y^+, \end{gather}$$
 $$\begin{gather}{C_{f,T,l\text{-}s}} = 2/U_e^{{+}3}\int_{0}^{\infty} \langle -u_l'v_s'\rangle ^+\frac{\partial U^+}{\partial y^+}\,\textrm{d} y^+, \end{gather}$$
 $$\begin{gather}{C_{f,T,l\text{-}l}} = 2/U_e^{{+}3}\int_{0}^{\infty} \langle -u_l'v_l'\rangle ^+\frac{\partial U^+}{\partial y^+}\,\textrm{d} y^+. \end{gather}$$
 Similar to the analysis in § 3.2, we show the wall-normal distributions of the  $y^+$-pre-multiplied integrands in (3.8)–(3.11) in figure 11. The wrinkles in figure 11(c) are caused by the limited number of flow snapshots used in EMD. This arises from the data-storage limitations that prevent the acquisition of a full-time series, even though the total simulation time is approximately the same for all cases. For the reference case without control, the small-scale motions play important roles both in the inner and outer regions, as two comparable peaks are respectively observed there, as seen in figure 11(a). This is different from the phenomenon in channel flows (Agostini & Leschziner Reference Agostini and Leschziner2019) and ZPG-TBLs, because the APG strengthens the energy of small-scale structures in the outer region (Tanarro et al. Reference Tanarro, Vinuesa and Schlatter2020). Whereas the large-scale structures dominate the production of
  $C_{f,T}$ in the outer region, which is associated with the enhanced generation of large-scale motions in APG-TBLs (Lee & Sung Reference Lee and Sung2008; Harun et al. Reference Harun, Monty, Mathis and Marusic2013; Vinuesa et al. Reference Vinuesa, Negi, Atzori, Hanifi, Henningson and Schlatter2018). When blowing is applied, the distributions of the
  $C_{f,T,s\text {-}s}$ contribution and
  $C_{f,T,l\text {-}l}$ contribution in the outer region are shifted upwards, which suggests that the wall-normal mass flux enhances the outer fluctuations of both small- and large-scale structures. Comparison between
  $C_{f,T,s\text {-}s}$ and
  $C_{f,T,l\text {-}l}$ indicates that the blowing raises the relative importance of large scales with respect to the small ones. In addition, the contribution of the scale interaction from small to large scales (
 $C_{f,T,s\text {-}l}$) is of the same order of that from large to small scales (
 $C_{f,T,l\text {-}s}$), in general. They are observed to be mainly in the outer region and are not sensitive to the control schemes, which indicates that the explicit interaction between scales does not rely much on the wall mass flux in spite of the significant control impacts on small and large scales. In the study by Cheng et al. (Reference Cheng, Li, Lozano-Durán and Liu2019), they also used EMD to separate the skin-friction contributions by scale-specific motions. It was shown that the terms resulting from the small- and large-scale interactions barely change with the Reynolds number, although the large-scale motions are definitely enhanced as the Reynolds number increases. This is a very interesting phenomenon and further investigations are expected especially on the scale interactions.

Figure 11. Pre-multiplied integrands of  $C_{f,T,i}$ as a function of
  $y^+$ on the suction side of an NACA4412 wing section at
  $Re_c=400\,000$: (
 $a$) without control; with (
 $b$) uniform blowing and (
 $c$) uniform suction. Note that the premultiplication factor is
  $y^+$.
To further check the role of small- and large-scale motions in the generation of TKE production, figure 12 quantifies their integrations normalized by  $C_{f,T}$ itself. We can find that the blowing and suction have opposite influences on the contributions of small- and large-scale motions, that is, blowing is able to enhance the contribution of large-scales and to suppress the contribution of small-scales, whereas suction behaves contrarily. As for the scale interactions, i.e.
  $C_{f,T,s\text {-}l}$ and
  $C_{f,T,l\text {-}s}$, they account for approximately 20 % of the total
  $C_{f,T}$ and remain almost unchanged with different control strategies.

Figure 12. Scale-specific contributions ( $C_{f,T,s\text {-}s}$,
  $C_{f,T,s\text {-}l}$,
  $C_{f,T,l\text {-}s}$ and
  $C_{f,T,l\text {-}l}$ normalized by
  $C_{f,T}$ itself) on the suction side of an NACA4412 wing section at
  $Re_c=400\,000$: (
 $a$) without control; with (
 $b$) uniform blowing and (
 $c$) uniform suction.
4. Friction-drag decomposition on the pressure side
In this section, we pay attention to the pressure side of an NACA4412 wing section, where the TBLs are subjected to favourable pressure gradients (FPGs). Figure 13 shows the skin-friction coefficients and their variation with regard to the reference case on the pressure side of the airfoil. In spite of the favourable pressure gradients, blowing is still able to reduce the friction drag, whereas the skin-friction coefficients are no longer decreased monotonously with regard to  $x/c$ if compared with those on the suction side of the airfoil, which may be caused by the coupling influences of
  $Re_\tau$ and FPGs (Atzori et al. Reference Atzori, Vinuesa, Fahland, Stroh, Gatti, Frohnapfel and Schlatter2020). The relative errors
  $([C_{f,V}+C_{f,T}+C_{f,G}-C_f]/C_f)$ of the friction-drag decomposition are limited to within
  $\pm$0.03 %.

Figure 13. ( $a$) Skin-friction coefficients and (
 $b$) their variation with regard to the reference case on the pressure side of the NACA4412 wing section at
  $Re_c=200\,000$.
Key points of the decomposition results on the pressure side, including their quantitative difference from those on the suction side, are listed as follows.
(i) The variations of
$C_{f,V}$, $C_{f,T}$ and $C_{f,G}$ (see figure 14a–c) are similar to the results on the suction side, that is, by blowing, $C_{f,V}$ and $C_{f,T}$ are decreased, and $C_{f,G}$ is reduced. As for the sub-constituents of $C_{f,G}$ in figures 14(d)–14(f), blowing reduces $C_{f,C}$, similar to the observations on the suction side; however, differently, blowing just increases $C_{f,D}$ until $x/c \approx 0.85$ and then decreases; in contrast to the control effects on the suction side, $C_{f,P}$ is increased, which suggests that blowing strengthens the FPG on the pressure side of the NACA4412. Stronger intensity of blowing leads to larger increases or decreases of the constituents.(ii) Again, a near-linear dependence of
$R_i$ on the intensity of blowing is still observed within the limited range of $V_{wall}/U_\infty$ under scrutiny, as seen in figure 15. However, the specific quantities of $R_G$ and its constituents ($R_C$, $R_D$ and $R_P$) are very different from those on the suction side.(iii) At
$x/c\approx 0.75$ (similar features are observed at other positions), the wall-normal distributions of the $C_f$ constituents are plotted in figure 16. Quite similar to the results shown in figures 5(a) and 5(d), the inner-layer mean shear is reduced by blowing and yields less dissipation. With the presence of the FPG, the outer peak of $C_{f,V}$ is barely noticeable and the outer peak of $C_{f,T}$ is comparable to the inner one. These are different from the results on the suction side. With blowing, the outer peak of $C_{f,T}$ is also increased but by a lesser amount, because the FPG attenuates the outer-layer Reynolds shear stress and the production of TKE (Harun et al. Reference Harun, Monty, Mathis and Marusic2013). In figure 16(c), uniform blowing causes the negative variation trends in the inner-layer contribution of spatial growth to the generation of local skin friction ($C_{f,G}$), whereas their variation is positive in the outer region.(iv) The control effects on the wall-normal distributions of the components are presented in figure 17. Different from the observation in figure 8, the generation of
$C_{f,C}$ mainly arises from the inner-layer dynamics on the pressure side of the airfoil, for instance $y/\delta _{99}<0.2$ (i.e. $y^+<30$). This is because the outer-layer wall-normal motions are weakened by the FPG. The contribution of streamwise development $C_{f,D}$, as shown in figure 17(b), is also increased in the outer region. At last, on the pressure side, the pressure gradient $C_{f,P}$ contributes positively to the skin-friction generation and is increased by blowing, directly resulting from the strengthening of the FPG. Opposing blowing effects on $C_{f,C}$, $C_{f,D}$ and $C_{f,P}$ counterbalance each other and finally inhibit the contribution of inner-layer dynamics to the skin-friction drag generation while promoting that of outer-layer turbulence.(v) The peak locations in figures 16 and 17 are well collapsed when normalized by inner or outer units. It suggests that the self-similar features of turbulence statistics will not be affected by the presence of the FPG. Note that the distributions in figures 16(a)–16(c) are not plotted as a function of
$y / \delta _{99}$ because the friction Reynolds numbers of these three cases at $x/c\approx 0.75$ are very similar, being $Re_\tau \approx 177$, $185$ and $187$ in the cases of ‘$Re200k, ps, ref$’, ‘$Re200k, ps, blw1$’ and ‘$Re200k, ps, blw2$’, respectively.


Figure 14. Variation of ( $a$)
$a$)  $C_{f,V}$, (
 $b$)
$b$)  $C_{f,T}$, (
 $c$)
$c$)  $C_{f,G}$, (
 $d$)
$d$)  $C_{f,C}$, (
 $e$)
$e$)  $C_{f,D}$ and (
 $f$)
$f$)  $C_{f,P}$ with regard to the reference case on the pressure side of the NACA4412 wing section at
  $Re_c=200\,000$.

Figure 15. The change rate of streamwise integrated friction drag over the control surface, as a function of control intensity ( $V_{wall}/U_{\infty }$), on the pressure side of NACA4412.

Figure 16. Pre-multiplied integrands of ( $a$)
$a$)  $C_{f,V}$, (
 $b$)
$b$)  $C_{f,T}$ and (
 $c$)
$c$)  $C_{f,G}$, as a function of
  $y^+$, on the pressure side of an NACA4412 wing section at
  $Re_c=200\,000$.

Figure 17. Pre-multiplied integrands of ( $a$)
$a$)  $C_{f,C}$, (
 $b$)
$b$)  $C_{f,D}$ and (
 $c$)
$c$)  $C_{f,P}$, as a function of
  $y/\delta _{99}$, on the pressure side of an NACA4412 wing section at
  $Re_c=200\,000$.
At last, EMD was not conducted, because the inner–outer scale separation was less evident in the FPG-TBLs at such low  $Re_\tau$ than those on the suction side of the airfoil.
5. Conclusion
We employed the RD identity in conjunction with EMD to reveal the sources of skin-friction generation and study the control effects of uniform blowing and suction on an NACA4412 airfoil at chord Reynolds numbers  $Re_c=200\,000$ and
  $400\,000$. In general, blowing reduces the mean friction drag and suction increases the friction drag, both on the suction and pressure sides of the airfoil. With the RD identity, the mean friction drag on the airfoil was decomposed into three components, associated with viscous dissipation (
 $C_{f,V}$), TKE production (
 $C_{f,T}$) and spatial growth of the flow (
 $C_{f,G}$). The
  $C_{f,G}$ component was further decomposed into three terms related to the mean wall-normal convection (
 $C_{f,C}$), streamwise development (
 $C_{f,D}$) and the pressure gradient (
 $C_{f,P}$). The effects of suction on these
  $C_f$ constituents were quite opposite to those of blowing, thus we just summarize the key conclusions in the blowing cases.
For the adverse-pressure-gradient turbulent boundary layers on the suction side of the airfoil, blowing reduces the generation of  $C_{f,V}$ and
  $C_{f,G}$, while increases that of
  $C_{f,T}$. The drag reduction with blowing is mostly attributed to
  $C_{f,G}$, which results from the decreased
  $C_{f,C}$ and
  $C_{f,P}$, which overwhelm the increase in
  $C_{f,D}$. The integrated
  $C_f$ constituents over the control surface are observed to be linearly dependent on the intensity of blowing and weakly influenced by the chord Reynolds number (at least within the parameters we considered).
We checked the wall-normal distributions of the  $C_f$ constituents at
  $x/c \approx 0.75$ to clarify how the control schemes impact the sources of friction-drag generation. With blowing, the generation of
  $C_{f,V}$, which is mainly related to the inner-layer dynamics, is suppressed in the inner region (
 $y^+<30$), while it is enhanced in the outer region. In contrast, the generation of
  $C_{f,T}$, mainly originating from the outer-layer motions, is amplified. These phenomena are linked to the variations of the wall-normal velocity gradients and Reynolds shear stresses in the wall-normal direction. The generation of
  $C_{f,G}$ results from a counterbalance between the negative work done by
  $C_{f,C}$ and
  $C_{f,P}$ and the positive work by
  $C_{f,D}$. Blowing is able to enhance the generation of all sub-components, as the strengthened adverse pressure gradient promotes a more pronounced growth of the boundary layer and a more prominent outer region (Vinuesa et al. Reference Vinuesa, Negi, Atzori, Hanifi, Henningson and Schlatter2018).
We found that in the wall-normal direction, the inner-peak locations of  $C_{f,V}$ and
  $C_{f,T}$ contributions scale well in the inner unit (
 $\delta _\nu$), and the outer-peak locations of
  $C_{f,V}$,
  $C_{f,T}$,
  $C_{f,G}$ as well as their sub-contributions, collapse well in the outer unit (
 $\delta _{99}$), regardless of the friction Reynolds number, control scheme and the intensity of blowing/suction. This reveals that self-similarity is exhibited in the inner or outer scales for the turbulence statistics associated with the friction-drag generation.
The small- and large-scale structures are separated with EMD, which aims to analyse the scale-specific contribution of turbulent motions to friction-drag generation. Results unveil that, normalized by  $C_{f,T}$ itself, blowing is able to enhance the contribution of large-scale motions and to suppress that of small scales; note that suction behaves contrarily. The contributions related to cross-scale interactions remain almost unchanged with different control strategies.
For the favourable-pressure-gradient turbulent boundary layers on the pressure side of the airfoil, the most significant observation is that the outer-layer motions are of less importance for the generation of  $C_f$ constituents. In the case of blowing, the generation of
  $C_{f,P}$ is increased, which is the opposite behaviour to that on the suction side of the airfoil.
Acknowledgements
The funding support of the National Natural Science Foundation of China (under the grant nos. 91952302 and 92052101) is acknowledged. D.G. acknowledges support by the state of Baden-Württemberg through bwHPC. M.A., R.V. and P.S. also acknowledge support from the Swedish Foundation for Strategic Research, project ‘In-Situ Big Data Analysis for Flow and Climate Simulations’ (ref. number BD15-0082), from the Knut and Alice Wallenberg Foundation and from the Swedish Research Council (VR). The simulations were performed on resources provided by the Swedish National Infrastructure for Computing (SNIC) and within the project CWING on the national supercomputer Cray XC40 Hazel Hen at the High Performance Computing Center Stuttgart (HLRS).
Declaration of interests
The authors report no conflict of interest.
Appendix A. Effects of the upper limit of wall-normal integration
By defining an arbitrary upper limit of wall-normal integration ( $y_u$), the RD identity is expressed as
 \begin{align} C_{f}^{cum}(y_u)&=\underbrace{\frac{2}{U_e^3}\int_{0}^{y_u}\nu \left(\frac{\partial U}{\partial y}\right)^2 \textrm{d} y}_{C_{f,V}^{cum}}+\underbrace{\frac{2}{U_e^3}\int_{0}^{y_u}-\langle u'v'\rangle \frac{\partial U}{\partial y} \,\textrm{d} y}_{C_{f,T}^{cum}}\nonumber\\ &\quad +\underbrace{\frac{2}{U_e^3}\int_{0}^{y_u}(U-U_e)\frac{\partial}{\partial y}\left(\nu\frac{\partial U}{\partial y}-\langle u'v'\rangle \right) \textrm{d} y}_{C_{f,G}^{cum}}, \end{align}
where  $C_{f,V}^{cum}$,
  $C_{f,T}^{cum}$ and
  $C_{f,G}^{cum}$ represent the cumulative contribution of dissipation, production and spatial growth above the wall, respectively. Their distributions are plotted in figures 18 and 19 as a function of
  $y_u/\delta _{99}$, for all the cases on the suction side of the NACA4412 case. Results show that all terms (
 $C_{f,V}$,
  $C_{f,T}$ and
  $C_{f,G}$) are well recovered when
  $y_u \ge \delta _{99}$. Therefore, the setting of
  $y_u \approx 5\delta _{99}$ is sufficient in the applications of (2.1) and (2.2).

Figure 18. Cumulative contribution of ( $a$)
$a$)  $C_{f,V}$, (
 $b$)
$b$)  $C_{f,T}$ and (
 $c$)
$c$)  $C_{f,G}$, as a function of
  $y_u/\delta _{99}$, on the suction side of NACA4412 at
  $Re_c=200\,000$. (The vertical dot-dash line denotes the wall-normal position of
  $y=\delta _{99}$.).

Figure 19. Cumulative contribution of ( $a$)
$a$)  $C_{f,V}$, (
 $b$)
$b$)  $C_{f,T}$ and (
 $c$)
$c$)  $C_{f,G}$, as a function of
  $y_u/\delta _{99}$, on the suction side of NACA4412 at
  $Re_c=400\,000$.


