


1. Introduction
High-speed droplet impacts on a solid surface may induce surface erosion that occurs in many technological situations, such as droplet collisions in nuclear power plant cooling systems (Okada et al. Reference Okada, Uchida, Naitoh, Xiong and Koshizuka2011), rain droplet impingement on high-speed vehicles (Adler Reference Adler1999) and the erosion of the last stage of steam turbine blades by wet steam (Ahmad Reference Ahmad2009).
The mechanism of surface erosion during high-speed droplet impingement has been widely studied. In general, there are several fluid hydrodynamics factors that may induce surface erosion during high-speed droplet impingement, including water-hammer shock waves, strong lateral jets, and cavitation, especially near-surface cavitation collapse. The accompanying high transient pressure first attracted researchers’ attention on droplet impacts. The earliest study was published by Cook (Reference Cook1928). It presented an estimation of the magnitude of initial high transient pressure for one-dimensional impingement, so-called water-hammer pressure. Subsequent studies improved the estimation of the speed of water-hammer shock waves and the value of water-hammer pressure (Bowden & Field Reference Bowden and Field1964; Heymann Reference Heymann1969; Huang, Hammitt & Mitchell Reference Huang, Hammitt and Mitchell1973; Korobkin & Pukhnachov Reference Korobkin and Pukhnachov1988; Bergant, Simpson & Tijsseling Reference Bergant, Simpson and Tijsseling2006). In conclusion, the water-hammer pressure of high-speed liquid impingement is related to the acoustic impedance of the liquid and proportional to the impinging velocity. When a liquid impacts a solid surface at a high speed (usually greater than  $50 \ \textrm {m}\ \textrm {s}^{-1}$ (Lesser Reference Lesser1995)), the induced water-hammer pressure is of the order of magnitude of the materials’ yield strength values (Ahmad, Casey & Sürken Reference Ahmad, Casey and Sürken2009), which may cause surface erosion under continuous droplet impact. Further investigation showed that the pressure distribution of the contact area of the initial impinging stage is non-uniform, and the maximum instantaneous pressure occurs at the periphery of the contact area before the shock wave overtakes the contact periphery (Rochester & Brunton Reference Rochester and Brunton1974; Evans, Ito & Rosenblatt Reference Evans, Ito and Rosenblatt1980; Mandre, Mani & Brenner Reference Mandre, Mani and Brenner2009; Xiong, Koshizuka & Sakai Reference Xiong, Koshizuka and Sakai2011; Han, Xie & Zhang Reference Han, Xie and Zhang2012). The critical angle that the shock wave overtakes and the instant when the lateral jet forms around the contact periphery were both discussed; these depend on the geometric profile of the droplet interface and the initial velocity of the impinging droplet (Haller et al. Reference Haller, Poulikakos, Ventikos and Monkewitz2003a; Haller, Ventikos & Poulikakos Reference Haller, Ventikos and Poulikakos2003b). The critical detaching angle of the shock wave is related to the strength and duration of high impact pressure (Field, Lesser & Dear Reference Field, Lesser and Dear1985; Rein Reference Rein1993). The velocity of a strong lateral jet around a contact periphery was observed to be many times higher than the initial impinging speed, which could be another main factor for surface damage (Haller et al. Reference Haller, Ventikos, Poulikakos and Monkewitz2002; Han et al. Reference Han, Xie and Zhang2012; Nykteri et al. Reference Nykteri, Koukouvinis, Avila, Ohl and Gavaises2019). Furthermore, unsteady complicated wave structures with different properties are generated inside the droplet as the confined shock wave continuously propagates and reflects from the droplet interface and the solid surface (Field, Dear & Ogren Reference Field, Dear and Ogren1989; Chizhov & Schmidt Reference Chizhov and Schmidt2000; Kondo & Ando Reference Kondo and Ando2016; Niu & Wang Reference Niu and Wang2016). Local cavitation may be generated inside the droplet due to the convergence of the proper waves, as verified by experiments (Lesser & Field Reference Lesser and Field1983; Field et al. Reference Field, Dear and Ogren1989, Reference Field, Camus, Tinguely, Obreschkow and Farhat2012; Obreschkow et al. Reference Obreschkow, Dorsaz, Kobel, de Bosset, Tinguely, Field and Farhat2011) and subsequent numerical simulations during high-speed impingement (Sanada, Ando & Colonius Reference Sanada, Ando and Colonius2011; Kondo & Ando Reference Kondo and Ando2016; Kyriazis, Koukouvinis & Gavaises Reference Kyriazis, Koukouvinis and Gavaises2018). The cavitation evolution mechanisms during a droplet's high-speed impingement on a flat solid surface were discussed in our previous works (Wu, Xiang & Wang Reference Wu, Xiang and Wang2018; Wu, Wang & Xiang Reference Wu, Wang and Xiang2019). Some researchers deduced that cavity collapse especially near-surface cavity collapse may also induce surface damage (Okada et al. Reference Okada, Iwai, Hattori and Tanimura1995; Obreschkow et al. Reference Obreschkow, Dorsaz, Kobel, de Bosset, Tinguely, Field and Farhat2011; Kyriazis et al. Reference Kyriazis, Koukouvinis and Gavaises2018). However, there is still a lack of reasonable explanation of near-surface cavitation evolution and its action mechanism on an impacted surface.
The geometrical structure of an impacted solid surface also plays an important role in the surface damage characteristics (Tomita et al. Reference Tomita, Robinson, Tong and Blake2002; Koch & Grichnik Reference Koch and Grichnik2016; Kondo & Ando Reference Kondo and Ando2019; Rajesh et al. Reference Rajesh, Naveen, Krishnakumar and Ranjith2019). For example, high-speed droplet impingement occurs in power plant pipes, and small holes are usually produced at the pipe surface where the pipe is bent, which is one of the major restraining factors for the equipment's lifetime (Li, Mori & Ninokata Reference Li, Mori and Ninokata2012). Moreover, in high-speed impingement experiments, repeated high-speed droplet impingement may deform a solid surface into a concave shape (Field et al. Reference Field, Lesser and Dear1985; Dear & Field Reference Dear and Field1988), as shown in figure 1. When a droplet impacts a deformed curved surface, further surface damage will be induced (Tomita et al. Reference Tomita, Robinson, Tong and Blake2002; Field et al. Reference Field, Camus, Tinguely, Obreschkow and Farhat2012). As shown in figures 1(a) and 1(b), repeated impacts produce a depression with a centre localised pit of damage, which can develop into deep channels. However, the physical mechanisms of the aforementioned phenomena are still not fully interpreted, and the analysis of the damage mechanism remains lacking (Obreschkow et al. Reference Obreschkow, Dorsaz, Kobel, de Bosset, Tinguely, Field and Farhat2011). Hence, it is necessary to provide an exhaustive analysis of the surface geometrical effect during high-speed droplet impingement.

Figure 1. Experimental results of the surface erosion induced by repeated high-speed impacts of liquid jets equivalent to the impact of a 5 mm diameter drop (10 impacts on a copper surface) (Field et al. Reference Field, Lesser and Dear1985):  $(a)$ top view;
  $(b)$ cross-sectional view. The top views of repeated impacts on a duraluminium surface (Dear & Field Reference Dear and Field1988):
  $(c)$ 1 impact;
  $(d)$ 5 impacts; and
  $(e)$ 10 impacts.
Increasing attention has recently been paid to the effect of droplet impingement on different forms of impacted surfaces, especially concave and convex surfaces, which showed that the surface profiles might strongly influence the dynamics of impinging droplets (Charalampous & Hardalupas Reference Charalampous and Hardalupas2017; Liu et al. Reference Liu, Zhao, Chen, Shen and Zhao2017; Khojasteh et al. Reference Khojasteh, Bordbar, Kamali and Marengo2017; Zhu et al. Reference Zhu, Liu, Mu, Gao, Ding and Lu2017; Li et al. Reference Li, Zhang, Zhang and Li2018; Jowkar & Morad Reference Jowkar and Morad2019). Changes in the surface curvature strongly influence the jetting instants and droplet deformation (Hardalupas, Taylor & Wilkins Reference Hardalupas, Taylor and Wilkins1999; Burson-Thomas et al. Reference Burson-Thomas, Wellman, Harvey and Wood2019a), which may have a significant effect on the final surface damage. It is also speculated that a curved surface may influence the construction of a water-hammer shock wave (Burson-Thomas et al. Reference Burson-Thomas, Wellman, Harvey and Wood2019b), which is closely related to the droplet's fluid dynamics and the stress on the surface. Some researchers also emphasised that when the curvature of a curved surface is equivalent to that of the impinging droplet, the curved surface effect is particularly significant (Burson-Thomas et al. Reference Burson-Thomas, Wellman, Harvey and Wood2019a), and the flat surface can be regarded as a surface with zero curvature. However, most studies have mainly focused on impingement at relatively low speeds (Khojasteh et al. Reference Khojasteh, Bordbar, Kamali and Marengo2017; Liu et al. Reference Liu, Zhao, Chen, Shen and Zhao2017; Zhu et al. Reference Zhu, Liu, Mu, Gao, Ding and Lu2017; Li et al. Reference Li, Zhang, Zhang and Li2018; Chen et al. Reference Chen, Liu, Wang, Liu and Shen2019). Scant research has explored a high-speed droplet's impingement on a curved surface to interpret the curved surface effect on the droplet's evolution, which can be helpful to understand the fluid induction surface damage mechanism.
In the present study, the detailed hydrodynamics of high-speed droplet impingement are investigated using numerical simulations. To reveal the curved surface effect on droplets’ high-speed impact, different solid surface profiles are considered, including flat surfaces and concave and convex surfaces with the same curvature as the droplet. This study considers several factors:
(i) the phase transition model to describe homogeneous and near-surface heterogeneous cavitation is employed in the present calculations, so both the focus cavities inside the droplet and the near-surface cavities can be captured;
(ii) considering two-phase flow compressibility, the complex wave structures inside high-speed droplets under different impact target configurations are explained in detail;
(iii) the space–time distributions of the surface pressure and fluid velocity are analysed during impact, and the possible contributions to surface damage are discussed.
The paper is organised as follows. Sections 2 and 3 present the physical model and numerical methodology, respectively. In § 4, the morphology and dynamic characteristics of confined shock waves inside impacted droplets are analysed qualitatively and quantitatively for different curved surfaces. In § 5, the occurrence and evolution of both homogeneous cavitation inside a droplet and heterogeneous cavitation near the surface are discussed. The fluid pressure distributions along curved surfaces during droplet impingement are compared in § 6, and the surface damage by the high-speed impact of droplets is explored. In § 7, the impact of axisymmetric droplets is simulated to describe the influences of axisymmetric configuration on wave propagation and cavitation. The research conclusions are summarised in § 8.
2. Physical model
To understand the impinging dynamics of a high-speed droplet when it interacts with different solid surface geometrical configurations, numerical simulations of high-speed droplet impingement on flat, concave and convex surfaces at different initial impinging velocities ( $V_0 = 50 \ \textrm {m}\ \textrm {s}^{-1}$,
  $150 \ \textrm {m}\ \textrm {s}^{-1}$ and
  $300 \ \textrm {m}\ \textrm {s}^{-1}$) are investigated. The initial diameter of the impinging droplets (
 $D_0$) is 5 mm, which is the same size as experiments by Field et al. (Reference Field, Lesser and Dear1985). The geometrical profile of the concave surface fits with Field's experimental results (Field et al. Reference Field, Lesser and Dear1985) using two externally tangent circular arcs that correspond to radii
  $R_0$ (2.5 mm) and
  $r_0$ (1.5 mm), respectively, and both correspond to the angle
  $\gamma$ (
 $19^{\circ }$), as shown in figure 2(a). For the configuration of the convex surface, its geometrical profile is symmetric with the configuration of the concave surface, which is also constructed using two externally tangent circular arcs with the same angle
  $\gamma$ and with radii
  $R_0$ and
  $r_0$, respectively, as shown in figure 2(b).

Figure 2. Configurations of the non-flat surface:  $(a)$ concave surface;
  $(b)$ convex surface.
The curvature of both concave and convex surface profiles are the same with the initial impinging droplet so the curved surface effect can be shown more prominently. The concave case is considered the synclastic curvature at the concave surface since the curvature of the curved surface and that of the droplet interface around the contact area are in the same direction. The convex case is considered the incongruous curvature because of the inverse direction. In the current study, the dimensionless parameters of the Reynolds number and Weber number are all larger than the order of  $10^5$, which means both the effects of viscosity and surface tension can be neglected compared with the inertial effect, and the problem can be regarded as size-independent under the present conditions (Kondo & Ando Reference Kondo and Ando2016).
3. Numerical methodology
A high-speed multi-phase flow problem including complex cavitation phenomena is studied in the present work, and the compressible multi-phase fluid model including phase transition is used (Wu et al. Reference Wu, Xiang and Wang2018). The governing equations are
 \begin{gather} \frac{{\partial {\alpha _k}{\rho _k}}}{{\partial t}} + \frac{{\partial {\alpha _k}{\rho _k}u}}{{\partial r}} + \frac{{\partial {\alpha _k}{\rho _k}v}}{{\partial z}} = - \frac{\delta }{r}{\alpha _k}{\rho _k}u + {{\dot{S}}_{\rho ,k}}, \quad k = 1,\ldots,K, \end{gather}
 \begin{gather}\frac{{\partial \left( {\rho u} \right)}}{{\partial t}} + \frac{{\partial (\rho {u^2} + p)}}{{\partial r}} + \frac{{\partial (\rho uv)}}{{\partial z}} = - \frac{\delta }{r}\rho {u^2}, \end{gather}
 \begin{gather}\frac{{\partial \left( {\rho v} \right)}}{{\partial t}} + \frac{{\partial (\rho uv)}}{{\partial r}} + \frac{{\partial (\rho {v^2} + p)}}{{\partial z}} = - \frac{\delta }{r}\rho uv, \end{gather}
 \begin{gather}\frac{{\partial E}}{{\partial t}} + \frac{{\partial \left[ {u\left( {E + p} \right)} \right]}}{{\partial r}} + \frac{{\partial \left[ {v\left( {E + p} \right)} \right]}}{{\partial z}} = - \frac{\delta }{r}u(E + p), \end{gather}
 \begin{gather}\frac{{\partial {\alpha _k}}}{{\partial t}} + u\frac{{\partial {\alpha _k}}}{{\partial r}} + v\frac{{\partial {\alpha _k}}}{{\partial z}} = {{\dot{S}}_{\alpha ,k}},\quad {k = 1,\ldots,K - 1} , \end{gather}
where  $\rho$ is the density,
  $p$ is the pressure,
  $u$ is the velocity component in the radial direction,
  $v$ is the velocity component in the axial direction,
  $E = \rho e + (\rho ({u^2} + {v^2}))/2$ is the total energy and
  $e$ is the internal specific energy of the fluid. We use
  $\alpha _k$,
  $\rho _k$ and
  $\alpha _k\rho _k$ to represent the volume fraction, density and value of the volume mass of component
  $k$, respectively. The saturation constraint of the volume of the fraction yields
  ${\alpha _K} = 1 - \sum _{k = 1}^{K - 1} {{\alpha _k}}$. Here
  $\delta$ is set as zero for the Cartesian coordinate and unity for the rotationally axisymmetric case. The axisymmetric coordinate is applied for the two-dimensional (2-D) axisymmetric simulations, and the expressions of the geometric source terms in (3.1) can be referred to the mathematical model of Toro (Reference Toro2013).
The explicit definition of the source terms,  ${\dot {S}_{\rho ,k}}$ and
  ${\dot {S}_{\alpha ,k}}$, in the right-hand side of (3.1) are
 \begin{gather} {{{\dot{S}}_{\rho ,\textrm{{v}}}} = \dot{m} = \nu \left( {{\mu _{{l}}} - {\mu _{{v}}}} \right),}\quad {{{\dot{S}}_{\rho ,\textrm{{l}}}} = - \dot{m} = \nu \left( {{\mu _{{v}}} - {\mu _{{l}}}} \right),} \end{gather}
 \begin{gather} {{{\dot{S}}_{\alpha ,\textrm{{v}}}} = \frac{{\dot{m}}}{{{\varrho_{{v}}}}} = \frac{\nu }{{{\varrho_{{v}}}}}\left( {{\mu _{{l}}} - {\mu _{{v}}}} \right),}\quad {{{\dot{S}}_{\alpha ,{{l}}}} = - \frac{{\dot{m}}}{{{\varrho_{{l}}}}} = \frac{\nu }{{{\varrho_{{l}}}}}\left( {{\mu _{{v}}} - {\mu _{{l}}}} \right),} \end{gather}
where  $\mu _{{v}}$ and
  $\mu _{{l}}$ are the chemical potential of the vapour and liquid components, respectively, that participate in the phase change process. The values of
  ${\dot {S}_{\rho ,k}}$ and
  ${\dot {S}_{\alpha ,k}}$ are set as zero for the components that do not participate in the phase change. Formulae for the parameters
  $\varrho _k$ can be found in Zein (Reference Zein2010) and Zein, Hantke & Warnecke (Reference Zein, Hantke and Warnecke2013). The variable
  $\nu (\geq 0)$ is the relaxation parameter for the chemical potential and can be considered the parameter to judge whether phase transition is triggered. The value of
  $\nu$ is determined by the local flow field condition, where different situations are included. First, in the regions around the rigid surface where near-surface heterogeneous cavitation occurs,
  $\nu$ is zero if the local pressure is higher than
  $p_{{surface}}$ and lower than the local saturated pressure
  $p_{{sat}}(T)$. However, in the flow field regions away from the solid surface where bulk-flow homogeneous cavitation occurs, if the local pressure is higher than
  $p_{{bulk}}$ and lower than
  $p_{{sat}}(T)$, then
  $\nu$ is zero. If this does not happen in all three cases,
  $\nu$ will be not zero and phase transition will occur. The methods of determining the values of
  $p_{{surface}}$ and
  $p_{{bulk}}$ and their relationship are presented in appendix A.
This work includes the three components that respectively correspond to vapour, liquid water and air. The stiffened gas equation of state (Saurel, Petitpas & Abgrall Reference Saurel, Petitpas and Abgrall2008) is considered and the corresponding values of the physical parameters follow those of Wu et al. (Reference Wu, Xiang and Wang2018). The initial static pressure and temperature in the flow field are  $1.01325 \times 10^5\ \textrm {Pa}$ and 300 K, denoted as
  $p_0$ and
  $T_0$, respectively. The droplet is pure liquid water, and the droplet is surrounded by air. The interface is distinguished by a specified value of the liquid volume fraction (for example, 0.8 in this work).
In this study, the splitting approach is applied to the governing equations (3.1) so the hyperbolic operator and source terms are then solved separately. A fifth-order incremental stencil weighted essentially non-oscillatory (WENO-IS) scheme is applied for the spatial reconstructions (Wang, Xiang & Hu Reference Wang, Xiang and Hu2018). A Godunov-type Harten–Lax–van Leer contact (HLLC) approximate Riemann solver (Toro Reference Toro2013) is utilised to solve the Riemann problem at the cell edges. Han, Hantke & Müller (Reference Han, Hantke and Müller2017) used a chemical relaxation procedure to treat source terms related to phase transition in the right-hand side of the system (3.1) when phase transition is triggered. A third-order total variation diminishing (TVD) Runge–Kutta scheme (Gottlieb & Shu Reference Gottlieb and Shu1998) is used for time marching. As the aforementioned numerical schemes are applicable for the present research, their details are neglected in the interest of saving space.
This study mainly focuses on the fluid hydrodynamics mechanism but neglects the analysis of coupling with the solid structure. The slip wall is used for the solid boundary where the immersed boundary method is employed for a non-flat surface (Mittal & Iaccarino Reference Mittal and Iaccarino2005). In order to guarantee the slip wall boundary condition, the following three steps are required in the computation. First, the first layer of the immersed grid points is found next to the curved solid surface, and each of these points can be associated to one tangent line on the solid surface. Second, for each immersed grid point, its symmetric point's geometric coordinates are obtained in the flow field against the tangent line as the symmetric axis. Finally, the physical variable values are interpolated to these symmetric points by the information at the nearby fluid grids, and assigned to the corresponding immersed grid points through symmetric boundary conditions. The similar assignment can be done for the multi-layer of immersed grid points if necessary. As the configuration of the computational domain has symmetry with the symmetric axis ( $z$ axis), only half of the region is considered. The symmetric boundary is considered along the
  $z$ axis, and the other boundaries in the computation domain are specified as the non-reflection boundary (Thompson Reference Thompson1987). Uniform grids are employed in the simulation, and there are 1000 grid cells per droplet diameter. The same Courant–Friedrich–Lewis (CFL) number, 0.4, is used for all of the computations. The numerical verification of the grid sensitivity refers to the treatment methods in the present authors’ previous work (Wu et al. Reference Wu, Xiang and Wang2018, Reference Wu, Wang and Xiang2019).
4. Evolution of confined shock waves
The following three sections provide a detailed analysis and comparison of high-speed water column impingement on different curved surfaces.
4.1. Water-hammer shock waves
The generation and evolution of strong complex waves are discussed in this section. Referring to Cook (Reference Cook1928) and Heymann (Reference Heymann1969), transient high pressure may be generated as a high-speed liquid impacts a rigid surface, which is called the water-hammer pressure. According to the one-dimensional water-hammer theory, the accompanying transient water-hammer pressure is theoretically estimated by  $\rho _{{l}}V_0(c_{{l}}+\chi V_0)$ (Cook Reference Cook1928; Heymann Reference Heymann1969), where
  $\rho _{{l}}$ is the liquid density,
  $V_0$ is the initial droplet impinging velocity,
  $c_{{l}}$ is the liquid sound speed and
  $\chi$ is a constant that depends on the liquid property. For water,
  $\chi$ is usually taken as 2.0 according to Heymann (Reference Heymann1969). In the present study, when a high-speed droplet impacts a flat rigid surface, as shown in figure 3(b), the impact pressure at the first impinging point is approximately
  $\rho _{{l}}V_0(c_{{l}}+\chi V_0)$, which is increased with the initial impinging speed
  $V_0$ (Lesser Reference Lesser1995). When a droplet impacts a curved surface, at the initial interaction instant, the water-hammer pressure value is proportional to the velocity component perpendicular to the contact surface (
 $V_{{S}}$) at any interaction point
  $S$. When a droplet impacts a concave surface, the velocity component
  $V_{{S}}$ at point
  $S$ is equal to
  $\cos \theta _{{S}}$ for
  $V_0$, as shown in figure 3(a). The surface impinging angle
  $\theta _{{S}}$ is defined as the intersection angle between the horizontal line and the tangent line of the concave surface at point
  $S$. Thus, for droplet impingement on a concave surface, the strength of the water-hammer pressure is different at each interaction point corresponding to different impinging angles at the initial interaction instant, about
  $\rho _{{l}}V_{{S}}(c_{{l}}+\chi V_{{S}})$ at each interaction point, and there is a contact arc at the initial interaction instant when
  $\theta _{{S}}$ corresponds to the value range of
  $[-\gamma , \gamma ]$. For droplet impingement on a convex surface, there is only one interaction point
  $S$ at the initial instant when
  $\theta _{{S}}$ corresponds to
  $0^{\circ }$, as shown in figure 3(c). Hence, at the initial interaction instant, a series of compression wavelets are emitted along the contact arc for a concave surface, whereas only one compression wavelet is generated from the initial interaction point for a convex surface.

Figure 3. Schematic diagrams of the impinging velocity at the initial interaction instant of droplet impingement on  $(a)$ a concave surface,
  $(b)$ a flat surface and
  $(c)$ a convex surface.
After the initial interaction instant, the contact region expands outward along the solid surface with the continuous impingement of droplets in all three cases. A confined water-hammer shock wave is generated and evolves inside the droplet due to the compressible properties of the liquid (Haller et al. Reference Haller, Ventikos, Poulikakos and Monkewitz2002). Referring to Lesser (Reference Lesser1981), according to the Huygens principle, an individual compression wavelet is emitted at each new interaction point during droplet impingement. Accounting for the acoustic limit of the compression wavelet (Lesser Reference Lesser1981), the expanding speed of the contact region along the solid surface is higher than the propagation speed of the wavelet at the early stage of the impaction. This means that the emitted compression wavelets cannot overtake the contact region and these compression wavelets thus form a shock envelope (also called a confined shock wave) inside the droplet (Haller et al. Reference Haller, Ventikos, Poulikakos and Monkewitz2002, Reference Haller, Ventikos and Poulikakos2003b). In the present study, when a high-speed droplet impacts a curved solid surface, similar phenomena occur, in which a confined water-hammer shock wave forms and evolves inside the droplet. The following will assess the evolution of these confined water-hammer shock waves.
Simulation results of the pressure contours in the earlier stage and the corresponding schematic diagrams of the compression wavelets for droplet impacts on different curved surfaces are shown in figure 4. Referring to Lesser (Reference Lesser1981), the individual compression wavelets expand inside the droplet with the local sound speed. In the present study, the expansion speeds of the wavelets are all assumed to be constant for simplification. In the earlier impinging stage, the envelop of the compression wavelets form the front of the water-hammer shock wave (Wu et al. Reference Wu, Xiang and Wang2018). For droplet impingement on a concave surface (as shown in figure 4a), the initial contact region is a circular arc, and hence many compression wavelets are simultaneously emitted at the initial interaction instant. As shown in figure 4(a), owing to the influence of the surface's concave shape, the shape of the envelope of the compression wavelets is concave at the initial stage, which fits well with the water-hammer shock wave front. For droplet impingement on flat and convex surfaces, the initial contact region is just one point, and hence only one compression wavelet is emitted at the initial impinging instant. As the droplet continuously impacts, compression wavelets are gradually emitted along the expansion of the contact region. As shown in figures 4(b) and 4(c), the shapes of the envelops of these compression wavelets in both cases are convex at the initial stage, which also fits well with the water-hammer shock front. Owing to the influence of the surface's convex shape, the expanding velocity of the contact point in the case of the convex surface is slower than that of the flat surface, and the curvature of this convex shock wave front is larger than that of impingement on the flat surface.

Figure 4. A partially enlarged figure of the simulation results of the pressure contours in the initial stage (the right half) and the corresponding schematic diagrams of the compression wavelets (the left half) for droplets with an initial impinging velocity of  $150 \ \textrm {m}\ \textrm {s}^{-1}$ and impact on
  $(a)$ a concave surface (
 $t/(D_0/c_{l}) = 0.05$), (b) a flat surface (
 $t/(D_0/c_{l}) = 0.05$) and (c) a convex surface (
 $t/(D_0/c_{l}) = 0.05$).
4.2. Critical detaching angle
According to the droplet's geometrical profile, the intersection angle between the interface of the droplet and the solid surface increases with the impinging process, and the expansion velocity of the periphery of the contact region between the droplet and the surface gradually decreases from an infinite value at the initial interaction instant (Wu et al. Reference Wu, Xiang and Wang2018). Owing to the limitation of the sound speed, the propagation velocity of the water-hammer shock wave is lower than the expansion velocity of the periphery of the contact region at the very beginning. A compression wavelet is emitted at each newly generated contact point that composes the end of the shock wave, so the shock wave remains to be attached on the surface. Hence, the water-hammer shock wave cannot detach from the surface at the very beginning stage, and the impinged droplet can be divided by this confined shock wave front into a compressed fluid region and an undisturbed fluid region (Haller et al. Reference Haller, Ventikos, Poulikakos and Monkewitz2002). Previous studies considered the critical time instant when the shock wave detaches from the surface and overtakes the contact periphery for droplet impingement on a flat surface (Heymann Reference Heymann1969; Lesser Reference Lesser1981; Haller et al. Reference Haller, Ventikos, Poulikakos and Monkewitz2002). The detaching time is strongly related to the local geometrical profile and relative velocity between the droplet and the curved surface around the contact periphery (Rein Reference Rein1993). The present paper for the first time analyses the critical instant and critical detaching angle for droplet impingement on a curved surface.
A schematic diagram of the initial impinging stage is shown in figure 5 at the instant  $t_0$ (the initial interaction instant,
  $t_0 = 0$) and instant
  $t_1$ (any instant before the critical detaching time). The contact point
  $A$ is the periphery point of the contact region and the contact angle
  $\alpha$ is defined as the intersection angle between the droplet's tangent line and the surface's tangent line at contact point
  $A$. Figure 5 shows the velocity triangle of the contact point
  $A$, where
  $V_{A}$ is the absolute velocity of point
  $A$,
$A$,  $V_{AC}$ is the velocity relative to the droplet's centre point
  $C$ and
  $V_0$ is the droplet's impinging velocity.
(a) Concave surface

Figure 5. A schematic diagram at two instants in the initial impinging stage of droplet impingement on
$(a)$ a concave surface, $(b)$ a flat surface and $(c)$ a convex surface.For droplet impingement on a concave surface, as shown in figure 5(a), the contact angle
$\alpha$ is equal to $\theta - \beta$, where $\theta$ is the intersection angle between the tangent line of the droplet interface at contact point $A$ and the horizontal line and $\beta$ is the intersection angle between the tangent line of the surface at point $A$ and the horizontal line. At the initial instant $t_0$, the contact angle value $\alpha _0$ is $0^{\circ } (\beta _0 = \theta _0 = \gamma )$. According to the analysis of instant $t_0$ and instant $t_1$ in appendix B, the expressions of the corresponding time and angle at instant $t_1$ can be obtained as in (B 3), (B 6) and (B 9).(b) Flat surface
For droplet impingement on a flat surface, as shown in figure 5(b), the contact angle
$\alpha$ is equal to $\theta$. At the initial instant $t_0$, the contact angle value $\alpha _0$ is $0^{\circ } (\theta _0 = 0^{\circ })$. According to the analysis in appendix B, the expression of $\theta$ is obtained as in (B 11) and the expression of the corresponding time instant $t_1$ can be expressed as in (B 13).(c) Convex surface
For droplet impingement on a convex surface, as shown in figure 5(c), the contact angle
$\alpha$ is equal to 2$\theta$ and $\theta$ is also the intersection angle between the tangent line of the droplet interface at contact point $A$ and the horizontal line when the contact periphery still expands on the larger circular arc of the convex surface (corresponding to the radius of $R_0$ and the centre point at ${{C_{surface}}}$). At the initial instant $t_0$, the contact angle value $\alpha _0$ is $0^{\circ } (\theta _0 = 0^{\circ })$. According to the analysis in appendix B, the expression of $\theta$ is obtained as in (B 15) and the expression of the corresponding time instant $t_1$ can be expressed as in (B 17).


In each of these situations, if the value of  $V_{{AC}}$ is equal to the velocity of the shock wave, which means that the shock wave just catches up with the expansion speed of the contact periphery, the corresponding contact angle and time are justified as the critical contact angle
  $\alpha _{c}$ and the critical instant
  $t_{c}$, respectively. Figure 6 shows the numerical results of the shock front profiles of droplet impingement on different surfaces at the corresponding critical instant
  $t_{c}$. Appendix B provides a detailed derivation. The critical angle and critical time are compared in table 1 with the analytical and numerical results of the three configurations at different initial impinging velocities. The simulation results agree with the analytical values.

Figure 6. Simulation results of the shock front profiles at the critical instant  $t_{c}$ of droplet impingement on
  $(a)$ a concave surface,
  $(b)$ a flat surface and
  $(c)$ a convex surface with an initial impinging velocity of
  $150 \ \textrm {m}\ \textrm {s}^{-1}$.
Table 1. The critical values at different initial impact speeds.

The intersection angle  $\theta$ and contact angle
  $\alpha$ are related to the total length of the contact area and the increase in the contact area from
  $t_0$, respectively. As
  $\alpha _{c}$ increases, the contact area increases when the confined shock wave just overtakes the solid surface. The greater the
  $\theta _{c}$ values, the larger the contact area. Before the confined shock wave overtakes the solid surface, the larger contact area means that more compression wavelets are emitted that comprise the confined water-hammer shock wave, so the confined water-hammer shock wave is stronger.
The comparison demonstrates that the critical contact angle  $\alpha _{c}$ and detaching instant
  $t_{c}$ are both larger if the initial speed is increased. The strength of the confined water-hammer shock wave increases with the initial impinging velocity. Moreover, the
  $\theta _{c}$ value of a concave surface is larger than that of flat and convex surfaces at the same impinging velocity, as shown in figure 6. As mentioned previously, at the initial interaction instant, there is a droplet impingement contact arc on the concave surface, whereas there is only one contact point on the other two configurations. Therefore, at the same impinging velocity, owing to the synclastic curvature effect in the concave surface, the strength of the confined water-hammer shock wave on the concave surface is the strongest, the flat surface follows and the convex surface is the weakest.
4.3. Propagation of confined shock waves
When the confined shock wave overtakes the contact periphery, it detaches from the surface and propagates inside the droplet. Figure 7 demonstrates the simulation results of the pressure contours after the confined shock wave detaches from the surface at different time instants, and the corresponding schematic diagrams present the compression wavelets for droplet impingement on different surfaces, respectively. In figure 4, the schematic diagrams of a series of compression wavelets are given, which transform to the wavelets shown in figure 7 after a period of evolution. As the shock waves generated in the present study are relatively weak (for example, the shock Mach number is about 1.04 at  $t/(D_0/c_{{l}}) = 0.19$ in the flat surface case, as shown in figure 7b), the simplicity assumption of the constant propagation speeds of the individual compression wavelets is appropriate here. As shown in figure 7, although the initial shapes of the confined shock wave fronts are quite different for the three configurations, the confined shock wave fronts, that is, the envelopes of the wavelets, gradually flatten as they propagate inside the droplets.

Figure 7. Simulation results of the pressure contours (left half) and density schlieren (right half) after the confined shock wave detaches from the surface and corresponding schematic diagrams of the compression wavelets for droplets with an initial impinging velocity of  $150 \ \textrm {m}\ \textrm {s}^{-1}$ and impact on:
  $(a)$ a concave surface at the time instants
  $t/(D_0/c_{{l}}) = 0.19$,
  $t/(D_0/c_{{l}}) = 0.45$ and
  $t/(D_0/c_{{l}}) = 0.75$;
  $(b)$ a flat surface at the time instants
  $t/(D_0/c_{{l}}) = 0.19$,
  $t/(D_0/c_{{l}}) = 0.47$ and
  $t/(D_0/c_{{l}}) = 0.78$; and
  $(c)$ a convex surface at the time instants
  $t/(D_0/c_{{l}}) = 0.19$,
  $t/(D_0/c_{{l}}) = 0.48$ and
  $t/(D_0/c_{{l}}) = 0.78$.
Meanwhile, once the ending points of the confined shock wave detach from the solid surface, the shock wave will freely propagate inside the droplet. From then on, the reflected and transmitted waves are generated on the curved droplet interface. As the acoustic impedance  $\rho _{{l}}c_{{l}}$ in water is much larger than that in air, the reflected waves are rarefaction waves and the transmitted waves are shock waves. As is known, the transmitted shock waves are so weak that they are almost invisible in the numerical schlieren images. The confined shock wave is reflected on the droplet interface continuously as the shock wave front propagates inside the droplet, and the reflected rarefaction waves can induce a local low-pressure region behind the shock front, as shown in figure 7.
Through the comparison of the pressure contour simulation results of the three cases in figure 7, the pressure behind the confined shock wave in droplet impingement on the concave surface is the highest and is the lowest for the convex surface. The average velocities of the confined shock wave fronts that propagate in the droplet are  $1610 \ \textrm {m}\ \textrm {s}^{-1}$ for the concave surface,
  $1550 \ \textrm {m}\ \textrm {s}^{-1}$ for the flat surface and
  $1520 \ \textrm {m}\ \textrm {s}^{-1}$ for the convex surface, respectively. In this study, the average velocity of the confined shock wave is characterised as
  $D_0$ divided by the time that the shock wave touches the top pole of the droplet. Thus, the strength of the confined shock wave for impingement on the concave surface is the strongest and the weakest for the convex surface at the same initial impinging velocity.
5. Evolution of cavities
5.1. Homogeneous cavitation inside the droplet
The confined shock wave is reflected on the droplet's interface when the shock wave front propagates inside the droplet. Once the confined shock wave sweeps the whole droplet and reaches the droplet's top pole, it is completely reflected and evolved inside the droplet, as shown in figure 8. Owing to the geometric constraint of the curved droplet's interface, the reflected rarefaction waves will converge. Referring to our previous work (Wu et al. Reference Wu, Xiang and Wang2018) for droplet impingement on a flat surface, the converging point of the reflected rarefaction waves is on the symmetry axis of the droplet at a distance of  $1/3 D_0$ away from the droplet's top pole. Similar results are obtained for droplet impingement on a curved surface. The evolution of the wave structures for droplet impingement on a curved surface is analysed for the present cases.

Figure 8. Simulation results of the pressure contours (left half) and density schlieren (right half) of the droplet at the instant the confined shock wave reaches the droplet's top pole with an initial impinging velocity of  $150 \ \textrm {m}\ \textrm {s}^{-1}$, which impacts
  $(a)$ a concave surface at the time instant
  $t/(D_0/c_{l}) = 0.93$,
  $(b)$ a flat surface at the time instant
  $t/(D_0/c_{l}) = 0.97$ and
  $(c)$ a convex surface at the time instant
  $t/(D_0/c_{l}) = 0.98$, respectively.
Figure 9 shows the simulation results of the pressure contours and liquid volume fraction contours of droplet impingement on a curved surface. The instant is taken when the rarefaction waves converge. The schematic diagrams demonstrate the rays emitted from the initial impinging point of the droplet, and also both the path of the rays without reflection and with one-time reflection are shown. The rays represent the paths of the compression wavelet as well as its reflected rarefaction waves, where rays will be always reflected symmetrically on the curved interface of the droplet. As the one-time reflection rays are related to the propagation of the reflected rarefaction wave, we can use these rays to analyse the converging position of the reflected rarefaction waves, as shown in figure 9 (more detailed explanation can be found in Obreschkow et al. Reference Obreschkow, Dorsaz, Kobel, de Bosset, Tinguely, Field and Farhat2011; Wu et al. Reference Wu, Xiang and Wang2018).

Figure 9. Left half: Simulation results of the pressure contours at the converging instant for droplets with an initial impinging velocity of  $150 \ \textrm {m}\ \textrm {s}^{-1}$ and impact on
  $(a)$ a concave surface at the time instant
  $t/(D_0/c_{l}) = 1.26$,
  $(b)$ a flat surface at the time instant
  $t/(D_0/c_{l}) = 1.30$ and
  $(c)$ a convex surface at the time instant
  $t/(D_0/c_{l}) = 1.29$. The cavitation zone is located by the vapour volume fraction isolines. Right half: Simulation results of the liquid volume fraction contours at corresponding time instants and schematic diagrams of ray analysis of the converging position (Obreschkow et al. Reference Obreschkow, Dorsaz, Kobel, de Bosset, Tinguely, Field and Farhat2011; Wu et al. Reference Wu, Xiang and Wang2018).
For a concave surface, as the initial contact region is not just one point but the concave arc, the converging region is also an arc ( $\widehat{FF^{\prime}}$) that has the same angle of the initial contact arc, as shown in figure 9(a). The converging arc exists at a distance of
  $1/3 D_0$ away from the droplet's top interface. For droplet impingement on flat and convex surfaces, because the initial contact region is just one point, the reflected rarefaction waves will converge at one point,
  $F$, as shown in figures 9(b) and 9(c). Thus, the converging point is on the symmetry axis of the droplet at a distance of
  $1/3 D_0$ away from the droplet's top pole.
Owing to the convergence of the reflected rarefaction waves, the fluid pressure will dramatically decrease around the converging zone. Once the local fluid pressure is lower than  $p_{{bulk}}$, homogeneous cavitation occurs and phase transition is triggered. Thus, homogeneous cavitation occurs inside the droplet. The cavities are called focus cavities. For droplet impingement on concave and flat surfaces with an initial speed of
  $150 \ \textrm {m}\ \textrm {s}^{-1}$, homogeneous cavitation is confirmed during rarefaction wave convergence. As shown in figures 9(a) and 9(b), homogeneous focus cavities are generated around the converging zone.
In the three cases, the intensity of the confined shock wave (corresponding to the initial water-hammer shock wave) can be characterised using the post-wave Mach number. For droplet impingement on concave and flat surfaces, when the confined shock wave propagates to the top inside the droplet, the post-wave Mach numbers are approximately 0.04 and 0.07 at the symmetric axis, respectively. However, for droplet impingement on a convex surface, the post-wave Mach number is approximately 0.09 at the symmetric axis (the pre-wave Mach number in the undisturbed region is 0.1 in all three cases owing to the initial impinging speed). The confined shock wave is weaker for a convex surface, and thus the corresponding strength of the reflected rarefaction waves is weaker. It is not easy for fluids to undergo homogeneous cavitation, and phase transition cannot be triggered for a convex surface. This is why no focus cavity appears in droplet impingement on a convex surface with an initial speed of  $150 \ \textrm {m}\ \textrm {s}^{-1}$, as shown in figure 9(c).
5.2. Near-surface heterogeneous cavitation
Cavitation can induce surface erosion (Obreschkow et al. Reference Obreschkow, Dorsaz, Kobel, de Bosset, Tinguely, Field and Farhat2011; Field et al. Reference Field, Camus, Tinguely, Obreschkow and Farhat2012). Therefore, the present study also analyses cavitation, especially near-surface behaviour, and its possible influence on surface damage during droplet impingement.
As shown in figure 9, reflected rarefaction waves may induce homogeneous cavitation around the converging zone, thus weakening the wave strength. The weakened rarefaction waves continuously propagate toward a solid surface and are reflected by the surface. These second re-reflected waves remain rarefaction waves because the acoustic impendence of the surface is larger than that of the liquid. The re-reflected rarefaction waves overlay the subsequent rarefaction waves in the near-surface zone, further reducing the local fluid pressure.
Compared with homogeneous cavitation, the cavitation threshold here is reduced due to the surface, as discussed in § 3. So-called near-surface heterogeneous cavitation is considered near the surface. Once the pressure of the local fluids close to the surface is lower than  $p_{{surface}}$, heterogeneous cavitation occurs and phase transition is triggered.
Figure 10 shows the results of droplet impingement on a concave surface after the rarefaction waves converge. Owing to the geometric shape of the concave surface, the second re-reflected rarefaction waves will further converge around the concave area. The pressure decrease induced by the rarefaction waves intensifies around the concave area, where heterogeneous cavitation occurs and the near-surface cavity appears for the first time, as shown in figure 10(a). Subsequently, the near-surface cavity gradually compresses and shrinks accompanied with the vapour condensation process. The existence of the solid surface, gas–liquid interfaces, neighbouring cavities and complex wave structures in the flow field may lead to the non-symmetrical collapse of cavity (Blake & Gibson Reference Blake and Gibson1981; Tomita et al. Reference Tomita, Robinson, Tong and Blake2002; Rossinelli et al. Reference Rossinelli, Hejazialhosseini, Hadjidoukas, Bekas, Curioni, Bertsch, Futral, Schmidt, Adams and Koumoutsakos2013). According to previous studies (Ball et al. Reference Ball, Howell, Leighton and Schofield2000; Betney et al. Reference Betney, Tully, Hawker and Ventikos2015), the local microjets occur and develop due to the cavity's non-symmetrical deformation, and the collapse waves may generate upon the local microjet impaction. Fujikawa & Akamatsu (Reference Fujikawa and Akamatsu1980) studied the non-equilibrium effects in the symmetrical collapse. They indicated that owing to the effect of non-equilibrium on vapour condensation, a little of remnant vapour in the cavity may behave as non-condensable gas when the reducing rate of the volume of the cavity is high enough, and thus the pressure waves can generate in the process of the cavity rebound. However, as the primary collapse is non-symmetrical in the present study, the influence of the non-equilibrium effect could be ignored. As shown in figure 10(b), a series of compression waves related to the cavity collapse are generated. It is observed that the cavity zone near the solid surface begins to collapse from the outmost part and propagates inward with apparent geometrical focusing, the similar phenomenon was also observed in the previous studies (Bremond et al. Reference Bremond, Arora, Ohl and Lohse2006; Tiwari, Pantano & Freund Reference Tiwari, Pantano and Freund2015). As the near-surface cavity gradually collapses from both sides to the middle, the collapsing compression waves gradually overlay. And the strongest pressure appears in the centre point of the concave shape on the surface, which could explain the centre localised pit of damage on the concave surface, as shown in figure 1. Meanwhile, the focus cavity is gradually compressed by the following waves (Wu et al. Reference Wu, Xiang and Wang2018), and a series of collapsing compression waves is generated, as shown in figure 10(b).

Figure 10. Simulation results of cavity evolution by the pressure contours (left half) and density schlieren (right half) in droplet impingement on a concave surface with an initial impinging velocity of  $150 \ \textrm {m}\ \textrm {s}^{-1}$ at the time instants
  $(a)$
$(a)$  $t/(D_0/c_{l}) = 1.68$ (first surface cavity),
  $(b)$
$(b)$  $t/(D_0/c_{l}) = 2.10$ (cavity collapse) and
  $(c)$
$(c)$  $t/(D_0/c_{l}) = 3.06$ (secondary surface cavity). The cavitation zone is located by the isolines of the vapour volume fraction.
Once the collapsing compression waves propagate to the droplet's interface, they are reflected and the reflection waves are rarefaction waves. The rarefaction waves propagate toward the concave surface and may be further induced at the near-surface cavity for a second time if heterogeneous cavitation occurs again. As shown in figure 10(c), a secondary surface cavity occurs around the concave region. Similarly, a further near-surface cavity may occur a third time as this process repeats. Then the near-surface cavities collapse, which can lead to impacting forces on the concave surface that may intensify the damage in its depression area. This will be analysed in the next section. Similar near-surface cavitation occurs during droplet impingement on a flat surface, where the increase in pressure induced by the cavity collapse is smaller than that of a concave surface.
Near-surface cavitation is not observed in droplet impingement on a convex solid surface even if the initial impinging velocity is increased to  $300 \ \textrm {m}\ \textrm {s}^{-1}$. Because the strength of the water-hammer shock wave is weaker in droplet impingement on a convex surface, the corresponding reflected rarefaction waves are also weaker than those in droplet impingement on flat and concave surfaces. The convex shape of the solid surface will decentralise the second re-reflected waves around the convex surface, so the degree of heterogeneous cavitation induced by the overlapping rarefaction waves decreases in the near-convex surface regions.
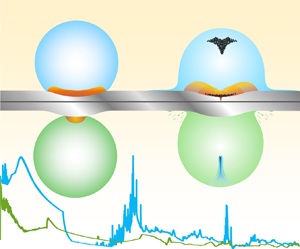
Figure 11 presents a comparison of schematic diagrams of the whole evolution during high-speed droplet impingement on both concave and convex surfaces. The previous analysis of droplet impingement on different surfaces demonstrated that the strength of the water-hammer shock wave and the subsequent cavitation differs. A weaker confined water-hammer shock wave occurs, and the decentralised effect of the convex surface can influence the waves’ overlapping in droplet impingement on this surface. The convex shape reduces the near-surface cavity during high-speed droplet impingement.

Figure 11. Comparison of the schematic diagrams of the whole evolution during high-speed droplet impingement on  $(a)$ a concave surface and
  $(b)$ a convex surface.
6. Comparison of the surface pressures
In this section, the space–time distributions of surface pressure and magnitude of velocity during impingement are compared in detail with the curved surface effects. As the strong lateral jet generated from the contact periphery can be an important hydrodynamic factor for surface damage (Haller et al. Reference Haller, Ventikos, Poulikakos and Monkewitz2002), the influence of the surface curvature on the jet strength is discussed. The liquid velocity on a curved surface is used to justify the lateral jet strength.
Space–time diagrams of the magnitude of the velocity and surface pressure on different surfaces are shown in figure 12. Figure 12(b) shows a partial enlarged view of figure 12(a) in the initial impinging stage. A lateral jet occurs around the contact periphery where the magnitude of velocity increases abruptly but the pressure decreases abruptly, as shown in figure 12(b). The pressure variations in the Lagrangian monitoring point at the converging position (point  $F$ as discussed in § 5.1 are demonstrated in figure 13(a), and the pressure variations in the central point on the impacted surfaces (point
  $C$ in figure 12) are shown in figure 13(b).

Figure 12. Comparison of space–time diagrams of the magnitude of velocity (left half of b) and pressure distributions on different curved surfaces with an initial impinging velocity of  $150 \ \textrm {m}\ \textrm {s}^{-1}$:
  $(a)$ total evolution procedure and
  $(b)$ initial stage (partial enlarged view of the dashed square area in (a).


As shown in figure 12(a), in a concave surface, high pressures are continuously sustained in the depression zone for a long duration. The concave wall enables the waves to converge, which concentrates the shock waves inside the liquid drop. Compared with a flat surface, a curved surface decreases the velocity component in the surface's normal direction at the contact point. Hence, the corresponding strength of the water-hammer pressure is weaker around the contact periphery for a curved surface, which reduces the intensity of the lateral jet compared with a flat surface (as shown in figure 12b). The comparison of the pressure variations at the specific monitoring points demonstrates that the strengths of the confined shock wave and the converging effect of the reflected waves are much stronger in a concave surface than in the other two surfaces (as shown in figure 13a). Thus, near-surface cavity collapse will rapidly increase the local pressure (as shown in figures 12a and 13b), and local surface erosion may occur. From the space–time pressure distribution on the flat surface, it is found that the shape of the high-pressure region at the initial stage is like a ‘guided missile nose cone’, as shown in figure 12(b). The width of the cross-section of this ‘nose cone’ represents the solid surface area that bears the high pressure at the corresponding instant, and the length of the vertical section represents the time period that bears the high pressure on the corresponding solid surface. Thus, the shape of this ‘guided missile nose cone’ itself explains the reason for the concave shape deformation of the flat surface owing to the high-speed droplet impact, as shown in figure 1(d). On a flat surface, high pressures are distributed along the contact periphery, which induce much stronger lateral jets, as shown in figure 12(b). In addition to the generation of water-hammer shock waves, the impinging energy also dissipates in the form of high-speed jets. Continuous high-speed jets can erode the surface. This explains why high-speed impingement can cause severe erosion damage near the contact periphery, as shown in figures 1(c) and 1(d). On a convex surface, only a small surface area surrounding the initial impact point is acted on by high impact pressure, and the surface pressure obviously weakens because the water-hammer shock wave detaches the surface quickly, as shown in the space–time diagram in figure 12(c). As the impact energy dissipates quickly and efficiently, weaker lateral jets are continuously produced during the subsequent impinging process.
In general, a concave surface configuration causes the waves to converge inside the droplet, whereas a convex surface configuration results in wave divergence where the energy is more dissipated. Hence, a convex configuration effectively reduces the level of surface damage induced by different fluid induction mechanisms during high-speed droplet impingement. These include impact damage due to the water-hammer shock wave, erosion by strong lateral jets and damage due to the high pressures released by near-surface cavities.
To obtain a more comprehensive analysis of the whole-field pressure distribution, the variations in the maximum pressure in the flow field and several particular peak pressures with different configurations are compared, as shown in figures 14(a) and 14(b).

Figure 14.  $(a)$ Comparison of variations in the maximum pressure in the whole flow field of droplet impingement on different curved surfaces with an initial impinging velocity of
  $150 \ \textrm {m}\ \textrm {s}^{-1}$.
  $(b)$ Comparison of several particular peak values on concave surfaces and the theoretical prediction values of water-hammer pressure (Heymann Reference Heymann1969) at different initial impinging velocities.
As demonstrated in figure 14(a), variations in the maximum pressure occur in the droplet impingement flow field on different curved surfaces with an initial impinging velocity of  $150 \ \textrm {m}\ \textrm {s}^{-1}$. The water-hammer pressures
  $p_{{initial\_impinging}}$ at the initial impinging instant are very close to each other in all three cases, whereas the subsequent variations in the maximum pressure differ. The values of
  $p_{{initial\_impinging}}$ are approximately 250 MPa, which is basically consistent with the theoretical result (Cook Reference Cook1928; Heymann Reference Heymann1969), as shown in figure 14(b). For droplet impingement on a concave surface, after the initial impinging instant, the pressure increases due to the propagation of the initial strong water-hammer shock wave. Several peak pressures then occur that are related to the collapse of the homogeneous focus cavity, denoted as
  $p_{{focus\_cavity}}$, the first-time near-surface cavity, denoted as
  $p_{{first\_surface\_cavity}}$, and the secondary-time near-surface cavity, denoted as
  $p_{{second\_surface\_cavity}}$. However, there is no such increased pressure for a convex surface, and the maximum pressure profile is less than that of a concave surface. A convex surface configuration can effectively reduce the maximum pressure and local pressure increase during high-speed droplet impingement. For a flat surface, there is a drastic pressure increase at the very early stage after the initial impinging instant, which is present around the contact periphery before the strong lateral jets burst out (Lesser Reference Lesser1981; Xiong, Koshizuka & Sakai Reference Xiong, Koshizuka and Sakai2010). The peak pressure values due to the collapse of the focus cavity and first near-surface cavity, denoted as
  $p_{{focus\_cavity}}$ and
  $p_{{first\_surface\_cavity}}$, respectively, are also observed in the maximum pressure profile in a flat surface. In general, except for those in the very initial stage, the maximum pressures of a flat surface are less than those of a concave surface.
Several particular peak pressures on concave surfaces at different initial impinging velocities are compared in figure 14(b), which shows the water-hammer pressures,  $p_{{initial\_impinging}}$, at the initial interaction instant, and the peak pressures on a concave surface induced by the collapse of the first- and secondary-time cavities,
  $p_{{first\_surface\_cavity}}$ and
  $p_{{second\_surface\_cavity}}$, respectively. The surface pressure increases for a flat surface because the surface cavity collapse is generally weaker than that of a concave surface. The corresponding values are not shown in this figure. As no near-surface cavity is generated in droplet impingement on a convex surface, no intensified pressures act on the surface. For example, through the monitoring point on the surface when
  $V_0 = 300 \ \textrm {m}\ \textrm {s}^{-1}$, the pressure on the surface is
  $-10\ \textrm {MPa}$ at the instant when the reflected rarefaction waves propagate to the concave surface and is 260 MPa at the instant when the first-time near concave surface cavity totally collapses. However, in a convex surface, the pressures on the surface are 75 and 40 MPa, respectively, at the same instants. As the sub-grid-scale cavity dynamics cannot be precisely considered (Ando, Colonius & Brennen Reference Ando, Colonius and Brennen2011; Fuster & Colonius Reference Fuster and Colonius2011; Maeda & Colonius Reference Maeda and Colonius2019), the peak pressure during the cavity zone collapse might be underestimated in the current study. However, as the vapour volume fraction in the cavitation region is not too high (basically less than 20 %, as shown in figure 9), it is appropriated to ignore the sub-grid bubble–bubble effect in the cavitation region for the present study.
As shown in figure 14(b), the strength of  $p_{{initial\_impinging}}$ is closely related to the initial impinging velocity. Here
  $p_{{first\_surface\_cavity}}$ and
  $p_{{second\_surface\_cavity}}$ have almost the same value as
  $p_{{initial\_impinging}}$ (an order of magnitude of thousands of times the initial flow field pressure
  $p_0$), but in some cases, the cavity collapsing pressure is even higher than
  $p_{{initial\_impinging}}$. It can be inferred that the cavity collapsing pressure can contribute to the centre localised pit of damage on the concave surface that is induced by the cavity collapsing. This implies that the convex shape can effectively reduce the local pressure increase and the corresponding damage to the surface during droplet impingement.
7. Axisymmetric results
In this section, the impact of an axisymmetric droplet is simulated to study the influences of symmetric configuration on wave propagation and cavitation. In (3.1), the coordinate factor  $\delta$ is 1, and the 2-D axisymmetric case can be considered. The initial impinging velocity is
  $150 \ \textrm {m}\ \textrm {s}^{-1}$, and the other parameters are the same as those for planar 2-D cases.
Figures 15–17 present the numerical results of axisymmetric droplet impingement on concave, flat and convex surfaces, respectively. The flow dynamics during impact can be characterised by the evolution of the wave structures. The basic dynamic processes are inherently similar for both planar 2-D and 2-D axisymmetric cases. The previous analysis can be applied to 2-D axisymmetric droplet impingement, but the difference should be noted between the planar 2-D and 2-D axisymmetric results.

Figure 15. The pressure contour (left half) and density schlieren (right half) of 2-D axisymmetric droplet impingement on a concave surface at the time instants  $(a)$
$(a)$  $t/(D_0/c_{l}) = 0.04$,
  $(b)$
$(b)$  $t/(D_0/c_{l}) = 1.23$,
  $(c)$
$(c)$  $t/(D_0/c_{l}) = 1.41$,
  $(d)$
$(d)$  $t/(D_0/c_{l}) = 1.56$,
  $(e)$
$(e)$  $t/(D_0/c_{l}) = 2.31$ and
  $(f)$
$(f)$  $t/(D_0/c_{l}) = 2.43$. The cavitation zone is located by the isolines of the vapour volume fraction.

Figure 16. The pressure contour (left half) and density schlieren (right half) of 2-D axisymmetric droplet impingement on a flat surface at the time instants  $(a)$
$(a)$  $t/(D_0/c_{l}) = 0.06$,
  $(b)$
$(b)$  $t/(D_0/c_{l}) = 0.89$,
  $(c)$
$(c)$  $t/(D_0/c_{l}) = 1.16$,
  $(d)$
$(d)$  $t/(D_0/c_{l}) = 1.23$,
  $(e)$
$(e)$  $t/(D_0/c_{l}) = 2.21$ and
  $(f)$
$(f)$  $t/(D_0/c_{l}) = 2.37$. The cavitation zone is located by the isolines of the vapour volume fraction.

Figure 17. The pressure contour (left half) and density schlieren (right half) of 2-D axisymmetric droplet impingement on a convex surface at the time instants  $(a)$
$(a)$  $t/(D_0/c_{l}) = 0.05$,
  $(b)$
$(b)$  $t/(D_0/c_{l}) = 1.29$,
  $(c)$
$(c)$  $t/(D_0/c_{l}) = 1.35$,
  $(d)$
$(d)$  $t/(D_0/c_{l}) = 1.44$,
  $(e)$
$(e)$  $t/(D_0/c_{l})= 1.80$ and
  $(f)$
$(f)$  $t/(D_0/c_{l}) = 2.55$.
The space–time diagram of the magnitude of velocity and pressure on different curved surfaces at the initial impinging stage are shown in figure 18. The pressure variations at the central point on different curved surfaces (point  $C$ as shown in figure 18) are shown in figure 19(a). Figure 19(b) presents the variations in the maximum pressure in the flow field during impact. Compared with the planar 2-D cases shown in figure 14(a), the values of
  $p_{{initial\_impinging}}$ are the same for these six cases because
  $p_{{initial\_impinging}}$ mainly depends on the initial impinging velocity.

Figure 18. Comparison of space–time diagrams of the velocity (left) and pressure (right) distributions on different surfaces during the initial stage of 2-D axisymmetric impingement with an initial velocity of  $150 \ \textrm {m}\ \textrm {s}^{-1}$:
  $(a)$ concave surface;
  $(b)$ flat surface; and
  $(c)$ convex surface.

Figure 19. Comparison of the pressure distributions of 2-D axisymmetric impingement on different curved surfaces with an initial velocity of  $150 \ \textrm {m}\ \textrm {s}^{-1}$:
  $(a)$ the central point on the surface (point
  $C$ as shown in figure 18) and
  $(b)$ the maximum pressure in the whole flow field.
For a concave surface, as shown in figures 19(a) and 19(b), the pressure increases because the concave type of confined water-hammer shock wave is intensified owing to the influence of symmetric configuration. Then, similar to the planar 2-D case, the confined water-hammer shock is reflected on the droplet's interface, and reflected rarefaction waves are generated. As shown in figures 15(b) and 15(c), in the 2-D axisymmetric case, the intensified converging effect of the reflected rarefaction waves induces a larger homogeneous focus cavity and stronger collapsing compression waves, and the value of  $p_{{focus\_cavity}}$ thus increases. When the collapsing compression waves propagate to the droplet's upside interface, they are reflected as rarefaction waves. As the convergence of these reflected rarefaction waves is intensified due to the influence of axisymmetric configuration, the local fluid pressure significantly decreases and homogeneous focus cavities appear again near the droplet's top pole, as shown in figure 15(d). Moreover, near-surface cavities are also generated inside around the concave area (figure 15e), which increases the pressure on the concave surface when they collapse (figure 15f). As shown in figure 19(a), the peak pressure on the surface induced by the near-surface cavity collapse in the 2-D axisymmetric case is larger than in the planar 2-D case owing to the increase in the convergence effect.
For a flat surface, the high pressure around the contact periphery and the strength of the lateral jets are weakened in the 2-D axisymmetric case, as shown in figures 18(b) and 19(b). The confined shock waves weaken more rapidly than those in the planar 2-D case during their expanding propagation, as shown in figures 16(a) and 16(b), although the values of  $p_{{initial\_impinging}}$ are the same for both cases. As the shock wave propagation law is different in the planar case than in the spherical case (Lesser Reference Lesser1981), the pressure behind the spherical shock wave decreases more quickly than that behind the circular shock wave front. Reflected rarefaction waves are generated by the reflection of the confined shock wave. Similar to a concave surface, the convergence of the reflected rarefaction waves intensifies in the 2-D axisymmetric case, which induces a higher value of
  $p_{{focus\_cavity}}$ and
  $p_{{c\_surface}}$, as shown in figure 19.
However, for a convex surface, as shown in figure 17(a), the strength of the confined shock wave is also weaker than the planar 2-D case during its expanding propagation. For the intensified converging effect of the reflected rarefaction waves inside the 2-D axisymmetric droplet, as shown in figure 17(b), the peak pressure value at converging point  $F$ reaches approximately
  $-100\ \textrm {MPa}$, which is almost the same as in the planar 2-D case, although the strength of the confined shock wave is weaker. As shown in figure 17(d), there is a local high-pressure zone near the droplet's top pole owing to the intensified convergence of the reflected compression waves (these reflected compression waves are induced by the secondary reflection of the reflected rarefaction waves from the upside droplet's interface), where the instantaneous peak pressure value reaches approximately 60 MPa. This value is even higher than the corresponding value in the planar 2-D case. Similar to the planar 2-D case, neither a homogeneous focus cavity nor a heterogeneous near-surface cavity is observed in the 2-D axisymmetric case for a convex case with an impinging velocity of
  $150 \ \textrm {m}\ \textrm {s}^{-1}$.
In general, both the converging and diverging motions of the waves intensify owing to the influence of axisymmetric configuration, which may further intensify the damage on a concave solid surface but decrease the damage on a convex surface.
8. Conclusion
In the present study, the compressible multi-phase fluid model has been employed to numerically investigate high-speed droplet impingement on different curved solid surfaces. The phase transition numerical model has been adapted to the source terms in the governing equations. Both homogeneous and near-surface heterogeneous cavitation can thus be captured during impacted droplet evolution considering the different surface geometries. The dynamics of the confined shock waves, occurrence and collapse of cavitation and the increased pressures on the impacted curved surface have been analysed and compared for different surface configurations.
Water-hammer shock waves are generated in impacted droplets for all cases of different geometrical surfaces, whereas the wave strength is stronger in a concave surface at the same initial impinging velocity. Both the critical contact angle  $\alpha _{{c}}$ and critical instant
  $t_{{c}}$ characterised in the present study increase with the initial impinging velocity. The detached confined water-hammer shock wave is reflected on the droplet's interface and generates reflected rarefaction waves whose strength is positively related to the strength of the water-hammer shock wave. The reflected rarefaction waves converge inside the droplet owing to the curved droplet interface. The strong converging effects of the rarefaction waves induce very low local fluid pressures, and once homogeneous cavitation is triggered, a homogeneous focus cavity occurs. Hence, the stronger confined water-hammer shock wave (owing to the increase in the initial impinging velocity or droplet impingement on a concave surface) can more easily trigger a homogeneous focus cavity.
As the reflected rarefaction waves propagate to solid surfaces, they are reflected by the surface again and form as re-reflected rarefaction waves near the surface area. If the fluid expansion is significantly violent close to the surface owing to local rarefaction, heterogeneous cavitation will be triggered, and local heterogeneous cavities will occur there. Based on the comparisons, the superposition effect of the re-reflected rarefaction waves intensifies around the surface's concave area, but the re-reflected waves are decentralised by a convex surface. Therefore, a convex curved surface can reduce the possibility and degree of near-surface cavitation during high-speed droplet impingement.
This work can be also helpful to understand surface damage due to high-speed droplet impact. During impact, strong water-hammer pressure is generated to overload on the surface; the high-pressure region and strong lateral jets around the contact periphery may contribute to erosion at the contact line region, and the collapse pressure of the near-surface cavities may intensify the local damage in the impact region. Based on the quantitative analysis of the impact, a convex surface decreases both the strength of the shock wave and jets and the occurrence of near-surface cavities, which can reduce the possibility of damage.
The 2-D axisymmetric simulation results show that both the converging motion and diverging motion of the waves is intensified due to the influence of axisymmetric configuration. Thus, compared with the planar 2-D case, the strengths of the fluid pressure and lateral jet near the contact periphery are both weakened. The level of near-surface cavitation also changes to be either higher in a concave case or lower in a convex case. These results can be helpful to provide strategies for the prevention of surface damage in future industrial applications.
The present study has mainly discussed the curved surface configuration just corresponding to the curvature of the droplet. However, the random characteristics of the curved surface, for example, different curvature and different bump height or indentation depth, should be considered in the influence mechanism, which will be further investigated in the future work.
Acknowledgements
The authors are grateful for the support of the National Natural Science Foundation of China (grant numbers 12002039, 51676111, 12032005 and NSAF-U1730104) and the China Postdoctoral Science Foundation (grant number 2020M670145).
Declaration of interests
The authors report no conflict of interest.
Appendix A
This appendix discusses the pressure threshold values for bulk-flow homogeneous and near-surface heterogeneous cavitation. Generally speaking, the heterogeneous nucleation includes the cavitation arising from the hydrophobic surface and the pre-existing gas nuclei (Brennen Reference Brennen2013; Yamashita & Ando Reference Yamashita and Ando2019). In the present study, we mainly consider the homogenous cavitation in the bulk flow and the near-surface heterogenous cavitation, where the situation of the heterogeneous nucleation on the pre-existing gas nuclei is not included. Referring to Caupin & Herbert (Reference Caupin and Herbert2006) and Herbert, Balibar & Caupin (Reference Herbert, Balibar and Caupin2006), before homogeneous cavitation bubbles can grow freely, the energy barrier needed to break is
 \begin{equation} {E_{{b}}} = \frac{{16{\rm \pi} }}{3}\frac{{{\sigma ^3}}}{{{{\left( {{p'} - p} \right)}^2}}}, \end{equation}
where  $\sigma$ is the surface tension coefficient and
  $p'$ is the pressure at which the vapour is at the same chemical potential as the liquid at local pressure
  $p$. The homogeneous nucleation rate is proportional to
  $\exp [ { - {E_{{b}}}/( {{k_{{b}}}T} )} ]$, that is, cavitation occurs when
  $E_{{b}}$ is comparable with the heat fluctuation. Here,
  $k_{{b}}$ is Boltzmann's constant and
  $T$ is the absolute temperature. Thus, corresponding to a certain nucleation rate, the required pressure difference at the local thermodynamic state
  $p'-p$ (that is, the degree of deviation from the stable state) can be obtained theoretically. An approximate expression of the value of the threshold cavitation pressure
  $p_{{bulk}} (T)$ corresponding to homogeneous nucleation can be referred to in previous work (Wu et al. Reference Wu, Xiang and Wang2018).
In near-surface heterogeneous cavitation, the metastable liquid is in contact with a solid substrate, and the energy barrier depends on the surface wetting properties, which may lower the energy required to create a vapour bubble. Hence, the influence of the surface contact angle  $\xi$ must be considered, and the corresponding expression of the relationship between the pressure difference and energy barrier is
 \begin{equation} {\left( {{p'} - p} \right)^2} = \frac{{16{\rm \pi} }}{3}\frac{{{\sigma ^3}}}{{{E_{{b}}}}}\frac{{\left( {2 - \cos \xi } \right){{\left( {1 + \cos \xi } \right)}^2}}}{4}. \end{equation}
Therefore, the required pressure difference  $p'-p$ of near-surface heterogeneous cavitation corresponding to the same nucleation rate may change. The relationship between the coefficient of the cavitation threshold pressure
  $p_{{surface}}$ and the contact angle
  $\xi$ is shown in figure 20.

Figure 20. Relationship between the coefficient of the heterogeneous cavitation threshold pressure and the contact angle  $\xi$.
As the contact angle increases, the coefficient of the cavitation threshold pressure decreases accordingly, as shown in figure 20, which means the required corresponding pressure difference (that is, the degree of deviation from the stable state) will decrease. Considering the influence of the surface characteristic factors, such as the material and surface roughness, the contact angle is  $150^{\circ }$ for all of the present cases. Here,
  $p_{{bulk}}$ is approximately 1/9 of
  $p_{{bulk}}$ under the same thermodynamic state. The influences of different surface properties will be further discussed in future research.
Appendix B
This appendix provides a detailed analysis and theoretical derivation of droplet impingement on both concave and convex surfaces at the initial impinging stage. The corresponding schematic diagrams for the earlier impinging stage at instant  $t_0$ (the initial instant,
  $t = 0$) and instant
  $t_1$ are shown in figure 5.
(a) Concave surface
For droplet impingement on a concave surface, as shown in figure 5(a), considering the velocity triangle at contact point  $A$ at instant
  $t_1$ in the horizontal direction, we can obtain
 \begin{equation} {V_{{{AC}}}}\cos {\theta _1} = {V_{{A}}}\cos {\beta _1}, \end{equation}
and in the vertical direction
 \begin{equation} {V_{{{AC}}}}\sin {\theta _1} - {V_{{A}}}\sin {\beta _1} = {V_0}. \end{equation}
Then, with the combination of (B 1) and (B 2), to eliminate  $V_{{A}}$ as follows:
 \begin{equation} {V_{{{AC}}}}\sin {\theta _1} - {V_{{{AC}}}}\cos {\theta _1}\tan {\beta _1} = {V_0}. \end{equation}
 As shown in figure 5(a),  $L$ is the horizontal distance between the initial centre point
  ${{C}}_0$ of the droplet and the centre point B of a surface circular arc with radius
  $r_0$. At instant
  $t_0$, we can obtain
 \begin{equation} L = \left( {{R_0} + {r_0}} \right)\sin {\theta _0}, \end{equation}
and for instant  $t_1$
$t_1$
 \begin{equation} L = {R_0}\sin {\theta _1} + {r_0}\sin {\beta _1}. \end{equation}
Then, with the combination of (B 4) and (B 5), to eliminate  $L$ as follows:
 \begin{equation} \left( {{R_0} + {r_0}} \right)\sin {\theta _0} = {R_0}\sin {\theta _1} + {r_0}\sin {\beta _1}. \end{equation}
With the combination of (B 3) and (B 6), when  $V_{{{AC}}}$ is given, the values of
  $\theta _1$ and
  $\beta _1$ can be solved iteratively.
As shown in figure 5(a),  $H$ is the vertical distance between the initial centre point
  ${{C}}_0$ of the droplet and point
  $B$. At instant
  $t_0$, we can obtain
 \begin{equation} H = \left( {{R_0} + {r_0}} \right)\cos {\theta _0}, \end{equation}
and for instant  $t_1$
$t_1$
 \begin{equation} H = {R_0}\cos {\theta _1} + {r_0}\cos {\beta _1} + {V_0}({t_1} - {t_0}). \end{equation}
As  $t_0 = 0$, combining (B 7) and (B 8) to eliminate
  $H$ and substituting the value of
  $\theta _1$ and
  $\beta _1$, we can theoretically obtain the expression of the time:
 \begin{equation} {t_{{1}}} = \frac{{({R_0} + {r_0})\cos {\theta _0} - {R_0}\cos {\theta _{{1}}} - {r_0}\cos {\beta _{{1}}}}}{{{V_0}}}. \end{equation}
(b) Flat surface
For a droplet impinging on a flat surface, as shown in figure 5(b), considering the velocity triangle of contact point  $A$ at instant
  $t_1$ in the vertical direction, we can obtain (Rein Reference Rein1993)
 \begin{equation} {V_{{{AC}}}}\sin {\theta _1} = {V_0}. \end{equation}
If  $V_{{{AC}}}$ is given, the values of
  $\theta _1$ can be obtained
 \begin{equation} {\theta _{{1}}} = \arcsin \frac{{{V_0}}}{{{V_{{{AC}}}}}}. \end{equation}
 As shown in figure 5(b), the vertical distance between the initial centre point  ${{C_0}}$ of the droplet and flat surface is
  $R_0$, and we can obtain
 \begin{equation} {R_0} = {R_0}\cos {\theta _1} + {V_0}({t_1} - {t_0}). \end{equation}
As  $t_0 = 0$, substituting the value of
  $\theta _1$, we can theoretically obtain the expression of the time
 \begin{equation} {t_{{1}}} = \frac{{{R_0}\left( {1 - \cos {\theta _{{1}}}} \right)}}{{{V_0}}}. \end{equation}
(c) Convex surface
For droplet impingement on a convex surface, as shown in figure 5(c), considering the velocity triangle of contact point  $A$ at instant
  $t_1$ in the vertical component direction, we can obtain
 \begin{equation} 2{V_{{{AC}}}}\sin {\theta _1} = {V_0}. \end{equation}
When  $V_{{{AC}}}$ is given, the values of
  $\theta _1$ can be obtained
 \begin{equation} {\theta _{{1}}} = \arcsin \frac{{{V_0}}}{{2{V_{{{AC}}}}}}. \end{equation}
 As shown in figure 5(c), the vertical distance between the initial centre point  ${{C_0}}$ of the droplet and point
  ${{C_{surface}}}$ (the centre point of the surface circular arc with radius
  $R_0$) is
  $2R_0$, and we can obtain
 \begin{equation} 2{R_0} = 2{R_0}\cos {\theta _1} + {V_0}({t_1} - {t_0}). \end{equation}
As  $t_0 = 0$, substituting the value of
  $\theta _1$, we can theoretically obtain the expression of the time
 \begin{equation} {t_{{1}}} = \frac{{2{R_0}\left( {1 - \cos {\theta _{{1}}}} \right)}}{{{V_0}}}. \end{equation}


