1 Introduction
The appearance of vortical structures in fluid-based machines is often associated with a reduction in their efficiency and performance. The generation of large wake vortices contributes to increased drag on bodies, and the presence of near-wall vortices in turbulent flows produces higher wall shear stresses compared with those of laminar flows for both internal and external flows. Added complications can arise when these vortices emerge in liquids. Low-pressure cores of strong vortices can become hollow due to cavitation or accumulation of gas bubbles present in the flow. When such hollow-core vortices are engulfed by pumps, they not only degrade the operating performance but can also cause unsteady loading, potentially damaging the structures (Zhao Reference Zhao2010; Brennen Reference Brennen2011). In many fluid-based applications, sustained operation of these machines at desired levels of performance is of critical importance, especially when they are utilized for chemical production, cooling in nuclear power plants and storm surge response (An et al. Reference An, Liu, Taira, Nohmi and Obuchi2018).
To date, there have been numerous studies on the implementation of passive flow control to prevent vortex generation or to alleviate core-pressure effects in turbomachinery, including anti-vortex baffles (Yang Reference Yang2017) and geometric modifications. Nonetheless, passive control does not offer the ability to adjust the control effort adaptively. The design of efficient and reliable active flow control techniques for the vortical flow associated with pumps is still underexplored, but has great potential to improve their sustained operation in critical applications.
In the present study, we consider a wall-normal vortex that emerges upstream of turbomachinery. An example of such a hollow-core vortex in water is exhibited in figure 1(a), highlighted within the box (red dashed line). We model this type of vortex as a single-phase wall-normal vortex in the computational study, as illustrated in figure 1(b). The flow enters the computational domain from the circumferential side over a no-slip wall at the bottom and exits through the top. The vortical flow is simulated by prescribing the Burgers vortex (Burgers Reference Burgers1948) velocity profile along the inlet plane.
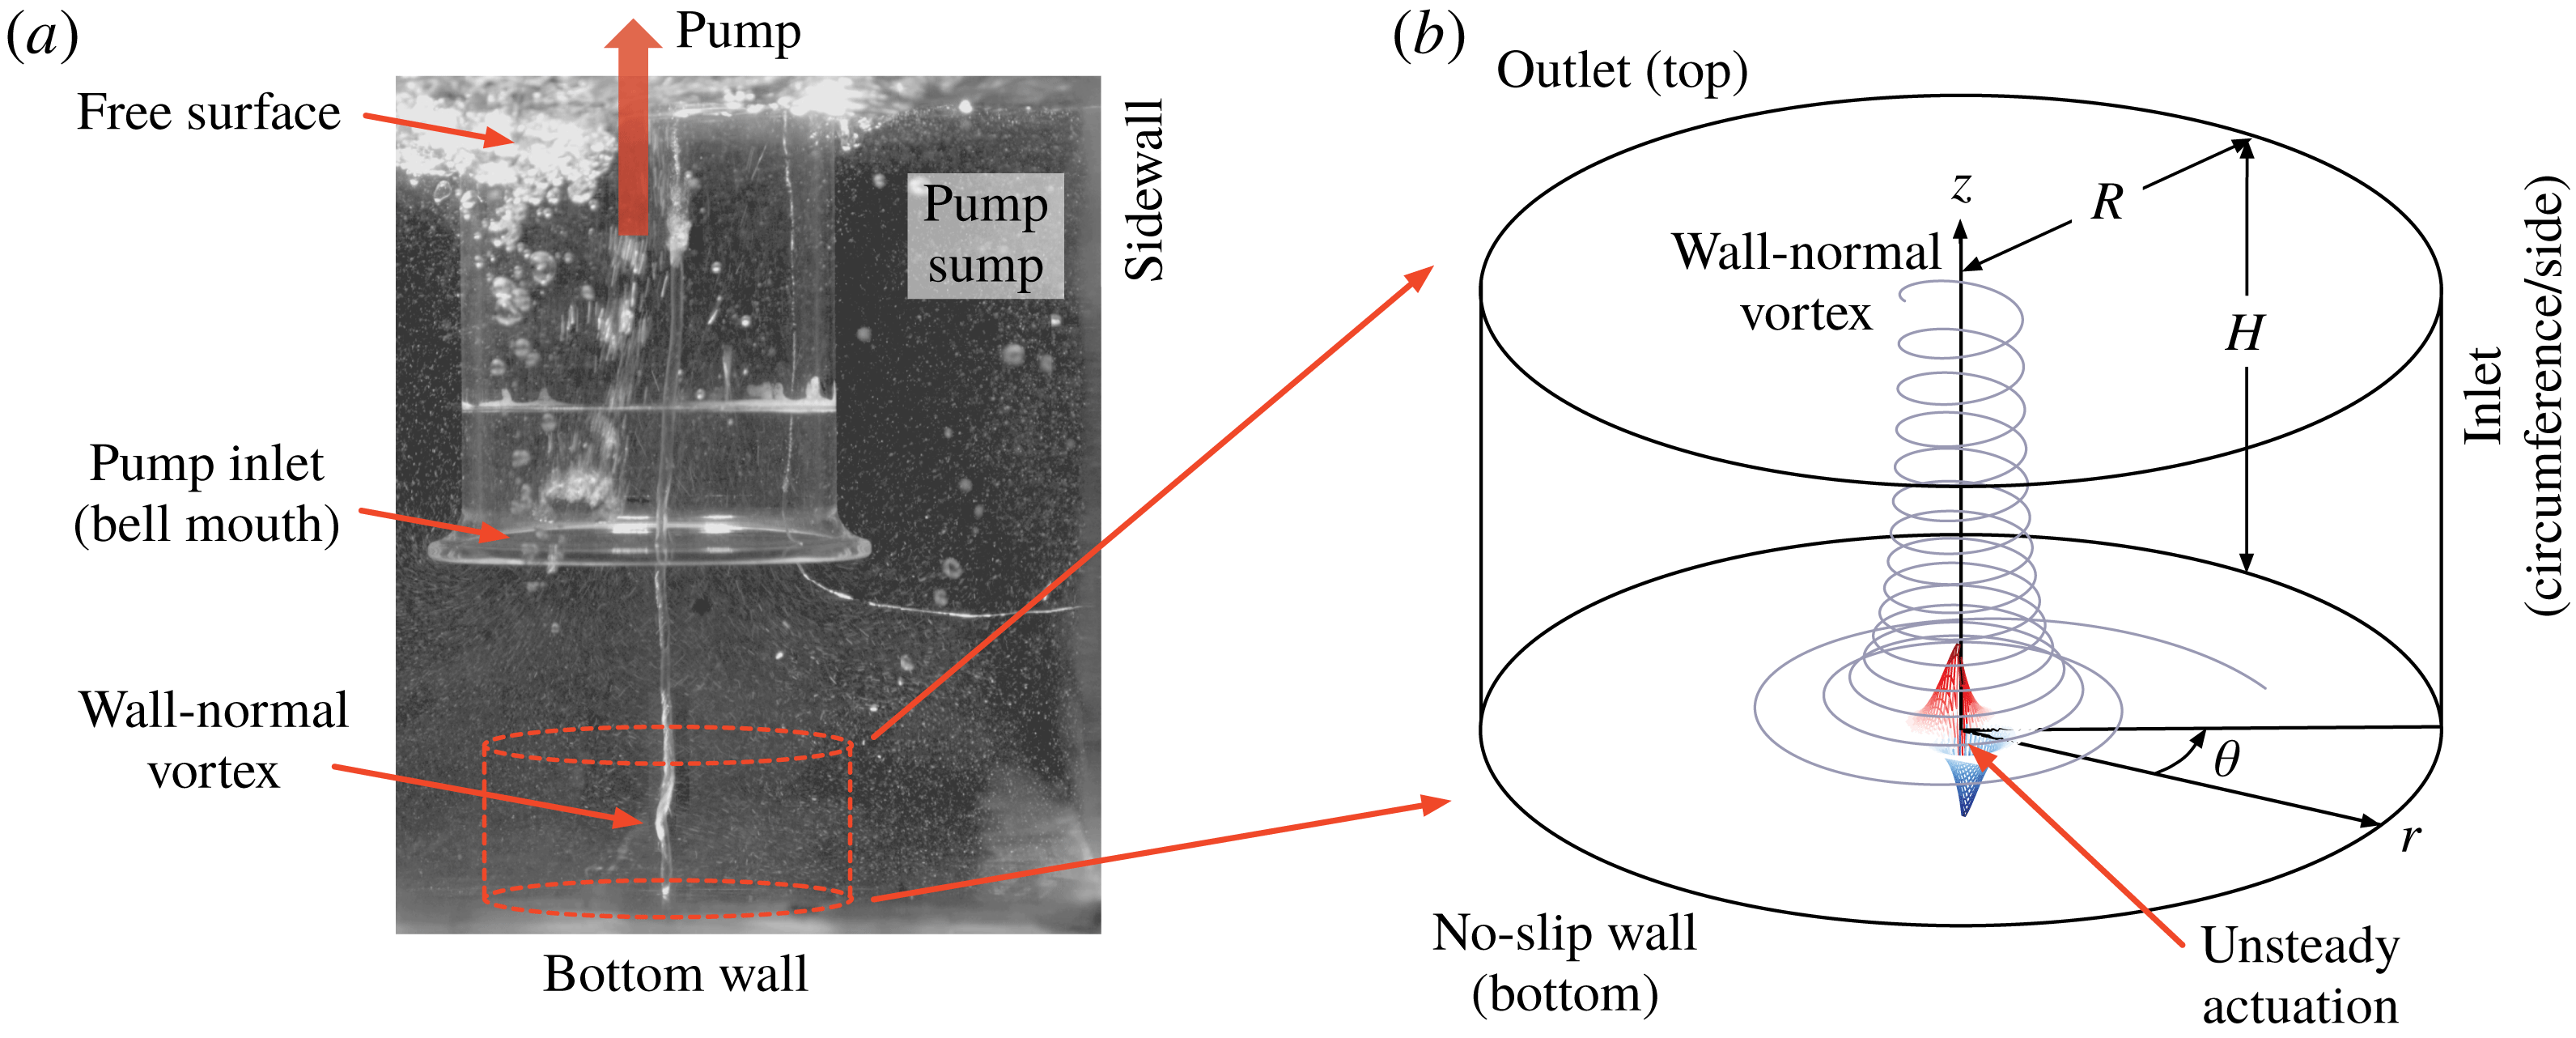
Figure 1. (a) Experimental visualization of a submerged wall-normal vortex generated under an inlet in a pump sump (water). A second wall-normal vortex terminating at the sidewall can also be observed. (b) The computational set-up used in the present flow control study to analyse the model vortex.
The Burgers vortex is the exact steady solution to the incompressible Navier–Stokes equations (Burgers Reference Burgers1948), which has been studied in detail in the past (Saffman Reference Saffman1992; Wu, Ma & Zhou Reference Wu, Ma and Zhou2006). In particular, its stability properties have been analysed by Leibovich & Holmes (Reference Leibovich and Holmes1981), Crowdy (Reference Crowdy1998) and Schmid & Rossi (Reference Schmid and Rossi2004). The linear three-dimensional stability analysis of Schmid & Rossi (Reference Schmid and Rossi2004) reported that the Burgers vortex is neutrally stable but can exhibit transient energy growth. Such behaviour can alter the mean flow field in fully nonlinear flow. In the present study, we aim to introduce forcing inputs that leverage the transient growth to alter the radial profile of the vortex core for pressure increase to alleviate the aforementioned adverse effects.
In what follows, we present our approach to model the single-phase wall-normal vortex in § 2 and describe its baseline characteristics in § 3. Dynamic mode decomposition is performed on the baseline flow field to gain insights into the oscillatory dynamics of the wall-normal vortex and to develop an effective flow control technique. In § 4, we apply active flow control based on the baseline characterization to effectively modify the radial profile of the vortex and increase the core pressure. Finally, the paper offers some concluding remarks in § 5.
2 Problem description and approach
We numerically study the single-phase wall-normal vortex and the influence of unsteady actuation on its core profile. A cylindrical computational domain is considered. The inflow enters from the circumferential side and leaves from the top boundary, where a convective outflow condition is provided. Along the bottom wall, a no-slip wall boundary condition is prescribed. The swirling flow is introduced from the circumferential inflow boundary using the laminar velocity profile of the Burgers vortex (Burgers Reference Burgers1948),
at
![]() $r=R$
and
$r=R$
and
![]() $0\leqslant z\leqslant H$
, where
$0\leqslant z\leqslant H$
, where
![]() $\unicode[STIX]{x1D6E4}_{\infty }$
is the circulation of the Burgers vortex model and
$\unicode[STIX]{x1D6E4}_{\infty }$
is the circulation of the Burgers vortex model and
![]() $\unicode[STIX]{x1D6FE}$
is the strain rate imposed on the flow. The Burgers vortex has a maximum rotational velocity
$\unicode[STIX]{x1D6FE}$
is the strain rate imposed on the flow. The Burgers vortex has a maximum rotational velocity
![]() $u_{\unicode[STIX]{x1D703},max}$
at
$u_{\unicode[STIX]{x1D703},max}$
at
![]() $r=1.12a$
, where
$r=1.12a$
, where
![]() $a$
is the core radius. In the present work, we report our results scaled by
$a$
is the core radius. In the present work, we report our results scaled by
![]() $a$
for length,
$a$
for length,
![]() $u_{\unicode[STIX]{x1D703},max}$
for velocity and
$u_{\unicode[STIX]{x1D703},max}$
for velocity and
![]() $p^{\ast }=(1/2)\unicode[STIX]{x1D70C}u_{\unicode[STIX]{x1D703},max}^{2}$
for pressure, where
$p^{\ast }=(1/2)\unicode[STIX]{x1D70C}u_{\unicode[STIX]{x1D703},max}^{2}$
for pressure, where
![]() $\unicode[STIX]{x1D70C}$
is the density of the fluid. The non-dimensional parameter relevant for this study is the circulation-based Reynolds number, which is set to
$\unicode[STIX]{x1D70C}$
is the density of the fluid. The non-dimensional parameter relevant for this study is the circulation-based Reynolds number, which is set to
![]() $Re\equiv \unicode[STIX]{x1D6E4}_{\infty }/\unicode[STIX]{x1D708}=5000$
, where
$Re\equiv \unicode[STIX]{x1D6E4}_{\infty }/\unicode[STIX]{x1D708}=5000$
, where
![]() $\unicode[STIX]{x1D708}$
is the kinematic viscosity. The strain rate is determined from the choice of Reynolds number and the core radius
$\unicode[STIX]{x1D708}$
is the kinematic viscosity. The strain rate is determined from the choice of Reynolds number and the core radius
![]() $a$
such that
$a$
such that
![]() $\unicode[STIX]{x1D6FE}=4\unicode[STIX]{x1D708}/a^{2}$
. The circulation based on the present scaling is
$\unicode[STIX]{x1D6FE}=4\unicode[STIX]{x1D708}/a^{2}$
. The circulation based on the present scaling is
![]() $\unicode[STIX]{x1D6E4}_{\infty }a/u_{\unicode[STIX]{x1D703},max}=9.848$
.
$\unicode[STIX]{x1D6E4}_{\infty }a/u_{\unicode[STIX]{x1D703},max}=9.848$
.
Direct numerical simulations are performed using a second-order finite-volume-based solver, Cliff, to numerically solve the incompressible Navier–Stokes equations (Ham & Iaccarino Reference Ham and Iaccarino2004). The size of the domain is chosen to be
![]() $R/a=H/a=15$
. We have compared results from this domain with those from a larger domain of
$R/a=H/a=15$
. We have compared results from this domain with those from a larger domain of
![]() $R/a=H/a=20$
to ensure that the domain size is sufficiently large. The maximum difference in the local pressure value is limited to 3 %. The present computational domain is discretized using a structured mesh with 8.4 million grid points, which was deemed to be adequate in comparison with results based on a mesh with 15.6 million grid points, which showed only a maximum local pressure difference of 0.6 %. The actuator set-up is described later in § 4.1.
$R/a=H/a=20$
to ensure that the domain size is sufficiently large. The maximum difference in the local pressure value is limited to 3 %. The present computational domain is discretized using a structured mesh with 8.4 million grid points, which was deemed to be adequate in comparison with results based on a mesh with 15.6 million grid points, which showed only a maximum local pressure difference of 0.6 %. The actuator set-up is described later in § 4.1.
3 Baseline flow
We examine the baseline wall-normal vortex generated by imposing the Burgers vortex inlet velocity profile. The current vortical flow differs from the Burgers vortex model since a laminar boundary layer develops along the bottom wall and the resulting vorticity flux is engulfed into the wall-normal vortex. The vortex cores of the Burgers vortex and the current vortical flow are visualized in figure 2. While the Burgers vortex is a steady solution to the Navier–Stokes equations with a constant core radius along the axial (
![]() $z$
) direction, the current flow model exhibits three different regions of the flow, characterized as (i) steady,
$z$
) direction, the current flow model exhibits three different regions of the flow, characterized as (i) steady,
![]() $0<z/a\lesssim 5$
, (ii) vortex breakdown,
$0<z/a\lesssim 5$
, (ii) vortex breakdown,
![]() $5\lesssim z/a\lesssim 8$
, and (iii) wake,
$5\lesssim z/a\lesssim 8$
, and (iii) wake,
![]() $8\lesssim z/a$
, as highlighted in colour in figure 2.
$8\lesssim z/a$
, as highlighted in colour in figure 2.
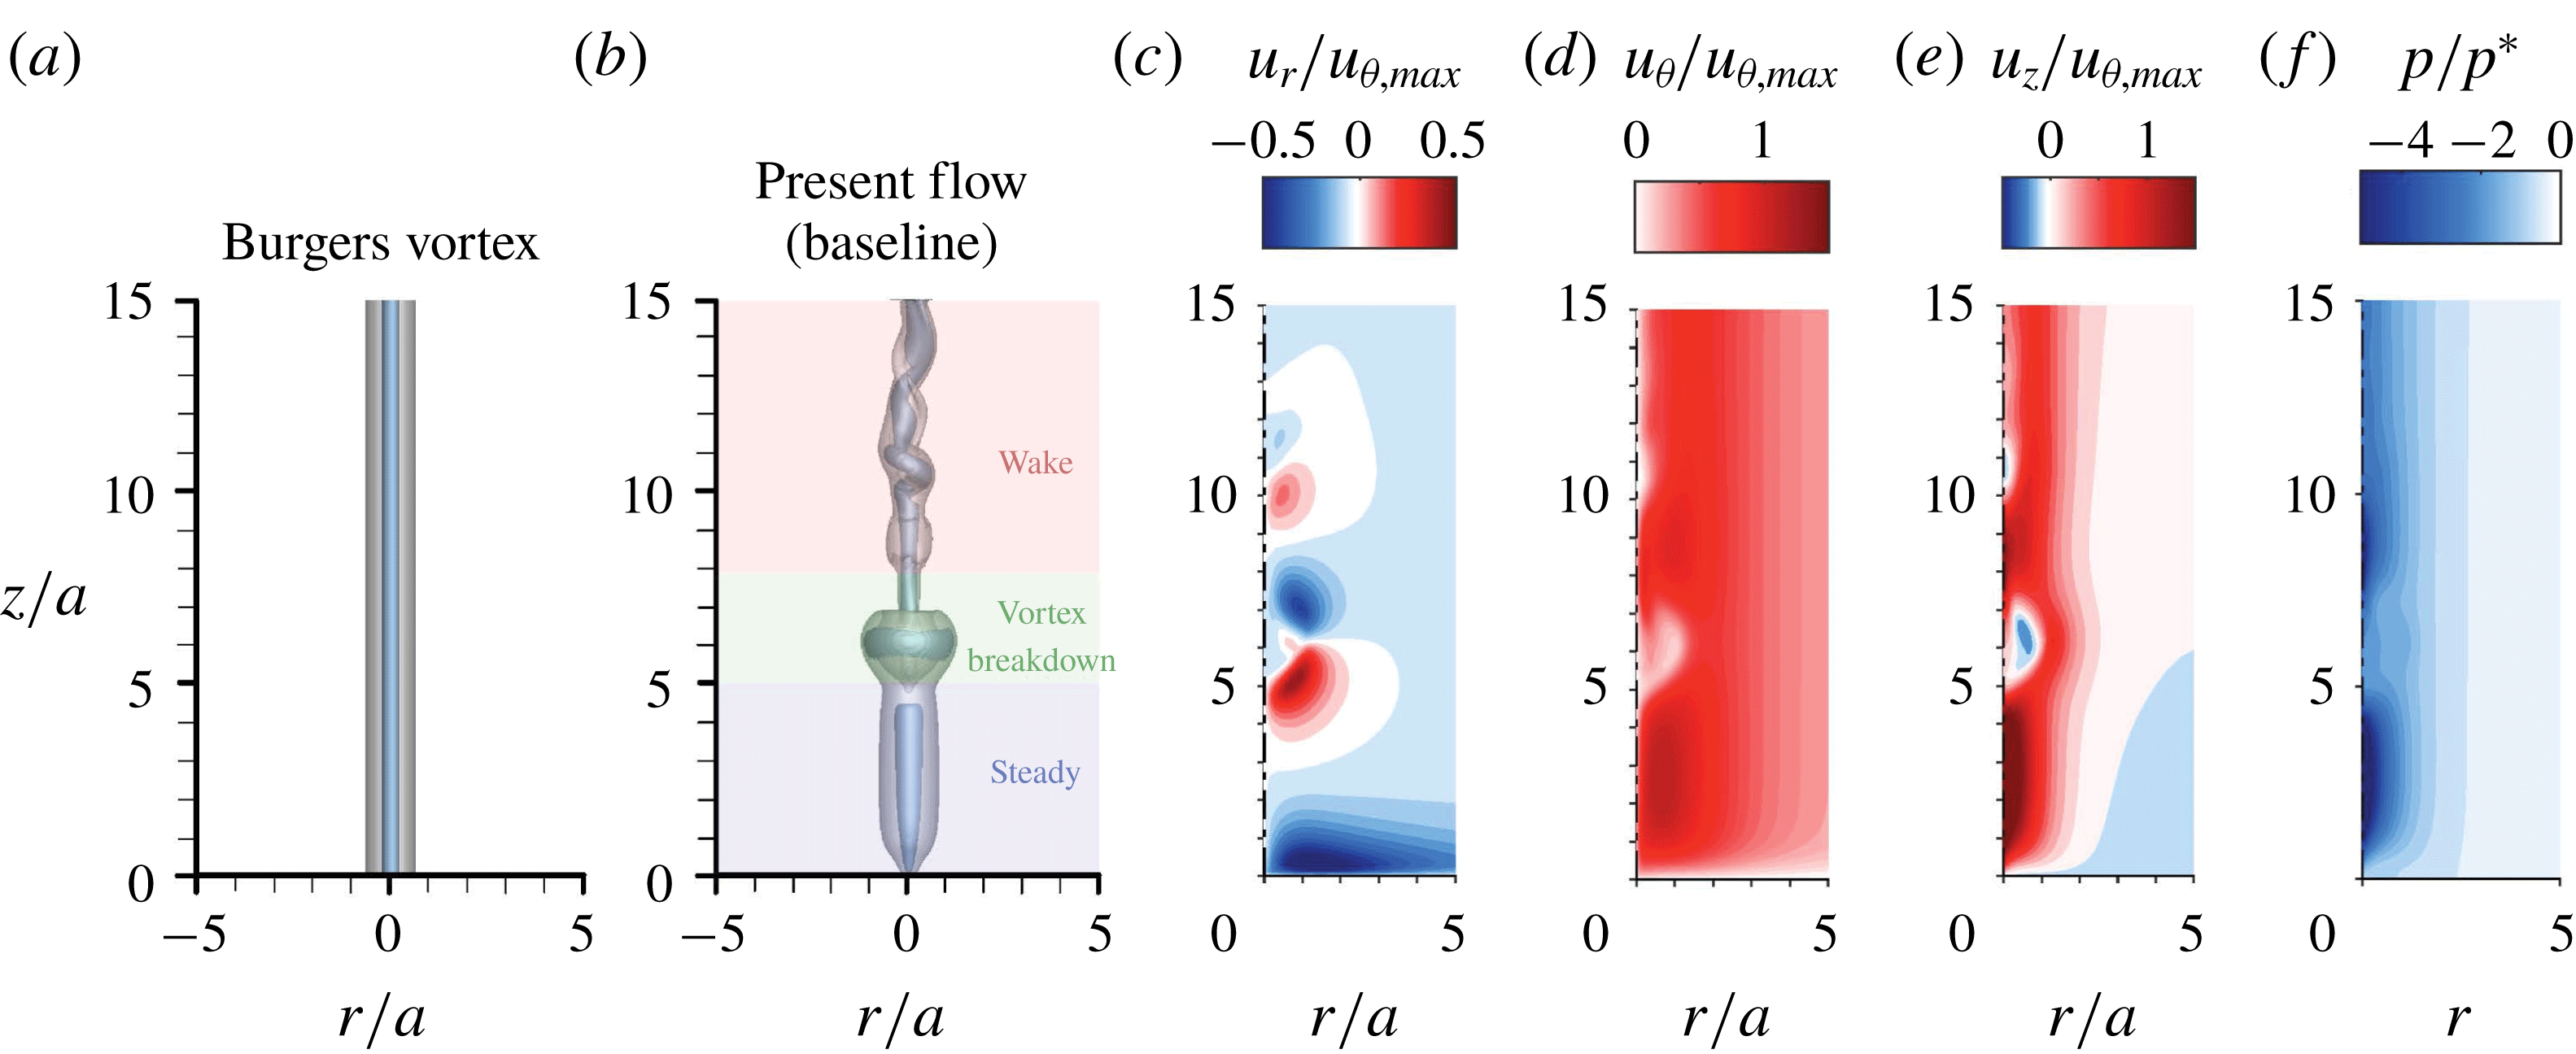
Figure 2. Instantaneous visualizations of (a) the Burgers vortex model and (b–f) the present baseline vortex. Panels (a) and (b) show the vortical structures based on the vorticity norm
![]() $\Vert \unicode[STIX]{x1D74E}\Vert =2$
(grey) and a
$\Vert \unicode[STIX]{x1D74E}\Vert =2$
(grey) and a
![]() $Q$
-criterion of
$Q$
-criterion of
![]() $Q=2$
(blue). The steady (blue), vortex breakdown (green) and wake (red) regions are highlighted in (b). Panels (c–f) show the time-averaged velocity and pressure distributions for the present flow.
$Q=2$
(blue). The steady (blue), vortex breakdown (green) and wake (red) regions are highlighted in (b). Panels (c–f) show the time-averaged velocity and pressure distributions for the present flow.
In the steady region (
![]() $0<z/a\lesssim 5$
), the vortex structure remains axisymmetric, as shown in figure 2. The swirling flow forms a cone-shaped vortex above the wall due to the wall effect, as shown by the velocity profiles in figure 2. As the flow convects upward from the sides, the core becomes uniform and resembles the Burgers vortex (
$0<z/a\lesssim 5$
), the vortex structure remains axisymmetric, as shown in figure 2. The swirling flow forms a cone-shaped vortex above the wall due to the wall effect, as shown by the velocity profiles in figure 2. As the flow convects upward from the sides, the core becomes uniform and resembles the Burgers vortex (
![]() $z/a\lesssim 5$
). Inward radial flow, quantified by radial velocity
$z/a\lesssim 5$
). Inward radial flow, quantified by radial velocity
![]() $u_{r}$
, emerges adjacent to the wall until it gets close to the centre
$u_{r}$
, emerges adjacent to the wall until it gets close to the centre
![]() $(x/a,z/a)=(0,0)$
. The inward radial flow is then redirected upward to provide a strong positive axial velocity
$(x/a,z/a)=(0,0)$
. The inward radial flow is then redirected upward to provide a strong positive axial velocity
![]() $u_{z}$
. Once the flow turns upward, the azimuthal velocity
$u_{z}$
. Once the flow turns upward, the azimuthal velocity
![]() $u_{\unicode[STIX]{x1D703}}$
reaches its maximum value at
$u_{\unicode[STIX]{x1D703}}$
reaches its maximum value at
![]() $r/a\approx 1.12$
away from the wall. In the steady flow region, a low-pressure region emerges in the vortex core, which is the target region of flow control to achieve increase in the pressure distribution, as we explore later.
$r/a\approx 1.12$
away from the wall. In the steady flow region, a low-pressure region emerges in the vortex core, which is the target region of flow control to achieve increase in the pressure distribution, as we explore later.
The vortex experiences a breakdown for
![]() $5\lesssim z/a\lesssim 8$
in the flow, which is one of the key differences between the current vortical flow and the Burgers vortex. This breakdown is axisymmetric and bulges outward, creating a spherical shape (Hall Reference Hall1972), as highlighted in green in figure 2. The vorticity generated at the wall advects along the vortex cores and leads to the emergence of the adverse pressure gradient. This causes the flow to expand radially, in a manner similar to flow separation. As a result, a recirculating flow is created within the breakdown region with low-amplitude oscillation. Further details of general vortex breakdown can be found in Brown & Lopez (Reference Brown and Lopez1990) and Kurosaka et al. (Reference Kurosaka, Cain, Srigrarom, Wimer, Dabiri, Johnson, Hatcher, Thompson, Kikuchi, Hirano, Yuge and Honda2006).
$5\lesssim z/a\lesssim 8$
in the flow, which is one of the key differences between the current vortical flow and the Burgers vortex. This breakdown is axisymmetric and bulges outward, creating a spherical shape (Hall Reference Hall1972), as highlighted in green in figure 2. The vorticity generated at the wall advects along the vortex cores and leads to the emergence of the adverse pressure gradient. This causes the flow to expand radially, in a manner similar to flow separation. As a result, a recirculating flow is created within the breakdown region with low-amplitude oscillation. Further details of general vortex breakdown can be found in Brown & Lopez (Reference Brown and Lopez1990) and Kurosaka et al. (Reference Kurosaka, Cain, Srigrarom, Wimer, Dabiri, Johnson, Hatcher, Thompson, Kikuchi, Hirano, Yuge and Honda2006).
Downstream of the breakdown region, the flow transitions to the wake region for
![]() $8\lesssim z/a$
. Here, the vortex structure loses its axisymmetry and develops an unsteady spiralling wake. While the wake region has low pressure, its value is higher than in the steady region of the flow. The level of unsteadiness is the highest among the three regions of the flow. By analysing the frequency spectra of the kinetic energy along
$8\lesssim z/a$
. Here, the vortex structure loses its axisymmetry and develops an unsteady spiralling wake. While the wake region has low pressure, its value is higher than in the steady region of the flow. The level of unsteadiness is the highest among the three regions of the flow. By analysing the frequency spectra of the kinetic energy along
![]() $(r/a,\unicode[STIX]{x1D703})=(1,0)$
, we observe four dominant frequencies in the flow, as identified in figure 3. As mentioned earlier, the vortex breakdown mode (referred to as mode A hereafter) appears first with a low amplitude but disappears in the wake region. In the wake region, three modes appear (modes I, II and III hereafter), holding higher levels of fluctuation.
$(r/a,\unicode[STIX]{x1D703})=(1,0)$
, we observe four dominant frequencies in the flow, as identified in figure 3. As mentioned earlier, the vortex breakdown mode (referred to as mode A hereafter) appears first with a low amplitude but disappears in the wake region. In the wake region, three modes appear (modes I, II and III hereafter), holding higher levels of fluctuation.

Figure 3. Characterization of the baseline flow unsteadiness. Kinetic energy spectra along
![]() $(r/a,\unicode[STIX]{x1D703})=(1,0)$
are shown on the left. Dynamic mode decomposition modes (
$(r/a,\unicode[STIX]{x1D703})=(1,0)$
are shown on the left. Dynamic mode decomposition modes (
![]() $u_{z}$
) corresponding to the peaks of the spectra are shown on the right (axial slices are shown as insets at the indicated heights).
$u_{z}$
) corresponding to the peaks of the spectra are shown on the right (axial slices are shown as insets at the indicated heights).
To extract the spatial structures of these modes, we perform modal analysis on the flow-field data (Taira et al.
Reference Taira, Brunton, Dawson, Rowley, Colonius, McKeon, Schmidt, Gordeyev, Theofilis and Ukeiley2017). In particular, we use dynamic mode decomposition (DMD) (Rowley et al.
Reference Rowley, Mezić, Bagheri and Henningson2009; Schmid Reference Schmid2010) to extract the spatial modes that correspond to the peaks from the spectral analysis. Dynamic mode decomposition eigenvalues obtained by analysing the snapshots reveal that the fluctuations are sustained (neutrally stable). The spatial structures of the corresponding dynamic modes are visualized on the right side of figure 3. The three dominant wake modes, I, II and III, exhibit helical structures rotating with the base flow. The azimuthal structures of these three wake modes, shown as inset two-dimensional plots taken from the planes indicated by the dashed lines, exhibit azimuthal wavenumbers of
![]() $m=1$
, 2 and 3. For this flow, mode I (
$m=1$
, 2 and 3. For this flow, mode I (
![]() $m=1$
) is found to be the dominant mode. This observation is in agreement with the report by Schmid & Rossi (Reference Schmid and Rossi2004), which states that, while the Burgers vortex is asymptotically stable, a significant short-term energy amplification emerges for perturbations with azimuthal wavenumbers of
$m=1$
) is found to be the dominant mode. This observation is in agreement with the report by Schmid & Rossi (Reference Schmid and Rossi2004), which states that, while the Burgers vortex is asymptotically stable, a significant short-term energy amplification emerges for perturbations with azimuthal wavenumbers of
![]() $m=1$
. Modes II and III are the superharmonics of mode I. We also identify the vortex breakdown mode A, which fluctuates with a lower amplitude. Mode A only exists in the vortex breakdown region and has a lower oscillation frequency. This breakdown mode does not possess the strong spiraling structure seen for the wake modes.
$m=1$
. Modes II and III are the superharmonics of mode I. We also identify the vortex breakdown mode A, which fluctuates with a lower amplitude. Mode A only exists in the vortex breakdown region and has a lower oscillation frequency. This breakdown mode does not possess the strong spiraling structure seen for the wake modes.
With these modal structures present, the pressure distribution becomes higher than that of the steady region. As such, we consider perturbing the flow with an actuation frequency in the vicinity of the baseline fluctuations to stimulate the emergence of unsteadiness. As presented below, we introduce actuation from the bottom wall to alter the vortex core profile especially in the steady region to increase the core pressure.
4 Flow control
4.1 Control approach
Based on insights gained from the baseline characterization of the wall-normal vortex, we develop an active flow control strategy to weaken the vortex core. We aim to widen the vortex core radius by inducing unsteadiness in the core region. This modification will reduce the azimuthal velocity and hence increase the vortex core pressure.
To trigger the emergence of vortical unsteadiness, we use unsteady actuation from the bottom wall at the vortex centre. We have observed from the above DMD analysis that modal structures appear at frequencies between 0.13 and 0.81. To introduce unsteady perturbation with these characteristics, we add rotary blowing and suction perturbation by prescribing a velocity boundary condition at the wall,
where
![]() $A_{c}$
,
$A_{c}$
,
![]() $f_{c}$
and
$f_{c}$
and
![]() $m_{c}$
are the actuation amplitude, frequency and azimuthal wavenumber respectively. The control frequency is chosen in the range
$m_{c}$
are the actuation amplitude, frequency and azimuthal wavenumber respectively. The control frequency is chosen in the range
![]() $0.08\leqslant f_{c}\leqslant 0.3$
to span across the dominant frequencies identified from the above DMD analysis of the baseline flow. The azimuthal wavenumber is set to
$0.08\leqslant f_{c}\leqslant 0.3$
to span across the dominant frequencies identified from the above DMD analysis of the baseline flow. The azimuthal wavenumber is set to
![]() $m_{c}=1$
(co-rotating) and
$m_{c}=1$
(co-rotating) and
![]() $-1$
(counter-rotating), as DMD analysis reveals the largest fluctuations at these wavenumbers. Here, there equal and opposite amplitudes of blowing and suction are applied to the flow, with zero net mass addition. For the sake of completeness, we also consider actuation with azimuthal wavenumbers of
$-1$
(counter-rotating), as DMD analysis reveals the largest fluctuations at these wavenumbers. Here, there equal and opposite amplitudes of blowing and suction are applied to the flow, with zero net mass addition. For the sake of completeness, we also consider actuation with azimuthal wavenumbers of
![]() $m=0$
and
$m=0$
and
![]() $|m|>1$
, as well as steady forcing with
$|m|>1$
, as well as steady forcing with
![]() $f_{c}=0$
. This particular form of the function is chosen to implement suction and blowing in a spatially compact manner near the vortex centre. As we briefly discuss later, unsteady actuation with
$f_{c}=0$
. This particular form of the function is chosen to implement suction and blowing in a spatially compact manner near the vortex centre. As we briefly discuss later, unsteady actuation with
![]() $f_{c}>0$
is indeed required to achieve effective control.
$f_{c}>0$
is indeed required to achieve effective control.
To quantify the control input, we introduce a circulation-based oscillatory momentum coefficient, defined as
is the oscillatory momentum input. We choose a control amplitude in the range
![]() $0.1\leqslant A_{c}\leqslant 1$
, which corresponds to
$0.1\leqslant A_{c}\leqslant 1$
, which corresponds to
![]() $0.02\,\%\leqslant C_{\unicode[STIX]{x1D707}}^{\unicode[STIX]{x1D6E4}}\leqslant 2.03\,\%$
, to evaluate the momentum coefficient effect.
$0.02\,\%\leqslant C_{\unicode[STIX]{x1D707}}^{\unicode[STIX]{x1D6E4}}\leqslant 2.03\,\%$
, to evaluate the momentum coefficient effect.
4.2 Controlled flow
Let us examine the effects of forcing on the wall-normal vortex and its core-pressure distribution. We first set the actuation amplitude at
![]() $A_{c}=1$
(
$A_{c}=1$
(
![]() $C_{\unicode[STIX]{x1D707}}^{\unicode[STIX]{x1D6E4}}=2.03\,\%$
) and study the influence of unsteady forcing at frequencies of
$C_{\unicode[STIX]{x1D707}}^{\unicode[STIX]{x1D6E4}}=2.03\,\%$
) and study the influence of unsteady forcing at frequencies of
![]() $f_{c}=0.11$
and 0.27. These control frequencies are selected to be close to those of baseline DMD modes A and I, with the aim of stimulating the emergence of instabilities around the vortex. We also consider co-rotating and counter-rotating actuation with
$f_{c}=0.11$
and 0.27. These control frequencies are selected to be close to those of baseline DMD modes A and I, with the aim of stimulating the emergence of instabilities around the vortex. We also consider co-rotating and counter-rotating actuation with
![]() $m=\pm 1$
. Figure 4 presents the controlled flows with the chosen control parameters. The vortex cores using the
$m=\pm 1$
. Figure 4 presents the controlled flows with the chosen control parameters. The vortex cores using the
![]() $Q$
-criterion isosurface (blue) and the overall vortical structures with the transparent grey vorticity norm isosurface are visualized. The corresponding time-averaged pressure profiles are also shown in figure 4 to assess the effectiveness of modifying the pressure distribution.
$Q$
-criterion isosurface (blue) and the overall vortical structures with the transparent grey vorticity norm isosurface are visualized. The corresponding time-averaged pressure profiles are also shown in figure 4 to assess the effectiveness of modifying the pressure distribution.
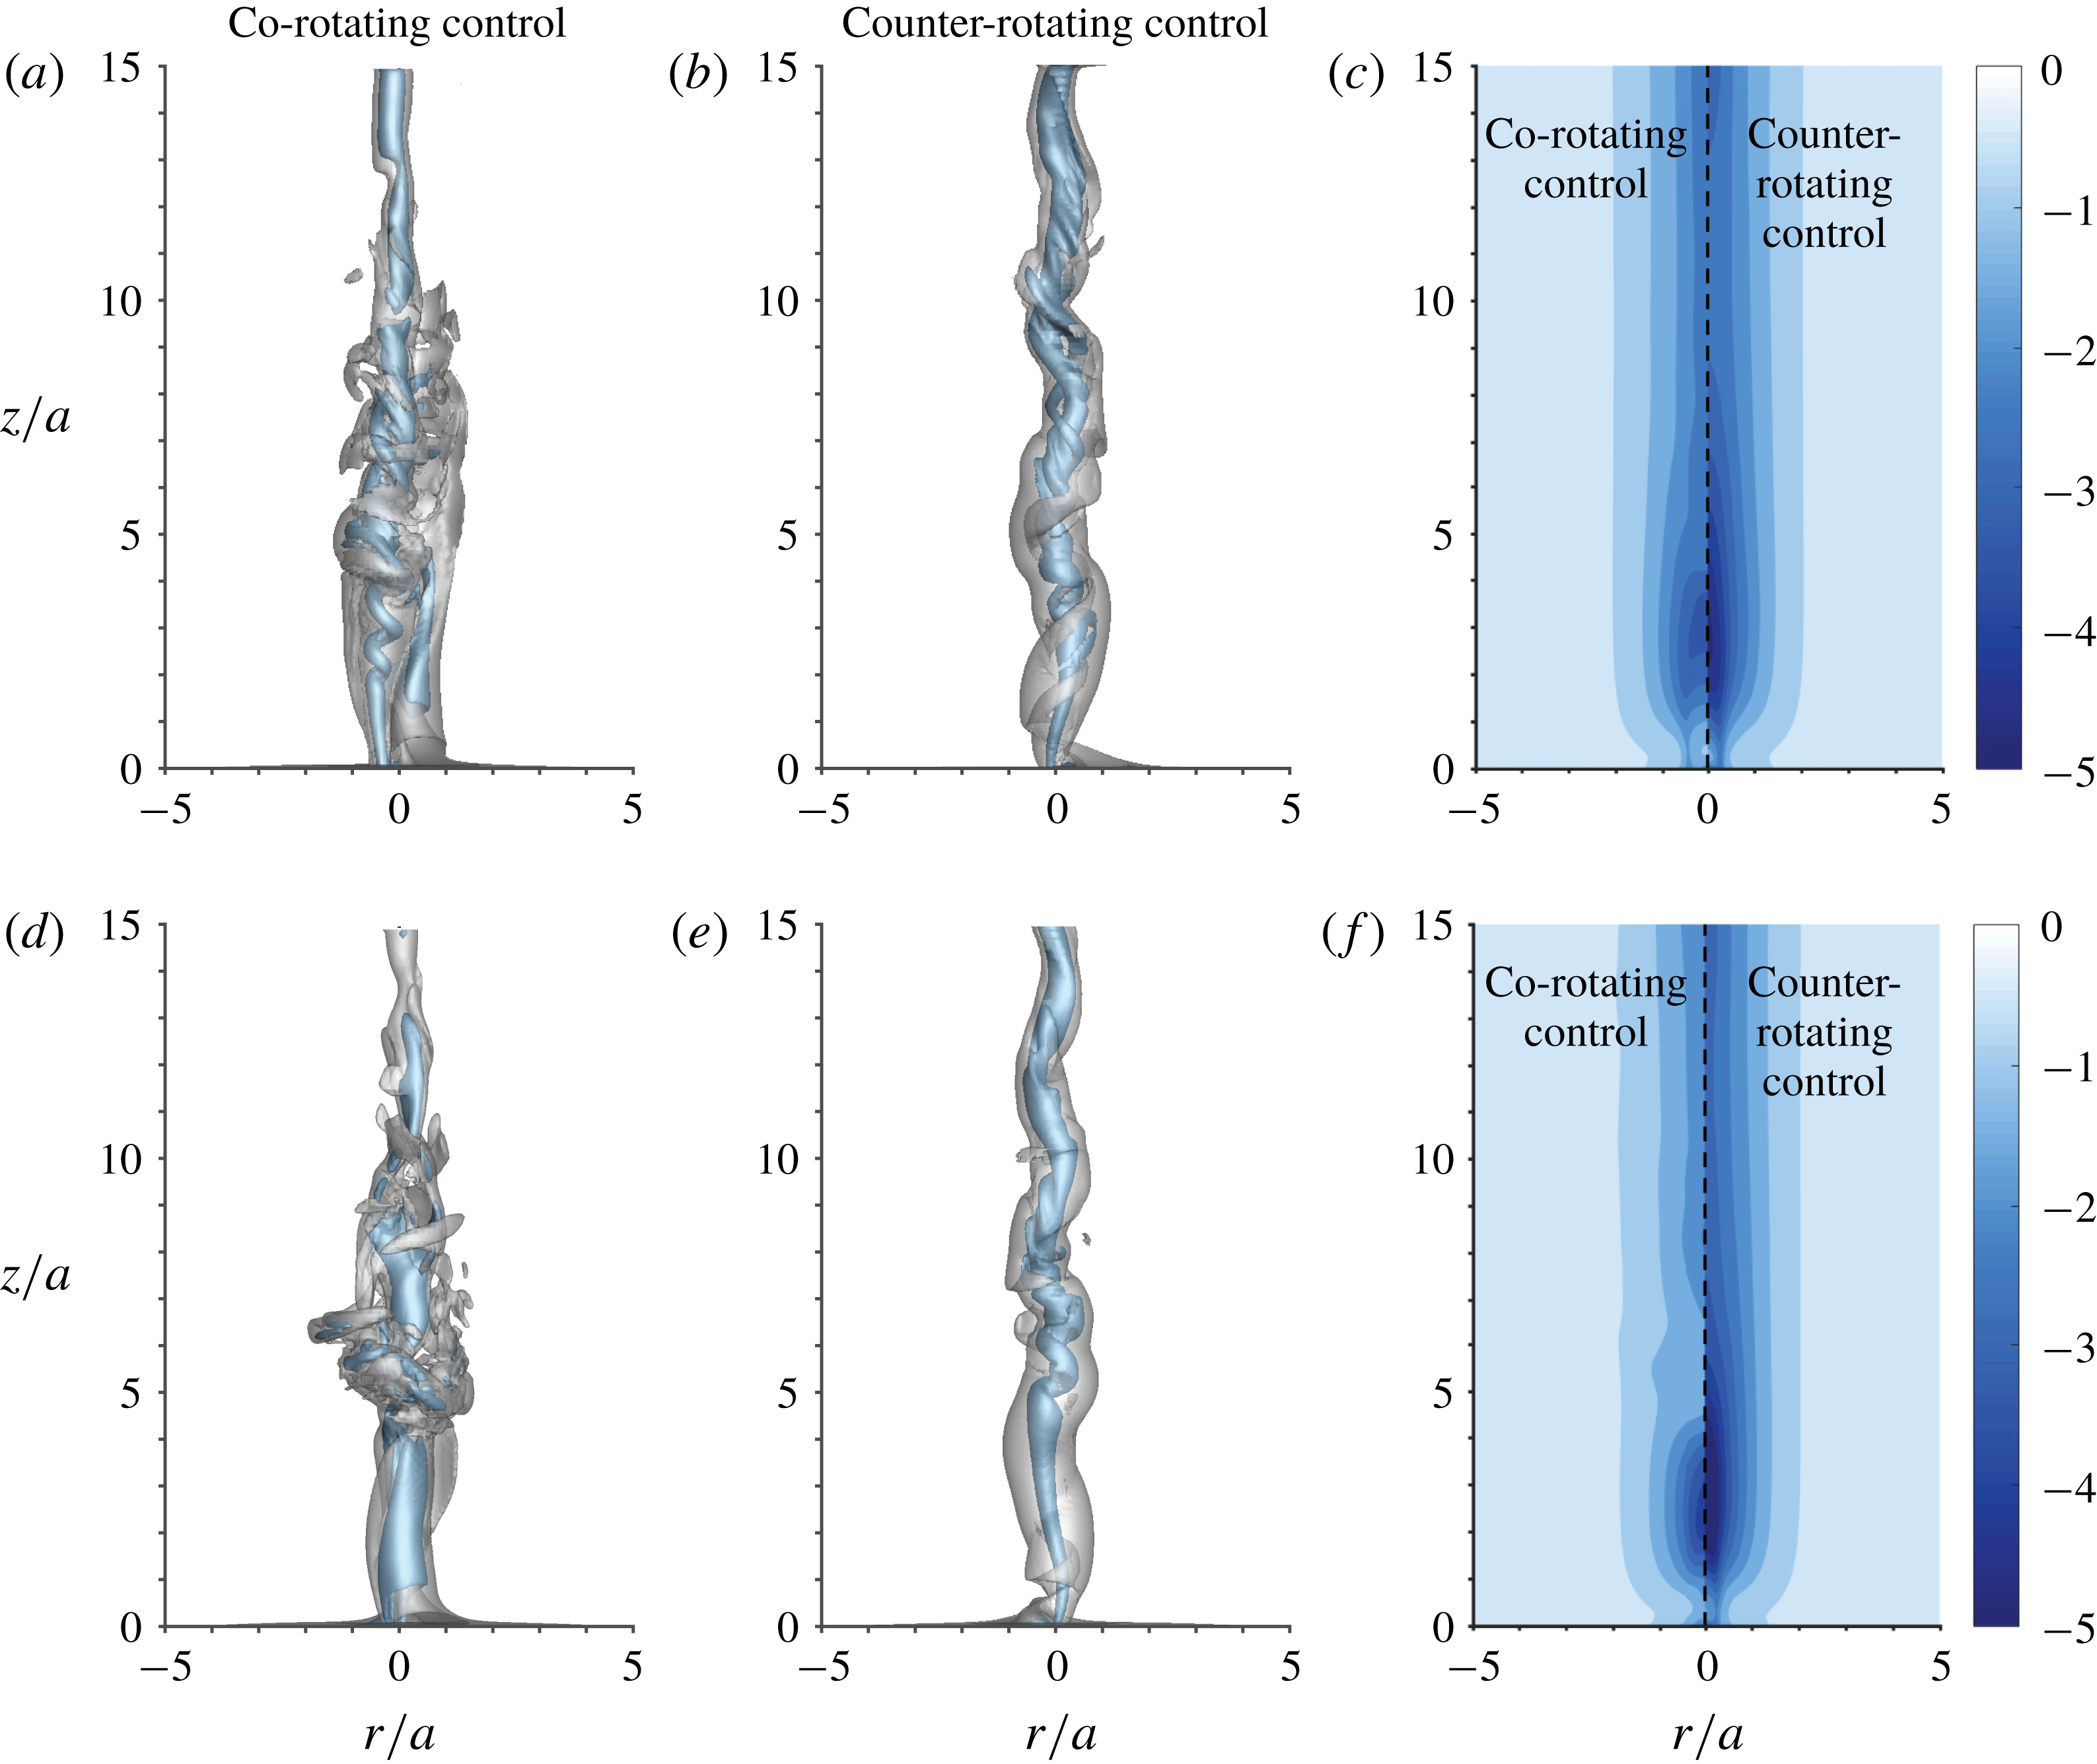
Figure 4. Visualizations of the controlled flows with isosurfaces of
![]() $\Vert \unicode[STIX]{x1D74E}\Vert =2$
(grey) and a
$\Vert \unicode[STIX]{x1D74E}\Vert =2$
(grey) and a
![]() $Q$
-criterion of
$Q$
-criterion of
![]() $Q=2$
(blue). Co-rotating (a,d) and counter-rotating (b,e) control cases using
$Q=2$
(blue). Co-rotating (a,d) and counter-rotating (b,e) control cases using
![]() $C_{\unicode[STIX]{x1D707}}^{\unicode[STIX]{x1D6E4}}=2.03\,\%$
at
$C_{\unicode[STIX]{x1D707}}^{\unicode[STIX]{x1D6E4}}=2.03\,\%$
at
![]() $f_{c}=0.11$
(a,b) and 0.27 (d,e) are shown. The corresponding time-averaged pressure contours are also shown in (c) and (f).
$f_{c}=0.11$
(a,b) and 0.27 (d,e) are shown. The corresponding time-averaged pressure contours are also shown in (c) and (f).
By perturbing the flow at a frequency of
![]() $f_{c}=0.11$
, the vortex profile can be modified significantly with co-rotating and counter-rotating inputs. As shown in figure 4(a–c), the vortex core is spread radially in an unsteady manner and the vortex breakdown region is eliminated. In the case of co-rotating control, the vortical structure becomes more complex and radially spread out compared with the baseline flow. Hence, the core region of the flow has a lower azimuthal velocity and leads to an increase in the core pressure, which can be seen in figure 4(c). With counter-rotating control, the vortex core is modified, while its width is not significantly altered. Instead, the core deforms into a braid-like helical structure. The corresponding minimum pressure in the counter-rotating controlled flow increases by 33 % compared with the baseline flow, but not as much as what is achieved with the co-rotating forcing case, which accomplishes a 54 % increase.
$f_{c}=0.11$
, the vortex profile can be modified significantly with co-rotating and counter-rotating inputs. As shown in figure 4(a–c), the vortex core is spread radially in an unsteady manner and the vortex breakdown region is eliminated. In the case of co-rotating control, the vortical structure becomes more complex and radially spread out compared with the baseline flow. Hence, the core region of the flow has a lower azimuthal velocity and leads to an increase in the core pressure, which can be seen in figure 4(c). With counter-rotating control, the vortex core is modified, while its width is not significantly altered. Instead, the core deforms into a braid-like helical structure. The corresponding minimum pressure in the counter-rotating controlled flow increases by 33 % compared with the baseline flow, but not as much as what is achieved with the co-rotating forcing case, which accomplishes a 54 % increase.
The wall-normal vortex has also been modified by forcing with a higher frequency of
![]() $f_{c}=0.27$
, as illustrated in figure 4(d–f). With counter-rotating control, the vortex breakdown region is eliminated and the vortical flow becomes unsteady throughout the entire vortical region. For co-rotating control, the vortex breakdown is essentially removed but shows slight bulging near
$f_{c}=0.27$
, as illustrated in figure 4(d–f). With counter-rotating control, the vortex breakdown region is eliminated and the vortical flow becomes unsteady throughout the entire vortical region. For co-rotating control, the vortex breakdown is essentially removed but shows slight bulging near
![]() $z/a\approx 6$
. For this reason, the pressure increase at the base of the vortex is not achieved as in the lower-frequency forcing case. This suggests that instigation of fluctuations at low frequency leads to a high level of unsteadiness and mixing. On the other hand, counter-rotating actuation at this higher frequency does not exhibit noteworthy difference from the low-frequency actuation.
$z/a\approx 6$
. For this reason, the pressure increase at the base of the vortex is not achieved as in the lower-frequency forcing case. This suggests that instigation of fluctuations at low frequency leads to a high level of unsteadiness and mixing. On the other hand, counter-rotating actuation at this higher frequency does not exhibit noteworthy difference from the low-frequency actuation.
We further analyse the influence of control frequency and amplitude on the wall-normal vortex. As discussed above, pressure increase along the vortex core is achieved by spreading the vortex core radially and reducing the azimuthal velocity
![]() $u_{\unicode[STIX]{x1D703}}$
. Hence, we can use the time-averaged axial circulation
$u_{\unicode[STIX]{x1D703}}$
. Hence, we can use the time-averaged axial circulation
![]() $\unicode[STIX]{x1D6E4}_{z}(r,z)=\int _{0}^{2\unicode[STIX]{x03C0}}\bar{u}_{\unicode[STIX]{x1D703}}(r,z,\unicode[STIX]{x1D703})r\,\text{d}\unicode[STIX]{x1D703}$
, normalized by
$\unicode[STIX]{x1D6E4}_{z}(r,z)=\int _{0}^{2\unicode[STIX]{x03C0}}\bar{u}_{\unicode[STIX]{x1D703}}(r,z,\unicode[STIX]{x1D703})r\,\text{d}\unicode[STIX]{x1D703}$
, normalized by
![]() $\unicode[STIX]{x1D6E4}_{\infty }$
, as a metric to assess the effectiveness of the current flow control approach. In what follows, we focus on the co-rotating control set-up, as it is more effective than the counter-rotating control set-up in alleviating the low-pressure core.
$\unicode[STIX]{x1D6E4}_{\infty }$
, as a metric to assess the effectiveness of the current flow control approach. In what follows, we focus on the co-rotating control set-up, as it is more effective than the counter-rotating control set-up in alleviating the low-pressure core.
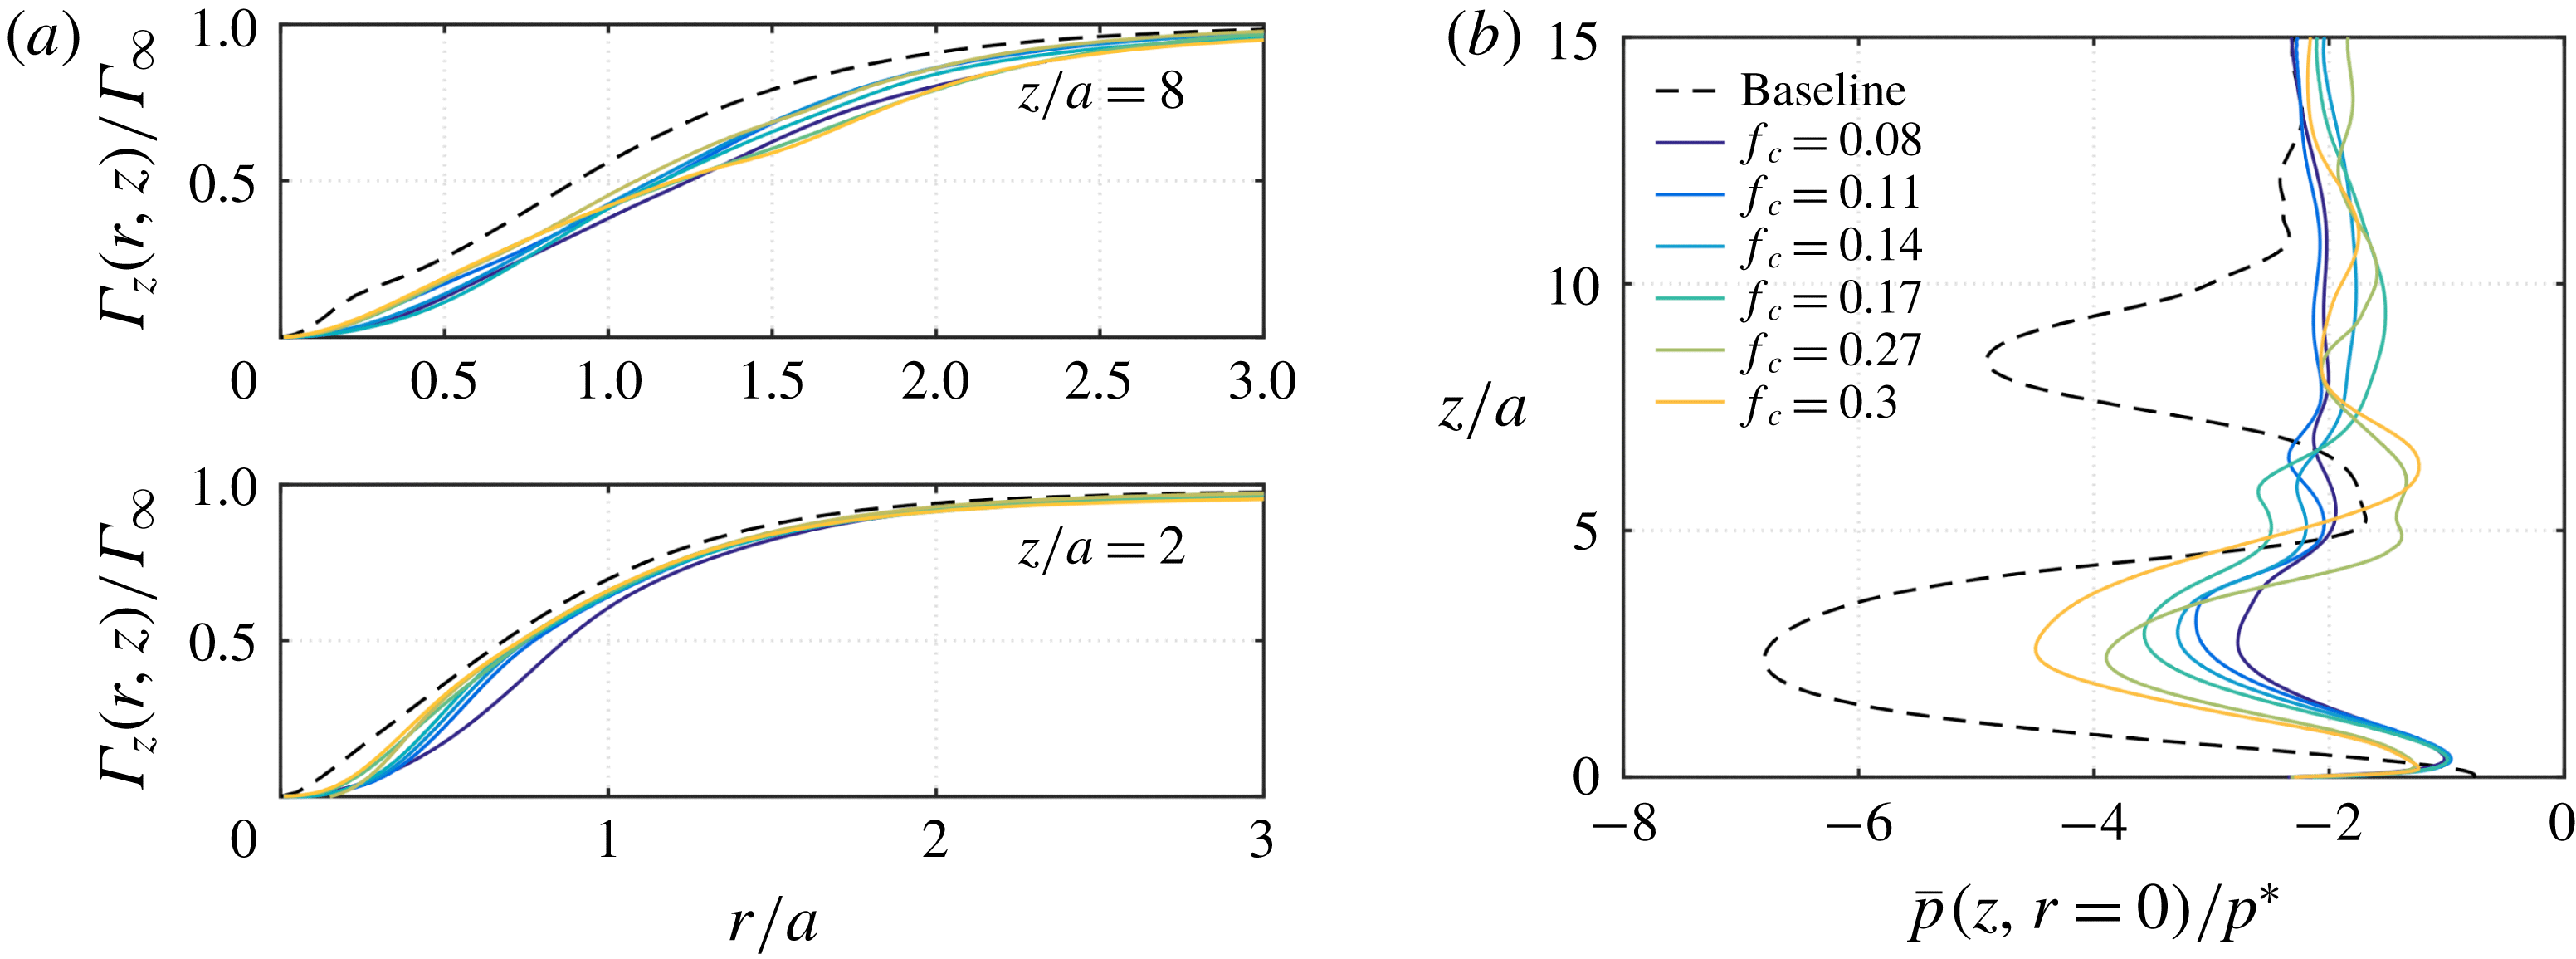
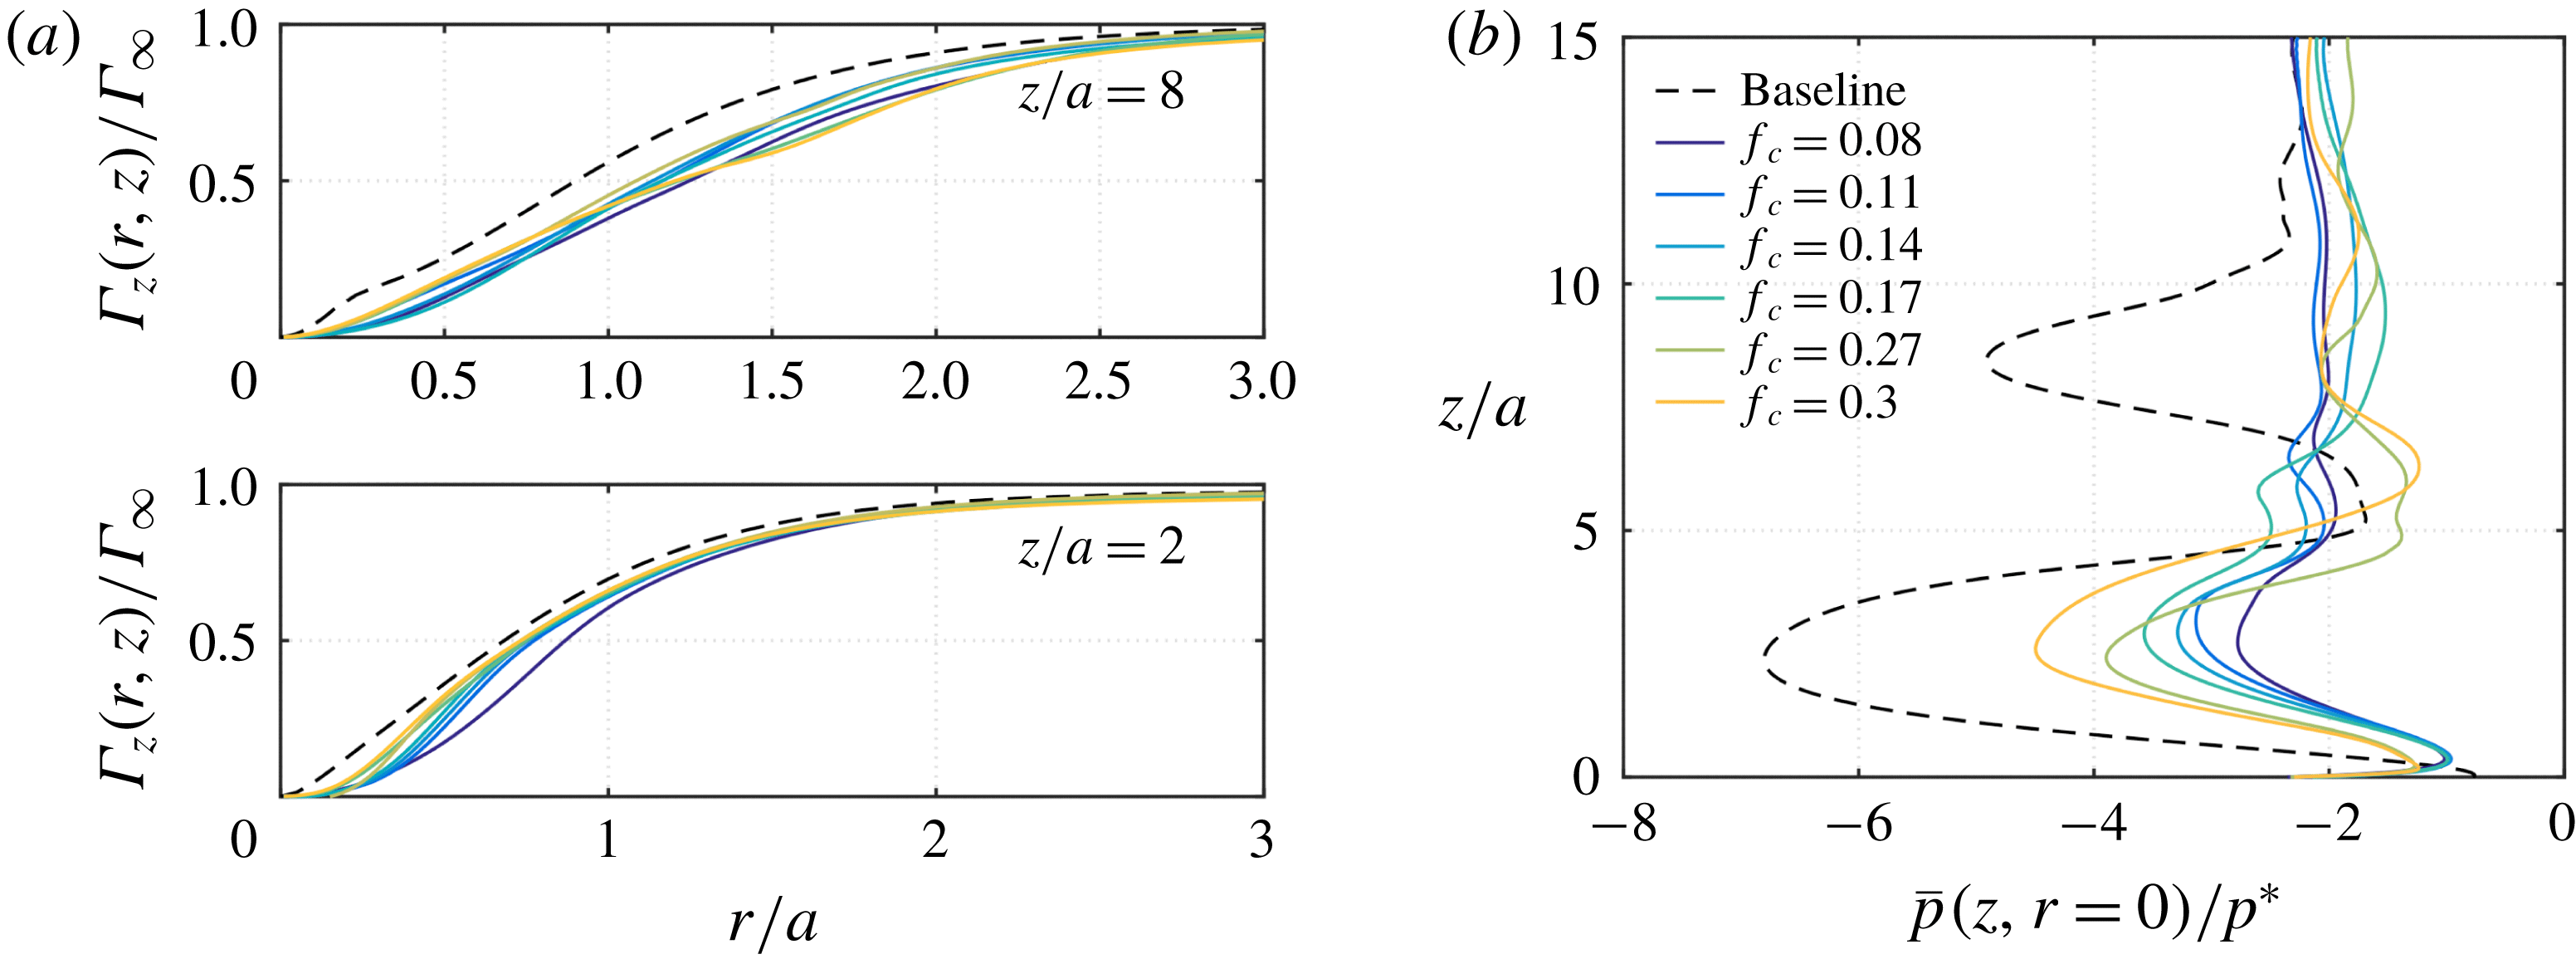
Figure 5. (a) Mean circulation of baseline and co-rotating control cases at
![]() $A=1$
. (b) Time-averaged pressure distribution along the vortex centre for different control frequencies.
$A=1$
. (b) Time-averaged pressure distribution along the vortex centre for different control frequencies.
While keeping the actuation amplitude constant at
![]() $A_{c}=1$
(
$A_{c}=1$
(
![]() $C_{\unicode[STIX]{x1D707}}^{\unicode[STIX]{x1D6E4}}=2.03\,\%$
), let us vary the actuation frequency
$C_{\unicode[STIX]{x1D707}}^{\unicode[STIX]{x1D6E4}}=2.03\,\%$
), let us vary the actuation frequency
![]() $f_{c}$
from 0.08 to 0.3. We present the time-averaged axial circulation
$f_{c}$
from 0.08 to 0.3. We present the time-averaged axial circulation
![]() $\unicode[STIX]{x1D6E4}_{z}(r,z)/\unicode[STIX]{x1D6E4}_{\infty }$
at representative axial locations in figure 5(a). With actuation, we observe that the core of the wall-normal vortex is spread over the radial direction. The actuation introduced from the bottom wall is able to generate a significant level of unsteadiness around the vortex core to eliminate the vortex breakdown region and decrease the azimuthal velocity, which in turn raises the core-pressure profile, as can be seen in figure 5(b). Among the actuation frequencies considered, those near
$\unicode[STIX]{x1D6E4}_{z}(r,z)/\unicode[STIX]{x1D6E4}_{\infty }$
at representative axial locations in figure 5(a). With actuation, we observe that the core of the wall-normal vortex is spread over the radial direction. The actuation introduced from the bottom wall is able to generate a significant level of unsteadiness around the vortex core to eliminate the vortex breakdown region and decrease the azimuthal velocity, which in turn raises the core-pressure profile, as can be seen in figure 5(b). Among the actuation frequencies considered, those near
![]() $f_{c}\approx 0.1$
are found to be beneficial for pressure increase. In fact, the controlled flow with
$f_{c}\approx 0.1$
are found to be beneficial for pressure increase. In fact, the controlled flow with
![]() $f_{c}=0.08$
achieves the highest increase in pressure for
$f_{c}=0.08$
achieves the highest increase in pressure for
![]() $z/a<5$
. We will further elaborate on the reason for low-frequency actuation being effective in modifying the vortical flow.
$z/a<5$
. We will further elaborate on the reason for low-frequency actuation being effective in modifying the vortical flow.
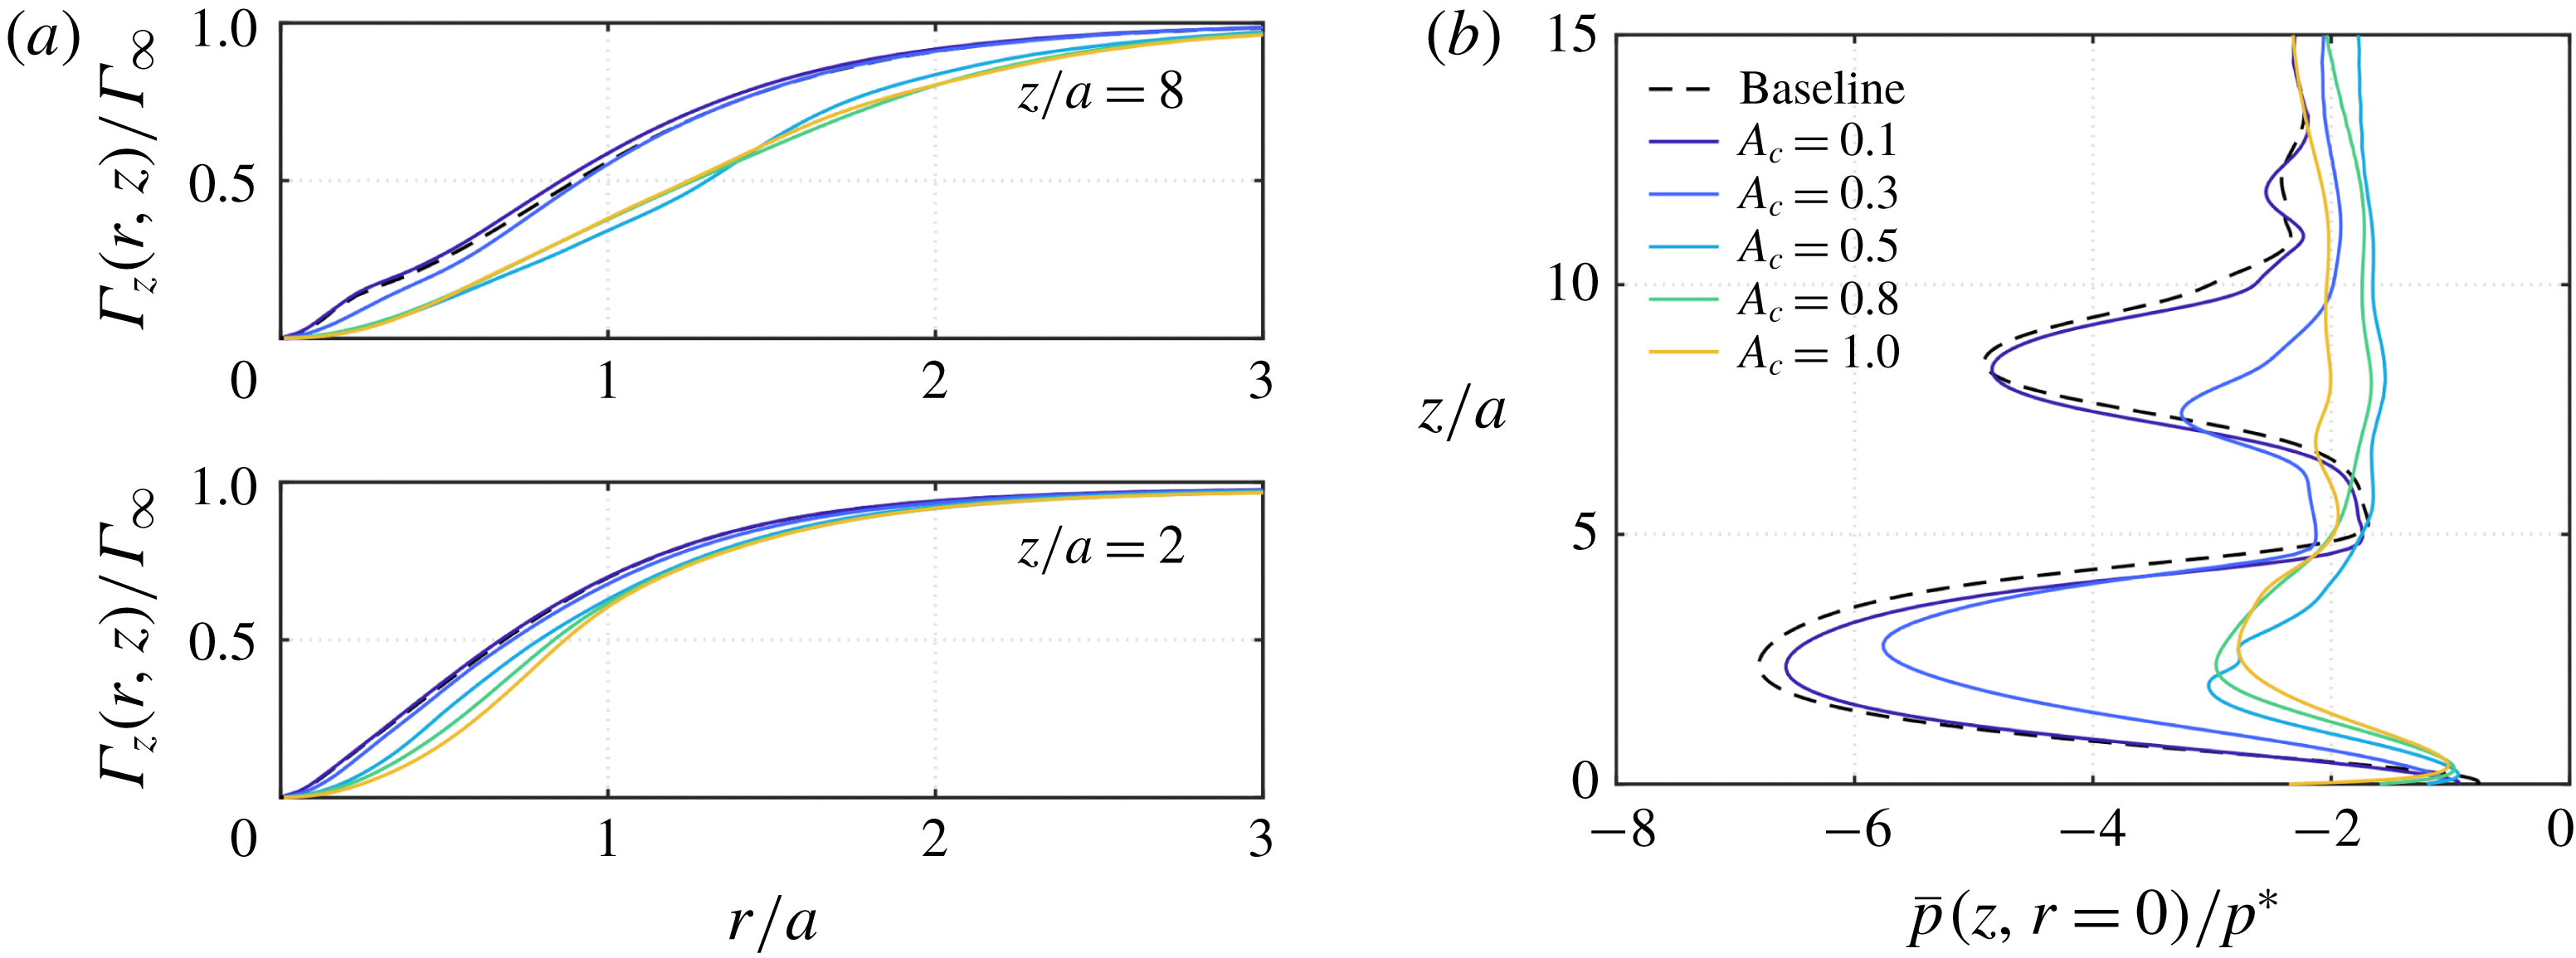
We further examine the impact of the control amplitude at the low frequency of
![]() $f_{c}=0.08$
using co-rotating actuation, which achieves significant core-pressure increase. The forcing amplitude is varied from
$f_{c}=0.08$
using co-rotating actuation, which achieves significant core-pressure increase. The forcing amplitude is varied from
![]() $A_{c}=0.1$
to 1, as shown in figure 6. The time-averaged axial circulation
$A_{c}=0.1$
to 1, as shown in figure 6. The time-averaged axial circulation
![]() $\unicode[STIX]{x1D6E4}_{z}(r,z)/\unicode[STIX]{x1D6E4}_{\infty }$
at low-pressure locations of
$\unicode[STIX]{x1D6E4}_{z}(r,z)/\unicode[STIX]{x1D6E4}_{\infty }$
at low-pressure locations of
![]() $z/a=2$
and 8 is shown in figure 6(a). For
$z/a=2$
and 8 is shown in figure 6(a). For
![]() $A_{c}\leqslant 0.3$
(
$A_{c}\leqslant 0.3$
(
![]() $C_{\unicode[STIX]{x1D707}}^{\unicode[STIX]{x1D6E4}}\leqslant 0.18\,\%$
), the actuation does not substantially alter the circulation profile. For
$C_{\unicode[STIX]{x1D707}}^{\unicode[STIX]{x1D6E4}}\leqslant 0.18\,\%$
), the actuation does not substantially alter the circulation profile. For
![]() $A_{c}\geqslant 0.5$
(
$A_{c}\geqslant 0.5$
(
![]() $C_{\unicode[STIX]{x1D707}}^{\unicode[STIX]{x1D6E4}}\geqslant 0.51\,\%$
), the circulation is significantly reduced and the core distribution becomes wider in the radial direction. The control becomes highly effective past
$C_{\unicode[STIX]{x1D707}}^{\unicode[STIX]{x1D6E4}}\geqslant 0.51\,\%$
), the circulation is significantly reduced and the core distribution becomes wider in the radial direction. The control becomes highly effective past
![]() $A_{c}=0.5$
(
$A_{c}=0.5$
(
![]() $C_{\unicode[STIX]{x1D707}}^{\unicode[STIX]{x1D6E4}}=0.51\,\%$
). On further increasing the control amplitude, the circulation continues to decrease but the amount of reduction saturates.
$C_{\unicode[STIX]{x1D707}}^{\unicode[STIX]{x1D6E4}}=0.51\,\%$
). On further increasing the control amplitude, the circulation continues to decrease but the amount of reduction saturates.
The corresponding time-averaged pressure distribution along the vortex core is presented in figure 6(b). For
![]() $A_{c}=0.1$
and 0.3, the time-averaged pressure profile does not deviate much from that of the baseline. As the control amplitude increases to
$A_{c}=0.1$
and 0.3, the time-averaged pressure profile does not deviate much from that of the baseline. As the control amplitude increases to
![]() $A_{c}=0.5$
(
$A_{c}=0.5$
(
![]() $C_{\unicode[STIX]{x1D707}}^{\unicode[STIX]{x1D6E4}}=0.51\,\%$
), the vortex breakdown region is removed and the time-averaged pressure substantially increases. This indicates the existence of a critical threshold amplitude
$C_{\unicode[STIX]{x1D707}}^{\unicode[STIX]{x1D6E4}}=0.51\,\%$
), the vortex breakdown region is removed and the time-averaged pressure substantially increases. This indicates the existence of a critical threshold amplitude
![]() $A_{c}\approx 0.5$
to achieve effective flow control for modifying the pressure distribution. Once the control amplitude surpasses
$A_{c}\approx 0.5$
to achieve effective flow control for modifying the pressure distribution. Once the control amplitude surpasses
![]() $A_{c}>0.5$
, there is no significant gain from using the additional control input. This tells us that the pressure profile of this type of flow can be altered effectively at the threshold amplitude using low-frequency actuation.
$A_{c}>0.5$
, there is no significant gain from using the additional control input. This tells us that the pressure profile of this type of flow can be altered effectively at the threshold amplitude using low-frequency actuation.
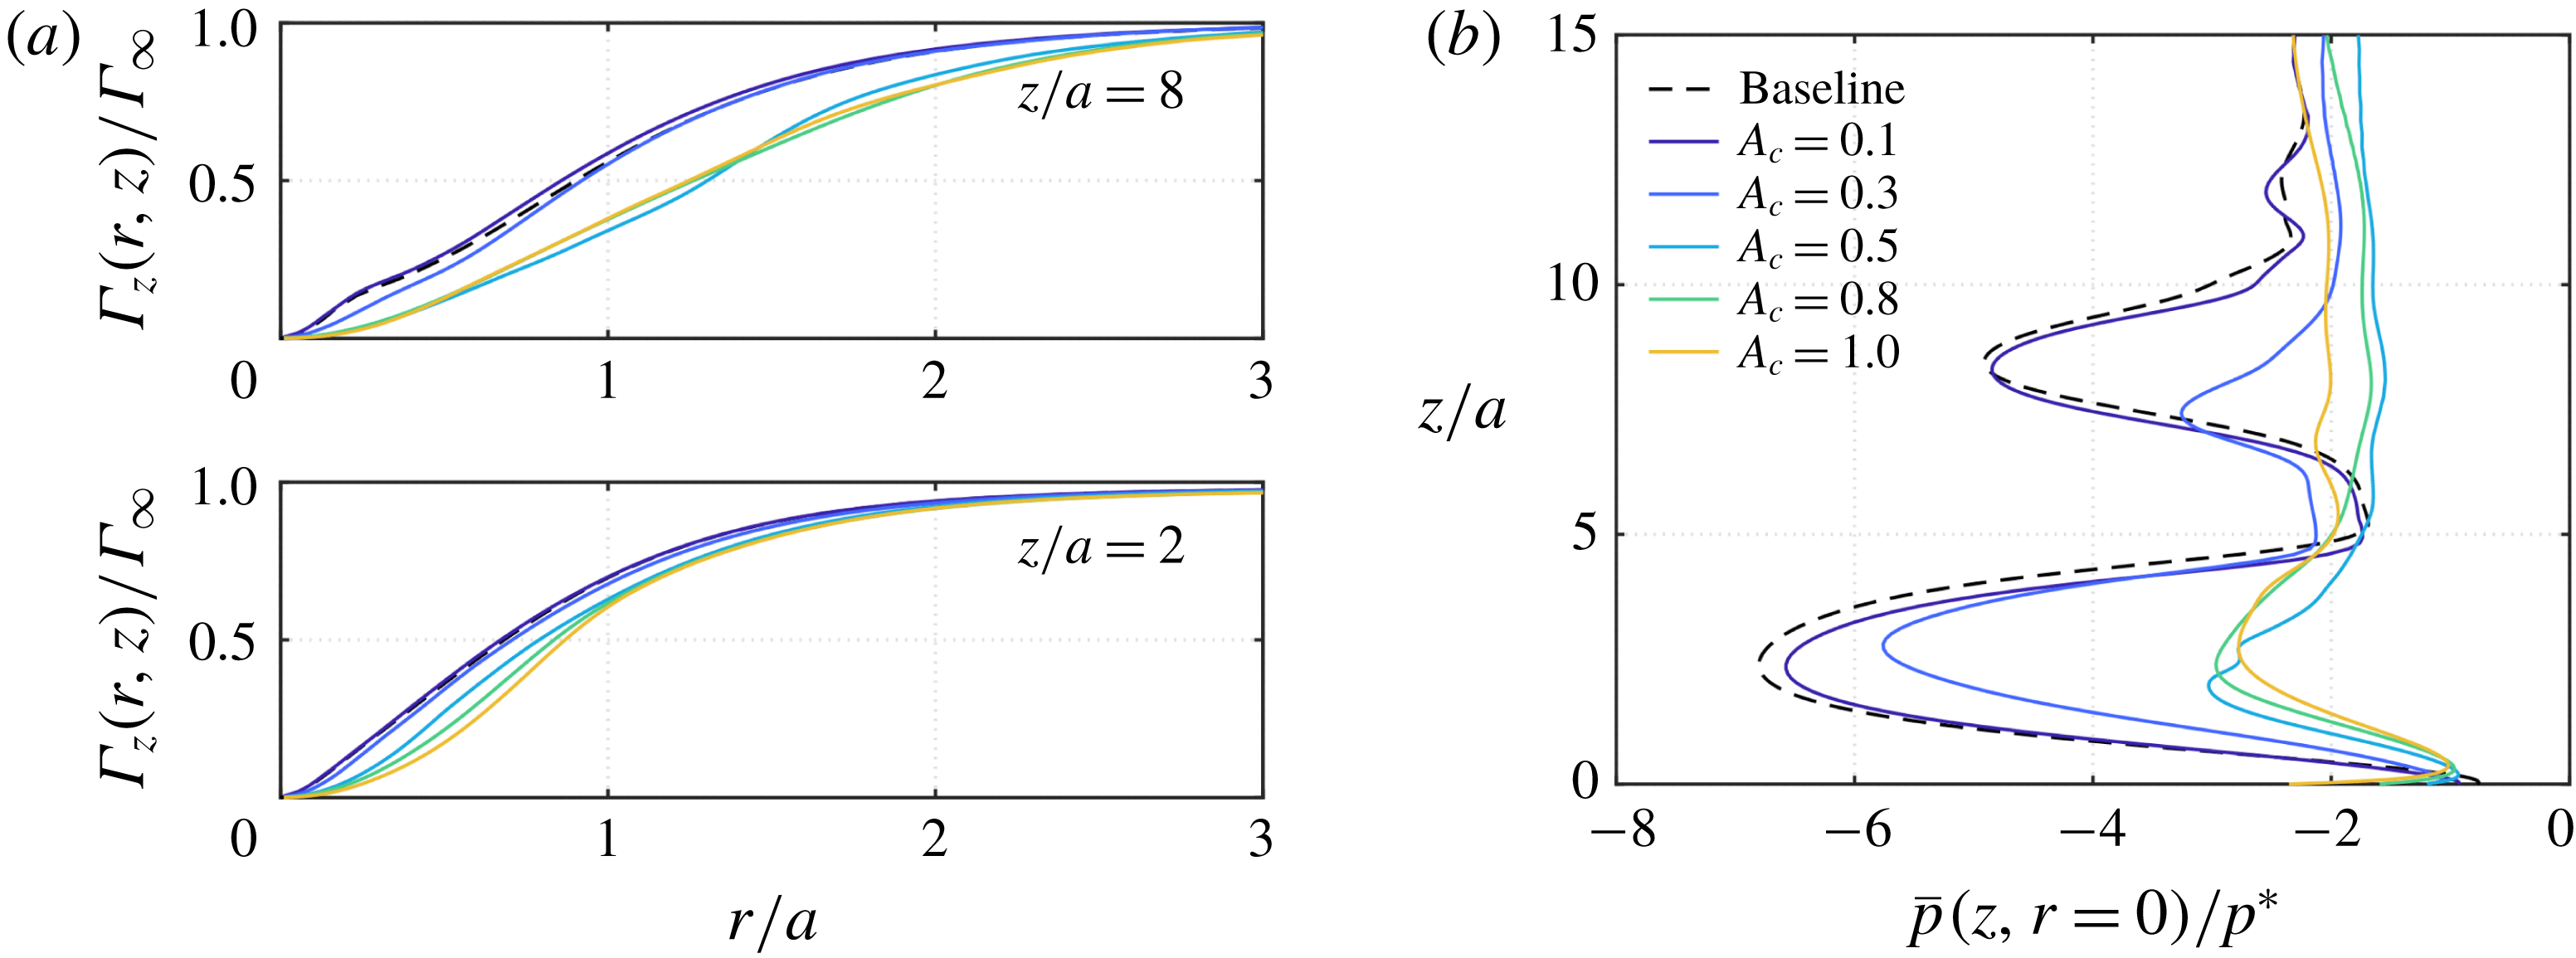
Figure 6. Time-averaged (a) axial circulation at representative locations and (b) pressure distribution along the vortex core
![]() $r=0$
for varied control amplitudes (co-rotating cases) at
$r=0$
for varied control amplitudes (co-rotating cases) at
![]() $f_{c}=0.08$
.
$f_{c}=0.08$
.
We have observed that low-frequency forcing is effective in modifying the wall-normal vortex profile and increasing its core pressure. To shed light on the influence of frequency on altering the base flow, let us revisit the Burgers vortex model. In the three-dimensional stability analysis of the Burgers vortex performed by Schmid & Rossi (Reference Schmid and Rossi2004), it was reported that significant transient growth of perturbation can take place (while being neutrally stable). They performed the stability analysis by considering the Lundgren transformation (Lundgren Reference Lundgren1982) to reduce the three-dimensional flow to be described by a mapped two-dimensional diffusion equation. In this reduced state, they quantified the gain of the transient growth
![]() ${\hat{G}}$
as a function of the axial wavenumber
${\hat{G}}$
as a function of the axial wavenumber
![]() $\hat{k}_{z}$
, which is non-dimensionalized as
$\hat{k}_{z}$
, which is non-dimensionalized as
![]() $\hat{k}_{z}=\overline{k}_{z}\unicode[STIX]{x1D705}(t_{max})$
, where
$\hat{k}_{z}=\overline{k}_{z}\unicode[STIX]{x1D705}(t_{max})$
, where
![]() $\overline{k}_{z}$
is the wavenumber in the mapped state and
$\overline{k}_{z}$
is the wavenumber in the mapped state and
![]() $\unicode[STIX]{x1D705}$
is a scaling parameter that is dependent on the time of maximum energy amplification (for details, see Schmid & Rossi Reference Schmid and Rossi2004).
$\unicode[STIX]{x1D705}$
is a scaling parameter that is dependent on the time of maximum energy amplification (for details, see Schmid & Rossi Reference Schmid and Rossi2004).
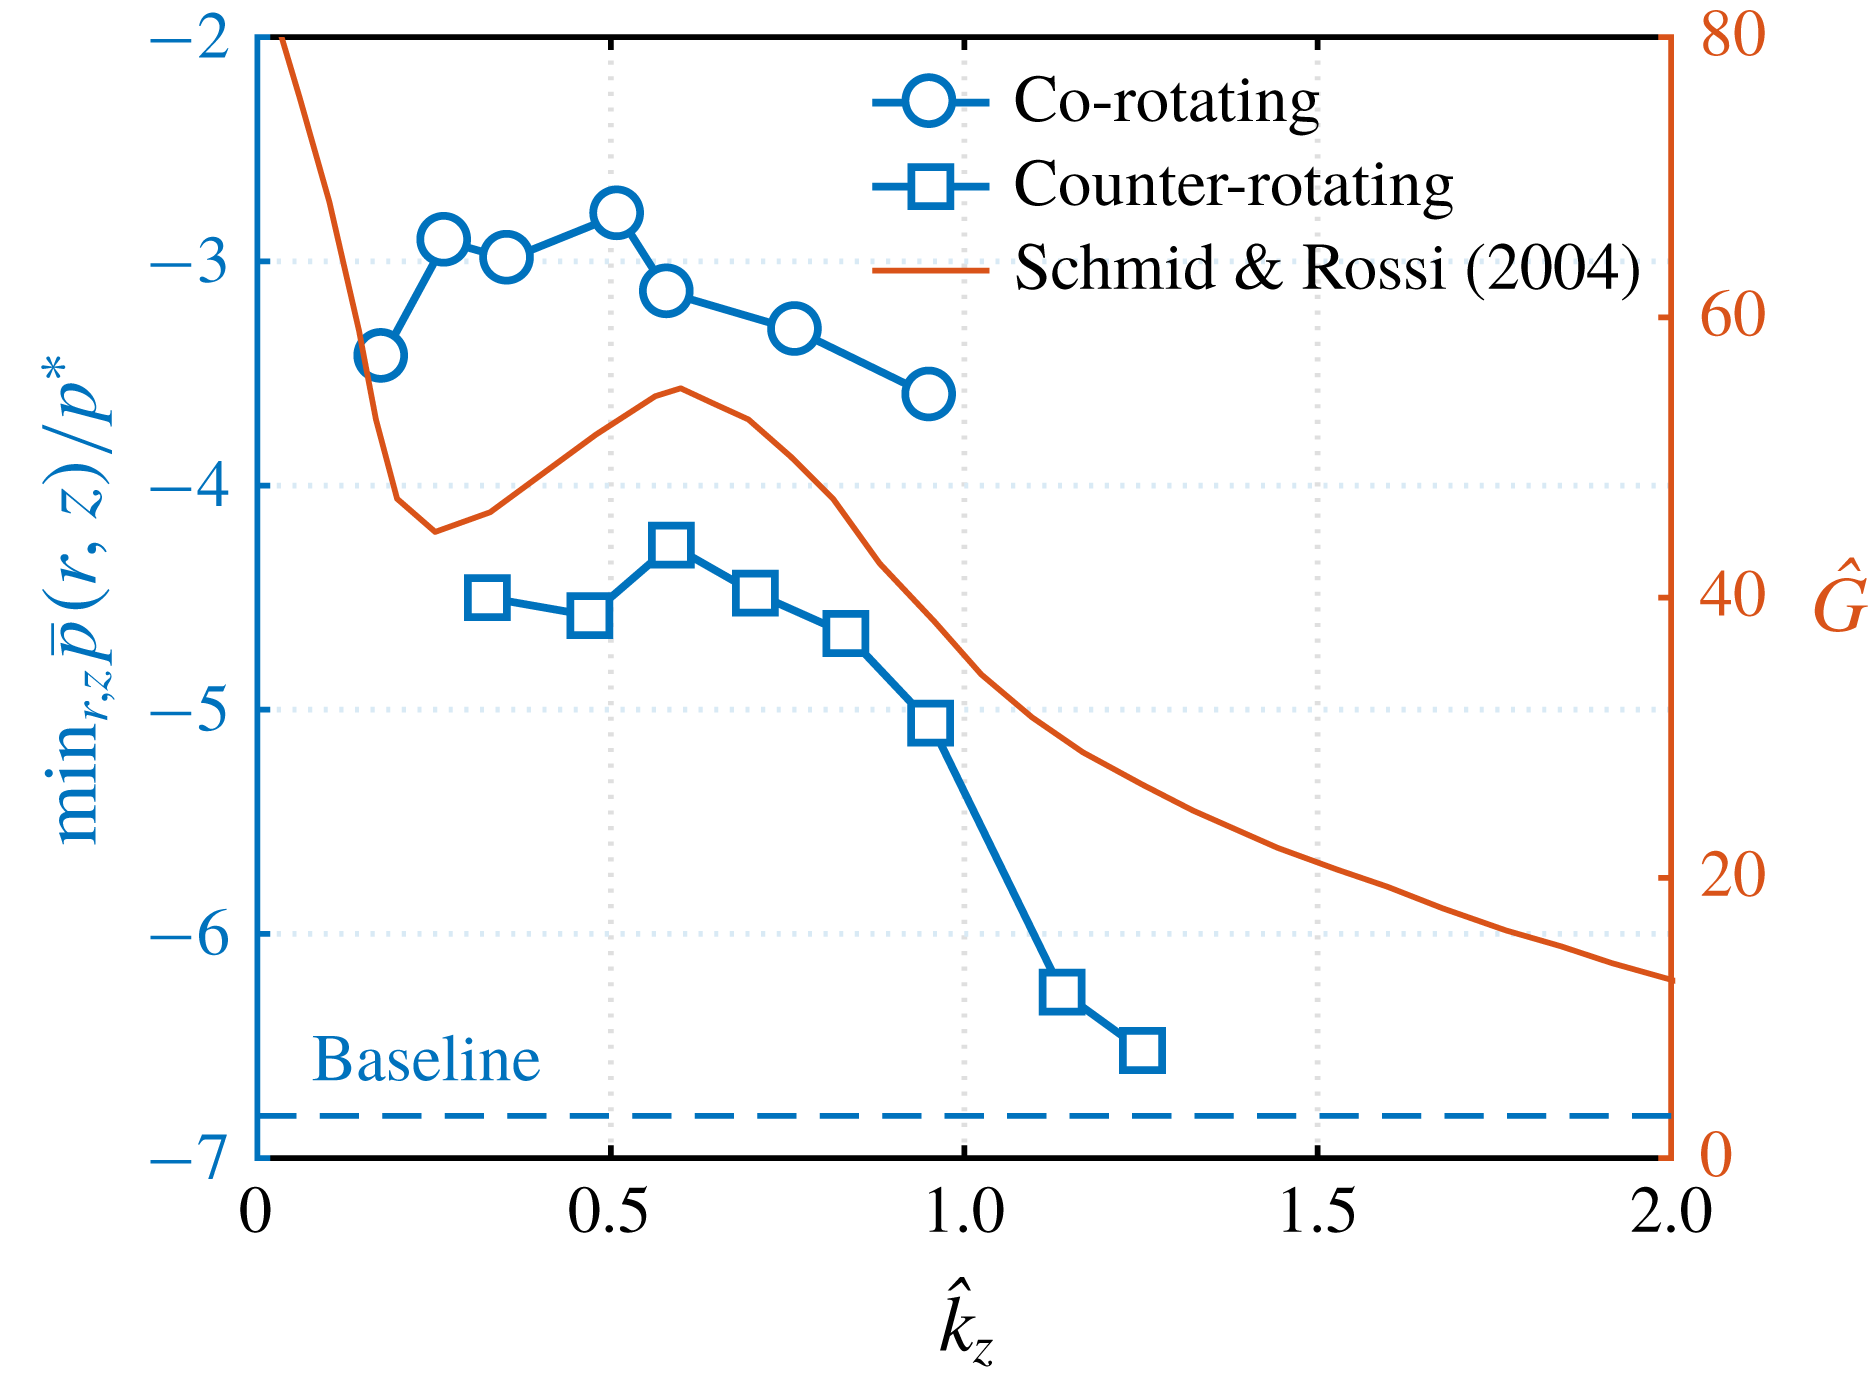
Here, we consider their stability analysis as a simplified model for the present study, as we expect some commonality in behaviour especially away from the wall. The spatial minimum pressure values achieved with
![]() $A_{c}=1$
for
$A_{c}=1$
for
![]() $0.02\leqslant f_{c}\leqslant 0.17$
(co-rotating) and
$0.02\leqslant f_{c}\leqslant 0.17$
(co-rotating) and
![]() $0.08\leqslant f_{c}\leqslant 0.3$
(counter-rotating) over the non-dimensional axial wavenumber
$0.08\leqslant f_{c}\leqslant 0.3$
(counter-rotating) over the non-dimensional axial wavenumber
![]() $\hat{k}_{z}$
are shown in figure 7. Also plotted is the transient growth gain for the Burgers vortex at
$\hat{k}_{z}$
are shown in figure 7. Also plotted is the transient growth gain for the Burgers vortex at
![]() $Re_{\unicode[STIX]{x1D6E4}}=5000$
reported by Schmid & Rossi (Reference Schmid and Rossi2004) to show a qualitative comparison. We can note that sizable transient growth can be expected for
$Re_{\unicode[STIX]{x1D6E4}}=5000$
reported by Schmid & Rossi (Reference Schmid and Rossi2004) to show a qualitative comparison. We can note that sizable transient growth can be expected for
![]() $\hat{k}_{z}\leqslant 1$
, which corresponds to
$\hat{k}_{z}\leqslant 1$
, which corresponds to
![]() $f_{c}\leqslant 0.17$
(co-rotating) and
$f_{c}\leqslant 0.17$
(co-rotating) and
![]() $f_{c}\leqslant 0.23$
(counter-rotating) in the present study. The pressure changes attained by co-rotating and counter-rotating control cases are provided, and exhibit qualitative agreement with the insights on transient growth. Hence, we infer that the transient growth mechanism (secondary hump around
$f_{c}\leqslant 0.23$
(counter-rotating) in the present study. The pressure changes attained by co-rotating and counter-rotating control cases are provided, and exhibit qualitative agreement with the insights on transient growth. Hence, we infer that the transient growth mechanism (secondary hump around
![]() $\hat{k}_{z}=0.7$
) plays an important role in ensuring that small forcing inputs are greatly amplified to effectively modify the mean pressure profile of the wall-normal vortex. Because co-rotating flow control creates large unsteadiness in a nonlinear manner, it is expected that there will be some difference in the wavenumber that achieves the highest mean flow modification and transient growth gain distribution. The counter-rotating case, on the other hand, agrees well with the transient gain distribution, while the perturbation does not grow as much as in the co-rotating control cases, as we can observe from figure 4. Since the forcing is harmonic in time, resolvent analysis (Jovanović & Bamieh Reference Jovanović and Bamieh2005; McKeon & Sharma Reference McKeon and Sharma2010; Yeh & Taira Reference Yeh and Taira2018) would also be required to gain a deeper understanding of the control mechanism. The insights from non-modal analysis can offer guidance on finding an effective control set-up to modify the mean flow and reducing the control parameter space to search over.
$\hat{k}_{z}=0.7$
) plays an important role in ensuring that small forcing inputs are greatly amplified to effectively modify the mean pressure profile of the wall-normal vortex. Because co-rotating flow control creates large unsteadiness in a nonlinear manner, it is expected that there will be some difference in the wavenumber that achieves the highest mean flow modification and transient growth gain distribution. The counter-rotating case, on the other hand, agrees well with the transient gain distribution, while the perturbation does not grow as much as in the co-rotating control cases, as we can observe from figure 4. Since the forcing is harmonic in time, resolvent analysis (Jovanović & Bamieh Reference Jovanović and Bamieh2005; McKeon & Sharma Reference McKeon and Sharma2010; Yeh & Taira Reference Yeh and Taira2018) would also be required to gain a deeper understanding of the control mechanism. The insights from non-modal analysis can offer guidance on finding an effective control set-up to modify the mean flow and reducing the control parameter space to search over.
Finally, we note that cases with
![]() $m=0$
and
$m=0$
and
![]() $|m|>1$
, as well as steady control with
$|m|>1$
, as well as steady control with
![]() $f_{c}=0$
, were also considered. We have found that cases with
$f_{c}=0$
, were also considered. We have found that cases with
![]() $m=0$
and
$m=0$
and
![]() $|m|>1$
do not modify the vortical flow as effectively as the cases with
$|m|>1$
do not modify the vortical flow as effectively as the cases with
![]() $m=\pm 1$
. The observation of the control set-up with
$m=\pm 1$
. The observation of the control set-up with
![]() $m=1$
working most effectively agrees qualitatively with the non-modal analysis of the Burgers vortex conducted by Schmid & Rossi (Reference Schmid and Rossi2004). With the steady actuation
$m=1$
working most effectively agrees qualitatively with the non-modal analysis of the Burgers vortex conducted by Schmid & Rossi (Reference Schmid and Rossi2004). With the steady actuation
![]() $f_{c}=0$
, the vortex core is displaced away from
$f_{c}=0$
, the vortex core is displaced away from
![]() $r=0$
and still exhibits axial variation (i.e.
$r=0$
and still exhibits axial variation (i.e.
![]() $\hat{k}_{z}\neq 0$
). The results imply that unsteady actuation plays an important role in effectively alleviating the low vortex core pressure.
$\hat{k}_{z}\neq 0$
). The results imply that unsteady actuation plays an important role in effectively alleviating the low vortex core pressure.

Figure 7. Minimal spatial pressure shown as a function of the non-dimensional axial wavenumber
![]() $\hat{k}_{z}$
. Also shown is the energy amplification (transient growth gain) from the stability analysis of Schmid & Rossi (Reference Schmid and Rossi2004). All results are shown for
$\hat{k}_{z}$
. Also shown is the energy amplification (transient growth gain) from the stability analysis of Schmid & Rossi (Reference Schmid and Rossi2004). All results are shown for
![]() $Re_{\unicode[STIX]{x1D6E4}}=5000$
. The dashed line shows the minimal core pressure for the baseline flow.
$Re_{\unicode[STIX]{x1D6E4}}=5000$
. The dashed line shows the minimal core pressure for the baseline flow.
5 Concluding remarks
We have characterized and controlled a wall-normal vortex based on the Burgers vortex inflow condition in direct numerical simulation at a circulation-based Reynolds number of 5000. This type of vortex often appears upstream of turbomachinery and can cause degradation in operating efficiency and potential structural damage. As such, the objective of the present study was to increase the pressure of the vortex core and avoid the potential appearance of hollow-core vortices by modifying the vortical flow through active flow control.
The baseline vortical flow was found to have a steady near-wall region, a vortex breakdown region and a wake region. Dynamic mode decomposition was performed on the flow-field data to identify the unsteady modal structures and their frequencies. Based on the insights gained from baseline flow characterization, we have developed an active flow control approach where unsteady blowing and suction (zero-net-mass flux) is introduced from the bottom wall at the centre of the vortex. The forcing input was added in an unsteady manner with co-rotating and counter-rotating set-ups. We have observed that co-rotating control is more effective in altering the vortical flow. The control input is able to spread the vortex core and increase the level of unsteadiness, which eliminates the vortex breakdown region. With the core widening radially, the azimuthal velocity decreases and the core pressure increases.
Moreover, the influence of actuation frequency and amplitude was analysed. For co-rotating control, it was observed that low-frequency forcing is effective in weakening the core region of the vortex, providing significant pressure increase. We have also found that there is a threshold forcing amplitude (circulation-based momentum coefficient of
![]() $C_{\unicode[STIX]{x1D707}}^{\unicode[STIX]{x1D6E4}}=0.51\,\%$
), above which the control effect essentially saturates. The developed control set-up was found to take advantage of the transient growth of perturbation input and force the mean flow to be altered. This observation qualitatively agrees with the non-modal stability analysis of the Burgers vortex reported by Schmid & Rossi (Reference Schmid and Rossi2004). The insights from non-modal analysis have offered guidance on finding an effective control approach to modify the mean flow and reduce the space over which to search for appropriate control parameters. The present flow control technique opens a promising path to alleviate adverse effects from strong wall-normal vortices.
$C_{\unicode[STIX]{x1D707}}^{\unicode[STIX]{x1D6E4}}=0.51\,\%$
), above which the control effect essentially saturates. The developed control set-up was found to take advantage of the transient growth of perturbation input and force the mean flow to be altered. This observation qualitatively agrees with the non-modal stability analysis of the Burgers vortex reported by Schmid & Rossi (Reference Schmid and Rossi2004). The insights from non-modal analysis have offered guidance on finding an effective control approach to modify the mean flow and reduce the space over which to search for appropriate control parameters. The present flow control technique opens a promising path to alleviate adverse effects from strong wall-normal vortices.


