1 Introduction
It is widely recognized that many arterial diseases can be connected to abnormal flow-related mechanisms. For example, high wall shear stress (WSS) and dynamic pressure are usually observed at the entrance tear of type-B aortic dissection (Karmonik et al. Reference Karmonik, Bismuth, Davies, Shah, Younes and Lumsden2011). Atherosclerosis, which refers to the hardening of arteries, is correlated with low WSS or with rapid spatial/temporal WSS changes (Berger & Jou Reference Berger and Jou2000), but this viewpoint has been challenged by recent studies (Peiffer, Sherwin & Weinberg Reference Peiffer, Sherwin and Weinberg2013; Mohamied et al. Reference Mohamied, Rowland, Bailey, Sherwin, Schwartz and Weinberg2014), which implicate transverse WSS (Mohamied et al. Reference Mohamied, Rowland, Bailey, Sherwin, Schwartz and Weinberg2014). On the other hand, high shear stress is related to the platelet activation, which can contribute to atherosclerosis and thrombosis (Stein, Walburn & Sabbah Reference Stein, Walburn and Sabbah1982).
Abnormal flow patterns, such as in poststenotic regions of arteries, also generate abnormal sounds, called murmurs or bruits. The generated murmurs can be non-invasively detected on the epidermal surface with the help of stethoscopes. For over two hundred years, this detection technique, termed auscultation, has been used by physicians for the detection and screening of cardiovascular diseases (Hanna & Silverman Reference Hanna and Silverman2002). Compared with other modern diagnostic modalities, such as computed tomography, angiography, echocardiography and electrocardiography, auscultation has the advantages of being inexpensive, non-invasive, non-chemical and non-radiative. However, the practice of auscultation has not changed significantly since the invention of the stethoscope (Hanna & Silverman Reference Hanna and Silverman2002), and its reliance on the expertise and acuity of the physician has contributed to a lack of specificity and sensitivity for this diagnostic modality (Alam et al. Reference Alam, Asghar, Khan, Hayat and Malik2010). On the other hand, it has long been recognized that arterial murmurs contain vast amounts of disease related information (Lees & Dewey Reference Lees and Dewey1970), and researchers have been exploring for many decades the possibility of transforming auscultation into a quantitative and more accurate diagnostic modality (Lees & Dewey Reference Lees and Dewey1970; Duncan et al. Reference Duncan, Gruber, Dewey, Myers and Lees1975; Semmlow & Rahalkar Reference Semmlow and Rahalkar2007; Erne Reference Erne2008; Watrous, Thompson & Ackerman Reference Watrous, Reid Thompson and Ackerman2008; Andreou et al. Reference Andreou, Abraham, Thompson, Seo and Mittal2015). However, in addition to improved sensors and signal processing algorithms, this requires a better understanding of the causal mechanism of the murmurs for a given disease condition. As mentioned previously, murmurs are closely related to the abnormal local flow pattern(s) in the blood vessel. A given disease condition usually leads to unique flow abnormalities, which, in turn, create pressure fluctuations and murmurs with unique characteristics. Thus, a critical step in transforming auscultation into a quantitative, and perhaps automated, modality is to establish a more complete understanding of the local flow patterns associated with a given disease condition. In this study, we focus on aortic stenosis as the disease condition of choice due to the fact that it is the most common valvular disease and is known to create a very distinct ejection murmur (Etchells, Bell & Robb Reference Etchells, Bell and Robb1997; Manning Reference Manning2013).
Poststenotic flow in general has been studied extensively through both experiments (Johansen Reference Johansen1930; Clark Reference Clark1976a
,Reference Clark
b
,Reference Clark
c
; Tobin & Chang Reference Tobin and Chang1976; Clark Reference Clark1977; Fredberg Reference Fredberg1977; Cassanova & Giddens Reference Cassanova and Giddens1978; Clark Reference Clark1980; Ahmed & Giddens Reference Ahmed and Giddens1983a
,Reference Ahmed and Giddens
b
; Lu, Hui & Hwang Reference Lu, Hui and Hwang1983; Ahmed & Giddens Reference Ahmed and Giddens1984; Ojha et al.
Reference Ojha, Cobbold, Johnston and Hummel1989; Lieber & Giddens Reference Lieber and Giddens1990; Ahmed Reference Ahmed1998) and numerical simulations (Dvinsky & Ojha Reference Dvinsky and Ojha1994; Long et al.
Reference Long, Xu, Ramnarine and Hoskins2001; Mittal, Simmons & Udaykumar Reference Mittal, Simmons and Udaykumar2001; Niu et al.
Reference Niu, Chu, Lee and Yu2002; Mittal, Simmons & Najjar Reference Mittal, Simmons and Najjar2003; Varghese Reference Varghese2003; Sherwin & Blackburn Reference Sherwin and Blackburn2005; Blackburn & Sherwin Reference Blackburn and Sherwin2007; Liu Reference Liu2007; Okpara & Agarwal Reference Okpara and Agarwal2007; Varghese, Frankel & Fischer Reference Varghese, Frankel and Fischer2007a
,Reference Varghese, Frankel and Fischer
b
; Huang, Ho & Chen Reference Huang, Ho and Chen2011; Govindaraju et al.
Reference Govindaraju, Viswanathan, Badruddin, Kamangar, Salman Ahmed and Al-Rashed2016). The majority of the studies cited here modelled the blood vessel of interest as a straight circular tube, and both axisymmetric and asymmetric stenoses were studied. Steady as well as pulsatile flow conditions were used in these studies, with steady flow studies usually serving as the prequel to pulsatile flow studies. In the context of aortic stenosis or, more generally, arterial stenosis, researchers have mainly attempted to find (1) under what conditions the poststenotic flow becomes turbulent, (2) the generation mechanism(s) of the murmurs, (3) the source location of the murmurs and (4) the connection between the severity of the stenosis and the signal characteristics. An overview of these results is presented in the next few paragraphs. In the context of this paper, the severity of the stenosis is denoted by the percentage of area that is occluded, and the Reynolds number (
 $Re$
) is defined using the diameter (
$Re$
) is defined using the diameter (
 $D$
) and mean cross-sectional velocity of the unconstricted (healthy) part of the circular tube.
$D$
) and mean cross-sectional velocity of the unconstricted (healthy) part of the circular tube.
It is well established that laminar flow is a valid assumption in the majority of the healthy (normal) human vascular system (Hathcock Reference Hathcock2006). However, due to the high flow rate through the aortic valve, turbulent flow can sometimes be observed in the aorta of healthy subjects during peak systole, as shown in the in vivo measurements by Stein & Sabbah (Reference Stein and Sabbah1976). This study also found that turbulent flow could be detected in the ascending aorta of all of the subjects with an aortic valvular disease during most of the systole. Ahmed & Giddens (Reference Ahmed and Giddens1983b ) conducted in vitro experiments to investigate the poststenotic flow inside a straight tube with steady inflow at moderate Reynolds numbers (500–2000). Their study showed that for a stenosis with 50 % area reduction, the postvalvular flow was dominated by discrete-frequency vortex shedding when the Reynolds number was lower than 1000, while both periodic vortex shedding and turbulence contributed significantly to the postvalvular flow fluctuations at higher Reynolds number. For the case with area reduction of 75 %, the turbulence could be observed for a Reynolds number as low as 1000. Sherwin & Blackburn (Reference Sherwin and Blackburn2005) used linear stability analysis to investigate the turbulent transition in a similar set-up, and the critical Reynolds number predicted for the 75 % stenosis was 722. To model the onset of the turbulence, the Reynolds-averaged Navier–Stokes equation approach (Varghese Reference Varghese2003), large-eddy simulation (Mittal et al. Reference Mittal, Simmons and Udaykumar2001, Reference Mittal, Simmons and Najjar2003) and direct numerical simulation (Mittal et al. Reference Mittal, Simmons and Najjar2003; Sherwin & Blackburn Reference Sherwin and Blackburn2005; Varghese et al. Reference Varghese, Frankel and Fischer2007a ,Reference Varghese, Frankel and Fischer b ) have been used.
While the poststenotic flow in the aorta is turbulent, the sound directly generated by the aortic jet is significantly weaker than the sound generated by the pressure fluctuations at the vessel wall (Yellin Reference Yellin1966). Clark (Reference Clark1976c
) reached a similar conclusion, based on which he postulated that the murmurs were mainly generated from the wall pressure fluctuations caused by the onset of turbulence. Similarly, based on their experimental observation that murmur signal spectra collected from subjects with carotid and femoral stenoses shared strikingly similarity to the spectra of turbulent wall pressure fluctuations from a rigid tube, Lees & Dewey (Reference Lees and Dewey1970) concluded that the turbulent wall pressure fluctuations were responsible for the murmur generation. On the other hand, Tobin & Chang (Reference Tobin and Chang1976) measured the spectra of wall pressure fluctuations generated by a steady flow in a rigid tube with different axisymmetric constrictions at physiologically relevant Reynolds numbers (500–4000). Unlike Lees & Dewey (Reference Lees and Dewey1970), the spectra they obtained did not exactly match that of the fully developed turbulent pipe flow, and the location with maximum intensity of wall pressure fluctuation was determined by the reattachment of the jet shear layer. Ahmed & Giddens (Reference Ahmed and Giddens1983a
,Reference Ahmed and Giddens
b
) showed that, for the steady jet flow after a 75 % stenosis with
 $Re=2000$
, the centreline energy spectrum showed discrete-frequency vortex shedding behaviour shortly after the stenosis (
$Re=2000$
, the centreline energy spectrum showed discrete-frequency vortex shedding behaviour shortly after the stenosis (
 $1.5D$
downstream), and the flow demonstrated both vortex shedding and turbulent characteristics between
$1.5D$
downstream), and the flow demonstrated both vortex shedding and turbulent characteristics between
 $1.5D$
and
$1.5D$
and
 $2.5D$
, while the reattachment location was around
$2.5D$
, while the reattachment location was around
 $2.8D$
. The flow displayed clear characteristics associated with turbulence further downstream of the stenosis. Clearly, the final murmur signal will include contributions from wall pressure fluctuations caused by both shear layer vortex shedding and turbulence, and although it is practically impossible to separate these contributions, the consensus is that the murmurs are generated from the pressure fluctuations on the vessel wall regardless of the precise source of these pressure fluctuations.
$2.8D$
. The flow displayed clear characteristics associated with turbulence further downstream of the stenosis. Clearly, the final murmur signal will include contributions from wall pressure fluctuations caused by both shear layer vortex shedding and turbulence, and although it is practically impossible to separate these contributions, the consensus is that the murmurs are generated from the pressure fluctuations on the vessel wall regardless of the precise source of these pressure fluctuations.
With this understanding of the murmur generation mechanism, the source location of the murmurs is usually identified as the location with maximum wall pressure fluctuation. Identification of the murmur source location has great clinical significance, since this can help to diagnose the underlying condition. Physicians have, however, long been aware that the location of the murmur source and the location of the disease do not necessarily match. For example, to determine whether there are ejection murmurs caused by the aortic stenosis, doctors will place the stethoscope at the second right intercostal space, which is slightly downstream of the aortic valve (Bickley & Szilagyi Reference Bickley and Szilagyi2012). Tobin & Chang (Reference Tobin and Chang1976) found that for a steady flow through stenoses with 75 %, 85 % and 90 % area reduction in a straight tube, the spatial distribution of the intensity of wall pressure fluctuation shared very similar behaviour at Reynolds numbers around 3000. The intensity slowly increases after the stenosis, reaches a maximum between
 $1.5D$
and
$1.5D$
and
 $2.5D$
downstream of the stenosis, and decreases sharply afterwards. They also noticed that the source location was just upstream of the flow reattachment location. Lu et al. (Reference Lu, Hui and Hwang1983) reported the source location to be
$2.5D$
downstream of the stenosis, and decreases sharply afterwards. They also noticed that the source location was just upstream of the flow reattachment location. Lu et al. (Reference Lu, Hui and Hwang1983) reported the source location to be
 $2.1D$
downstream of the stenosis for a 89 % stenosis, and in Ahmed & Giddens (Reference Ahmed and Giddens1983a
), the source location for a 75 % stenosis at
$2.1D$
downstream of the stenosis for a 89 % stenosis, and in Ahmed & Giddens (Reference Ahmed and Giddens1983a
), the source location for a 75 % stenosis at
 $Re=2000$
was approximately 2.8D downstream. It seems that after a certain critical Reynolds number, the maximum wall pressure fluctuation location only varies slightly over a wide range of Reynolds number and the severity of stenosis. However, the reattachment behaviour is slightly complex in the low-Reynolds-number regime. Ahmed & Giddens (Reference Ahmed and Giddens1983a
) demonstrated that, for the case with 75 % stenosis, the shear layers reattached to the wall at
$Re=2000$
was approximately 2.8D downstream. It seems that after a certain critical Reynolds number, the maximum wall pressure fluctuation location only varies slightly over a wide range of Reynolds number and the severity of stenosis. However, the reattachment behaviour is slightly complex in the low-Reynolds-number regime. Ahmed & Giddens (Reference Ahmed and Giddens1983a
) demonstrated that, for the case with 75 % stenosis, the shear layers reattached to the wall at
 $4D$
distal to the stenosis at
$4D$
distal to the stenosis at
 $Re=500$
, but the reattachment location was between
$Re=500$
, but the reattachment location was between
 $5D$
and
$5D$
and
 $6D$
when
$6D$
when
 $Re=1000$
. If the Reynolds number was further increased to 2000, the reattachment occurred roughly
$Re=1000$
. If the Reynolds number was further increased to 2000, the reattachment occurred roughly
 $2.8D$
after the stenosis. This is due to the fact that as the Reynolds number passes the critical value, the onset of transition to turbulence of the poststenotic jet will change the reattachment location. The transition moves closer to the stenosis as the Reynolds number further increases, and so does the location of reattachment (Ahmed & Giddens Reference Ahmed and Giddens1983a
).
$2.8D$
after the stenosis. This is due to the fact that as the Reynolds number passes the critical value, the onset of transition to turbulence of the poststenotic jet will change the reattachment location. The transition moves closer to the stenosis as the Reynolds number further increases, and so does the location of reattachment (Ahmed & Giddens Reference Ahmed and Giddens1983a
).
While localization of the murmur source is one way to utilize the auscultation signals, researchers have also focused on non-invasively determining the degree of stenosis through the characteristics of the murmur signals. As previously mentioned, periodic vortex shedding plays an important role in the generation of the murmurs, so this shedding frequency is studied extensively. The first such study dates back to 1930 (Johansen Reference Johansen1930), in which orifices were placed inside a straight rigid tube to model stenoses. For the case with 75 % area constriction, the steady volume rate was modulated in order to vary the Reynolds number from 222 to 1020. This study found that the Strouhal number of the vortex shedding was approximately 0.60 irrespective of the flow rate. It is worth noting that, since this shear layer vortex shedding is governed by the jet instability, the Reynolds number and Strouhal number here are non-dimensionalized by the diameter and mean velocity at the orifice. Other experimental studies (Clark Reference Clark1976c ; Cassanova & Giddens Reference Cassanova and Giddens1978; Ahmed & Giddens Reference Ahmed and Giddens1983b ) also reported vortex shedding Strouhal numbers of around 0.60 at higher Reynolds numbers as well as different degrees of stenosis. As a matter of fact, the Strouhal number of the vortex rings formed from a free circular jet is around 0.63 (Beavers & Wilson Reference Beavers and Wilson1970). This is clear evidence that before the shear layer reaches the wall, the confined jet is governed by the same instability mechanism as the free jet. It is also noted that the Strouhal number of a two-dimensional jet reduces to 0.43 (Beavers & Wilson Reference Beavers and Wilson1970), which hints that the shape of the jet is very critical in determining the shedding frequency.
From the above discussion, it appears that we already have a basic understanding of the haemodynamics of poststenotic flows that generate murmurs. However, the knowledge derived from previous studies does not necessarily apply to the case of aortic stenosis. First of all, the aorta has a high degree of curvature in the postvalvular region, which is expected to affect the poststenotic jet, and it is therefore difficult to extrapolate our understanding from previous studies with straight tube models. In fact, it is known that wall curvature introduces secondary flows which should affect the wall pressure fluctuation in complex ways. Another issue is that the poststenotic jet is unlikely to remain circular due to its interaction with the curved wall, and this could affect the jet characteristics. There have been several studies (Niu et al. Reference Niu, Chu, Lee and Yu2002; Taelman et al. Reference Taelman, Bols, Degroote, Muthurangu, Panzer, Vierendeels and Segers2015; Govindaraju et al. Reference Govindaraju, Viswanathan, Badruddin, Kamangar, Salman Ahmed and Al-Rashed2016) that have explored the flow in curved pipes. However, because these earlier studies have either used the assumption of laminar flow or did not employ the geometric configuration that represents an aortic stenosis, they provide limited understanding of the poststenotic haemodynamics of an aortic stenosis. To explore these issues, we use computational modelling and simulation to study the flow downstream of aortic stenoses, with the aorta being modelled as a curved pipe. This model, although simple, incorporates many of the key features of a realistic aortic stenosis.
2 Model configuration
2.1 Geometry and numerical methods

Figure 1. (a) Schematic of the modelled aorta with an axisymmetric 75 % stenosis. The dashed line represents the geometric centreline of the modelled aorta. (b) Frontal plane view of the mesh used in the current study. For the sake of clarity, every fourth mesh point in each direction is plotted here.
The geometry employed in this study is shown in figure 1(a). The aorta is modelled as a pipe with a
 $180^{\circ }$
turn, and the unconstricted part of the aorta shares a uniform diameter
$180^{\circ }$
turn, and the unconstricted part of the aorta shares a uniform diameter
 $D$
. An axisymmetric smooth constriction is placed
$D$
. An axisymmetric smooth constriction is placed
 $1D$
$1D$
 $(L_{i}=1D)$
downstream of the inlet of the modelled aorta as the stenosis, and its profile is given in appendix A. This shape represents the incomplete opening of the aortic valves due to stenosis, and the same profile is used in Seo et al. (Reference Seo, Bakhshaee, Garreau, Zhu, Andreou, Thompson and Mittal2017). Similarly contoured occlusions have also been used in other studies to represent stenoses (Cassanova & Giddens Reference Cassanova and Giddens1978; Ahmed & Giddens Reference Ahmed and Giddens1983a
; Niu et al.
Reference Niu, Chu, Lee and Yu2002; Sherwin & Blackburn Reference Sherwin and Blackburn2005; Varghese et al.
Reference Varghese, Frankel and Fischer2007a
). The area stenosis ratio (
$(L_{i}=1D)$
downstream of the inlet of the modelled aorta as the stenosis, and its profile is given in appendix A. This shape represents the incomplete opening of the aortic valves due to stenosis, and the same profile is used in Seo et al. (Reference Seo, Bakhshaee, Garreau, Zhu, Andreou, Thompson and Mittal2017). Similarly contoured occlusions have also been used in other studies to represent stenoses (Cassanova & Giddens Reference Cassanova and Giddens1978; Ahmed & Giddens Reference Ahmed and Giddens1983a
; Niu et al.
Reference Niu, Chu, Lee and Yu2002; Sherwin & Blackburn Reference Sherwin and Blackburn2005; Varghese et al.
Reference Varghese, Frankel and Fischer2007a
). The area stenosis ratio (
 $AS$
), which represents the percentage of area that is occluded, is used to denote the severity/degree of stenosis, and can be calculated by
$AS$
), which represents the percentage of area that is occluded, is used to denote the severity/degree of stenosis, and can be calculated by
 $1-(D_{j}/D)^{2}$
, where
$1-(D_{j}/D)^{2}$
, where
 $D_{j}$
is the minimal diameter of the stenosis. In the current study, three different degrees of stenosis,
$D_{j}$
is the minimal diameter of the stenosis. In the current study, three different degrees of stenosis,
 $AS=50\,\%,62.5\,\%$
and
$AS=50\,\%,62.5\,\%$
and
 $75\,\%$
, are considered, which represent mild to severe aortic stenoses. The cross-sectional averaged velocity at the location with the minimum diameter (jet velocity) can be derived from the mass conservation as
$75\,\%$
, are considered, which represent mild to severe aortic stenoses. The cross-sectional averaged velocity at the location with the minimum diameter (jet velocity) can be derived from the mass conservation as
 $V_{j}=V_{in}(D/D_{j})^{2}=V_{in}/(1-AS)$
, where
$V_{j}=V_{in}(D/D_{j})^{2}=V_{in}/(1-AS)$
, where
 $V_{in}$
is the mean inlet velocity. The geometric centreline of the modelled aorta lies in the
$V_{in}$
is the mean inlet velocity. The geometric centreline of the modelled aorta lies in the
 $y{-}z$
plane and has a radius of
$y{-}z$
plane and has a radius of
 $R_{c}=2D$
. Human aortas exhibit a certain degree of tortuosity, but we neglect this here to focus on the effect of the curvature. The vessel wall is assumed to be rigid, i.e. the translational motion and compliance of the wall are not considered. This was justified by Jin, Oshinski & Giddens (Reference Jin, Oshinski and Giddens2003), who showed that the WSS predicted from the rigid-wall model and the deformable model agreed reasonably well. Moreover, the cross-sectional velocity distribution calculated from the rigid-wall patient-specific models correlated well with the corresponding MRI data (Jin et al.
Reference Jin, Oshinski and Giddens2003).
$R_{c}=2D$
. Human aortas exhibit a certain degree of tortuosity, but we neglect this here to focus on the effect of the curvature. The vessel wall is assumed to be rigid, i.e. the translational motion and compliance of the wall are not considered. This was justified by Jin, Oshinski & Giddens (Reference Jin, Oshinski and Giddens2003), who showed that the WSS predicted from the rigid-wall model and the deformable model agreed reasonably well. Moreover, the cross-sectional velocity distribution calculated from the rigid-wall patient-specific models correlated well with the corresponding MRI data (Jin et al.
Reference Jin, Oshinski and Giddens2003).
The blood in the large arteries is usually treated as a Newtonian fluid (Pedley Reference Pedley1980), and, in keeping with this, flow inside the modelled aorta is governed by the incompressible Navier–Stokes equations. The resting human heart rate is
 $O(1)~\text{Hz}$
while the murmur frequency is usually
$O(1)~\text{Hz}$
while the murmur frequency is usually
 $O(100)~\text{Hz}$
. Thus, the pulsatility of the flow is considered to be a slow variation compared with the murmur signal (Tobin & Chang Reference Tobin and Chang1976), and the blood flow in the current model is assumed to be driven by a uniform steady inflow (
$O(100)~\text{Hz}$
. Thus, the pulsatility of the flow is considered to be a slow variation compared with the murmur signal (Tobin & Chang Reference Tobin and Chang1976), and the blood flow in the current model is assumed to be driven by a uniform steady inflow (
 $V_{in}$
) at the inlet. Peiffer et al. (Reference Peiffer, Rowland, Cremers, Weinberg and Sherwin2012) demonstrated through their computational study of flow inside rabbit aortas that parabolic or skewed inflow profiles produced very similar results to the uniform inflow. The Reynolds number, which is defined as
$V_{in}$
) at the inlet. Peiffer et al. (Reference Peiffer, Rowland, Cremers, Weinberg and Sherwin2012) demonstrated through their computational study of flow inside rabbit aortas that parabolic or skewed inflow profiles produced very similar results to the uniform inflow. The Reynolds number, which is defined as
 $Re=V_{in}D/\unicode[STIX]{x1D708}$
(
$Re=V_{in}D/\unicode[STIX]{x1D708}$
(
 $\unicode[STIX]{x1D708}$
is the kinematic viscosity of the blood), is set to 2000 in all of the simulations, and it is close to the mean value in human aorta (Mahmoudi Zarandi Reference Mahmoudi Zarandi2000) and facilitates comparison with experiments that have used a similar value (Cassanova & Giddens Reference Cassanova and Giddens1978; Ahmed & Giddens Reference Ahmed and Giddens1983a
,Reference Ahmed and Giddens
b
). This Reynolds number is located in the transitional flow regime, and direct numerical simulation (DNS) is used to resolve relevant spatial and temporal scales of the flow. The Dean number (
$\unicode[STIX]{x1D708}$
is the kinematic viscosity of the blood), is set to 2000 in all of the simulations, and it is close to the mean value in human aorta (Mahmoudi Zarandi Reference Mahmoudi Zarandi2000) and facilitates comparison with experiments that have used a similar value (Cassanova & Giddens Reference Cassanova and Giddens1978; Ahmed & Giddens Reference Ahmed and Giddens1983a
,Reference Ahmed and Giddens
b
). This Reynolds number is located in the transitional flow regime, and direct numerical simulation (DNS) is used to resolve relevant spatial and temporal scales of the flow. The Dean number (
 $De$
) based on the provided
$De$
) based on the provided
 $R_{c}$
and
$R_{c}$
and
 $Re$
is
$Re$
is
 $De=4\sqrt{D/R_{c}}R_{e}=5656.85$
, which is well within the typical physiological range (Mahmoudi Zarandi Reference Mahmoudi Zarandi2000).
$De=4\sqrt{D/R_{c}}R_{e}=5656.85$
, which is well within the typical physiological range (Mahmoudi Zarandi Reference Mahmoudi Zarandi2000).
The complicated geometry is handled by a sharp-interface immersed boundary method (Mittal et al.
Reference Mittal, Dong, Bozkurttas, Najjar, Vargas and von Loebbecke2008; Seo & Mittal Reference Seo and Mittal2011) which employs a cut-cell method for improved accuracy and conservation. Figure 1(b) shows the frontal plane view of the mesh employed in the simulation. The numbers of mesh points in the
 $x$
,
$x$
,
 $y$
and
$y$
and
 $z$
directions are
$z$
directions are
 $128$
,
$128$
,
 $384$
and
$384$
and
 $370$
, which result in a mesh with around
$370$
, which result in a mesh with around
 $18$
million points. This grid has been subjected to an extensive grid refinement study (see appendix B). The minimum grid spacing is
$18$
million points. This grid has been subjected to an extensive grid refinement study (see appendix B). The minimum grid spacing is
 $7.8\times 10^{-3}D$
and the time step is fixed at
$7.8\times 10^{-3}D$
and the time step is fixed at
 $1\times 10^{-3}D/V_{in}$
. The maximum CFL (Courant–Friedrichs–Lewy) number in these simulations is approximately 0.82. Simulations are carried out on the TACC-Stampede supercomputers with 768 cores, and it takes approximately 82 hours of wall time to complete 3.5 flow-through times for the
$1\times 10^{-3}D/V_{in}$
. The maximum CFL (Courant–Friedrichs–Lewy) number in these simulations is approximately 0.82. Simulations are carried out on the TACC-Stampede supercomputers with 768 cores, and it takes approximately 82 hours of wall time to complete 3.5 flow-through times for the
 $AS=75\,\%$
case. Here, one flow-through time is defined as the length of the geometric centreline of the modelled aorta divided by
$AS=75\,\%$
case. Here, one flow-through time is defined as the length of the geometric centreline of the modelled aorta divided by
 $V_{in}$
.
$V_{in}$
.
It is useful to enumerate the key limitations of the current work. First of all, the steady flow assumption is adopted here, but the physiological flow is pulsatile with a complex time varying profile. The effect of the flow acceleration and deceleration on the dynamics of the jet is not included here. However, pulsatility introduces additional parameters into the problem which would significantly expand the scope of the simulations. Our expectation is that the current steady inflow model will serve as a baseline for future exploration into other effects such as pulsatility. The second limitation is that the current model does not include the aortic-valve leaflets. The opening and closing of these leaflets affect the dynamics of the jet and its interaction with the aortic lumen. Inclusion of the leaflets would require a fluid–structure interaction model, which would also significantly complicate the simulations and analysis. Such models are currently being developed by a number of groups (Griffith Reference Griffith2010; de Tullio & Pascazio Reference de Tullio and Pascazio2016; Mittal et al. Reference Mittal, Seo, Shoele and Resar2017) and are expected to become a more common feature of such simulations in the future. Last but not least, the human aorta typically has additional geometric complexities that are not included here. For example, the non-planar geometry of the aorta could induce an asymmetric flow with a significant swirl inside the aortic arch (Morbiducci et al. Reference Morbiducci, Ponzini, Rizzo, Cadioli, Esposito, Montevecchi and Redaelli2011), and such effects are excluded here.
2.2 Data presentation

Figure 2. (a) Three-dimensional view of the computational domain (
 $AS=75\,\%$
). The cutout shows the zoomed-in view of the cross-section;
$AS=75\,\%$
). The cutout shows the zoomed-in view of the cross-section;
 $r$
,
$r$
,
 $\unicode[STIX]{x1D719}$
and
$\unicode[STIX]{x1D719}$
and
 $s$
represent the radial, azimuthal and streamwise directions. (b) Frontal plane view of the computational domain (
$s$
represent the radial, azimuthal and streamwise directions. (b) Frontal plane view of the computational domain (
 $AS=75\,\%$
). The squares show monitor locations along the anterior surface and the circles show monitor locations along the geometric centreline.
$AS=75\,\%$
). The squares show monitor locations along the anterior surface and the circles show monitor locations along the geometric centreline.
In all of the simulations, monitor points are placed at different locations in the computational domain to record the temporal history for subsequent analysis. There are two sets of monitor points and they are located on the anterior surface (squares) and the geometric centreline (circles) of the modelled aorta, as shown in figure 2. Monitor points are usually referred to through an angle
 $\unicode[STIX]{x1D703}$
measured from the starting location of the aortic arch (see figure 2
b).
$\unicode[STIX]{x1D703}$
measured from the starting location of the aortic arch (see figure 2
b).
As stated before, the simulations are conducted for 3.5 flow-through times and statistics are accumulated over the last 2.5 flow-through times so as to exclude the transients. For a general flow quantity
 $f$
, the mean over the averaging time
$f$
, the mean over the averaging time
 $T$
is computed as
$T$
is computed as
 $$\begin{eqnarray}\displaystyle & \displaystyle \bar{f}(x,y,z)={\displaystyle \frac{1}{T}}\int _{t_{0}}^{t_{0}+T}f(x,y,z,t)\,\text{d}t, & \displaystyle\end{eqnarray}$$
where
 $t_{0}$
represents the initial time of the averaging. Accordingly, the fluctuation of the flow quantity is defined as
$t_{0}$
represents the initial time of the averaging. Accordingly, the fluctuation of the flow quantity is defined as
 $$\begin{eqnarray}\displaystyle & \displaystyle f^{\prime }(x,y,z,t)=f(x,y,z,t)-\bar{f}(x,y,z). & \displaystyle\end{eqnarray}$$
The root mean square (RMS) of
 $f$
is computed by
$f$
is computed by
 $$\begin{eqnarray}\displaystyle & \displaystyle f_{rms}(x,y,z)=\sqrt{{\displaystyle \frac{1}{T}}\int _{t_{0}}^{t_{0}+T}[f^{\prime }(x,y,z,t)]^{2}\,\text{d}t}. & \displaystyle\end{eqnarray}$$
Unless otherwise stated, the results presented in this study are non-dimensionalized by the following characteristic parameters: velocity scale
 $V_{j}$
, length scale
$V_{j}$
, length scale
 $D_{j}$
, time scale
$D_{j}$
, time scale
 $D_{j}/V_{j}$
and pressure/stress scale
$D_{j}/V_{j}$
and pressure/stress scale
 $(\unicode[STIX]{x1D70C}V_{j}^{2})/2$
. In particular, the Strouhal number here is defined as
$(\unicode[STIX]{x1D70C}V_{j}^{2})/2$
. In particular, the Strouhal number here is defined as
 $St=fD_{j}/V_{j}$
.
$St=fD_{j}/V_{j}$
.
3 Results and discussion
3.1 Vortex dynamics

Figure 3. Instantaneous non-dimensionalized azimuthal vorticity distribution on the frontal plane for (a)
 $AS=50\,\%$
, (b)
$AS=50\,\%$
, (b)
 $AS=62.5\,\%$
and (c)
$AS=62.5\,\%$
and (c)
 $AS=75\,\%$
. All of the plots share the same contour levels as shown in (c). Arrow
$AS=75\,\%$
. All of the plots share the same contour levels as shown in (c). Arrow
 $A$
indicates the small recirculation zone, arrow
$A$
indicates the small recirculation zone, arrow
 $B$
indicates the large recirculation zone and arrow
$B$
indicates the large recirculation zone and arrow
 $C$
indicates the starting location of the periodic shear layer vortex shedding.
$C$
indicates the starting location of the periodic shear layer vortex shedding.
Figure 3 shows snapshots of the azimuthal vorticity on the frontal plane for the three cases,
 $AS=50\,\%,~62.5\,\%$
and
$AS=50\,\%,~62.5\,\%$
and
 $75\,\%$
, after the simulations have reached stationary state. These plots demonstrate the general behaviour of the poststenotic flow. The jet that is formed at the stenosis shares many characteristics among the three cases simulated here. As the jet advances into the aortic arch, the outer part of the jet impinges at the outer wall, while the inner part of the jet propagates further downstream and eventually starts to shed vortices, forming two separate recirculation areas, denoted in the figures by arrows
$75\,\%$
, after the simulations have reached stationary state. These plots demonstrate the general behaviour of the poststenotic flow. The jet that is formed at the stenosis shares many characteristics among the three cases simulated here. As the jet advances into the aortic arch, the outer part of the jet impinges at the outer wall, while the inner part of the jet propagates further downstream and eventually starts to shed vortices, forming two separate recirculation areas, denoted in the figures by arrows
 $A$
and
$A$
and
 $B$
. The inner part of the shear layer starts to exhibit discrete vortex shedding at roughly the same location of approximately
$B$
. The inner part of the shear layer starts to exhibit discrete vortex shedding at roughly the same location of approximately
 $1.2D$
(arrow
$1.2D$
(arrow
 $C$
) after the stenosis for all three cases. However, due to the different diameters of the jet, the location of jet impingement on the wall varies slightly between the three cases. Furthermore, after the outer portion of the jet hits the wall, a thin boundary layer is formed near the outer wall. This boundary layer shields the outer wall from sensing the vortex shedding occurring inside the modelled aorta in the cases
$C$
) after the stenosis for all three cases. However, due to the different diameters of the jet, the location of jet impingement on the wall varies slightly between the three cases. Furthermore, after the outer portion of the jet hits the wall, a thin boundary layer is formed near the outer wall. This boundary layer shields the outer wall from sensing the vortex shedding occurring inside the modelled aorta in the cases
 $AS=50\,\%$
and
$AS=50\,\%$
and
 $62.5\,\%$
due to the relative weak jet intensity. On the other hand, the vortices shed from the inner portion of the jet can be observed to penetrate the near-wall boundary layer in the aortic arch region for the 75 % case due to the more intense jet as well as the shorter distance between the onset of shedding and the outer wall. Lastly, compared with the other two cases, due to the lower jet velocity, the flow in 50 % stenosis shows fewer small vortical structures in the aortic arch and the descending aorta.
$62.5\,\%$
due to the relative weak jet intensity. On the other hand, the vortices shed from the inner portion of the jet can be observed to penetrate the near-wall boundary layer in the aortic arch region for the 75 % case due to the more intense jet as well as the shorter distance between the onset of shedding and the outer wall. Lastly, compared with the other two cases, due to the lower jet velocity, the flow in 50 % stenosis shows fewer small vortical structures in the aortic arch and the descending aorta.

Figure 4. (a) Mean streamwise vorticity at
 $\unicode[STIX]{x1D703}=35^{\circ }$
for
$\unicode[STIX]{x1D703}=35^{\circ }$
for
 $AS=62.5\,\%$
. The vectors show the direction of the in-plane motion of the fluid elements. (b) Mean azimuthal vorticity at
$AS=62.5\,\%$
. The vectors show the direction of the in-plane motion of the fluid elements. (b) Mean azimuthal vorticity at
 $\unicode[STIX]{x1D703}=35^{\circ }$
for
$\unicode[STIX]{x1D703}=35^{\circ }$
for
 $AS=62.5\,\%$
. (c) Mean
$AS=62.5\,\%$
. (c) Mean
 $z$
vorticity component at
$z$
vorticity component at
 $\unicode[STIX]{x1D703}=35^{\circ }$
for
$\unicode[STIX]{x1D703}=35^{\circ }$
for
 $AS=62.5\,\%$
. (d) Evolution of mean
$AS=62.5\,\%$
. (d) Evolution of mean
 $y$
vorticity component at different
$y$
vorticity component at different
 $z$
planes in the ascending aorta for
$z$
planes in the ascending aorta for
 $AS=62.5\,\%$
. All of the plots share the same contour levels as shown in (d).
$AS=62.5\,\%$
. All of the plots share the same contour levels as shown in (d).
Flow through a curved pipe is known to create secondary flows (Dean Reference Dean1927). Here, we use the cross-sectional vorticity distribution at
 $\unicode[STIX]{x1D703}=35^{\circ }$
for
$\unicode[STIX]{x1D703}=35^{\circ }$
for
 $AS=62.5\,\%$
to examine some key features of the secondary flows generated here. Figure 2(a) establishes the terminology for this analysis and figures 4(a) and 4(b) show the mean streamwise (
$AS=62.5\,\%$
to examine some key features of the secondary flows generated here. Figure 2(a) establishes the terminology for this analysis and figures 4(a) and 4(b) show the mean streamwise (
 $\overline{\unicode[STIX]{x1D714}}_{s}$
) and azimuthal (
$\overline{\unicode[STIX]{x1D714}}_{s}$
) and azimuthal (
 $\overline{\unicode[STIX]{x1D714}}_{\unicode[STIX]{x1D719}}$
) vorticities at the aforementioned plane. The mean streamwise vortical structures exhibit bilateral symmetry, with the flow near the anterior wall rotating in the anticlockwise direction and the flow near the posterior wall rotating clockwise. These vortical structures can be roughly divided into three groups: the primary vortices, the secondary vortical regions and the near-wall vortical regions. Among the three vortical structures on the same side of the plane of symmetry, the primary vortex and the secondary vortical region share the same sign while the near-wall vortical region has the opposite sign. Lee et al. (Reference Lee, Parker, Caro and Sherwin2008) conducted numerical simulation of the flow in a similar curved pipe, but with no stenosis. At
$\overline{\unicode[STIX]{x1D714}}_{\unicode[STIX]{x1D719}}$
) vorticities at the aforementioned plane. The mean streamwise vortical structures exhibit bilateral symmetry, with the flow near the anterior wall rotating in the anticlockwise direction and the flow near the posterior wall rotating clockwise. These vortical structures can be roughly divided into three groups: the primary vortices, the secondary vortical regions and the near-wall vortical regions. Among the three vortical structures on the same side of the plane of symmetry, the primary vortex and the secondary vortical region share the same sign while the near-wall vortical region has the opposite sign. Lee et al. (Reference Lee, Parker, Caro and Sherwin2008) conducted numerical simulation of the flow in a similar curved pipe, but with no stenosis. At
 $Re=500$
, they also observed three groups of vortical structures. However, unlike the current flow, the primary vortex (Dean vortex) and the secondary vortical region in Lee et al. (Reference Lee, Parker, Caro and Sherwin2008) have different signs. This hints at the different origins of the secondary vortical region in these two cases. In the traditional flow inside a smooth curved pipe, the secondary vortical region is formed from the near-wall vortical structure peeling off the wall. Hence, it has the same sign as the near-wall vortical region, but has a sign opposite to the primary vortex. In contrast, as will be shown later, the secondary vortical region is associated with the shear layer surrounding the jet in the current flow. Since the streamwise vorticity is the vector projection of the
$Re=500$
, they also observed three groups of vortical structures. However, unlike the current flow, the primary vortex (Dean vortex) and the secondary vortical region in Lee et al. (Reference Lee, Parker, Caro and Sherwin2008) have different signs. This hints at the different origins of the secondary vortical region in these two cases. In the traditional flow inside a smooth curved pipe, the secondary vortical region is formed from the near-wall vortical structure peeling off the wall. Hence, it has the same sign as the near-wall vortical region, but has a sign opposite to the primary vortex. In contrast, as will be shown later, the secondary vortical region is associated with the shear layer surrounding the jet in the current flow. Since the streamwise vorticity is the vector projection of the
 $z$
and
$z$
and
 $y$
components of the vorticity onto the streamwise direction, we plot both components in figures 4(c) and 4(d) to help to understand the origins of the primary vortices and secondary vortical regions in the current study. The mean
$y$
components of the vorticity onto the streamwise direction, we plot both components in figures 4(c) and 4(d) to help to understand the origins of the primary vortices and secondary vortical regions in the current study. The mean
 $z$
vorticity component in figure 4(c) captures the primary vortices, which can be identified as the so-called Dean vortices (Dean Reference Dean1927; Lee et al.
Reference Lee, Parker, Caro and Sherwin2008). This is further confirmed by examining the vector field in figure 4(a), wherein the primary vortices overlap with regions with strong in-plane swirling motions. It is worth noting that the Dean vortices can be established quickly, as shown in experimental studies by Bulusu, Hussain & Plesniak (Reference Bulusu, Hussain and Plesniak2014), where a physiological pulsatile inflow condition was adopted.
$z$
vorticity component in figure 4(c) captures the primary vortices, which can be identified as the so-called Dean vortices (Dean Reference Dean1927; Lee et al.
Reference Lee, Parker, Caro and Sherwin2008). This is further confirmed by examining the vector field in figure 4(a), wherein the primary vortices overlap with regions with strong in-plane swirling motions. It is worth noting that the Dean vortices can be established quickly, as shown in experimental studies by Bulusu, Hussain & Plesniak (Reference Bulusu, Hussain and Plesniak2014), where a physiological pulsatile inflow condition was adopted.
Figure 4(d) shows the spatial evolution of the shear layer surrounding the core of the jet via contours of
 $\overline{\unicode[STIX]{x1D714}}_{y}$
on different
$\overline{\unicode[STIX]{x1D714}}_{y}$
on different
 $z$
planes. As can be seen, the inner part of the shear layer maintains its shape even after the outer part has vanished due to the jet impingement. This remaining shear layer generates
$z$
planes. As can be seen, the inner part of the shear layer maintains its shape even after the outer part has vanished due to the jet impingement. This remaining shear layer generates
 $y$
vorticity on both sides of the plane of symmetry that has the same sign as the primary vortices. We note that since the inner portion of the jet flows mainly in the
$y$
vorticity on both sides of the plane of symmetry that has the same sign as the primary vortices. We note that since the inner portion of the jet flows mainly in the
 $z$
direction immediately after the stenosis (see figure 3), a plot of the cross-sectional azimuthal vorticity will not reveal the true origin of the secondary vortical region, as demonstrated in figure 4(b).
$z$
direction immediately after the stenosis (see figure 3), a plot of the cross-sectional azimuthal vorticity will not reveal the true origin of the secondary vortical region, as demonstrated in figure 4(b).

Figure 5. The non-dimensionalized mean streamwise vorticity for the three cases plotted at different angles,
 $\unicode[STIX]{x1D703}$
, to illustrate its spatial evolution.
$\unicode[STIX]{x1D703}$
, to illustrate its spatial evolution.
With the key structures of the streamwise vorticity identified, we examine how these features evolve with downstream distance. Figure 5 shows the mean streamwise vorticity at different angles
 $\unicode[STIX]{x1D703}$
for all three models. The region of vorticity deficit near the outer wall represents the core of the jet, and its area decreases as the stenosis becomes more severe. The aforementioned three groups of vortical structures can be clearly identified when
$\unicode[STIX]{x1D703}$
for all three models. The region of vorticity deficit near the outer wall represents the core of the jet, and its area decreases as the stenosis becomes more severe. The aforementioned three groups of vortical structures can be clearly identified when
 $\unicode[STIX]{x1D703}\leqslant 45^{\circ }$
. Nevertheless, as shown in figure 3, the inner shear layer quickly breaks up as the jet advances downstream, introducing increased stochasticity in the flow behaviour. Hence, the secondary vortical regions are quick to dissipate in all three cases after
$\unicode[STIX]{x1D703}\leqslant 45^{\circ }$
. Nevertheless, as shown in figure 3, the inner shear layer quickly breaks up as the jet advances downstream, introducing increased stochasticity in the flow behaviour. Hence, the secondary vortical regions are quick to dissipate in all three cases after
 $55^{\circ }$
, while the primary vortices persist further downstream for approximately
$55^{\circ }$
, while the primary vortices persist further downstream for approximately
 $10^{\circ }$
. Eventually, all of the large vortical structures will disintegrate into small vortices in the descending aorta. In the case
$10^{\circ }$
. Eventually, all of the large vortical structures will disintegrate into small vortices in the descending aorta. In the case
 $AS=75\,\%$
, the primary vortices break up significantly earlier than the other two due to the strong jet intensity.
$AS=75\,\%$
, the primary vortices break up significantly earlier than the other two due to the strong jet intensity.
In summary, the poststenotic flow in this model of an aorta with an aortic stenosis is dominated by the jet created at the stenosis as well as the secondary flow induced by the curvature. The shear layer formed around the jet is the source of the secondary vortical regions, and it separates the core of the jet from the secondary flow that generates the primary/Dean vortices. In previous experimental studies, where the aorta was modelled as a straight tube, the flow distal to the stenosis was mainly governed by the jet dynamics and no secondary flow was reported (Cassanova & Giddens Reference Cassanova and Giddens1978; Ahmed & Giddens Reference Ahmed and Giddens1983a ,Reference Ahmed and Giddens b ). The poststenotic flow in a straight pipe is highly axisymmetric and the reattachment location is determined by the growth of the shear layer surrounding the jet (Back & Roschke Reference Back and Roschke1972). However, the inclusion of curvature breaks the axisymmetry of the flow, and the reattachment of the outer part of the shear layer is clearly due to the geometric confinement while the reattachment of the inner part of the jet cannot be easily defined.
3.2 Vortex structures and pressure

Figure 6. Vortex structures corresponding to the mean flow visualized through the isosurface of
 $\unicode[STIX]{x1D706}_{2}$
and coloured by the mean non-dimensional pressure for (a)
$\unicode[STIX]{x1D706}_{2}$
and coloured by the mean non-dimensional pressure for (a)
 $AS=50\,\%$
, (b)
$AS=50\,\%$
, (b)
 $AS=62.5\,\%$
and (c)
$AS=62.5\,\%$
and (c)
 $AS=75\,\%$
. (d) Decomposition of the vortex structures for
$AS=75\,\%$
. (d) Decomposition of the vortex structures for
 $AS=75\,\%$
, showing on the left shell structure and on the right two finger-like structures.
$AS=75\,\%$
, showing on the left shell structure and on the right two finger-like structures.
Since the current work is primarily motivated by auscultation-based diagnosis of aortic stenoses, we focus here on the characteristics of the pressure field in the poststenotic flow and its correlation to the vortical structures. Figure 6(a–c) shows the vortical structures corresponding to the mean flow visualized by the isosurface of
 $\unicode[STIX]{x1D706}_{2}$
(Jeong & Hussain Reference Jeong and Hussain1995) in the three cases, and these structures are coloured by the mean pressure. The vortical structures can be roughly separated into two groups: a shell structure on the top and two finger-like structures beneath it (see figure 6
d). From the pressure contours, it can be seen that the shell structure is mainly correlated with high pressure, while the finger-like structures, which are the Dean vortices, are correlated with low pressure. The high pressure in the shell structure is caused by the high pressure carried inside the core of the jet, which results from the conversion of dynamic to static pressure due to the impact of the jet on the outer wall. These two vortical structures are well separated in the ascending aorta, but merge further downstream as the large vortical structures start to disintegrate due to the transition to turbulence (see figure 6
b,c). However, in the case
$\unicode[STIX]{x1D706}_{2}$
(Jeong & Hussain Reference Jeong and Hussain1995) in the three cases, and these structures are coloured by the mean pressure. The vortical structures can be roughly separated into two groups: a shell structure on the top and two finger-like structures beneath it (see figure 6
d). From the pressure contours, it can be seen that the shell structure is mainly correlated with high pressure, while the finger-like structures, which are the Dean vortices, are correlated with low pressure. The high pressure in the shell structure is caused by the high pressure carried inside the core of the jet, which results from the conversion of dynamic to static pressure due to the impact of the jet on the outer wall. These two vortical structures are well separated in the ascending aorta, but merge further downstream as the large vortical structures start to disintegrate due to the transition to turbulence (see figure 6
b,c). However, in the case
 $AS=50\,\%$
, there seems to be no merging of these two structures, and the flow shows clear relaminarization in the descending aorta, and the vortical structures are stretched and extended to the outlet of the modelled aorta.
$AS=50\,\%$
, there seems to be no merging of these two structures, and the flow shows clear relaminarization in the descending aorta, and the vortical structures are stretched and extended to the outlet of the modelled aorta.

Figure 7. (a) The mean pressure distribution for the case
 $AS=62.5\,\%$
at
$AS=62.5\,\%$
at
 $\unicode[STIX]{x1D703}=35^{\circ }$
. (b) The contour line of the pressure shown in (a) overlapped with the mean streamwise vorticity.
$\unicode[STIX]{x1D703}=35^{\circ }$
. (b) The contour line of the pressure shown in (a) overlapped with the mean streamwise vorticity.
Figure 7(a) shows the cross-sectional distribution of the mean pressure at
 $\unicode[STIX]{x1D703}=35^{\circ }$
for
$\unicode[STIX]{x1D703}=35^{\circ }$
for
 $AS=62.5\,\%$
, and we can see that the low-pressure cores are located near the inner wall of the aorta while the high-pressure region is localized in the jet region near the outer wall. In figure 7(b), this pressure distribution is overlapped with the streamwise vorticity at the same location, and it is readily noticed that the two low-pressure cores coincide well with the Dean vortices, which is consistent with figure 6. We also note that the secondary vortical regions mark the boundary between the low-pressure region and the high-pressure region.
$AS=62.5\,\%$
, and we can see that the low-pressure cores are located near the inner wall of the aorta while the high-pressure region is localized in the jet region near the outer wall. In figure 7(b), this pressure distribution is overlapped with the streamwise vorticity at the same location, and it is readily noticed that the two low-pressure cores coincide well with the Dean vortices, which is consistent with figure 6. We also note that the secondary vortical regions mark the boundary between the low-pressure region and the high-pressure region.

Figure 8. The non-dimensionalized mean pressure for the three cases plotted at different angles,
 $\unicode[STIX]{x1D703}$
, to illustrate its spatial evolution.
$\unicode[STIX]{x1D703}$
, to illustrate its spatial evolution.
Figure 8 shows an array of cross-sectional mean pressure distribution at different angles for all three cases. Constant high pressure is observed in the jet region (near the outer wall). As the severity of stenosis increases, the initial diameter of the jet decreases and the size of the high-pressure core decreases accordingly. This is especially obvious at the initial stage of the jet (
 $\unicode[STIX]{x1D703}<45^{\circ }$
). When compared with the streamwise vorticity in figure 5, figure 8 shows that the two low-pressure cores are well correlated with primary vortices in regions where the Dean flows are well developed (
$\unicode[STIX]{x1D703}<45^{\circ }$
). When compared with the streamwise vorticity in figure 5, figure 8 shows that the two low-pressure cores are well correlated with primary vortices in regions where the Dean flows are well developed (
 $35^{\circ }\leqslant \unicode[STIX]{x1D703}\leqslant 65^{\circ }$
). Meanwhile, in the same region, the two low-pressure cores are moving towards the outer wall as the angle increases and also come closer to the anterior and posterior surfaces. For the 62.5 % and 75 % stenosis, the core size of the jet is smaller and the low-pressure cores are able to migrate to the centreline of the aorta, whereas they remain confined to the lower half for the 50 % case. This observation can also be verified by the locations of the finger-like vortical structures in figure 6.
$35^{\circ }\leqslant \unicode[STIX]{x1D703}\leqslant 65^{\circ }$
). Meanwhile, in the same region, the two low-pressure cores are moving towards the outer wall as the angle increases and also come closer to the anterior and posterior surfaces. For the 62.5 % and 75 % stenosis, the core size of the jet is smaller and the low-pressure cores are able to migrate to the centreline of the aorta, whereas they remain confined to the lower half for the 50 % case. This observation can also be verified by the locations of the finger-like vortical structures in figure 6.
3.3 Transition and turbulence

Figure 9. (a) The TKE distribution for the case
 $AS=62.5\,\%$
at
$AS=62.5\,\%$
at
 $\unicode[STIX]{x1D703}=60^{\circ }$
. (b) The contour line of the TKE shown in (a) overlapped with the mean streamwise vorticity. (c) The contour line of the TKE shown in (a) overlapped with the mean azimuthal vorticity.
$\unicode[STIX]{x1D703}=60^{\circ }$
. (b) The contour line of the TKE shown in (a) overlapped with the mean streamwise vorticity. (c) The contour line of the TKE shown in (a) overlapped with the mean azimuthal vorticity.
As stated earlier, the flow studied here lies in the transitional region, and, in this section, we describe the transitional and turbulent characteristics of the flow. Figure 9(a) shows the turbulent kinetic energy (TKE) distribution at
 $\unicode[STIX]{x1D703}=60^{\circ }$
for the case
$\unicode[STIX]{x1D703}=60^{\circ }$
for the case
 $AS=62.5\,\%$
. The high-TKE region forms a bridge-like shape with two ends located near the anterior and posterior surfaces of the aorta. In figures 9(b) and 9(c), the contour lines of the TKE distribution are overlapped with the mean streamwise (
$AS=62.5\,\%$
. The high-TKE region forms a bridge-like shape with two ends located near the anterior and posterior surfaces of the aorta. In figures 9(b) and 9(c), the contour lines of the TKE distribution are overlapped with the mean streamwise (
 $\overline{\unicode[STIX]{x1D714}}_{s}$
) and azimuthal (
$\overline{\unicode[STIX]{x1D714}}_{s}$
) and azimuthal (
 $\overline{\unicode[STIX]{x1D714}}_{\unicode[STIX]{x1D719}}$
) vorticity components at the same location. As shown in figure 9(b), the Dean vortices partially overlap with the two ends of the bridge-like TKE distribution, indicating the contribution from the stochastic fluctuations within the secondary flows to the TKE. Moreover, the secondary flows wrap around the jet and force it into the shape of a crescent, as can be seen in figure 9(c). It is also noted that the majority of the bridge-shape structure is well correlated with the strong azimuthal vorticity, and this azimuthal vorticity is related to the inner portion of the jet, where the shear layer vortex shedding and the subsequent vortex breakup mainly happen. Based on previous analysis of the vortex dynamics (see figures 3
b and 6
b), this specific angle is where the periodic vortex shedding transitions into a more stochastic flow behaviour, which accounts for the high TKE.
$\overline{\unicode[STIX]{x1D714}}_{\unicode[STIX]{x1D719}}$
) vorticity components at the same location. As shown in figure 9(b), the Dean vortices partially overlap with the two ends of the bridge-like TKE distribution, indicating the contribution from the stochastic fluctuations within the secondary flows to the TKE. Moreover, the secondary flows wrap around the jet and force it into the shape of a crescent, as can be seen in figure 9(c). It is also noted that the majority of the bridge-shape structure is well correlated with the strong azimuthal vorticity, and this azimuthal vorticity is related to the inner portion of the jet, where the shear layer vortex shedding and the subsequent vortex breakup mainly happen. Based on previous analysis of the vortex dynamics (see figures 3
b and 6
b), this specific angle is where the periodic vortex shedding transitions into a more stochastic flow behaviour, which accounts for the high TKE.

Figure 10. The non-dimensionalized TKE for the three cases plotted at different angles,
 $\unicode[STIX]{x1D703}$
, to illustrate its spatial evolution.
$\unicode[STIX]{x1D703}$
, to illustrate its spatial evolution.
Figure 10 shows the spatial evolution of the TKE for
 $AS=50\,\%,62.5\,\%$
and
$AS=50\,\%,62.5\,\%$
and
 $75\,\%$
. At the initial stage of the jet, the flow is still predominantly laminar, and the plots show low TKE concentration for
$75\,\%$
. At the initial stage of the jet, the flow is still predominantly laminar, and the plots show low TKE concentration for
 $\unicode[STIX]{x1D703}\leqslant 35^{\circ }$
. From figure 3, we can see that, compared with the other two cases, the vortex shedding in the
$\unicode[STIX]{x1D703}\leqslant 35^{\circ }$
. From figure 3, we can see that, compared with the other two cases, the vortex shedding in the
 $50\,\%$
case is considerably less intense. Thus, the TKE for
$50\,\%$
case is considerably less intense. Thus, the TKE for
 $AS=50\,\%$
is not noticeable until
$AS=50\,\%$
is not noticeable until
 $\unicode[STIX]{x1D703}=55^{\circ }$
, and the majority of the TKE comes from the region of the Dean vortices. On the other hand, for the cases
$\unicode[STIX]{x1D703}=55^{\circ }$
, and the majority of the TKE comes from the region of the Dean vortices. On the other hand, for the cases
 $AS=62.5\,\%$
and
$AS=62.5\,\%$
and
 $75\,\%$
, the intensity of the TKE is already quite noticeable at
$75\,\%$
, the intensity of the TKE is already quite noticeable at
 $\unicode[STIX]{x1D703}=45^{\circ }$
, where the jet is transitioning from periodic vortex shedding into more stochastic flow, and contributions from both the secondary vortical regions and the Dean vortices are visible. Similarly to what we observed in figure 8, due to the size of the jet, the high-TKE region moves closer to the outer wall and the anterior/posterior surface as the severity of the stenosis increases. It is worth mentioning that the TKE in figure 10 is non-dimensionalized by the mean jet velocity
$\unicode[STIX]{x1D703}=45^{\circ }$
, where the jet is transitioning from periodic vortex shedding into more stochastic flow, and contributions from both the secondary vortical regions and the Dean vortices are visible. Similarly to what we observed in figure 8, due to the size of the jet, the high-TKE region moves closer to the outer wall and the anterior/posterior surface as the severity of the stenosis increases. It is worth mentioning that the TKE in figure 10 is non-dimensionalized by the mean jet velocity
 $V_{j}$
. If it were non-dimensionalized by the inlet velocity,
$V_{j}$
. If it were non-dimensionalized by the inlet velocity,
 $V_{in}$
, the TKE intensity for
$V_{in}$
, the TKE intensity for
 $AS=75\,\%$
would appear to be much stronger than the other two under the same contour level.
$AS=75\,\%$
would appear to be much stronger than the other two under the same contour level.
Ahmed & Giddens (Reference Ahmed and Giddens1983a
,Reference Ahmed and Giddens
b
) studied flow past 50 % and 75 % stenosis at
 $Re=2000$
, and, similarly to the current study, they also found that the turbulence is always preceded by the discrete-frequency vortex shedding. However, since the vessel was modelled as a straight tube in their study, the TKE comes purely from the breakup of the jet shear layer. In the curved pipe model, the secondary flow induced by the curvature also contributes significantly to the total energy of turbulence. This is especially true for the
$Re=2000$
, and, similarly to the current study, they also found that the turbulence is always preceded by the discrete-frequency vortex shedding. However, since the vessel was modelled as a straight tube in their study, the TKE comes purely from the breakup of the jet shear layer. In the curved pipe model, the secondary flow induced by the curvature also contributes significantly to the total energy of turbulence. This is especially true for the
 $50\,\%$
stenosis, where the TKE resulting from the shear layer breakup is significantly lower than that from the secondary flow.
$50\,\%$
stenosis, where the TKE resulting from the shear layer breakup is significantly lower than that from the secondary flow.
3.4 Surface force analysis
As mentioned in the introduction, wall pressure fluctuations are known to be responsible for the generation of the murmurs, and, in this section, we focus on the characteristics of forces generated by the flow near the wall of the aorta.
Previous experimental studies of flows in straight tubes concluded that the maximum pressure fluctuation occurs slightly upstream of the reattachment position. Moreover, the reattachment is determined by the growth of the shear layer, and its position is relatively insensitive to the Reynolds number and the severity once the flow enters the regime where the shear layer growth is dominated by the transition to turbulence. However, the inclusion of the curvature complicates the behaviour, since the reattachment location is difficult to define and the secondary flows potentially introduce an additional source of fluctuation.
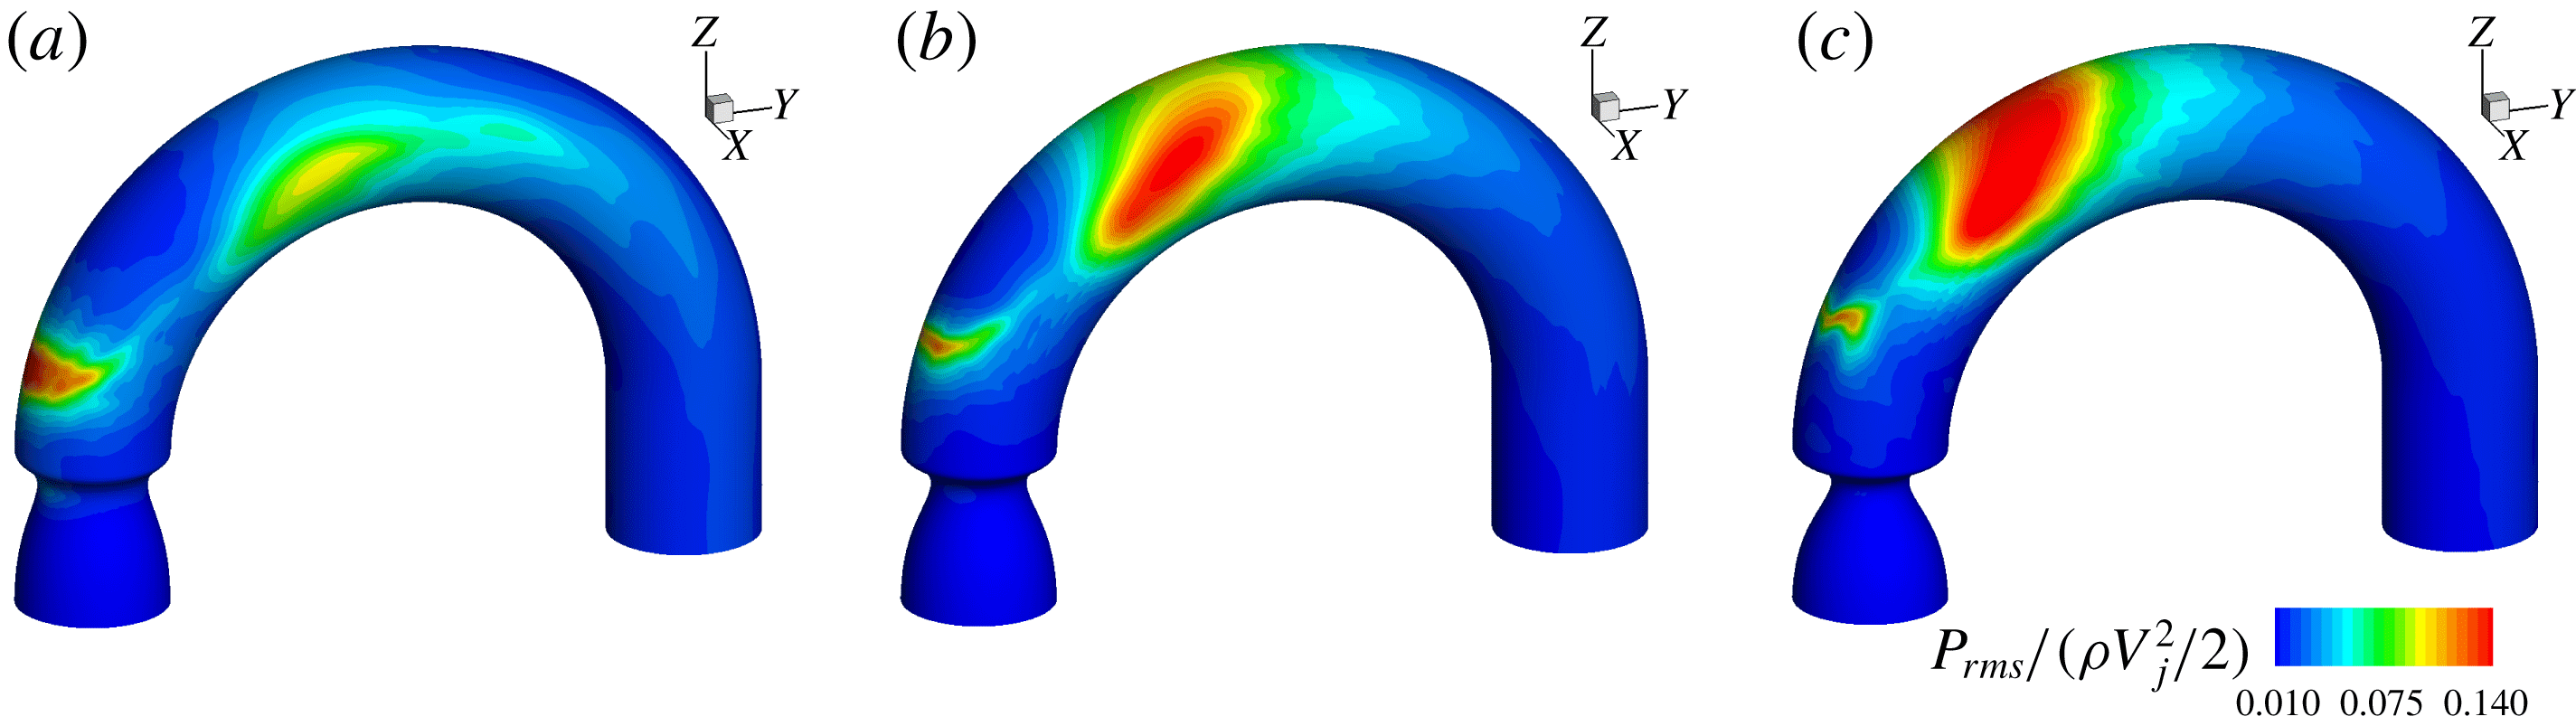
Figure 11. Non-dimensionalized RMS of surface pressure distribution for (a)
 $AS=50\,\%$
, (b)
$AS=50\,\%$
, (b)
 $AS=62.5\,\%$
and (c)
$AS=62.5\,\%$
and (c)
 $AS=75\,\%$
. All of the plots share the same contour levels as shown in (c).
$AS=75\,\%$
. All of the plots share the same contour levels as shown in (c).

Figure 12. Non-dimensionalized RMS of WSS distribution for (a)
 $AS=50\,\%$
, (b)
$AS=50\,\%$
, (b)
 $AS=62.5\,\%$
and (c)
$AS=62.5\,\%$
and (c)
 $AS=75\,\%$
. All of the plots share the same contour levels as shown in (c).
$AS=75\,\%$
. All of the plots share the same contour levels as shown in (c).
Figures 11 and 12 plot the distribution of the RMS of wall pressure and WSS. The pressure fluctuations are expected to generate both compression (longitudinal) and shear (transverse) waves inside the thorax, while WSS fluctuations will primarily generate shear waves (Seo et al. Reference Seo, Bakhshaee, Garreau, Zhu, Andreou, Thompson and Mittal2017; Zhu et al. Reference Zhu, Seo, Bakhshaee and Mittal2017). Interestingly, the region in the vicinity of the stenosis and the location of jet impingement on the wall are correlated with low magnitude of pressure fluctuations as well as low WSS fluctuations. The strong surface force fluctuations are found to occur in the small recirculation region immediately after the stenosis as well as on the anterior and posterior surfaces of the ascending aorta. The surface force fluctuations on the anterior aortic lumen are of particular importance, since this surface faces the chest, where heart murmurs are typically detected.
It is readily noticed that the intensity of wall pressure fluctuation has very different distributions in this region for the three cases. For
 $AS=50\,\%$
, a single high-intensity region is observed on the anterior surface around
$AS=50\,\%$
, a single high-intensity region is observed on the anterior surface around
 $\unicode[STIX]{x1D703}=70^{\circ }$
. This location is well correlated with strong TKE cores in figure 10, which also occur in this general region. This TKE is mainly caused by the strong secondary flow and it is therefore reasonable to deduce that this strong wall pressure fluctuation is also related to the stochastic fluctuations inside the Dean vortices. On the other hand, the region of strong wall pressure fluctuations for
$\unicode[STIX]{x1D703}=70^{\circ }$
. This location is well correlated with strong TKE cores in figure 10, which also occur in this general region. This TKE is mainly caused by the strong secondary flow and it is therefore reasonable to deduce that this strong wall pressure fluctuation is also related to the stochastic fluctuations inside the Dean vortices. On the other hand, the region of strong wall pressure fluctuations for
 $AS=62.5\,\%,75\,\%$
spans a large area on the anterior (and posterior) wall of the modelled aorta. In the
$AS=62.5\,\%,75\,\%$
spans a large area on the anterior (and posterior) wall of the modelled aorta. In the
 $AS=75\,\%$
case, the anterior and posterior regions of high wall pressure fluctuation are joined together to form a single region that spans a large portion of the aortic arch. This behaviour can also be traced back to the TKE distribution. First of all, from figure 10, the two ends of the TKE bridge lie very close to the anterior/posterior surface, and they show strong intensity over a wide angle (
$AS=75\,\%$
case, the anterior and posterior regions of high wall pressure fluctuation are joined together to form a single region that spans a large portion of the aortic arch. This behaviour can also be traced back to the TKE distribution. First of all, from figure 10, the two ends of the TKE bridge lie very close to the anterior/posterior surface, and they show strong intensity over a wide angle (
 $55^{\circ }\leqslant \unicode[STIX]{x1D703}\leqslant 75^{\circ }$
). This causes the large hotspot on the anterior surface. Second, the breakup of the jet shear layer occurs closer to the outer wall as the severity of the stenosis increases, which also introduces significant pressure fluctuations near the outer wall in the last two cases. It is readily noticed that the TKE reaches its maximum around
$55^{\circ }\leqslant \unicode[STIX]{x1D703}\leqslant 75^{\circ }$
). This causes the large hotspot on the anterior surface. Second, the breakup of the jet shear layer occurs closer to the outer wall as the severity of the stenosis increases, which also introduces significant pressure fluctuations near the outer wall in the last two cases. It is readily noticed that the TKE reaches its maximum around
 $65^{\circ }$
for the last two cases, and this explains why the source location for the
$65^{\circ }$
for the last two cases, and this explains why the source location for the
 $AS=50\,\%$
case appears to be further downstream.
$AS=50\,\%$
case appears to be further downstream.

Figure 13. (a) Non-dimensionalized RMS of pressure and (b) non-dimensionalized RMS of WSS plotted along the anterior surface.
Unlike the RMS of wall pressure, the surface distribution of the WSS fluctuations is more consistent among the three cases. Apart from the hotspot caused by the small recirculation zone immediately after the stenosis (arrow
 $A$
in figure 3), the maximum intensity of WSS fluctuation is located on the anterior and posterior surfaces of the ascending aorta, and is closely associated with the location of the Dean vortices. The RMS values of pressure and WSS are extracted along the anterior monitor points and plotted in figure 13. This figure clearly shows that the peak magnitude of the WSS fluctuation is approximately 5 % of that of the pressure fluctuation. Hence, the pressure fluctuation plays a dominant role in the murmur generation. From figure 13(a), the locations of the pressure fluctuation, i.e. the murmur source locations for
$A$
in figure 3), the maximum intensity of WSS fluctuation is located on the anterior and posterior surfaces of the ascending aorta, and is closely associated with the location of the Dean vortices. The RMS values of pressure and WSS are extracted along the anterior monitor points and plotted in figure 13. This figure clearly shows that the peak magnitude of the WSS fluctuation is approximately 5 % of that of the pressure fluctuation. Hence, the pressure fluctuation plays a dominant role in the murmur generation. From figure 13(a), the locations of the pressure fluctuation, i.e. the murmur source locations for
 $AS=50\,\%,62.5\,\%,75\,\%$
, are found to be at
$AS=50\,\%,62.5\,\%,75\,\%$
, are found to be at
 $\unicode[STIX]{x1D703}=70^{\circ },60^{\circ },55^{\circ }$
respectively. It is noted that even though the source locations span over
$\unicode[STIX]{x1D703}=70^{\circ },60^{\circ },55^{\circ }$
respectively. It is noted that even though the source locations span over
 $15^{\circ }$
, they actually lie within
$15^{\circ }$
, they actually lie within
 $0.6D$
of each other. This relative insensitivity of the murmur source to the stenotic severity is a reflection of the dominant role of the aortic curvature in the generation of pressure fluctuations.
$0.6D$
of each other. This relative insensitivity of the murmur source to the stenotic severity is a reflection of the dominant role of the aortic curvature in the generation of pressure fluctuations.
3.5 Spectral analysis
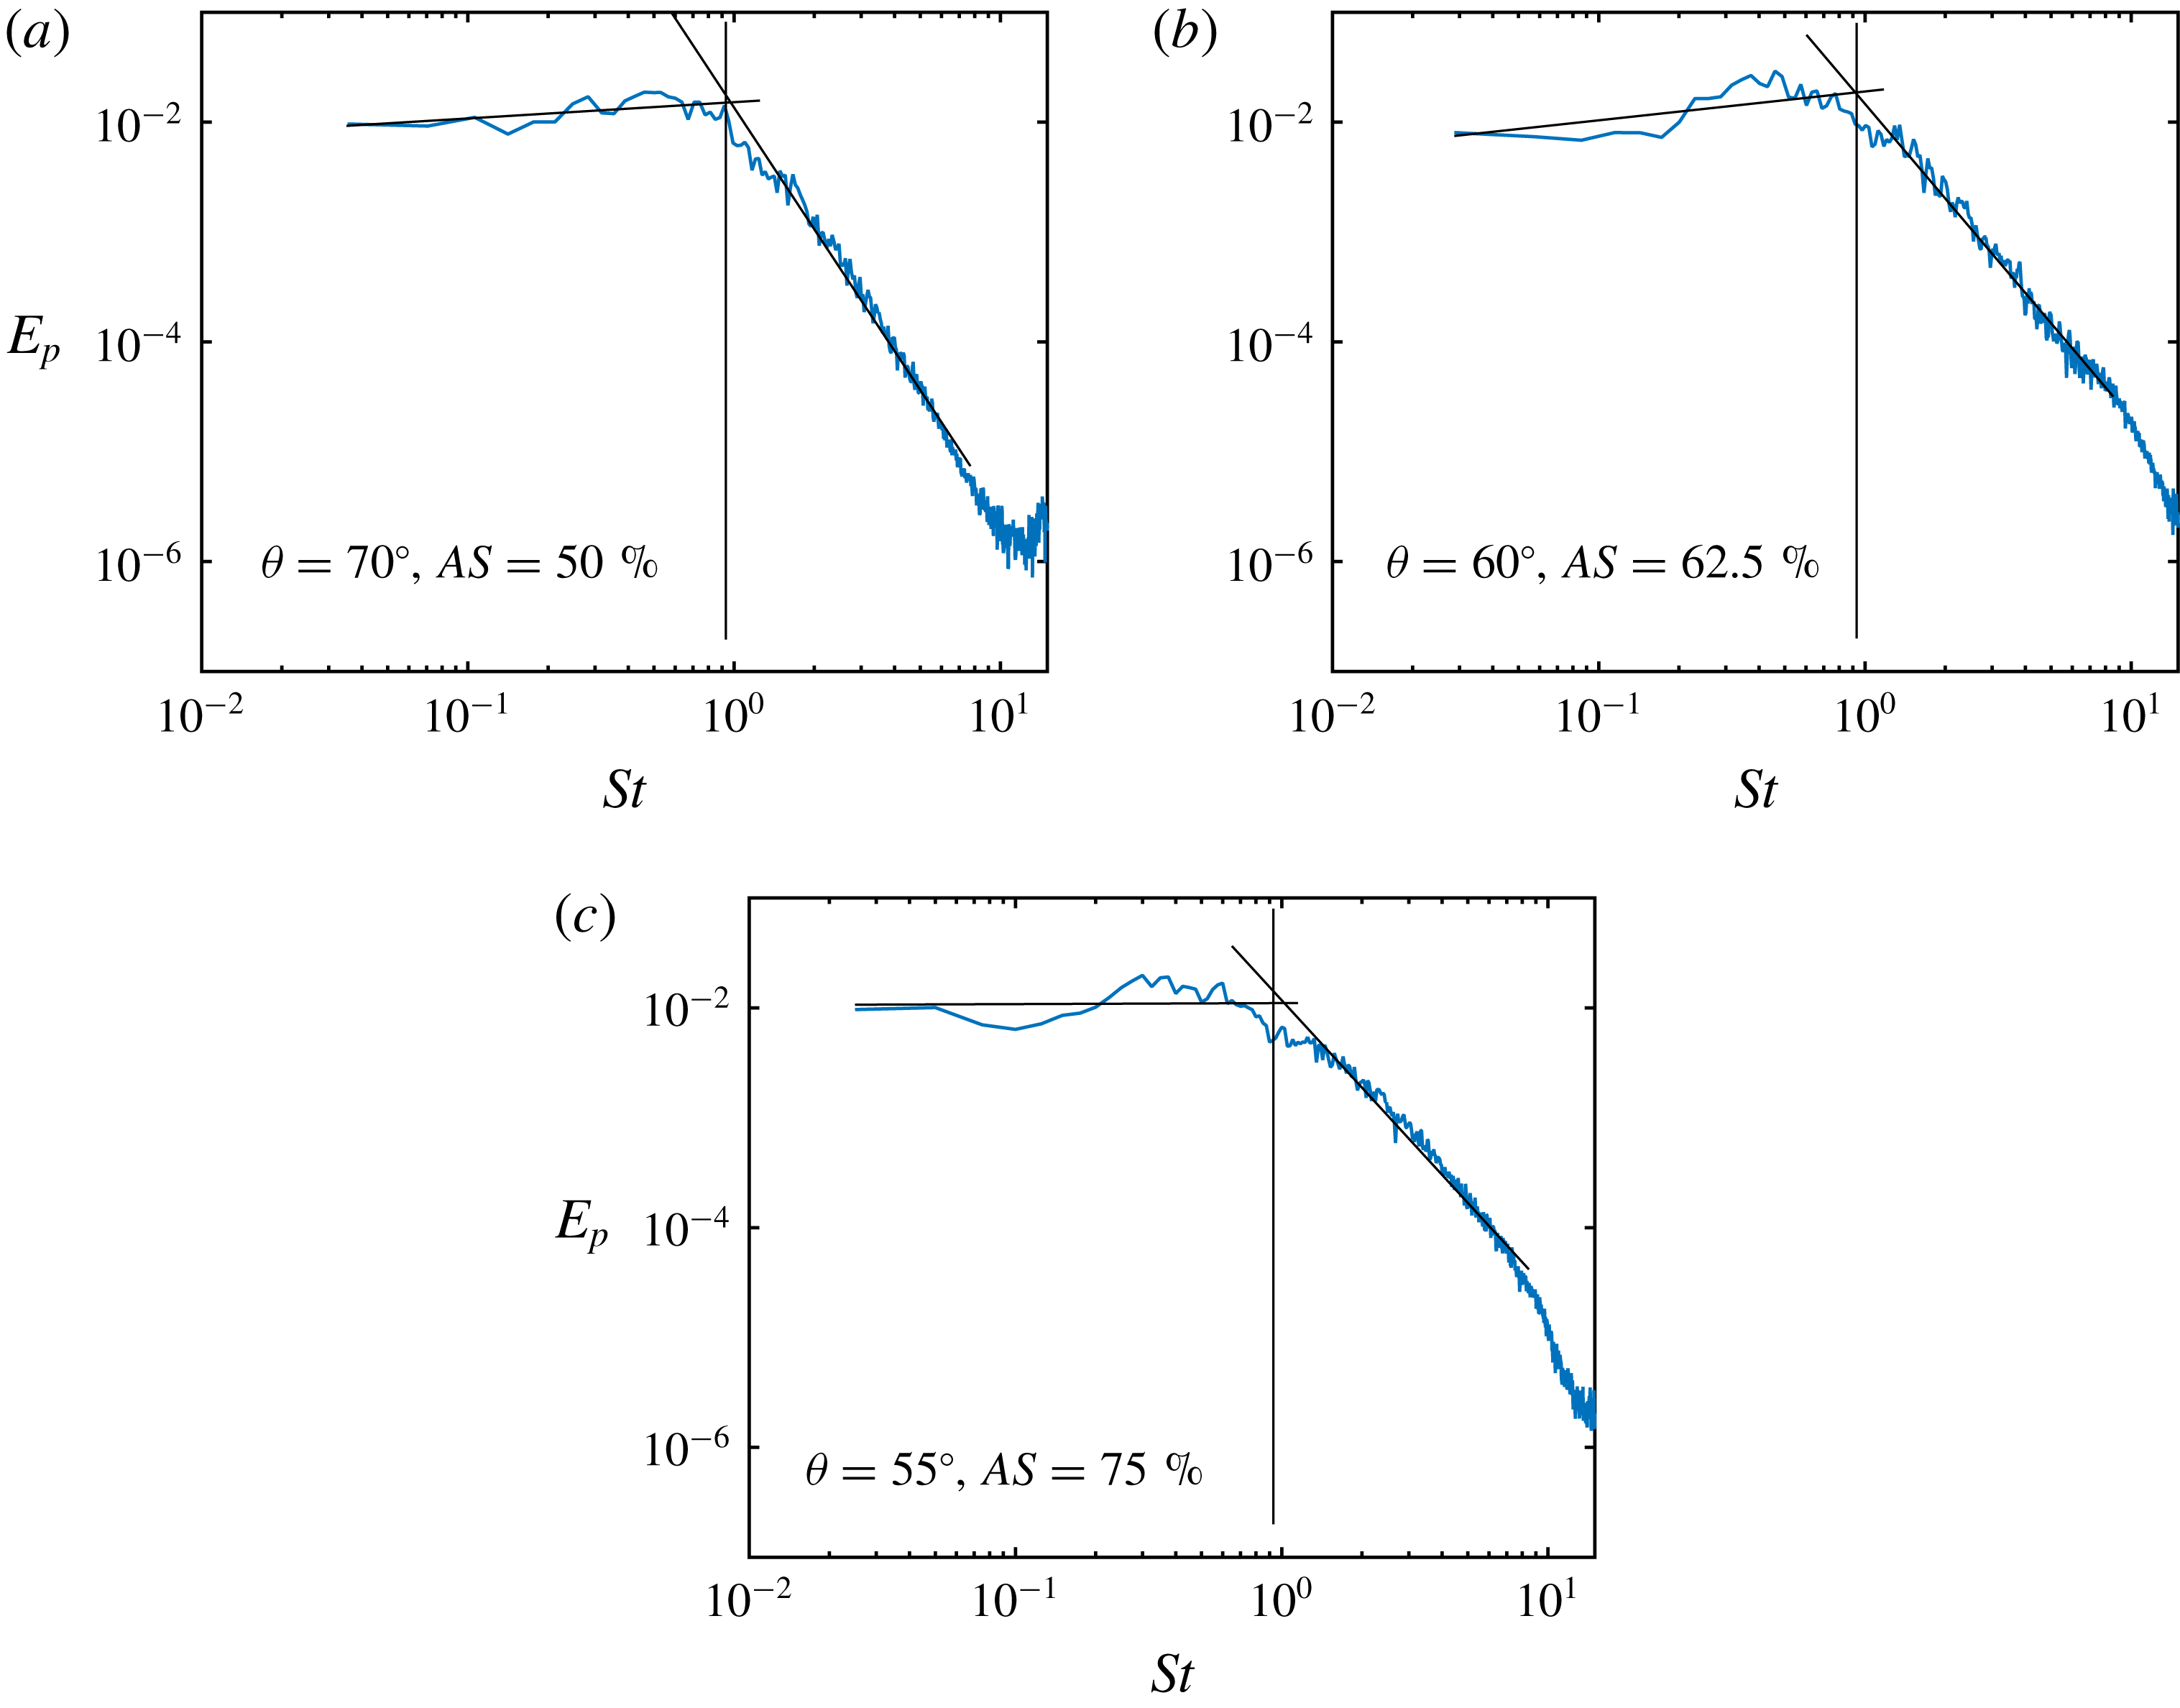
One of the major motivations of this study is to correlate the characteristics of the murmurs, which are generated by the lumenal pressure fluctuations, with the degree of stenosis. Since the severity of the stenosis has a direct impact on the signal strength, researchers have previously examined the scaling of the maximum wall pressure fluctuation, with the intention of finding a universal scaling law that could relate the severity to the fluctuation intensity (Tobin & Chang Reference Tobin and Chang1976; Clark Reference Clark1977; Mittal et al. Reference Mittal, Simmons and Najjar2003). However, this is not an ideal metric in clinical practice since it requires careful calibration of the sensors and the measured signal strength is subject to various extraneous factors such as sensor contact condition, sensitivity and placement, as well as the thoracic anatomy of the patient. On the other hand, the frequency of the murmur signal can be measured with greater confidence as long as it is within the operating range of the sensor. In this section, we will focus on examining the frequency characteristics of the poststenotic flow in the modelled aorta.
Figure 14(a) shows the spectra corresponding to the streamwise velocity perturbation along the geometric centreline of the modelled aorta for the 75 % case. We can see that at the exit of the stenosis (
 $\unicode[STIX]{x1D703}=0^{\circ }$
), the flow is still laminar and has very low fluctuation intensity. As the jet propagates further downstream, the shear layer of the jet exhibits periodic vortex shedding, and the spectrum at
$\unicode[STIX]{x1D703}=0^{\circ }$
), the flow is still laminar and has very low fluctuation intensity. As the jet propagates further downstream, the shear layer of the jet exhibits periodic vortex shedding, and the spectrum at
 $\unicode[STIX]{x1D703}=20^{\circ }$
shows a peak around
$\unicode[STIX]{x1D703}=20^{\circ }$
shows a peak around
 $St=0.93$
. The reason why the peak is not very sharp is that the signal is collected in the core region of the jet instead of the shear layer. This shedding frequency is higher than that of the circular jet reported by other researchers. For instance, Beavers & Wilson (Reference Beavers and Wilson1970) studied the natural shedding frequency of the free circular jet and observed a shedding frequency of around 0.63 over a wide range of Reynolds numbers (500–3000). Similar numbers are also reported in other studies of a poststenotic jet in a confined straight tube (Johansen Reference Johansen1930; Cassanova & Giddens Reference Cassanova and Giddens1978; Ahmed & Giddens Reference Ahmed and Giddens1983b
). The reason for a similar shedding frequency for both free and confined circular jets is that these poststenotic flows are still dominated by the dynamics of the jet. The shear layer surrounding the core of the jet is less affected by the wall immediately after the stenosis, and its stability is still governed by the intrinsic mechanism of the shear layer instability. However, in the current study, even though the jet still maintains a circular shape right after the stenosis, the outer part of the jet impinges the outer wall before the shedding behaviour occurs. The resulting shear layer no longer maintains a circular shape and, hence, the characteristic shedding frequencies from straight tubes are not expected to predict the shedding frequency in this case.
$St=0.93$
. The reason why the peak is not very sharp is that the signal is collected in the core region of the jet instead of the shear layer. This shedding frequency is higher than that of the circular jet reported by other researchers. For instance, Beavers & Wilson (Reference Beavers and Wilson1970) studied the natural shedding frequency of the free circular jet and observed a shedding frequency of around 0.63 over a wide range of Reynolds numbers (500–3000). Similar numbers are also reported in other studies of a poststenotic jet in a confined straight tube (Johansen Reference Johansen1930; Cassanova & Giddens Reference Cassanova and Giddens1978; Ahmed & Giddens Reference Ahmed and Giddens1983b
). The reason for a similar shedding frequency for both free and confined circular jets is that these poststenotic flows are still dominated by the dynamics of the jet. The shear layer surrounding the core of the jet is less affected by the wall immediately after the stenosis, and its stability is still governed by the intrinsic mechanism of the shear layer instability. However, in the current study, even though the jet still maintains a circular shape right after the stenosis, the outer part of the jet impinges the outer wall before the shedding behaviour occurs. The resulting shear layer no longer maintains a circular shape and, hence, the characteristic shedding frequencies from straight tubes are not expected to predict the shedding frequency in this case.

Figure 14. (a) Spectra corresponding to the temporal variation of the velocity plotted at selected
 $\unicode[STIX]{x1D703}$
along the centreline for
$\unicode[STIX]{x1D703}$
along the centreline for
 $AS=75\,\%$
. The vertical line denotes
$AS=75\,\%$
. The vertical line denotes
 $St=0.93$
. (b) Spectra corresponding to the temporal variation of the velocity plotted at selected
$St=0.93$
. (b) Spectra corresponding to the temporal variation of the velocity plotted at selected
 $\unicode[STIX]{x1D703}$
for all three severities. Two turbulent scalings are also plotted to facilitate comparison. Here,
$\unicode[STIX]{x1D703}$
for all three severities. Two turbulent scalings are also plotted to facilitate comparison. Here,
 $E_{k}$
and
$E_{k}$
and
 $St$
are defined as
$St$
are defined as
 $\langle u_{i}^{\prime }u_{i}^{\prime }\rangle /V_{j}^{2}$
and
$\langle u_{i}^{\prime }u_{i}^{\prime }\rangle /V_{j}^{2}$
and
 $fD_{j}/V_{j}$
respectively.
$fD_{j}/V_{j}$
respectively.
Beyond the angle of
 $40^{\circ }$
, the discrete shedding frequency is no longer visible in the spectrum, and the flow starts to transition to turbulence. At
$40^{\circ }$
, the discrete shedding frequency is no longer visible in the spectrum, and the flow starts to transition to turbulence. At
 $75^{\circ }$
, the spectrum corresponding to the velocity fluctuation clearly demonstrates turbulent flow scaling, as shown in figure 14(b). Two other spectra, corresponding to the signals at different locations of the
$75^{\circ }$
, the spectrum corresponding to the velocity fluctuation clearly demonstrates turbulent flow scaling, as shown in figure 14(b). Two other spectra, corresponding to the signals at different locations of the
 $50\,\%$
and
$50\,\%$
and
 $62.5\,\%$
cases, are also plotted in figure 14(b). Both of them show reasonable agreement with the classic scalings (Tennekes & Lumley Reference Tennekes and Lumley1972; Hinze Reference Hinze1975), verifying the existence of turbulence in such flows. It is worth emphasizing that the signals plotted here are collected along the geometric centreline of the aorta. However, it is clearly shown in figure 10 that the locations selected here are not necessarily where turbulence develops first or is the strongest. This can also potentially explain the imperfect scaling of the 50 % case in the high-frequency range, since the TKE shows low intensity along the centreline there.
$62.5\,\%$
cases, are also plotted in figure 14(b). Both of them show reasonable agreement with the classic scalings (Tennekes & Lumley Reference Tennekes and Lumley1972; Hinze Reference Hinze1975), verifying the existence of turbulence in such flows. It is worth emphasizing that the signals plotted here are collected along the geometric centreline of the aorta. However, it is clearly shown in figure 10 that the locations selected here are not necessarily where turbulence develops first or is the strongest. This can also potentially explain the imperfect scaling of the 50 % case in the high-frequency range, since the TKE shows low intensity along the centreline there.

Figure 15. The temporal variation of the non-dimensionalized pressure fluctuation at
 $\unicode[STIX]{x1D703}=35^{\circ }$
for
$\unicode[STIX]{x1D703}=35^{\circ }$
for
 $AS=75\,\%$
. The
$AS=75\,\%$
. The
 $y$
-axis is set to
$y$
-axis is set to
 $[-0.2,0.2]$
to facilitate comparison.
$[-0.2,0.2]$
to facilitate comparison.

Figure 16. Spectra of the pressure fluctuation plotted at selected
 $\unicode[STIX]{x1D703}$
along the centreline for (a) the
$\unicode[STIX]{x1D703}$
along the centreline for (a) the
 $75\,\%$
case and (b) all three cases. The vertical line denotes
$75\,\%$
case and (b) all three cases. The vertical line denotes
 $St=0.93$
. Here,
$St=0.93$
. Here,
 $E_{p}$
and
$E_{p}$
and
 $St$
are defined as
$St$
are defined as
 $\langle p^{\prime }\rangle /(\unicode[STIX]{x1D70C}V_{j}^{2})/2$
and
$\langle p^{\prime }\rangle /(\unicode[STIX]{x1D70C}V_{j}^{2})/2$
and
 $fD_{j}/V_{j}$
respectively.
$fD_{j}/V_{j}$
respectively.
Pressure is of great interest in this study as it is responsible for the generation of the murmurs. In the following discussion, we will first explain the results for 75 % stenosis in detail, and then present the results from the other two cases in comparison with the 75 % case. Figure 15 shows the temporal history of the pressure fluctuations at
 $\unicode[STIX]{x1D703}=35^{\circ }$
for
$\unicode[STIX]{x1D703}=35^{\circ }$
for
 $75\,\%$
stenosis. Even though no clear periodicity can be observed in the signal from the centreline, it will be shown later that periodic vortex shedding is occurring at this location. Figure 16(a) illustrates how the spectrum of the pressure fluctuation evolves along the centreline. The flow is relatively quiescent coming out of the stenosis, and weak pressure fluctuations are observed at
$75\,\%$
stenosis. Even though no clear periodicity can be observed in the signal from the centreline, it will be shown later that periodic vortex shedding is occurring at this location. Figure 16(a) illustrates how the spectrum of the pressure fluctuation evolves along the centreline. The flow is relatively quiescent coming out of the stenosis, and weak pressure fluctuations are observed at
 $\unicode[STIX]{x1D703}=0^{\circ }$
. As the jet propagates downstream, the shear layer becomes unsteady and discrete-frequency vortex shedding with a Strouhal number of 0.93 appears, as shown by the spectrum at
$\unicode[STIX]{x1D703}=0^{\circ }$
. As the jet propagates downstream, the shear layer becomes unsteady and discrete-frequency vortex shedding with a Strouhal number of 0.93 appears, as shown by the spectrum at
 $\unicode[STIX]{x1D703}=20^{\circ }$
. This characteristic frequency is consistent with the value obtained previously from the velocity spectrum. A clear peak at
$\unicode[STIX]{x1D703}=20^{\circ }$
. This characteristic frequency is consistent with the value obtained previously from the velocity spectrum. A clear peak at
 $St=0.93$
can be observed in the pressure spectrum from
$St=0.93$
can be observed in the pressure spectrum from
 $20^{\circ }$
to
$20^{\circ }$
to
 $35^{\circ }$
, indicating a region where the vortex shedding is dominant. As the flow moves downstream, it transitions to turbulence and the aforementioned peak is no longer visible. The spectra of the centreline pressure fluctuation for the 50 % and 62.5 % cases demonstrate similar spatial evolution. In particular, the discrete vortex shedding frequency, when non-dimensionalized by the jet diameter and jet velocity, is around 0.93 for all three cases, as shown in figure 16(b). This specific frequency can be observed from
$35^{\circ }$
, indicating a region where the vortex shedding is dominant. As the flow moves downstream, it transitions to turbulence and the aforementioned peak is no longer visible. The spectra of the centreline pressure fluctuation for the 50 % and 62.5 % cases demonstrate similar spatial evolution. In particular, the discrete vortex shedding frequency, when non-dimensionalized by the jet diameter and jet velocity, is around 0.93 for all three cases, as shown in figure 16(b). This specific frequency can be observed from
 $20^{\circ }$
to
$20^{\circ }$
to
 $55^{\circ }$
for
$55^{\circ }$
for
 $AS=50\,\%$
, and from
$AS=50\,\%$
, and from
 $25^{\circ }$
to
$25^{\circ }$
to
 $40^{\circ }$
for
$40^{\circ }$
for
 $AS=62.5\,\%$
. It is noted that the vortex shedding develops around the same angle for all three cases. However, as the jet intensity increases with the severity of the stenosis, the location of the transition to turbulence moves upstream, leading to an early disappearance of the corresponding peak in the spectrum. Nevertheless, as will be shown later, the absence of this peak does not indicate a lack of contribution from the periodic vortex shedding to the flow in this region.
$AS=62.5\,\%$
. It is noted that the vortex shedding develops around the same angle for all three cases. However, as the jet intensity increases with the severity of the stenosis, the location of the transition to turbulence moves upstream, leading to an early disappearance of the corresponding peak in the spectrum. Nevertheless, as will be shown later, the absence of this peak does not indicate a lack of contribution from the periodic vortex shedding to the flow in this region.

Figure 17. (a) Spectra of the pressure fluctuation plotted at selected
 $\unicode[STIX]{x1D703}$
along the anterior surface for
$\unicode[STIX]{x1D703}$
along the anterior surface for
 $AS=75\,\%$
. (b) Replot of the spectrum of the pressure fluctuation at
$AS=75\,\%$
. (b) Replot of the spectrum of the pressure fluctuation at
 $\unicode[STIX]{x1D703}=40^{\circ }$
along with a linear curve fitting whose details can be found in table 1. The vertical line denotes
$\unicode[STIX]{x1D703}=40^{\circ }$
along with a linear curve fitting whose details can be found in table 1. The vertical line denotes
 $St=0.93$
.
$St=0.93$
.
The surface pressure fluctuations are directly relevant to the generation of murmurs, and, in figure 17(a), we plot the spectra of the pressure fluctuation on the anterior surface at the same angles as in figure 16(a). It is immediately apparent that there is no clear peak at
 $\unicode[STIX]{x1D703}=20^{\circ }$
, but, interestingly, the slope of the spectra at
$\unicode[STIX]{x1D703}=20^{\circ }$
, but, interestingly, the slope of the spectra at
 $\unicode[STIX]{x1D703}=40^{\circ }$
seems to change significantly across
$\unicode[STIX]{x1D703}=40^{\circ }$
seems to change significantly across
 $St=0.93$
. This change of slope has been observed in previous experimental (Tobin & Chang Reference Tobin and Chang1976) and numerical (Seo & Mittal Reference Seo and Mittal2012) studies. The frequency at which the slope changes, usually called the ‘break frequency’ or ‘corner frequency’, has been identified as an important metric in electronic auscultation-based determination of the degree of stenosis (Duncan et al.
Reference Duncan, Gruber, Dewey, Myers and Lees1975).
$St=0.93$
. This change of slope has been observed in previous experimental (Tobin & Chang Reference Tobin and Chang1976) and numerical (Seo & Mittal Reference Seo and Mittal2012) studies. The frequency at which the slope changes, usually called the ‘break frequency’ or ‘corner frequency’, has been identified as an important metric in electronic auscultation-based determination of the degree of stenosis (Duncan et al.
Reference Duncan, Gruber, Dewey, Myers and Lees1975).
Using a piecewise linear regression, we have obtained the best fit lines of each side of the observed break frequency,
 $\tilde{f}_{bc}$
, as shown in figure 17(b). Here, the intersection of these two linear regressions gives the break frequency (
$\tilde{f}_{bc}$
, as shown in figure 17(b). Here, the intersection of these two linear regressions gives the break frequency (
 $f_{bc}$
), and the difference between
$f_{bc}$
), and the difference between
 $f_{bc}$
and
$f_{bc}$
and
 $\tilde{f}_{bc}$
indicates the quality of the approximation. From table 1, we can see that, for figure 17(b), the observed break frequency, which is also the shedding frequency of the shear layer, is sufficiently close to
$\tilde{f}_{bc}$
indicates the quality of the approximation. From table 1, we can see that, for figure 17(b), the observed break frequency, which is also the shedding frequency of the shear layer, is sufficiently close to
 $f_{bc}$
. This means that even though no distinct peak from vortex shedding is present in the spectrum, the break frequency shows a significant contribution from the discrete vortex shedding to the pressure fluctuation.
$f_{bc}$
. This means that even though no distinct peak from vortex shedding is present in the spectrum, the break frequency shows a significant contribution from the discrete vortex shedding to the pressure fluctuation.
Table 1. Details of the least-squares-based linear curve fitting. Here,
 $\tilde{f}_{bc}$
is the observed break frequency and
$\tilde{f}_{bc}$
is the observed break frequency and
 $f_{bc}$
is the break frequency calculated from the linear regression.
$f_{bc}$
is the break frequency calculated from the linear regression.


It is also useful to study the break frequency in the surface region identified as the primary source for the murmurs. Figures 18(a)–18(c) plot the spectra of pressure fluctuation at the source locations identified in figure 13(a) along with the linear curve fit, and
 $f_{bc}$
are determined to be sufficiently close to 0.93 for
$f_{bc}$
are determined to be sufficiently close to 0.93 for
 $AS=50\,\%$
and
$AS=50\,\%$
and
 $62.5\,\%$
, indicating the significant contribution from the shear layer vortex shedding. On the other hand,
$62.5\,\%$
, indicating the significant contribution from the shear layer vortex shedding. On the other hand,
 $f_{bc}$
deviates slightly but noticeably away from this frequency for
$f_{bc}$
deviates slightly but noticeably away from this frequency for
 $AS=75\,\%$
, and this could be due to several reasons. First of all, the smaller jet size means that the vortex shedding occurs closer to the geometric centreline of the modelled aorta, and away from the anterior surface, making the frequency harder to transmit to the surface. Moreover, the strong jet is also likely to induce stronger turbulence, and increase the relative contribution of stochastic turbulent fluctuation to the wall pressure fluctuation.
$AS=75\,\%$
, and this could be due to several reasons. First of all, the smaller jet size means that the vortex shedding occurs closer to the geometric centreline of the modelled aorta, and away from the anterior surface, making the frequency harder to transmit to the surface. Moreover, the strong jet is also likely to induce stronger turbulence, and increase the relative contribution of stochastic turbulent fluctuation to the wall pressure fluctuation.
Combination of the results in table 1 and figure 10 provides additional insight into the mechanism for murmur generation. Previous analysis shows that the location of strong wall pressure fluctuations is spatially well correlated with the location of intense turbulent fluctuations. However, the study of break frequency reveals that the total pressure fluctuations also contain contributions from the shear layer vortex shedding from upstream. In clinical practice, a 75 % area reduction is at the threshold between a mild and a severe stenosis. Severe stenosis causes noticeable symptoms in the patient and is therefore easy to detect. Mild stenosis, on the other hand, is asymptomatic and thus harder to detect. The spectral analysis shows that, for mild stenosis, the discrete-frequency shear layer shedding frequency is also the break frequency of the murmur source, and can potentially be sensed on the epidermal surface. Thus, auscultation may be a promising tool for detection and screening of early-stage aortic stenosis.
4 Summary
Direct numerical simulations of steady flow in a modelled stenosed aorta have been conducted. Three different degrees of stenosis,
 $AS=50\%,62.5\,\%$
and
$AS=50\%,62.5\,\%$
and
 $75\,\%$
, were studied and the Reynolds number based on the inlet velocity and diameter was fixed at 2000. Compared with previous experimental studies (Clark Reference Clark1976a
,Reference Clark
b
,Reference Clark
c
; Ahmed & Giddens Reference Ahmed and Giddens1983a
,Reference Ahmed and Giddens
b
) and numerical studies (Mittal et al.
Reference Mittal, Simmons and Udaykumar2001, Reference Mittal, Simmons and Najjar2003; Varghese Reference Varghese2003; Sherwin & Blackburn Reference Sherwin and Blackburn2005; Varghese et al.
Reference Varghese, Frankel and Fischer2007a
,Reference Varghese, Frankel and Fischer
b
), the major difference here is that the aortic arch is included as a curved pipe with a
$75\,\%$
, were studied and the Reynolds number based on the inlet velocity and diameter was fixed at 2000. Compared with previous experimental studies (Clark Reference Clark1976a
,Reference Clark
b
,Reference Clark
c
; Ahmed & Giddens Reference Ahmed and Giddens1983a
,Reference Ahmed and Giddens
b
) and numerical studies (Mittal et al.
Reference Mittal, Simmons and Udaykumar2001, Reference Mittal, Simmons and Najjar2003; Varghese Reference Varghese2003; Sherwin & Blackburn Reference Sherwin and Blackburn2005; Varghese et al.
Reference Varghese, Frankel and Fischer2007a
,Reference Varghese, Frankel and Fischer
b
), the major difference here is that the aortic arch is included as a curved pipe with a
 $180^{\circ }$
turn. The inclusion of this curvature induces strong secondary flows including Dean vortices in the aortic jet, which originate in the ascending area and persist all the way into the aortic arch.
$180^{\circ }$
turn. The inclusion of this curvature induces strong secondary flows including Dean vortices in the aortic jet, which originate in the ascending area and persist all the way into the aortic arch.
The current study is particularly focused on the implication of the flow dynamics on the generation and detection of the associated heart murmurs. The murmur source is identified as the location on the anterior aortic lumen with maximum wall pressure fluctuations. A key finding of the current study is that in all of the cases studied here, this source is spatially approximately
 $2.1D$
downstream from the aortic-valve area. Thus, the sound source is not co-located with the underlying pathology, and this has implications for the detection of this disease via automated source localization. The source location is also found to be relatively insensitive to the severity of the stenosis. This is because, unlike stenoses in straight tubes, where the source location is determined by the natural instability of the shear layers, the murmur source here includes significant contributions not only from the intrinsic instability of the aortic jet but, more importantly, from the unsteadiness associated with the secondary flows induced by the aortic curvature.
$2.1D$
downstream from the aortic-valve area. Thus, the sound source is not co-located with the underlying pathology, and this has implications for the detection of this disease via automated source localization. The source location is also found to be relatively insensitive to the severity of the stenosis. This is because, unlike stenoses in straight tubes, where the source location is determined by the natural instability of the shear layers, the murmur source here includes significant contributions not only from the intrinsic instability of the aortic jet but, more importantly, from the unsteadiness associated with the secondary flows induced by the aortic curvature.
Inspection of the spectra of the pressure fluctuations reveals that the poststenotic jet in all of the cases exhibits a distinct frequency due to the shear layer vortex formation, and this characteristic shedding frequency, when non-dimensionalized by the jet diameter and jet velocity, is around 0.93 for all three cases. This frequency is also identifiable in the wall pressure spectra at the source location in the form of a break frequency for all three cases.
The identifications of the source location and the spectral characteristics are particularly relevant for automated auscultation-based diagnosis. First, the lack of dependence between the source location and the severity of the stenosis hints that source localization algorithms can potentially be used to distinguish aortic stenosis from other heart conditions that generate systolic murmurs such as tricuspid insufficiency, the murmurs of which are expected to be best detected around the lower left sternal border (Bickley & Szilagyi Reference Bickley and Szilagyi2012). Second, the break frequency provides a universal scaling for cases with different degrees of stenosis. However, it is important to emphasize that this frequency is measured at the source location, while the final murmur signal is measured on the skin surface. It is known that the human thorax is highly inhomogeneous, and it is as yet unknown whether this break frequency is identifiable in the spectrum of the murmurs that are detected on the skin surface. We are currently investigating how the propagation of the acoustic waves through the thorax affects the murmur spectrum.
Acknowledgements
The authors would like to acknowledge the financial support from NSF grants IIS-1344772 and CBET-1511200, and computational resources from XSEDE TACC-Stampede through NSF grant TG-CTS100002 and the Maryland Advanced Research Computing Center (MARCC).
Appendix A
The stenosis has the following prescribed shape:
 $$\begin{eqnarray}\displaystyle \left.\begin{array}{@{}c@{}}r(z)={\displaystyle \frac{D}{2}}\left\{1-{\displaystyle \frac{D-D_{j}}{D}}{\displaystyle \frac{\exp (-a(z-z_{0}))\sin [\unicode[STIX]{x03C0}(z-z_{0})/L_{s}]}{\exp (-aL_{p})\sin (\unicode[STIX]{x03C0}L_{p}/L_{s})}}\right\},\\[12.0pt] a={\displaystyle \frac{\unicode[STIX]{x03C0}}{L_{s}\tan (\unicode[STIX]{x03C0}L_{p}/L_{s})}},\end{array}\!\right\} & & \displaystyle\end{eqnarray}$$
where
 $D_{j}$
is the minimum diameter of the constriction (jet diameter),
$D_{j}$
is the minimum diameter of the constriction (jet diameter),
 $z_{0}$
marks the starting location of the stenosis in the
$z_{0}$
marks the starting location of the stenosis in the
 $z$
direction,
$z$
direction,
 $L_{s}$
is the length of the stenosis and
$L_{s}$
is the length of the stenosis and
 $L_{p}$
measures the distance between the starting point of the constriction and the location with the minimum diameter. Here,
$L_{p}$
measures the distance between the starting point of the constriction and the location with the minimum diameter. Here,
 $L_{s}$
and
$L_{s}$
and
 $L_{p}$
are set to
$L_{p}$
are set to
 $1D$
and
$1D$
and
 $0.8D$
respectively.
$0.8D$
respectively.
Appendix B
The flow in this study is resolved using the DNS. It is therefore important to establish that the mesh employed is able to capture all of the relevant scales. The grid convergence study is conducted on the 75 % stenosis case, since it is expected to generate the jet with the highest intensity. Three different meshes, coarse (
 $96\times 288\times 278$
), baseline (
$96\times 288\times 278$
), baseline (
 $128\times 384\times 370$
) and fine (
$128\times 384\times 370$
) and fine (
 $128\times 640\times 576$
), are used to solve the same problem. The ratios of average computational cell volume between different meshes are
$128\times 640\times 576$
), are used to solve the same problem. The ratios of average computational cell volume between different meshes are
 $V_{baseline}/V_{coarse}\approx 2.37$
and
$V_{baseline}/V_{coarse}\approx 2.37$
and
 $V_{fine}/V_{baseline}\approx 2.59$
. Data over 2.5 flow-through times are collected and analysed.
$V_{fine}/V_{baseline}\approx 2.59$
. Data over 2.5 flow-through times are collected and analysed.

Figure 19. (a) Non-dimensionalized mean streamwise velocity and (b) non-dimensionalized RMS of streamwise velocity plotted at
 $\unicode[STIX]{x1D703}=45^{\circ },~90^{\circ },~135^{\circ }$
and
$\unicode[STIX]{x1D703}=45^{\circ },~90^{\circ },~135^{\circ }$
and
 $180^{\circ }$
on the frontal plane. In (a), unit velocity corresponds to
$180^{\circ }$
on the frontal plane. In (a), unit velocity corresponds to
 $0.25D$
, and in (b), unit velocity corresponds to
$0.25D$
, and in (b), unit velocity corresponds to
 $D$
.
$D$
.

Figure 20. The non-dimensionalized TKE averaged over the cross-sectional area and plotted against the angle,
 $\unicode[STIX]{x1D703}$
.
$\unicode[STIX]{x1D703}$
.

Figure 21. (a) Non-dimensionalized RMS of pressure and (b) non-dimensionalized RMS of WSS plotted along the anterior surface.
Figure 19 shows the comparison of the mean streamwise velocity and the RMS of the streamwise velocity obtained from the aforementioned three meshes. The velocities are plotted along the pipe diameter at
 $\unicode[STIX]{x1D703}=45^{\circ },~90^{\circ },~135^{\circ }$
and
$\unicode[STIX]{x1D703}=45^{\circ },~90^{\circ },~135^{\circ }$
and
 $180^{\circ }$
on the frontal plane. One can see that the velocity profiles for the three meshes are quite close to one another at these selected locations. In figure 20, we show the distribution of the cross-sectional averaged TKE along the aortic arch. It is noted that the results from the baseline and fine meshes agree reasonably well, while the result from the coarse mesh deviates from the others significantly. Apart from the flow properties inside the modelled aorta, we are also highly interested in the surface force distribution. Thus, the wall pressure fluctuation and the WSS fluctuation along the monitor points on the anterior surface from the different meshes are plotted in figure 21. We note that the results of the baseline and fine meshes match well. Table 2 lists the percentage of difference of the same variables in figures 20 and 21 with regard to the results from the fine mesh, and the definition is
$180^{\circ }$
on the frontal plane. One can see that the velocity profiles for the three meshes are quite close to one another at these selected locations. In figure 20, we show the distribution of the cross-sectional averaged TKE along the aortic arch. It is noted that the results from the baseline and fine meshes agree reasonably well, while the result from the coarse mesh deviates from the others significantly. Apart from the flow properties inside the modelled aorta, we are also highly interested in the surface force distribution. Thus, the wall pressure fluctuation and the WSS fluctuation along the monitor points on the anterior surface from the different meshes are plotted in figure 21. We note that the results of the baseline and fine meshes match well. Table 2 lists the percentage of difference of the same variables in figures 20 and 21 with regard to the results from the fine mesh, and the definition is
Table 2. Percentage of error with regard to the fine mesh.

 $$\begin{eqnarray}\displaystyle & \displaystyle E(f)={\displaystyle \frac{\sqrt{{\displaystyle \frac{1}{\unicode[STIX]{x03C0}}}\displaystyle \int _{0}^{\unicode[STIX]{x03C0}}(f-f_{fine})^{2}\,\text{d}\unicode[STIX]{x1D703}}}{f_{fine,max}}}, & \displaystyle\end{eqnarray}$$
where
 $f$
represents the value from the coarse mesh or the baseline mesh. The results from the baseline case are reasonably close to those from the fine mesh, while the results from the coarse mesh deviate noticeably. Based on this grid convergence study, we employ the baseline mesh (
$f$
represents the value from the coarse mesh or the baseline mesh. The results from the baseline case are reasonably close to those from the fine mesh, while the results from the coarse mesh deviate noticeably. Based on this grid convergence study, we employ the baseline mesh (
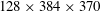 $128\times 384\times 370$
) for all of the simulations.
$128\times 384\times 370$
) for all of the simulations.