


1. Introduction
The drying of multi-component droplets by various physical/chemical processes is an effective method of manufacturing solid particles. The underlying physical/chemical processes related to drying control the shape, size, chemical surface composition, porosity and physical properties like density and hardness (Ré Reference Ré2006; Barbosa & Teixeira Reference Barbosa and Teixeira2017). These physical, chemical and textural properties have a significant effect on required functional solid properties like reactivity, flowability or wettability (Ré Reference Ré2006; Munoz-Ibanez et al. Reference Munoz-Ibanez, Nuzzo, Turchiuli, Bergenståhl, Dumoulin and Millqvist-Fureby2016) and have implications for applications such as pharmaceuticals (Vehring Reference Vehring2008), development of new materials (Iskandar Reference Iskandar2009), food (Paudel et al. Reference Paudel, Worku, Meeus, Guns and Van den Mooter2013), catalysis (Balgis et al. Reference Balgis, Anilkumar, Sago, Ogi and Okuyama2012) and other fields (Thaker et al. Reference Thaker, Mahanwar, Patil and Thorat2010; Pal et al. Reference Pal2016; Stunda-Zujeva, Irbe & Berzina-Cimdina Reference Stunda-Zujeva, Irbe and Berzina-Cimdina2017). On the other hand, efficient atomization of multi-component liquids (such as polymers and emulsions) is a key process in a broad range of industrial applications, such as ink-jet printing, spray painting and coating, spray combustors and irrigation (Eggers & Villermaux Reference Eggers and Villermaux2008; Rao & Karmakar Reference Rao and Karmakar2018).
Aqueous polymeric solutions are one of the classes of multi-component solutions utilized in spray drying applications (Fu, Woo & Chen Reference Fu, Woo and Chen2012; Har et al. Reference Har, Fu, Chan, Tey and Chen2017). Polymeric droplets have a multitude of applications ranging from targeted drug delivery, thin films and coatings to surface patterning (Wilms Reference Wilms2005; Pathak & Basu Reference Pathak and Basu2016a; Zhu et al. Reference Zhu, Ong, Chong, Yao, Huang and Duan2019). Understanding the kinetics and dynamics of evaporating polymeric droplets, impacting polymeric droplets and polymeric droplets subjected to high-speed airflow is crucial. The evaporation of polymeric droplets involves a complex set of events such as solvent evaporation, the build-up of surface concentration and precipitate formation (Littringer et al. Reference Littringer, Mescher, Eckhard, Schröttner, Langes, Fries, Griesser, Walzel and Urbanetz2012; Al Zaitone et al. Reference Al Zaitone, Al-Zahrani, Al-Shahrani and Lamprecht2020). Depending on the initial concentration of polymer and evaporation rate of the solvent, accumulation of surface concentration aids in forming a gel-type layer around the droplet periphery, also called a skin layer (Pauchard & Allain Reference Pauchard and Allain2003b,Reference Pauchard and Allainc; Okuzono, Ozawa & Doi Reference Okuzono, Ozawa and Doi2006). Based on the properties of the polymer and drying kinetics of the droplets, the final morphology of polymer residue can be in the form of a wrinkled pattern (Pauchard & Allain Reference Pauchard and Allain2003b), buckled structure (Pauchard & Allain Reference Pauchard and Allain2003c), smooth solid precipitate (Raghuram et al. Reference Raghuram, Bansal, Basu and Kumar2021) or ring pattern (Raghuram et al. Reference Raghuram, Bansal, Basu and Kumar2021).
Investigations on the evaporating polymeric droplet have been performed in a contact environment (hydrophilic substrates) under natural drying conditions (Pauchard & Allain Reference Pauchard and Allain2003a; Baldwin et al. Reference Baldwin, Granjard, Willmer, Sefiane and Fairhurst2011, Reference Baldwin, Roest, Fairhurst, Sefiane and Shanahan2012; Baldwin & Fairhurst Reference Baldwin and Fairhurst2014; Mamalis et al. Reference Mamalis, Koutsos, Sefiane, Kagkoura, Kalloudis and Shanahan2015). Pauchard & Allain (Reference Pauchard and Allain2003a) revealed the formation of glassy skin near the vapour/drop interface in evaporating sessile droplets. They demonstrated that the skin layer bends as the enclosed liquid volume decreases, leading to buckling instability in the droplet. Depending on the experimental conditions, different shape instabilities from buckled structure to a wrinkled pattern on the droplet surface have been reported. Baldwin & Fairhurst (Reference Baldwin and Fairhurst2014), Baldwin et al. (Reference Baldwin, Granjard, Willmer, Sefiane and Fairhurst2011, Reference Baldwin, Roest, Fairhurst, Sefiane and Shanahan2012) and Mamalis et al. (Reference Mamalis, Koutsos, Sefiane, Kagkoura, Kalloudis and Shanahan2015) explored the influence of molecular weight and concentration on final deposit formation. Due to the diffusive flux and the advective polymer build-up near the three-phase contact line, pillars and puddle-like deposits on glass surfaces have been observed.
Several studies have also been performed on the atomization of polymeric droplets. Joseph, Belanger & Beavers (Reference Joseph, Belanger and Beavers1999) studied the breakup of millimetre-sized polymeric droplets in a high-speed airstream behind a shock wave in a shock tube. They observed the bag and the bag-and-stamen breakup of the polymeric droplet at high Weber numbers  ${\sim} O({10^4}{-} {10^5})$. Theofanous, Mitkin & Ng (Reference Theofanous, Mitkin and Ng2013) also studied the dynamics of a wide range of polymeric fluid droplets under high-speed airflow using a shock tube set-up. Based on the range of inertial force the polymeric drop is subjected to, drop deformation and breakup were categorized into three modes. At low inertial force, Rayleigh–Taylor piercing (first criticality) of the droplet prevails. It changes to shear-induced entrainment (second criticality) and shear-induced entrainment with rupture (third criticality) at medium and higher inertial forces. In addition to aerodynamic breakup, a significant number of studies have also been conducted on the impact dynamics of aqueous polymeric droplets on normal and heated substrates (German & Bertola Reference German and Bertola2009; Bertola Reference Bertola2010, Reference Bertola2013; Soltani-Kordshuli & Eslamian Reference Soltani-Kordshuli and Eslamian2017; Chen et al. Reference Chen, Wang, Peng, Zhu and Zhang2018; Brian & Eslamian Reference Brian and Eslamian2019; Brian et al. Reference Brian, Ahmadian-Yazdi, Barratt and Eslamian2019). In particular, Bertola (Reference Bertola2014) studied the impact dynamics of dilute aqueous polymeric droplets on heated substrates. It was shown that, depending on the impact velocity and concentration of the polymer, the droplet undergoes a morphological transition to sheet formation, retraction and folding of the sheet, or rebounding of the droplet. In another study, Li, Chen & Joo (Reference Li, Chen and Joo2021) compared the impact dynamics of Newtonian and viscoelastic droplets on heated surfaces at low Weber numbers. Based on the substrate temperature and Weber number, the following final morphological transitions of an impacted polymeric droplet are observed: deposition, foaming, bounce with foaming and rebound with filaments. Similarly, to understand the influence of polymer concentration and molecular weight, Huh et al. (Reference Huh, Jung, Seo and Lee2015) explored the impact dynamics of polymeric droplets on hydrophobic surfaces and observed anti-rebound and vigorous droplet bouncing based on the Weber number.
Although several studies have been conducted to understand the dynamics of polymeric droplets subjected to high-speed airflow, evaporating and impacting polymeric droplets on substrates, the literature lacks any study on the evaporation of isolated polymeric droplets. In general, the evaporation of droplets is investigated either through intrusive techniques (by suspending the droplet on a thin fibre or thermocouple) (Califano, Calabria & Massoli Reference Califano, Calabria and Massoli2014; Mura et al. Reference Mura, Calabria, Califano, Massoli and Bellettre2014) or by low non-intrusive methods (such as the freely falling approach under microgravity conditions) (Kimura et al. Reference Kimura, Ihara, Okajima and Iwama1986; Jackson & Avedisian Reference Jackson and Avedisian1998; Segawa et al. Reference Segawa, Yamasaki, Kadota, Tanaka, Enomoto and Tsue2000). In the case of intrusive methods, the experiment is affected by the interaction of fibre or thermocouple with the droplet. This interaction could result in unwanted heterogeneous nucleation sites as the drop is subjected to heating from the fibre/thermocouple (Mura et al. Reference Mura, Calabria, Califano, Massoli and Bellettre2014). Due to the intricacies of the free-falling method, it is challenging to obtain qualitative data about processes such as the small-scale instabilities during the evaporation process. In contrast, the contact-free and relatively simplistic methodology of acoustic levitation (Saha et al. Reference Saha, Basu, Suryanarayana and Kumar2010; Saha, Basu & Kumar Reference Saha, Basu and Kumar2012; Avila & Ohl Reference Avila and Ohl2016; Pathak & Basu Reference Pathak and Basu2016b), along with its uncomplicated experimental apparatus, allows one to capture short spatio-temporal instabilities and phenomena such as Rayleigh–Taylor instability and capillary wave propagation with reduced difficulty (Avila & Ohl Reference Avila and Ohl2016; Rao & Basu Reference Rao and Basu2020a; Rao, Singh & Basu Reference Rao, Singh and Basu2021).
Nevertheless, the dynamics of multi-component and emulsion droplets under external heating is extensively reported across various experimental configurations (Lasheras, Kennedy & Dryer Reference Lasheras, Kennedy and Dryer1981; Chung & Kim Reference Chung and Kim1991; Jackson & Avedisian Reference Jackson and Avedisian1998; Mura et al. Reference Mura, Josset, Loubar, Huchet and Bellettre2010; Rao, Karmakar & Basu Reference Rao, Karmakar and Basu2018) and numerical simulations (Shinjo & Xia Reference Shinjo and Xia2017; Sazhin et al. Reference Sazhin, Rybdylova, Crua, Heikal, Ismael, Nissar and Aziz2019; Tanimoto & Shinjo Reference Tanimoto and Shinjo2019). In the context of the levitated environment, Rao & Basu (Reference Rao and Basu2020a,Reference Rao and Basub) investigated the dynamics of levitated emulsion droplets under external radiative heating. Depending on the onset of vapour bubble nucleation, the droplet breakup is categorized into three types: break up through bubble growth, sheet break up and catastrophic breakup. It is also shown that the spectra of secondary droplets produced depend on the mode of droplet breakup. In the case of nanoparticle-laden droplets, Pathak & Basu (Reference Pathak and Basu2016b) studied how nanoparticles could affect the fuel droplets’ dynamics under external radiative heating. During evaporation, the nanoparticles accumulate through orthokinetic aggregation and act as nucleation sites leading to heterogeneous boiling inside the droplet and subsequent breakup of parent droplets.
Despite several studies on distinct multi-component liquid droplets, the literature lacks any study exploring the evaporation and subsequent breakup characteristics of polymeric droplets in an isolated environment through external heating. The current work investigates the evaporation of various concentrations of acoustically levitated aqueous Polyacrylamide (PAM) polymeroc droplets using a continuous laser. Polyacrylamide is one of the most widely used and technically important water-soluble polymers and the solutions are stable over long periods (Kulicke, Kniewske & Klein Reference Kulicke, Kniewske and Klein1982). Polyacrylamide solutions have a wide range of industrial applications such as oil and gas extraction, water treatment, soil erosion and conditioning (Xiong et al. Reference Xiong, Loss, Shields, Pawlik, Hochreiter, Zydney and Kumar2018). Polyacrylamide is also being considered as a bio-material (Yang Reference Yang2008). The initial concentration of the PAM is varied from different regimes of concentration ranging from semi-dilute to semi-dilute entangled. The primary objective of the present study is to decipher the effect of irradiation intensity and polymer concentration on the droplet evaporation process and the resulting bubble dynamics and atomization characteristics. To the best of our knowledge, this is the first study confirming the observation of bubble growth, rupture of bubble/membrane and droplet breakup in evaporating polymeric droplets. Note that the theoretical underpinning of the current work is based on the scaling obtained from the governing physical laws. The motivation of the theoretical framework was to provide the appropriate scales for various physical quantities observed during the experiments. The exact analytical or numerical solutions of the coupled governing equations of momentum, heat and mass transfer were outside the scope of the present study.
This paper is organized as follows. Section 2 provides the details of materials and methods, which involve polymer solution preparation and its properties (§ 2.1), experimental methodology (§ 2.2) and non-dimensional parameters (§ 2.3). The results and discussion involve global observations (§ 3.1), evaporation (§ 3.2), bubble-induced membrane growth, its rupture (§ 3.3) and droplet breakup (§ 3.4). The conclusions of the present study are provided in § 4.
2. Materials and methods
2.1. Polymer solution preparation and its nature
Various concentrations of PAM (Hi Media-GRM 2398) solutions ranging from 0.2 to 5 % (w/w) of molecular weight  $({M_W})$ of 5 × 10⁶ g mol−1 are prepared by dissolving PAM powder in deionized water. The PAM solutions are stirred at 300 r.p.m. for 3 h to ensure proper mixing. To confirm the shear-thinning nature of PAM, rheological tests are performed on a rheometer (Anton Paar, MCR302) with a cone and plate geometry. The diameter and angle of the cone–plate are 40 mm and 1°, respectively. The variation of viscosity of polymer solution with shear rate is shown in supplementary figure S1 available at https://doi.org/10.1017/jfm.2022.894.
2.2. Experimental methodology
Figure 1 depicts the experimental set-up used in the current study. The droplets of PAM solutions comprising different concentrations are levitated using a single axis acoustic levitator (Tec5) with 100 kHz frequency. The size of the droplets used in the current study is in the range of 850 ± 50 μm. The droplets are externally heated with a tuneable continuous CO2 laser (Synrad 48, wavelength ~10.6 μm, max power (Pmax) ~10 W) with a beam diameter of 3.5 mm. A high-speed camera (Photron SA5) and a high-speed laser for illumination (CAVILUX® Smart UHS, 640 nm) are used to capture the droplet evaporation and fragmentation processes. The high-speed images are recorded at 25 000 f.p.s. and the spatial resolution of the recorded images is 6.7 μm pixel−1. An in-house MATLAB code was used to calculate the equivalent diameter of the droplet as a function of time. The equivalent diameter of the droplet is calculated using the relation,  $D = \sqrt {{D_H}{D_V}} $, where
  ${D_H}$ and
  ${D_V}$ are the maximum horizontal and vertical lengths of droplets, respectively. Image analysis platforms ImageJ (version 2.0) and Image-Pro Plus (version 6.0) are used to determine the membrane diameter, size and velocity of secondary droplets, radial acceleration and velocity of expanding sheet. Using ImageJ we calculated the diameter of the membrane manually. To obtain the diameter and velocity of a secondary droplet, the sequence of images is first processed by adjusting the threshold such that the background is completely dark, and the object of interest (droplet) is white. The software then automatically identifies the boundary of the secondary droplet and calculates its mean diameter and velocity. The velocity and radial acceleration of the expanding sheet are obtained by tracking the centroid of the sheet between successive frames. The uncertainties in the measurements of secondary droplet diameter, velocity, sheet velocity and velocity and membrane diameter are found to be within 5 %.

Figure 1. Schematic representing (a) side view and (b) top view of the experimental set-up. The droplet is levitated using a single-axis acoustic levitator and subsequently evaporated using a continuous CO2 laser. The droplet evaporation and atomization phenomena are captured with a high-speed camera at different frame rates, and a pulsed laser light source provides the backlighting. Here,  ${D_H}$ and
  ${D_V}$ are the maximum horizontal and vertical lengths of droplets, respectively.
After evaporation, the precipitates are analysed using a scanning electron microscope (SEM) (VEGA3, TESCAN) at electron high tension of 5 KV, using a secondary electron detector.
2.3. Non-dimensional experimental parameters
In the current study, we have non-dimensionalized the concentration of PAM and power of the laser in the following way. The PAM concentration  $(c)$ is non-dimensionalized with the critical overlap concentration
  $({c^\ast })$ of PAM;
  ${c^\ast }$ represents the threshold concentration above which polymer coils in the solution starts to overlap with each other. This concentration is called the critical overlap concentration and is given as
 \begin{equation}{c^\ast } = 3{M_W}/4{\rm \pi} {N_A}R_G^3,\end{equation}
where  ${M_W}$ represents weight-averaged molecular weight,
  ${N_A}$ represents the Avogadro number and
  ${R_G}$ represents the radius of gyration of the polymer molecule. The molecular weight dependence of the radius of gyration of PAM in a good solvent is given by Francois et al. (Reference Francois, Sarazin, Schwartz and Weill1979) as
 \begin{equation}\langle R_G^2\rangle^{(1/2)} = 0.0749M_w^{0.64} \times {10^{ - 10}}\ \textrm{m},\end{equation}
which gives us  ${R_G}$ of 145 nm and
  ${c^\ast }$ approximately 0.06 % (w/w) for a molecular weight of 5 × 10⁶ g mol−1 of PAM. Based on the obtained
  $c/{c^\ast }$ value, the various polymer concentrations used in the current work are divided into two regimes: semi-dilute unentangled and semi-dilute entangled. In semi-dilute unentangled regime polymer coils overlap but no entanglements are formed in the solution at equilibrium. Whereas in the entangled regime polymer chains start to entangle with each other. Francois et al. (Reference Francois, Sarazin, Schwartz and Weill1979) reported the entanglement concentration
  $({c_e})$ for 5 × 10⁶ g mol−1 molecular weight PAM solution to be 0.648 % (w/w). Therefore, beyond
  ${c_e} > 10{c^\ast}\ (13{c^\ast })$, we have a semi-dilute entangled regime. In the current study
  $c = 0.2\,\%\ (w/w)$ and
  $c = 0.6\,\%\ (w/w)$ represent a semi-dilute unentangled regime, whereas other concentrations
  $(c = 1\,\%\ (w/w),\ c = 2\,\%\ (w/w),\ \textrm{and}\ c = 5\,\%\ (w/w))$ indicate semi-dilute entangled regime.
From the laser power  $(P)$ and the beam diameter
  $({D_b})$, the irradiation intensity
  $(I)$ can be written as
  $I = 4P/{\rm \pi} D_b^2$. The obtained irradiation intensity can be non-dimensionalized as the ratio of total heat incident on the droplet to the latent heat of vaporization of the droplet, which can be expressed as
 \begin{equation}{I^\ast } = \frac{{1.5{D_0}I}}{{{h_{lv}}{\alpha _l}{\rho _l}}},\end{equation}
where  ${D_0}$ is the initial diameter of the droplet,
  ${h_{lv}}$ represents latent heat of vaporization,
  ${\alpha _l}$ and
  ${\rho _l}$ represent the thermal diffusivity and the density of liquid, respectively.
3. Results and discussions
3.1. Global observations
A global overview summarizing the interaction between a continuous laser and an acoustically levitated droplet for a range of polymer concentration and irradiation intensity is shown in figure 2. In the case of concentrations below the semi-dilute entangled regime  $(c/{c^\ast } = 3.3)$, for all the laser irradiation intensities, we observe smooth evaporation. The time scale of droplet evaporation decreases from
  $O({10^1})s$ to
  $O({10^0})s$ as the irradiation intensity is increased from 0.57 to 2.2.

Figure 2. Global observations of the droplet evaporation and atomization phenomena associated with PAM aqueous solutions. The influence of polymer concentration (ranging from  $c/{c^\ast } = 3.3\ \textrm{to}\ 83.3$) and laser irradiation intensity
  ${I^\ast } = 0.57\ \textrm{to}\ 2.2$ are shown. Here,
  $c/{c^\ast }$ and
  ${I^\ast }$ represent normalized polymer concentration and laser irradiation intensity, respectively. Four distinct features associated with the evaporation and atomization phenomena of polymeric droplets are droplet evaporation, bubble-induced membrane growth, membrane rupture/buckling and droplet fragmentation. Here, O() symbol indicates order of time scale of occurrence for each phase involved in the current study.
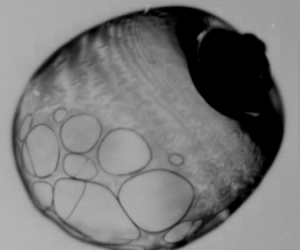
For low irradiation intensity  $({I^\ast } = 0.57)$, smooth evaporation of the droplet (phase A) prevails irrespective of the concentration. Insets in figure 2 represent SEM images of the final precipitates of the polymeric droplet after complete evaporation, which show buckling at the poles. As the polymeric droplet evaporates, the accumulation of an interconnected network of polymers at the interface leads to the formation of a skin layer along the drop periphery (figure 3), which is a precursor to buckling at later stages. As
  $c/{c^\ast } = 83.3$ falls in the semi-dilute entangled regime; due to the interconnections of the polymeric chains, there is pronounced skin-layer formation compared with
  $c/{c^\ast } = 3.3$. This leads to the formation of buckled final precipitate for
  $c/{c^\ast } = 83.3$ and smoother final precipitate for
  $c/{c^\ast } = 3.3$.

Figure 3. Illustration of skin-layer formation and bubble dynamics in a typical evaporating polymeric droplet. Inset shows the variation of mass fraction of polymer with normalized radial location in the droplet.
As the laser irradiation intensity is increased  $({I^\ast } = 0.7)$, for droplets with
  $c/{c^\ast } = 83.3$, we observe a smooth evaporation (phase A) and symmetric membrane growth (phase B), and membrane rupture/buckling (phase C). The time scale of symmetric membrane growth is
  $O({10^{ - 4}})s$. With a further increase in the irradiation intensity to
  ${I^\ast } = 2.2$, we observe evaporation (phase A), asymmetric membrane growth (phase B) and subsequent rupture of the viscoelastic membrane through hole formation (phase C). The time scale of asymmetric membrane growth is
  $O({10^{ - 5}})s$. The behaviour of symmetric and asymmetric bubble-induced membrane growth and its subsequent rupture/buckling will be elaborated in § 3.3. For relatively lower polymer concentrations (above the entangled regime), we observe distinct modes of droplet breakup (such as stable and unstable sheet breakup) with time scales
  $O({10^{ - 5}})s$. The modes of droplet breakup (phase D) will be elaborated in § 3.4.
3.2. Droplet evaporation (phase A)
Figure 3 schematically represents the formation of the skin layer during the evaporation of the polymeric droplet. Inset in figure 3 represents a radial variation of polymer mass fraction obtained numerically. The details of numerical simulation can be found in Basu & Cetegen (Reference Basu and Cetegen2008). As the polymeric droplet evaporates, the accumulated polymer along the interface forms an interconnected network of polymer, which transforms into a skin layer as the evaporation proceeds. Further heating of the droplet causes bubble nucleation close to the skin layer. The nucleated bubble interacts with the skin layer and then evolves as a membrane. The nature of the membrane is different for different irradiation intensities. Depending on the irradiation intensities, finally the membrane can undergo shell buckling or rupture through hole formation. The quantitative criterion for the skin-layer formation is given by Péclet number at higher irradiation intensities. The Péclet number is defined as  $Pe = {t_{dp}}/t$, where
  ${t_{dp}}$ represents the diffusion time scale of polymer molecules inside the droplet and t represents the evaporation time scale of the droplet. Here,
  ${t_{dp}} = D_0^2/{D_P}$, where
  ${D_0}$ represents the initial diameter of the polymeric droplet and
  ${D_P}$ represents the self-diffusion coefficient of the polymer molecule;
  ${D_P} = {K_{B}}{T_R}/6{\rm \pi} \mu \varepsilon $ (Rubinstein & Colby Reference Rubinstein and Colby2003), where the correlation length is
  $\varepsilon = {R_g}{(c/{c^\ast })^{\vartheta /(1 - 3\vartheta )}},{K_B}$,
  ${T_R}$ and
  $\mu $ represent Boltzmann constant, room temperature and dynamic viscosity of the solvent, respectively. Excluded volume coefficient
  $\vartheta $ is taken as 0.588. In the current experimental study, Pe >>1. This implies that evaporation of the droplet is much faster compared with diffusion of polymer molecules and indicates that, as the evaporation proceeds, there is continuous accumulation of polymer concentration at the interface. Once the polymer concentration at the interface reaches the gelation concentration
  $({\emptyset _g})$ a skin layer forms at the polymeric droplet interface. To reach the gelation concentration
  $({\emptyset _g})$ at the interface, the polymeric droplet has to have undergone a certain period of evaporation depending on the irradiation and concentration. The thickness of the skin layer
  $({h_0})$ attained during evaporation of the polymeric droplet is calculated in the following way. The skin-layer thickness
  $({h_0})$ calculated during the evaporation phase is used to explain the membrane dynamics (see § 3.3). Since we are in the regime of very high Péclet numbers
  $(Pe \gg 1)$, the slightly curved nature of the variation of volume fraction of polymer inside the polymeric droplet can be approximated as a step profile. Therefore, during the drying process, the drop can be divided into two regions, a central region where the polymer mass fraction is equal to its initial value
  $({\emptyset _p})$ and a packed region, where the polymer mass fraction is equal to the gelation concentration
  ${\emptyset _g}$. In general,
  ${\emptyset _g}$ can also represent the maximum saturated concentration in the polymeric droplet in a non-dimensional form where phase transition occurs. The polymer mass fraction
  $\emptyset $ in the droplet can vary anywhere between
  ${\emptyset _p}$ and
  ${\emptyset _g}$.
Here,  ${\emptyset _g}$ is assumed to be approximately equal to 1 in the skin-layer regime, where the polymer concentration is the highest throughout the droplet.
Based on solid-mass conservation, we can write
 \begin{equation}\frac{{4{\rm \pi} D_0^3{\rho _l}{\emptyset _p}}}{{24}} = \frac{{4{\rm \pi} [{D^3} - D_{dz}^3]{\rho _p}{\emptyset _g}}}{{24}} + \frac{{4{\rm \pi} D_{dz}^3{\rho _l}{\emptyset _p}}}{{24}}.\end{equation}
Writing it in a non-dimensional form, we get
 \begin{equation}{\tilde{D}_{dz}} = {\left( {\frac{{{{\tilde{D}}^3}\tilde{\rho }{\emptyset_g} - {\emptyset_p}}}{{\tilde{\rho }{\emptyset_g} - {\emptyset_p}}}} \right)^{1/3}},\end{equation}
where
 \begin{equation}{\tilde{D}_{dz}} = \frac{{{D_{dz}}}}{{{D_0}}},\quad \tilde{D} = \frac{D}{{{D_0}}},\quad \tilde{\rho } = \frac{{{\rho _p}}}{{{\rho _l}}}.\end{equation}
Here,  ${D_{dz}}$ represents the inner diameter of the packed region;
  ${\rho _p}$ and
  ${\rho _l}$ represent density of the polymer and density of liquid, respectively. Finally, the skin-layer thickness
  ${h_0}$ can be written as
 \begin{equation}{h_0} = 0.5\left( {D - \left( {{D_0}{{\left( {\frac{{{{\tilde{D}}^3}\tilde{\rho }{\emptyset_g} - {\emptyset_p}}}{{\tilde{\rho }{\emptyset_g} - {\emptyset_p}}}} \right)}^{1/3}}} \right)} \right).\end{equation}
Here,  ${D_0}$ represents the initial diameter of the polymeric droplet. See supplementary figure S2 for variation of skin-layer thickness with irradiation intensity at
  $c/{c^\ast } = 83.3$.
Figure 4(a) shows the variation of normalized diameter  $(D/{D_0})$ with normalized time
  $(t/{t_d})$ for different irradiation intensities at
  $c/{c^\ast } = 83.3$. Here,
  ${t_d}$ represents thermal diffusion time scale and is defined as
 \begin{equation}{t_d} = \frac{{D_0^2}}{{{\alpha _l}}} = \frac{{{\rho _l}{c_p}D_0^2}}{k},\end{equation}
where  ${c_p}$ is the specific heat capacity, and k is the thermal conductivity of the liquid. The heating process of a typical polymeric droplet consists of smooth evaporation, nucleation of bubble, bubble growth, rupture of the viscoelastic membrane or buckling of the viscoelastic shell and subsequent break up of the polymeric droplet through various pathways. Similar regimes (steady evaporation, bubble formation and breakup) have been extensively reported in the literature during the combustion of multi-component miscible droplets (Mura et al. Reference Mura, Calabria, Califano, Massoli and Bellettre2014; Har et al. Reference Har, Fu, Chan, Tey and Chen2017), emulsion droplets (Mura et al. Reference Mura, Josset, Loubar, Huchet and Bellettre2010) and nanoparticle-laden droplets (Pathak & Basu Reference Pathak and Basu2016b). However, the pattern of bubble-induced membrane growth, rupture of the viscoelastic membrane and the breakup of the parent droplet in the present work is entirely different from the investigations mentioned above, owing to distinct experimental conditions. As expected, diameter reduction is faster for high irradiation intensity and lower for low irradiation intensity. It is also evident that the onset of the bubble, subsequent membrane rupture and droplet break up are faster for higher irradiation intensities. In contrast, they is delayed for lower irradiation intensities. Note that
  $t/{t_d}$ for
  ${I^\ast } = 0.7$ is greater than unity, whereas it is less than unity for higher irradiation intensities. It plays a significant role in the kind of bubble-induced membrane growths we observe for different irradiation intensities, further elaborated in § 3.3. Figure 4(b) shows the variation of normalized diameter
  $(D/{D_0})$ with normalized time
  $(t/{t_d})$ for different concentrations at
  ${I^\ast } = 2.2$. For lower
  $c/{c^\ast }$, we observe only smooth evaporation of droplets. However, for higher
  $c/{c^\ast }$, we observe a sequence of events which includes evaporation, nucleation and bubble growth and fragmentation of the droplets. This behaviour is observed for all the irradiation intensities, indicating a threshold non-dimensional concentration of polymer required to observe bubble growth and fragmentation of droplets. It seems that
  $c/{c^\ast } > 10$ is the threshold limit for the bubble to nucleate. As
  $c/{c^\ast } > 10$corresponds to entangled regime for the current polymer considered, the accumulation of interconnected network of polymers along the drop periphery leads to a skin-layer formation. In figure 2, for
  $c/{c^\ast } = 83.3$ and
  ${I^\ast } = 0.57$, the SEM image has a pronounced central dip in it which represents buckling. Skin-layer formation precedes buckling. Further continuous supply of heat leads to hot spots. The combination of skin layer and hot spots leads to nucleation of the bubble which does not occur for
  $c/{c^\ast } = 3.3$ or 10. Temporal variation of the drop diameter with time remains the same for water and polymeric droplets of all concentrations, indicating that the rate of evaporation of polymeric droplets remains the same even with the addition of polymer.

Figure 4. (a) Temporal evolution of droplet diameter for different laser irradiation intensities corresponding to  $c/{c^\ast } = 83.3$. (b) Temporal evolution of droplet diameter for different concentrations of polymer corresponding to
  ${I^\ast } = 2.2$. The uncertainty in measuring droplet diameters (D/D 0) is ~0.2 %. The various important phases have been annotated.
Figure 5(a) shows the evolution of interface temperature of a droplet for different irradiation intensities. The interface temperature is calculated following the work of Sobac et al. (Reference Sobac, Larbi, Colinet and Haut2019). The molar evaporation flux at the liquid–gas interface can be written as
 \begin{equation}{j^\ast } = \frac{{ - 2{c_g}{d_{va}}}}{D}\ln \left( {\frac{{1 - {X_i}}}{{1 - {X_\infty }}}} \right),\end{equation}
where  ${c_g}$ represents gas molar concentration,
  ${d_{va}}$ represents diffusion coefficient of vapour in air, D represents the diameter of the drop,
  ${X_i}$ and
  ${X_\infty }$ represent the mole fraction of vapour in the gas phase at the interface and far field, respectively. A global mass balance on the drop writes
 \begin{equation}{j^\ast }{\rm \pi} {D^2} ={-} {c_l}\frac{{\textrm{d}V}}{{\textrm{d}t}},\end{equation}
where V is the droplet volume,  ${c_l}$ represents liquid molar concentration. Introducing
  $V = {\rm \pi}{D^3}/6$, the differential equation for the drop radius can be given as
 \begin{equation}\frac{{\textrm{d}D}}{{\textrm{d}t}} = \frac{4}{D}\left( {\frac{{{c_g}{d_{va}}}}{{{c_l}}}} \right)\ln \left( {\frac{{1 - {X_i}}}{{1 - {X_\infty }}}} \right).\end{equation}
Using the initial condition  $D(t = 0) = {D_0}$, the integration of the above equation gives
 \begin{equation}D{(t)^2} = D_0^2 - 8{d_{va}}\left( {\frac{{{c_g}}}{{{c_l}}}} \right)\ln \left( {\frac{{1 - {X_\infty }}}{{1 - {X_i}}}} \right)t.\end{equation}
Equating the slopes of the experimental  ${D^2}$ versus t and above theoretical equation, we get
  ${X_i}$ for different irradiation intensities.

Figure 5. (a) Variation of droplet interface temperature with laser irradiation intensity. The dotted line indicates a logarithmic fit of the data. The solid points represent the interface temperature evaluated from (3.9) and (3.10) using experimental evaporation curves. (b) Temporal variation of volumetric average temperature inside the droplet at different laser irradiation intensities using numerically integrating equation (3.36) and experimental evaporation curves.
The liquid vapour interface remains in equilibrium since the evaporation time scale is of the order of seconds which is significantly larger than the molecular time scales that preserve the phase equilibrium at the droplet interface. Here,  ${X_i}$ can be expressed as a function of the drop interface temperature,
  ${T_i}$ using the Clausius–Clapeyron equation
 \begin{equation}{X_i} = \exp \left( {\frac{{ - {L^\ast }}}{{{R_g}}}\left( {\frac{1}{{{T_i}}} - \frac{1}{{{T_b}}}} \right)} \right),\end{equation}
where  ${T_b}$ is the boiling temperature of the liquid,
  ${L^\ast }$ is the molar latent heat of vaporization of the liquid and
  ${R_g}$ represents universal gas constant. Knowing
  ${X_i}$ we can obtain interface temperature,
  ${T_i}$ for water droplets at different irradiation intensities. As expected, the interface temperature
  ${T_i}$ of water droplet increases with
  ${I^\ast }$. However, the trend of
  ${T_i}$ seems to have a logarithmic variation. Note that the maximum interface temperature for water droplets is close to the boiling point at higher irradiation intensities. As we have already seen in figure 4(b) that, irrespective of the polymer concentration, the first stage of the droplet temporal evolution is similar for all the droplets, indicating that the droplet evaporation rate is primarily dictated by the solvent evaporation (water). Thus, it is assumed that the interface temperature attained during evaporation by using (3.9) is the same as that of water for polymeric droplets of all concentrations.
3.3. Bubble-induced membrane growth and its rupture (phases B and C)
3.3.1. Formation of hot spots inside the droplet
The interaction between a droplet of diameter  ${D_0}$ and radiation of wavelength
  ${\lambda _0}$ can be characterized based on the non-dimensional Mie size parameter (Park & Armstrong Reference Park and Armstrong1989)
 \begin{equation}{\alpha _m} = \frac{{{\rm \pi} {D_0}}}{{{\lambda _0}}}.\end{equation}
The Mie size parameter  ${\lambda _0}$ dictates the evolution of the thermal energy field inside the droplet through scattering, absorption and extinction cross-sections of the incident radiation source. Homogeneous internal heat generation occurs for
  ${\alpha _m} < 1.5$, corresponding to a very small droplet size (diameter 2.25 μm). Figures 4(a) and 4(b) show the normalized droplet size (diameter) during the entire evaporation process for different irradiation intensities and initial polymer concentration. The initial droplet diameter
  ${D_0}$ of 850 μm regresses to approximately 300–400 μm during the evaporation phase A.
Comparing the droplet diameter with the equivalent length scale corresponding to the Mie size parameter, we observe that our experimental conditions result in non-uniform heat evolution inside the droplet. Although the essential mechanism of heat evolution is non-uniform for all our cases due to significantly large droplet size, we can still isolate two distinct heating regimes (fast heating vs slow heating) based on the ratio of evaporation time scale  $(t)$ to the thermal diffusion time scale
  $({t_d})$. The thermal diffusion time scale
  ${t_d}$ provides insights into the time required for the temperature field inside the droplet to equilibrate. Therefore, depending on the evaporation time scale, the laser heating can either be slow or fast. Quantitatively,
  $t/{t_d} < 1$ leads to inhomogeneous heating forming hot spots (characterized as fast heating). However, for
  $t/{t_d} > 1$, homogeneous heating of the droplet is attained, causing a symmetric and approximately uniform temperature profile evolution inside the droplet (characterized by slow heating). It can be inferred from figure 4(a) that, for a fixed concentration
  $(c/{c^\ast } = 83.3)$, the ratio of
  $t/{t_d}$ varies with
  ${I^\ast }$. For
  ${I^\ast } = 0.7$,
  $t/{t_d} \sim 2.2$ suggests slow heating, leading to a symmetric expansion of the membrane. However, for
  ${I^\ast } \ge 1.5$, the ratio
  $t/{t_d} < 1$ corresponds to fast heating, resulting in localized hot spots and subsequent asymmetric membrane growth. Literature on droplet–laser interaction and boiling suggests that liquid droplets can become superheated and remain in a liquid metastable state above 373 K at atmospheric pressure (Park & Armstrong Reference Park and Armstrong1989). The maximum temperature at hot spots that the droplet can attain before spontaneous nucleation in pure liquids is (Prishivalko & Leiko Reference Prishivalko and Leiko1980)
 \begin{equation}{T_{su}} \sim 0.9{T_{cr}} \sim 582\ \textrm{K}. \end{equation}
Here,  ${T_{cr}}$ represents the critical temperature of water and its value is 647 K. This study, however, deals with aqueous polymeric droplets, and as we have discussed in § 3.2, evaporation of the droplets leads to skin formation and regions of excessively high concentration of polymeric networks that can act as nucleation sites forming vapour bubbles at a temperature lower than the
  ${T_{su}}$ required by spontaneous nucleation.
The interaction between the laser and the droplet can be represented as a volumetric heat generation term in the energy equation. The actual mechanism of the heat generation is an electromagnetic and molecular phenomenon that occurs due to the interaction of the photons from the laser beam with the molecules of the polymeric droplet. The differential form of the energy equation is given as
 \begin{equation}{\rho _l}{c_l}\left( {\frac{{\partial T}}{{\partial t}} + \boldsymbol{u}\boldsymbol{\cdot }{{\boldsymbol{\mathsf{\nabla}}}}T} \right) = {k_l}{\nabla ^2}T + {q_s}.\end{equation}
Here, the left-hand side represents the unsteady and convective term inside the droplet and the right-hand side represents the diffusion term and source term (volumetric heat generation). Also,  ${\rho _l}$,
  ${c_l}$, T, t, u,
  ${{\boldsymbol{\mathsf{\nabla}}} }$,
  ${k_l}$,
  ${q_s}$ represent the density of the droplet, the specific heat capacity of the droplet, temperature, time, flow velocity inside the droplet, gradient operator, thermal conductivity of the droplet and volumetric heat generation source term, respectively. The volumetric heat generation depends on the optical properties of the droplet. The properties relevant to the laser–polymeric droplet interaction, such as refractive index and absorption coefficient, are almost equal to those of water. Supplementary figure S5 compares the absorptivity of water and PAM solution of concentration
  $c/{c^\ast } = 83.3$ for a wavelength range of
  $2$ to
  $16\ {\rm \mu}\textrm{m}$. As seen in the figure, the absorptivity values are almost identical to water. Liquid water is opaque to radiation in the infrared region and has a substantial absorption coefficient of
  ${10^5}\ {\textrm{m}^{ - 1}}$.
We estimate the average temperature of the droplet by integrating equation (3.13) over the entire droplet volume V. Here, we assume flow inside the droplet to be incompressible and that density changes of liquid are negligible with temperature. Note we do not assume a uniform temperature distribution inside the droplet. We have
 \begin{equation}\int_V {{\rho _l}{c_l}} \left( {\frac{{\partial T}}{{\partial t}} + \boldsymbol{u}\boldsymbol{\cdot }{{\boldsymbol{\mathsf{\nabla}}} }T} \right)\,\textrm{d}V = \int_V {{k_l}{\nabla ^2}T\,\textrm{d}V} + \int_V {{q_s}\,\textrm{d}V} .\end{equation}
The first term on the left-hand side of (3.14) becomes
 \begin{equation}\int_V {{\rho _l}{c_l}\frac{{\partial T}}{{\partial t}}\,\textrm{d}V} = \frac{{4{\rm \pi} {R^3}{\rho _l}{c_l}}}{3}\frac{{\textrm{d}T}}{{\textrm{d}t}},\end{equation}
where R is the radius of the droplet. The second term on the left-hand side of (3.14) can be expressed in a modified form using the product rule of derivatives.
 \begin{equation}\int_V {\boldsymbol{u}\boldsymbol{\cdot }{{\boldsymbol{\mathsf{\nabla}}} }T\,\textrm{d}V} = \int_V {{{\boldsymbol{\mathsf{\nabla}}} }\boldsymbol{\cdot }(\boldsymbol{u}T)\,\textrm{d}V} - \int_V {T{{\boldsymbol{\mathsf{\nabla}}} }\boldsymbol{\cdot }\boldsymbol{u}} .\end{equation}
As the flow inside the droplet is essentially incompressible in the liquid phase it hence satisfies the continuity equation
 \begin{equation}{{\boldsymbol{\mathsf{\nabla}}} }\boldsymbol{\cdot }\boldsymbol{u} = 0.\end{equation}
Note that we are still in the liquid phase and bubbles have not formed during temperature evolution. Substituting equation (3.17) in (3.16) and using the Gauss divergence theorem (considering the droplet surface as the Gaussian surface  $S$), we have
 \begin{equation}\int_V {\boldsymbol{u}\boldsymbol{\cdot }{{\boldsymbol{\mathsf{\nabla}}} }T\,\textrm{d}V} = \int_V {{{\boldsymbol{\mathsf{\nabla}}} }\boldsymbol{\cdot }(\boldsymbol{u}T)\,\textrm{d}V} = \int_S {T\boldsymbol{u} \boldsymbol{\cdot} \hat{n}\,\textrm{d}S} = 0.\end{equation}
The first term on the right-hand side of (3.14) represents heat transfer due to conduction and second term represents heat generation due to radiation.
In general, the thermal diffusion time scales are comparatively higher than the radiative heating time scale. For our experimental condition the thermal diffusion time scale  $({t_d})$ is of the order of seconds whereas the radiative heating time scales are smaller than a fraction of a microsecond
 \begin{equation}\int_V {{q_s}\,\textrm{d}V} \gg \int_V {{k_l}{\nabla ^2}T\,\textrm{d}V} .\end{equation}
Therefore, the dominant mechanism of temperature evolution inside the droplet is through radiative heating.
The last term of (3.14) is the total internal heat generation within the droplet volume represented as  ${Q_s}$
 \begin{equation}{Q_s} = \int {{q_s}\,\textrm{d}V} = \int_0^{2R} {\alpha I(r,z)\,\textrm{d}A\,\textrm{d}r} ,\end{equation}
where  $\alpha $ is the absorption coefficient,
  $I(r,z)$ is the beam profile,
  $\textrm{d}V = \textrm{d}A\,\textrm{d}r$ is the differential volume and
  $\textrm{d}A$ is the differential area perpendicular to the direction of propagation of the laser (see supplementary figure S6a). Note that r is in the radial direction along the laser beam and z is a direction perpendicular to the beam. In general, the beam intensity has a Gaussian profile, i.e. intensity is a function of z. However, the incident beam has a diameter of 3.5 mm. The beam diameter is approximately four times larger than the droplet diameter (850 μm). Hence, to obtain an approximate estimate of the temperature, we use a constant beam profile along the z direction (see supplementary figure S7), i.e.
 \begin{equation}I(r,z) = I(r).\end{equation}
As the laser beam travels through the droplet, the energy in the beam attenuates according to the Beer–Lambert law given as
 \begin{equation}I(r) = {I_0}\,{\textrm{e}^{ - \mu r}},\end{equation}
where  $\mu $ is the extinction coefficient
 \begin{equation}\mu = \alpha + \kappa ,\end{equation}
and  $\kappa $ is the scattering coefficient. However,
  $\alpha \gg k$, which implies
  $\mu \sim \alpha $. Using (3.21), (3.22) in (3.20),
  ${Q_s}$ becomes
 \begin{equation}{Q_s} = \int_0^{2R} {\alpha {I_0}\,{\textrm{e}^{ - \mu r}}\,\textrm{d}A\,\textrm{d}r} ,\end{equation}
where
 \begin{equation}\textrm{d}A = {\rm \pi}[R\sin \theta {\textrm{]}^2},\end{equation}
and
 \begin{equation}\sin \theta = \frac{{\sqrt {{R^2} - {{(R - r)}^2}} }}{R} = \frac{{\sqrt {2Rr - {r^2}} }}{R}.\end{equation}
The differential circular area perpendicular to the laser beam is
 \begin{equation}\textrm{d}A = {\rm \pi}(2Rr - {r^2}).\end{equation}
Using (3.27) in (3.24), we have
 \begin{equation}{Q_s} = \alpha {\rm \pi}{I_0}\int_0^{2R} {{\textrm{e}^{ - \mu r}}(2Rr - {r^2})\,\textrm{d}r} .\end{equation}
Using (3.15), (3.18), (3.19), (3.28) in (3.14) we have
 \begin{equation}\frac{{{\rho _l}{c_l}{R^3}}}{3}\frac{{\textrm{d}T}}{{\textrm{d}t}} = \frac{\alpha }{4}{I_0}\int_0^{2R} {{\textrm{e}^{ - \mu r}}(2Rr - {r^2})\,\textrm{d}r} .\end{equation}
Simplifying the definite integral in (3.29), we have
 \begin{equation}\frac{{{\rho _l}{c_l}{R^3}}}{3}\frac{{\textrm{d}T}}{{\textrm{d}t}} = \frac{{\alpha {I_0}}}{{2{\mu ^3}}}(\mu R + (\mu R - 1)\,{\textrm{e}^{2\mu R}} + 1)\,{\textrm{e}^{ - 2\mu R}}.\end{equation}
Simplifying further the rate of change in droplet temperature, we have
 \begin{equation}\frac{{\textrm{d}T}}{{\textrm{d}t}} = \frac{{3\alpha {I_0}}}{{2{\mu ^3}{\rho _l}{c_l}}}\frac{{(\mu R + (\mu R - 1)\,{\textrm{e}^{2\mu R}} + 1)\,{\textrm{e}^{ - 2\mu R}}}}{{{R^3}}}.\end{equation}
We can write (3.31) in a condensed form by incorporating a constant A and a change of variable  $G(R(t),\mu )$
 \begin{equation}\frac{{\textrm{d}T}}{{\textrm{d}t}} = AG(R(t),\mu ),\end{equation}
where
 \begin{equation}A = \frac{{3\alpha {I_0}}}{{2{\mu ^3}{\rho _l}{c_l}}},\end{equation}
and
 \begin{equation}G(R(t),\mu ) = \frac{{(\mu R + (\mu R - 1)\,{\textrm{e}^{2\mu R}} + 1)\,{\textrm{e}^{ - 2\mu R}}}}{{{R^3}}}.\end{equation}
Note from (3.32) that the rate of temperature change is not a constant and changes nonlinearly with time. Integrating equation (3.32) using experimental regression curves for  $R(t)$ we have
 \begin{equation}\int_{{T_0}}^T {\textrm{d}T} = A\int_0^t {G(R(t),\mu )\,\textrm{d}t} ,\end{equation}
where  ${T_0}$ is the droplet initial temperature at
  $t = 0$ and T is the droplet temperature at any time
  $t$
$t$
 \begin{equation}T = {T_0} + A\int_0^t {G(R(t),\mu )\,\textrm{d}t} .\end{equation}
The temporal variation of volume-averaged temperature of the droplet for low and high irradiation intensities is shown in figure 5(b). Note that the above analysis becomes increasingly accurate for higher irradiation intensities under our stated assumptions. It can be seen that the interface temperature of the droplet (figure 5a) obtained during the evaporation phase for different irradiation intensities during the evaporation phase is less than the volume-averaged temperature of the droplet for different irradiation intensities. This essentially implies that the laser--droplet interaction occurs through volumetric heat generation inside the droplet.
3.3.2. Bubble growth
The bubble formed in the superheated aqueous polymeric droplet evolves under the influence of liquid inertia, the surface tension, pressure difference between the vapour bubble and the ambient liquid phase of the droplet. The bubble growth generally occurs in two phases. Initially, the bubble growth is slow due to the equilibrium of forces. However, it is accelerated with the increase in bubble size as a consequence of reduced surface tension due to an increase in temperature at the hot spots. After an initial exponential growth phase, the temperature and pressure within the bubble reduce, and the growth rate slows down. The temperature reduction within the bubble is due to the latent heat requirement of evaporation that happens at the liquid–vapour interface during the bubble growth. The amount of heat required for evaporation at the bubble boundary depends on the growth rate of the bubble. The standard bubble growth equation (Rayleigh–Plesset equation) coupled to the heat diffusion equation results in a modified Rayleigh–Plesset equation. The bubble growth takes place on a significantly short time scale ( ${O}(\mu s)$ compared with the evaporation time scales
  $({O}(1s))$ over which the laser heating takes place. Therefore, the liquid and vapour are assumed to be in equilibrium during bubble growth.
The bubble radius  $({R_b})$ in the asymptotic limit of sufficiently large values relative to the nucleus size takes the form of the Plesset–Zwick scaling given as (Plesset & Zwick Reference Plesset and Zwick1954)
 \begin{equation}{R_b} \sim {R_{b0}}\frac{2}{{{\rm \pi} \gamma }}{\left( {\frac{{\beta {t_b}}}{3}} \right)^{1/2}},\end{equation}
where  ${R_{b0}}$ is given by
 \begin{equation}{R_{b0}} = \frac{{2{\sigma _L}}}{{{P_V}(T) - {P_0}}}.\end{equation}
Note that, initially during bubble growth phase,  ${R_b} \ll {R_{onset}}$. Here,
  ${\mathrm{\sigma }_L}$ is the air–liquid surface tension,
  ${P_V}(T)$ is the saturated vapour pressure at a temperature
  $T > {T_b}$,
  ${P_0}$ is the saturation pressure corresponding to
  ${T_b}$ and
  ${P_V}(T)$ can be calculated from the Clausius–Clapeyron equation
 \begin{equation}{P_V}(T) = {P_0}\,{\textrm{e}^{{L^\ast }(T - {T_b})/{R_g}T{T_b}}},\end{equation}
where  ${L^\ast }$ is the latent heat of vaporization and
  ${R_g}$ is the specific gas constant of water vapour. The temperature scale T in (3.39) can be estimated from (3.36). Higher laser irradiation intensity causes a larger pressure difference across the bubble interface, causing faster bubble-induced membrane growth, as is observed for high
  ${I^\ast }$ compared with low
  ${I^\ast }$ (see figures 6 and 7).

Figure 6. High-speed image sequence for  $c/{c^\ast } = 83.3$ at
  ${I^\ast } = 0.7$. It depicts symmetric membrane growth and consequent buckling of the polymeric shell structure. Here,
  ${t_1}$ represents reference time scale starting from the end of droplet evaporation (phase A). The scale bar represents 1 mm.

Figure 7. High-speed image sequence for  $c/{c^\ast } = 83.3$ at
  ${I^\ast } = 2.2$ depicting asymmetric membrane growth, membrane rupture and the subsequent catastrophic breakup of parent droplet. The scale bar represents 1 mm.
In (3.37),  $\gamma $ is a non-dimensional number that controls the bubble growth rate and is given by
 \begin{equation}\gamma = \frac{{AL\rho ^{\prime}}}{{3k{R_{b0}}\beta }}{\left( {\frac{{{\alpha_l}}}{{{\rm \pi} \beta }}} \right)^{1/2}},\end{equation}
where
 \begin{gather}A = \frac{{{P_V}(T) - {P_0}}}{{\rho (T - {T_b})}},\end{gather}
 \begin{gather}\beta = {\left( {\frac{{2{\sigma_L}}}{{\rho R_{b0}^3}}} \right)^{1/2}},\end{gather}
where k is the conductivity of the liquid, A is a proportionality constant relating pressure difference to temperature difference,  $\rho ^{\prime}$ is the vapour density,
  ${\rho _l}$ is the liquid density and
  ${\alpha _l}$ is the thermal diffusivity of the liquid.
The bubble radius in a super-heated liquid medium grows as  $t_b^{1/2}$. The coefficient of
  $t_b^{1/2}$ depends on the degree of super-heat (refer to § 3.3.1 and (3.36)).
The theoretical bubble growth time scale according to (3.37) is approximately  $O({10^{ - 7}})s$ to
  $O({10^{ - 6}})s$ for the bubble to reach the onset size of the droplet for
  ${I^\ast } = 2.2$ and
  ${I^\ast } = 0.7$, respectively. The bubble observed in our experiments forms near the surface of the droplet and interacts with the skin layer formed during the evaporation phase. Once the bubble interacts with the skin layer, it evolves as a membrane (see supplementary figure S6b). The nature of the membrane is different for different irradiation intensities. Also, the bubble growth time scale is smaller than the membrane growth time scale by an order of magnitude.
3.3.3. Membrane growth mechanics
The membrane growth for  ${I^\ast } = 0.7$ is slower compared with
  ${I^\ast } = 2.2$ (see figures 6 and 7). We model the membrane growth using a spring, mass, damper model with external forcing from the pressure difference across the membrane interface coupled to the maximum pressure inside the droplet through the Clausius–Clapeyron equation (3.39). Our modelling approach is similar to various rheological/solid models based on spring, mass and damper systems like the Kelvin–Voigt model and standard linear solid model (Maxwell model), to name a few (Eldred, Baker & Palazotto Reference Eldred, Baker and Palazotto1995; Renaud et al. Reference Renaud, Dion, Chevallier, Tawfiq and Lemaire2011).
The governing dynamical law for the viscoelastic membrane is given as
 \begin{equation}{\ddot{R}_m} + 2\zeta {\omega _n}{\dot{R}_m} + \omega _n^2{R_m} = \frac{{{F_{ext}}}}{m},\end{equation}
where  ${R_m} = {R_m}(t)$ (figure 8a) represents the radial coordinate of the envelope of the membrane,
  ${\dot{R}_m}$ represents the velocity of the membrane,
  ${\ddot{R}_m}$ represents the membrane acceleration,
  ${\omega _n}$ is the natural frequency of the membrane characterizing the energy storage capacity,
  $\zeta $ is the damping coefficient of the membrane characterizing the losses due to viscous action,
  ${F_{ext}}$ represents the external force on the membrane due to the pressure and m is the mass of the membrane characterizing the inertia of the system. Equation (3.43) is essentially Newton's second law of motion for the membrane. Assuming approximate spherical symmetry, the membrane mass can be given as
 \begin{equation}m = {\rho _m}4{\rm \pi} R_{onset}^2{h_0},\end{equation}
where  ${\rho _m}$ is the membrane density,
  ${R_{onset}}$ is the onset radius and
  ${h_0}$ is the initial membrane thickness (skin-layer thickness) formed during the evaporation phase (refer to phase A). The sudden expansion is due to the pressure developed inside the bubble and
  ${F_{ext}}$ is the external pressure force on the membrane
 \begin{equation}{F_{ext}}\sim \Delta P{\rm \pi} R_m^2.\end{equation}
The pressure build-up inside the bubble is due to the sudden phase change of liquid to vapour at hot spots
 \begin{equation}\Delta P = {m_{in}}{R_g}T/v,\end{equation}
where  $\Delta P = {P_V}(T) - {P_0}$,
  ${m_{in}}$ is the initial mass of the vapour inside the bubble,
  $v = 4{\rm \pi} R_{onset}^3/3$. The scale of
  ${m_{in}}$ can be evaluated by equating equation (3.39) with (3.46)
 \begin{equation}{m_{in}} \sim \frac{{4{\rm \pi} R_{onset}^3{P_0}}}{{3{R_g}T}}({\textrm{e}^{{L^\ast }(T - {T_S})/{R_g}T{T_S}}} - 1).\end{equation}
Therefore, the governing dynamical law becomes
 \begin{equation}{\ddot{R}_m} + 2\zeta {\omega _n}{\dot{R}_m} + \omega _n^2{R_m} = \frac{C}{{{R_m}}},\end{equation}
where
 \begin{equation}C = \frac{{3{m_{in}}{R_g}T}}{{16{\rm \pi} {\rho _m}{h_0}R_{onset}^2}}.\end{equation}
Notice that the external forcing term on the right-hand side makes the equation nonlinear. Further, note that the external force is inversely proportional to the radius  ${R_m}$, which indicates that, as
  ${R_m}$ increases, the pressure decreases due to a fixed amount of vapour occupying an increasingly larger volume. The initial conditions are
 \begin{gather}{R_m}(0) = {R_{onset}},\end{gather}
 \begin{gather}{\dot{R}_m}(0) = 0.\end{gather}
The physical properties of the membrane are captured in  ${\omega _n}$ and
  $\zeta $;
  ${\omega _n}$ is related to the energy stored in the membrane and the storage modulus E whereas
  $\zeta $ is a parameter related to the losses occurring in the membrane. The storage modulus E is defined as the ratio of potential energy stored in the system per unit volume of the membrane. We have used a linear spring model to represent the stored potential energy in the membrane. The energy stored in the membrane is
  ${k_s}R_m^2/2$, where
  ${k_s}$ is the equivalent spring constant of the membrane
 \begin{equation}E\sim \frac{1}{2}\frac{{{k_s}R_m^2}}{{4{\rm \pi} R_m^2{h_0}}}.\end{equation}
Solving for  ${k_s}$ we have
 \begin{equation}{k_s}\sim 8{\rm \pi} {h_0}E.\end{equation}
Dividing both sides of the above equation by the mass of the membrane  $m = {\rho _m}4{\rm \pi} R_{onset}^2{h_0}$ and taking the square root, we have
 \begin{equation}{\omega _n}\sim \sqrt {\frac{{2E}}{{{\rho _m}R_{onset}^2}}} .\end{equation}
The numerical value of E used to calculate  ${\omega _n}$ is
  $O({10^6}{-} {10^7})\ \textrm{Pa}$ (Stafford et al. Reference Stafford2004; O'Connell et al. Reference O'Connell, Wang, Ishola and McKenna2012; Li & McKenna Reference Li and McKenna2015). The second-order nonlinear differential equation is solved numerically, and the temporal evolution of the membrane radius
  ${R_m}$ is plotted in figure 8(b) along with the experimental curve for
  ${I^\ast } = 0.7$ and
  ${I^\ast } = 2.2$ for
  $c/{c^\ast } = 83.3$. The theoretical scales of the membrane growth agree with the experimental observations within the experimental uncertainty The membrane growth for
  ${I^\ast } = 2.2$ is comparatively faster than for
  ${I^\ast } = 0.7$.

Figure 8. (a) Snapshots indicating hole nucleation and rupture of membrane. (b) Experimental and theoretical comparison of membrane radius evolving with time for different irradiation intensities  $({I^\ast })$ at
  $c/{c^\ast } = 83.3$. (c) Temporal evolution of membrane thickness for different irradiation intensities
  $({I^\ast })$ at
  $c/{c^\ast } = 83.3$. Data are represented as mean values ± SD from four individual droplets.
  ${h_{crit}}\sim 1\ {\rm \mu}\textrm{m}$ denotes the membrane thickness just before the rupture initiation.
The membrane for  ${I^\ast } = 0.7$ is qualitatively different from that of
  ${I^\ast } = 2.2$ (see figures 6 and 7 and supplementary material and movies). A low irradiation intensity forms a membrane with a shell-like structure. On the contrary, the membrane resembles a viscoelastic membrane for higher irradiation intensities. Figure 8(a) shows a close-up view of the viscoelastic membrane formed for
  ${I^\ast } = 2.2$. Further inference from the high-speed images (refer to figure 6 for
  ${t_1} > 1.4\ \textrm{ms}$) and videos (see supplementary material and movies) reveal textures/cracks on the shell-like structure for low irradiation intensities. The textures/cracks near the hole are dominantly visible as thin dark lines that radiate out from the central hole location. In contrast, no textures/cracks are observed for high irradiation intensity (see figure 8a), and multiple holes appear due to membrane thinning (refer to § 3.3.4) and the location where hole nucleates is caused due to thin-film instability (Sharma & Reiter Reference Sharma and Reiter1996). The nature of the membrane can be explained based on the ratio
  $t/{t_d}$. For
  $t/{t_d} > 1$ (refer to § 3.3.1), the droplet heating by the laser is slow, and the laser exposure time is significant, forming a shell structure that undergoes a rupture forming holes at the poles. The slow heating produces a structure that is more solid like. On the contrary, for
  $t/{t_d} < 1$, heating by the laser is fast and the exposure time short, leading to a viscoelastic membrane that thins out and ruptures through multiple holes due to the high pressures inside the bubble. The losses in the shell structure are large compared with the viscoelastic membrane. Solving the membrane inflation model quantitatively, we get
  $\zeta $ for slow heating is approximately 7 times larger than fast heating, depicting that more losses occur in the membrane for slow heating than fast heating. This is a numerical validation of the fact that the membranes formed because of slow heating and fast heating have different properties.
3.3.4. Thinning of the membrane causes hole formation
As the membrane inflates due to the bubble growth, the membrane envelope radius  ${R_m}$ increases, however, the thickness of the membrane h (figure 8a) has to decrease as a result of the conservation of mass. Applying conservation of mass for the membrane during the growth phase, we have
 \begin{equation}{\rho _m}4{\rm \pi} R_m^2(t)h = {\rho _m}4{\rm \pi} R_{onset}^2{h_0} = \textrm{const}\textrm{.},\end{equation}
where  ${\rho _m}$ is the membrane density,
  ${R_{onset}}$ is the onset radius of membrane growth and
  ${h_0}$ is the membrane thickness at the end of evaporation phase A
 \begin{equation}h(t) = {h_0}{\left( {\frac{{{R_{onset}}}}{{{R_m}}}} \right)^2}.\end{equation}
This shows that, as the membrane grows, the thickness of the membrane decreases. Equation (3.56) is plotted for  ${I^\ast } = 0.7$ and
  ${I^\ast } = 2.2$ in figure 8(c). The initial thickness
  ${h_0}$ for low irradiation intensity is larger
  $({h_0} \sim 30\,{\rm \mu} \textrm{m)}$ than the high irradiation intensity
  $({h_0} \sim 10\ {\rm \mu}\textrm{m)}$. The membrane thickness reduces with time faster for
  ${I^\ast } = 2.2$ compared with
  ${I^\ast } = 0.7$.
For low irradiation intensity, the membrane resembles a shell that grows until it ruptures by forming holes at the poles (weakest points) (see figure 6). Further several texture/crack patterns are also observed. However, for high irradiation intensity, the membrane ruptures through multiple holes due to thinning of the film in a very short time scale of a fraction of a millisecond. The rupture time scale can be evaluated by applying the Reynolds thin-film equation (Scheludko, Platikanov & Manev Reference Scheludko, Platikanov and Manev1965) to the viscoelastic membrane. The Reynolds equation is valid for the thinning of the viscoelastic membrane as the membrane thickness is less than  $30\ {\rm \mu}\textrm{m}$, which is an order of magnitude less than the droplet/membrane radius
 \begin{equation}\frac{{\textrm{d}{h^{ - 2}}}}{{\textrm{d}t}} = \frac{{4\Delta P}}{{3\eta r_t^2}},\end{equation}
where h is the membrane thickness,  $\eta $ is the viscosity of the polymer solution,
  $\Delta P$ is the total pressure difference applied across the membrane and
  ${r_t}$ is a length scale (see supplementary figure S4) characterizing the initial hole size on the surface of the membrane (see figure 8a).
Equation (3.57) is based on the assumption that, for small values of  ${r_t}({r_t} \ll {R_{onset}})$, the membrane is a plane parallel, and the fluid flow inside the membrane during the thinning process mimics the flow behaviour between parallel plates getting squeezed.
Integrating equation (3.57) with respect to time form  $t = 0$ to
  $t = \tau $ we have
 \begin{equation}\int_0^\tau {\frac{{\textrm{d}{h^{ - 2}}}}{{\textrm{d}t}}\,\textrm{d}t} = \int_0^\tau {\frac{{4\Delta P}}{{3\eta r_t^2}}\,\textrm{d}t} .\end{equation}
The rupture time scale  $\tau $ therefore becomes
 \begin{equation}\tau \sim \frac{{3\eta r_t^2}}{{4\Delta P{h^2}}},\end{equation}
where the total pressure  $\Delta P$ is composed of the capillary pressure
  $({\sim} {10^2}\ \textrm{Pa})$, pressure gradient due to the bubble expansion
  $({\sim} {10^5}\ \textrm{Pa})$ and disjoining pressure
  $({\sim} {10^{ - 2}}\ \textrm{Pa})$. The dominant component of the pressure is the pressure due to the bubble expansion, with capillary and disjoining pressures being insignificant. The theoretical time scale of rupture
  $(\tau \sim 0.1\ \textrm{ms})$ for
  ${I^\ast } = 2.2$ agrees with the experimental value of 0.1 ms. The blue dotted line in figure 8(c) denotes the critical membrane thickness of
  $({h_{crit}}\sim 1\ {\rm \mu}\textrm{m)}$. Note that for
  ${I^\ast } = 2.2$ the membrane thickness h reaches the critical thickness
  ${h_{crit}}$ within approximately 0.1 ms, leading to the rupture of the membrane. The temporal scale of hole formation on the membrane during growth is a direct consequence of film thinning.
3.4. Droplet breakup (phase D)
Overall, we observe three different breakup types: (i) catastrophic breakup of the droplet after membrane rupture. At significantly higher irradiation intensities, we observe (ii) droplet fragmentation through the formation of a stable sheet and (iii) droplet fragmentation through the formation of an unstable sheet. The different types of breakups are characterized by Weber number (We), which is defined as the ratio of pressure force due to bubble breakup  $({F_P})$ to the surface tension force
  $({F_S})$.
3.4.1. Catastrophic breakup of droplet
After the membrane ruptures, bubbles develop again inside the droplet (see § 3.3). The pressure exerted by these bubbles during their breakup catastrophically fragments the droplet with the ejection of secondary droplets. The Weber number of the droplet defining the catastrophic breakup is calculated in the following way. The pressure force due to bubble breakup scales as
 \begin{equation}{F_P}\sim ({P_{int}} - {P_{amb}}){\rm \pi} r_b^2,\end{equation}
where  ${P_{int}}$ is the pressure inside the bubble,
  ${P_{amb}}$ is ambient atmospheric pressure and
  ${r_b}$ is the radius of the bubble. Similarly, the surface tension force scales as
 \begin{equation}{F_S}\sim {\sigma _L}{\rm \pi} {D_{onset}}.\end{equation}
The Weber numbers (We) for the catastrophic breakup are  $O({10^3})$. The secondary droplet diameter is in the range of (0.01–0.16 mm), whereas the velocities are in the range of (1–6 m s−1) (See supplementary figure S3). It is observed that the secondary droplet diameter
  $({\alpha _s})$ and velocity
  $({\beta _s})$ are negatively correlated (a Pearson correlation coefficient of ~−0.5) with higher diameter secondary droplets corresponding to lower velocity and vice versa (see supplementary figure S3). Here, the correlation coefficient is used to indicate the dependence between
  ${\alpha _s}$ and
  ${\beta _s}$. The empirical Pearson coefficient (Swinscow and Campbell Reference Swinscow and Campbell1997) is given as
 \begin{equation}Corr({\alpha _s},{\beta _s}) = \frac{{\sum ({{\alpha_s} - \overline {{\alpha_s}} } )({{\beta_s} - \overline {{\beta_s}} } )}}{{\sqrt {\sum {{({{\alpha_s} - \overline {{\alpha_s}} } )}^2}\sum {{({{\beta_s} - \overline {{\beta_s}} } )}^2}} }},\end{equation}
where  $\overline {{\alpha _s}} $ and
  $\overline {{\beta _s}} $ represent the average secondary droplet diameter and average secondary droplet velocity, respectively.
3.4.2. Fragmentation of droplets through the formation of a stable sheet
Figure 9 shows the high-speed images depicting the time evolution of the polymeric droplet into a stable sheet and its subsequent collapse. After the skin-layer formation, the key mechanism driving the drop deformation and propulsion is the local asymmetric boiling of the liquid induced by the absorption of laser energy. The local asymmetric boiling leads to the formation of small-sized vapour bubbles, which subsequently undergo breakup and induce a thrust force on the droplet. It is to be noted that, during propulsion of the liquid sheet, the laser radiation pressure and thermal radiation pressure caused by the droplet surface heating are negligible (Delville et al. Reference Delville, de Saint Vincent, Schroll, Chraibi, Issenmann, Wunenburger, Lasseux, Zhang and Brasselet2009; Klein et al. Reference Klein, Bouwhuis, Visser, Lhuissier, Sun, Snoeijer, Villermaux, Lohse and Gelderblom2015). The induced thrust force deforms and breaks the droplet with a primary rim detachment  $({t_1}\sim 0.04\ \textrm{ms})$, forming a thin sheet. This deformation of the droplet occurs within the inertial time scale
  ${\tau _i}\sim {D_{onset}}/U\sim {10^{ - 4}}\ \textrm{s}$, where
  ${D_{onset}}$ represents the diameter of the polymeric droplet at the pre-breakup instant and U represents the maximum sheet velocity (1–2 m s−1). Concurrently, the expanding sheet is subjected to very high accelerations of
  $O({10^4})\ \textrm{m}\ {\textrm{s}^{ - 2}}$, which could lead to Rayleigh–Taylor instability. The instability growth,
  ${t_{RT}}$ can be estimated as follows (Villermaux and Clanet Reference Villermaux and Clanet2002):
 \begin{equation}{t_{RT}}\sim {\left( {\frac{{{\sigma_L}}}{{{\rho_L}a_s^3}}} \right)^{1/4}},\end{equation}
where  ${\sigma _L}$ represents the surface tension of the liquid,
  ${\rho _L}$ represents the density of the liquid and
  ${a_s}$ represents the radial acceleration of the sheet. The theoretical growth rate
  $({t_{RT}})$ is
 $\sim 0.09\ \textrm{ms}$. The experimental inter-frame time interval is 0.04 ms, which is of the order of
  ${t_{RT}}$. The developed liquid sheet gradually stretches out and accumulates liquid at the edge, forming a thin rim and ligaments
  $({t_1}\sim 0.36\ \textrm{ms)}$. At this instant, the centre of the sheet is thick compared with the outer region. As the sheet further expands, its thickness decreases while the rim diameter increases. Further, the sheet evolves to form a stable sheet
  $({t_1}\sim 0.68\ \textrm{ms)}$ with a thick rim and ligaments
  $({t_1}\sim 1.00\ \textrm{ms)}$. Initially, corrugations develop on the rim, which appear as mere noise in the experiments. Later they form apparent perturbations with a characteristic wavenumber,
  ${k_r}$ from which ligaments evolve. The wavelength corresponding to the corrugations gives the experimental growth rate of Rayleigh–Taylor instability on the rim. The fastest-growing Rayleigh–Taylor mode on the rim is given as (Klein et al. Reference Klein, Kurilovich, Lhuissier, Versolato, Lohse, Villermaux and Gelderblom2020)
 \begin{equation}{k_r}\sim {({a_s}{\rho _L}/{\sigma _L})^{1/2}}.\end{equation}
The theoretical  $(10\ \textrm{m}{\textrm{m}^{ - 1}})$ and experimental
  $(3.225 \pm 0.12\ \textrm{m}{\textrm{m}^{ - 1}})$ growth rates are approximately of the same order. The ligaments become Rayleigh–Plateau unstable and pinch-off into secondary droplets. The time taken between the formation of the ligament to pinch-off of the first droplet from the ligament gives the breakup time of the ligament. The experimental ligament breakup time is compared with the capillary time scale of the ligament
  $({t_{cl}})$, which is given as (Rao et al. Reference Rao, Karmakar and Basu2018)
 \begin{equation}{t_{cl}}\sim \sqrt {\frac{{{\rho _L}\varepsilon _b^3}}{{{\sigma _L}}},} \end{equation}
where  ${\varepsilon _b}$ represents ligament diameter. The theoretical capillary breakup time is 0.14 ms, whereas the experimental breakup time is 0.33 ± 0.12 ms. Following the breakup of ligaments, the sheet collapses under the influence of surface tension
  $({t_1}\sim 1.16\ \textrm{ms)}$. The experimental sheet collapse time scale is compared with the capillary time scale of the sheet, which is given as (Avila & Ohl Reference Avila and Ohl2016)
 \begin{equation}{t_c}\sim \sqrt {\frac{{{\rho _L}D_{onset}^3}}{{8{\sigma _L}}}} .\end{equation}
Here,  ${D_{onset}}$ represents the diameter of the polymeric droplet at the pre-breakup instant. The theoretical capillary time scale
  $({t_c})$ is 0.95 ms, whereas the experimental sheet collapse time is 0.71 ± 0.07 ms, indicating a similar order of magnitude.

Figure 9. High-speed image sequence depicting the evolution of a polymeric droplet into an expanding stable sheet and subsequent collapse. This mode of breakup is predominant at  $c/{c^{\ast }} = 83.3$ and
  ${I^{\ast }} = 3,3.5$. Here,
  ${t_1}$ represents reference time scale starting from the end of droplet evaporation (phase A). The scale bar represents 1 mm.
Figure 10 shows the experimental evolution of the stable sheet diameter with time and its theoretical comparison. The inset shows the variation of rim diameter with time. As seen in figure 10, the experimental temporal evolution of the sheet length scale closely matches the theoretically predicted sheet evolution. The continuous accumulation of liquid at the edge drawn from the centre of the sheet increases the diameter of the rim. As shown in the inset of figure 10, the rim diameter increases linearly with time. We use the approach used by Klein et al. (Reference Klein, Kurilovich, Lhuissier, Versolato, Lohse, Villermaux and Gelderblom2020) to explain the stable sheet evolution dynamics in our case.

Figure 10. Experimental and theoretical comparison of temporal variation of normalized sheet length scale (Ls/Donset). Inset represents the temporal variation of rim diameter corresponding to a stable sheet. The dotted line represents a linear fit of the data.
The evolving stable sheet can be modelled as
 \begin{equation}\frac{{{L_S}({t_1})}}{{{D_{onset}}}} = 1 + \sqrt {3W{e_d}} \frac{{{t_1}}}{{{t_c}}}{(1 - \sqrt 3 {t_1}/2{t_c})^2},\end{equation}
where
 \begin{equation}W{e_d} = \frac{{{E_{k,d}}}}{{{E_{k,cm}}}}We.\end{equation}
Here,  ${L_S}$ represents approximate length scale of the sheet (refer to figure 9) and
  ${E_{k,d}}/{E_{k,cm}}$ is the ratio of deformation to propulsion kinetic energies. The Weber number defining the sheet evolution is calculated in the following way. As the nucleated bubbles are not visible at higher irradiation intensities, the Weber number of the droplet characterizing sheet fragmentation is modified as the ratio of drop displacement kinetic energy to its surface energy which is defined as
 \begin{equation}We\sim \frac{{{\rho _L}{D_{onset}}{U^2}}}{{{\sigma _L}}},\end{equation}
where U represents the axial velocity of the sheet. However,  $We$ is rescaled to
  $W{e_d}$ to take into account the kinetic energy that is utilized for deformation. The ratio of deformation to propulsion kinetic energies can be written as
 \begin{equation}\frac{{{E_{k,d}}}}{{{E_{k,cm}}}}\sim \frac{{\int_0^R {u_r^2r\,\textrm{d}r} }}{{{U^2}\int_0^R {r\,\textrm{d}r} }},\end{equation}
where  ${u_r}$ represents radial velocity inside the sheet. The radial velocity can be expressed as,
  ${u_r}\sim r/{t_{max}}$. Here,
  ${t_{max}}$ represents the time taken for the sheet to reach its maximum extension. Integrating equation (3.70), the ratio of deformation to propulsion kinetic energies can be written as
 \begin{equation}\frac{{{E_{k,d}}}}{{{E_{k,cm}}}}\sim \frac{{R_{SM}^2}}{{2{U^2}t_{max}^2}}.\end{equation}
Here,  ${R_{SM}}$ represents the maximum radius of the stable sheet. Therefore,
  $W{e_d}$ can be obtained using (3.68) and (3.71).
3.4.3. Fragmentation of droplets through the formation of unstable sheet
Figure 11 represents the time evolution of the breakup of the polymer droplet into an unstable sheet. Here, the bubble breakup induced thrust force deforms the droplet into a sheet  $({t_1}\sim \, 0.48\ \textrm{ms)}$ which evolves in an unstable manner. The unstable sheet develops pre-holes on it
  $({t_1}\sim 0.56\ \textrm{ms)}$, which subsequently evolve into holes
  $({t_1}\sim \, 0.72\ \textrm{ms)}$. Through hole growth, the unstable sheet finally ruptures
  $({t_1}\sim \, 0.76\ \textrm{ms)}$. The formation of a hole is always preceded by a localized thinning of the sheet, referred to as a pre-hole. The pre-hole to hole transition is evident through the formation of a darker rim surrounding the patch and a vanishing thickness of the inner zone of the patch (see figure 12a).

Figure 11. High-speed image sequence depicting the evolution of a polymer droplet into an expanding unstable sheet followed by pre-hole/hole formation and subsequent rupture of the sheet. This mode of breakup is predominant at  $c/{c^\ast } = 16.6,\,33.3$ and
  ${I^\ast } = 2.2,\,3,\ \textrm{and}\ 3.5$. The scale bar represents 1 mm.

Figure 12. (a) Image sequence depicting the growth of a single pre-hole/hole in an unstable sheet. The scale bar represents 1 mm, (b) Temporal evolution of pre-hole and hole diameter corresponding to several pre-holes and holes. The solid lines in (a) and (b) indicate a linear fit.
Figure 12(a) depicts how a single patch (pre-hole and hole) develops on an unstable sheet. It can be seen that the diameter of the patch  $({D_{patch}})$ increases with time. However, the rate of increase of
  ${D_{patch}}$ in the pre-hole regime is comparatively slow compared with the hole regime. To investigate the evolution of pre-holes and holes in a more detailed way, we have tracked the number of pre-holes and holes on the unstable sheet. Figure 12(b) shows the temporal evolution of several pre-holes and holes on the sheet. Both
  ${D_{prehole}}$ and
  ${D_{hole}}$ vary linearly with time for all the tracked pre-holes and holes on the unstable sheet. As seen in the figure, the slope of the line for
  ${D_{prehole}}$ is comparatively smaller compared with that for
  ${D_{hole}}$, indicating that, even for a broader range of pre-holes and holes, the hole evolution is significantly faster compared with pre-hole evolution. The experimental growth rate of holes is in the range of 0.7–2 m s−1. The growth rate can also be predicted using the Taylor–Culick law (Culick Reference Culick1960), assuming uniform and constant sheet thickness,
 \begin{equation}{V_H}\sim \sqrt {\frac{{2{\sigma _L}}}{{{\rho _L}{h_s}}}} ,\end{equation}
where  ${h_s}$ represents the thickness of the sheet. The theoretical hole growth rate is
  $0({10^0})\ \textrm{m}\ {\textrm{s}^{ - 1}}$, which agrees well with the experimental values.
Figure 13 describes distinct droplet breakup modes observed in the current work, ranging from relatively low strength stable sheet breakup to high strength catastrophic breakup. For sheet type breakup, it is interesting to observe that higher  ${D_{onset}}/{D_0}$ (lower
  $We$) corresponds to stable sheet breakup, whereas lower
  ${D_{onset}}/{D_0}$ (higher
  $We$) corresponds to unstable sheet breakup. As we have seen, the impulse pressure applied on the drop surface due to bubble breakup sets the fluid motion inside the entire drop. The axial velocity
  $(U)$ of the sheet follows from global mass conservation as
 \begin{equation}{P_e}{\tau _e}D_{onset}^2\sim {\rho _L}D_{onset}^3U,\end{equation}
where  ${P_e}$ represents impulse pressure on the droplet due to bubble break up,
  ${\tau _e}$ represents the time scale on which the impulse acts
 \begin{equation}U\sim {P_e} {\tau _e}/{\rho _L}{D_{onset}},\end{equation}
In our experimental study, throughout the ranges of  $c/{c^\ast }$ and
  ${I^\ast }$,
  ${P_e}$,
  ${\tau _e}$ and
  ${\rho _L}$ remain constant. Therefore, (3.74) suggests that axial velocity scales as
 \begin{equation}U\sim 1/{D_{onset}}.\end{equation}
Finally, using (3.69) and (3.75), the dependence of Weber number on  ${D_{onset}}$ can be expressed as
 \begin{equation}We\sim 1/{D_{onset}}. \end{equation}
Equation (3.76) indicates that higher  ${D_{onset}}/{D_0}$ corresponds to a lower Weber number and a stable sheet breakup, whereas a lower
  ${D_{onset}}/{D_0}$ corresponds to a higher Weber number and an unstable sheet breakup. As already seen,
  ${D_{onset}}/{D_0}$ is a function of both
  $c/{c^\ast }$ and
  ${I^\ast }$ (see § 3.3.1). At higher
  $c/{c^\ast }$ and
  ${I^\ast }$, sheet fragmentation of droplets occurs earlier in droplet's lifetime (
 ${D_{onset}}/{D_0}$ is large) compared with lower
  $c/{c^\ast }$ and
  ${I^\ast }$ (
 ${D_{onset}}/{D_0}$ is small). This indicates that high
  $c/{c^\ast }$ and
  ${I^\ast}\ (c/{c^\ast } = 83.3,\,{I^\ast } = 3,3.5)$ corresponds to predominantly stable sheet fragmentation, whereas at low
  $c/{c^\ast }$ and
  ${I^\ast}\ (c/{c^\ast } = 33.3,\,{I^\ast }\, = 3,\, 3.5\ \textrm{and}\,c/{c^\ast } = 16.6,\,{I^\ast } = 2.2,\,3,\,3.5)$ corresponds to unstable sheet fragmentation mechanism dominates. The characteristic ratio of rupture time scale to the capillary time scale in the context of sheet breakup is given as (Klein et al. Reference Klein, Kurilovich, Lhuissier, Versolato, Lohse, Villermaux and Gelderblom2020)
 \begin{equation}\frac{{{t_r}}}{{{t_c}}}\sim {\left( {\frac{{{n_0}}}{{{D_{onset}}}}} \right)^{ - 1}}{(We)^{ - 1}}{\left( {\frac{{{E_{k,d}}}}{{{E_{k,cm}}}}} \right)^{ - 1/4}},\end{equation}
where  ${t_r}$ represents rupture time scale of the sheet,
  ${n_0}/{D_{onset}}$ represents the initial noise level from which the instability grows. The value of
  ${n_0}/{D_{onset}}$ is calculated considering
  ${t_r}/{t_c}\sim 1$, which is found to be of
  $O({10^{ - 2}})$. The ratio of
  ${t_r}/{t_c} > 1$ indicates stable sheet fragmentation of droplets, whereas
  ${t_r}/{t_c} < 1$ represents unstable sheet fragmentation. It shows that the stable sheet collapses before the occurrence of sheet rupture, whereas the unstable sheet ruptures before it collapses, as experimentally depicted in figures 9 and 10.

Figure 13. Regime map representing distinct droplet breakup modes observed in the present work.
4. Conclusions
An experimental investigation is performed to understand the membrane dynamics and atomization phenomena in acoustically levitated polymeric droplets under external radiative heating. The conclusions derived from the present work are as follows:
(i) Depending on laser irradiation intensity and polymer concentration, we have observed four temporal phases: droplet evaporation (phase A), vapour bubble growth followed by bubble induced membrane growth (phase B), membrane rupture (phase C) and droplet breakup (phase D). The time scale for the droplet evaporation phase is
 $O({10^0}\unicode{x2013} {10^1})s$, whereas the combined time scale for the other three phases is $O({10^{ - 4}}\unicode{x2013} {10^{ - 5}})s$.
(ii) For concentrations in the semi-dilute unentangled regime
$1 < c/{c^\ast } \le 10$, we observe smooth evaporation of droplets for all the irradiation intensities. In the semi-dilute entangled regime of polymer concentration $c/{c^\ast } > 10$, the concentration builds up at the interface during evaporation, resulting in the formation of a skin layer, which aids in the nucleation of a bubble at the hot spots due to volumetric heat generation inside the droplet.(iii) The nucleated vapour bubble grows the membrane asymmetrically
$(t/{t_d} < 1)$ or symmetrically $(t/{t_d} > 1)$ depending on the laser irradiation intensity. The growth of the membrane is modelled using a spring—mass--damper system. We discover that the laser irradiation intensity dynamically changes the property of the membrane. Low ${I^\ast }$ results in a shell-like structure, whereas high ${I^\ast }$ results in a viscoelastic membrane structure.(iv) Membrane inflation leads to a decrease in its thickness, eventually rupturing through hole nucleation. The theoretical rupture time scale is
$(O({10^{ - 4}})s)$ obtained using thinning of the film and the experimental rupture time scales $(O({10^{ - 4}})s)$ agree well.(v) Growth and rupture of the membrane is followed by the catastrophic breakup of droplets resulting in the formation of a plethora of fine secondary droplets. The size of the secondary droplets falls in the range of 0.01–0.16 mm, while the velocities are in the range of 1–6 m s−1.
(vi) At significantly high irradiation intensities, two dominant modes of droplet atomization are reported: stable sheet collapse
$({t_r}/{t_c} > 1)$ and unstable sheet breakup $({t_r}/{t_c} < 1)$. The evolution of droplets into a stable/unstable sheet is characterized by universally observed ligament and hole dynamics. The evolution of a stable sheet, time scales involved in the formation of ligaments, stable sheet collapse and unstable sheet rupture closely agree with the established theory.(vii) Finally, it is established that the Weber number is
$O({10^0}\unicode{x2013} {10^3})$, which characterizes the distinct modes of breakup observed in the current study. Furthermore, a regime map is shown to describe the influence of polymer concentration and irradiation intensity on the strength and mode of droplet atomization implicitly.(viii) The difference in evaporation and breakup of polymeric droplets (such as bubble growth-induced breakup or sheet breakup) compared with multicomponent/emulsion/slurry lies in the fact that there is the formation of a skin layer after a period of evaporation which is unique to polymer droplets.


Supplemental material and movies
Supplementary material and movies are available at https://doi.org/10.1017/jfm.2022.894.
Declaration of interests
The authors declare no conflict of interest


