


1. Introduction
The physical transfer of droplets from one solid substrate to an opposing one has been investigated extensively over the past decade. Droplet transfer is typically achieved by lowering the upper substrate onto the top of the droplet to form a bridge and subsequently raising the upper substrate. In some cases, the upper substrate is slowly raised to stretch the bridge quasi-statically (Chen, Amirfazli & Tang Reference Chen, Amirfazli and Tang2013), whereas in other cases the liquid bridge is stretched with an appreciable inertial force (Gat, Navaz & Gharib Reference Gat, Navaz and Gharib2012; Chen, Tang & Amirfazli Reference Chen, Tang and Amirfazli2015). If the wettabilities of the substrates are the same, droplet transfer is limited to approximately 50 % of the droplet's volume (Chen, Tang & Amirfazli Reference Chen, Tang and Amirfazli2014). The extent of droplet transfer can be enhanced by, or limited by, the wettability difference between the two surfaces, with the portion of the droplet transferred increasing as the wettability difference increases (Chen et al. Reference Chen, Tang and Amirfazli2014). The magnitude of each substrate's contact angle hysteresis governs where contact line pinning occurs, which also affects the transfer process (Chen et al. Reference Chen, Tang, Zhao, Law and Amirfazli2016). In an extreme case of a droplet transferring from a nanostructured superhydrophobic substrate to a hydrophilic substrate, nearly the entire droplet volume could transfer without any need to move the substrates (Yan et al. Reference Yan2022).
The ability to transfer a droplet without any relative motion between the substrates is attractive in its simplicity, but raises the question of how to initiate the transfer in the first place. Yan et al. (Reference Yan2022) solved this issue in two different ways. For dispensed droplets, the upper substrate was slowly lowered until it gently contacted the target droplet, at which point the transfer process itself was purely a function of the surface wettabilities. To avoid the motion of the parallel substrates entirely, they bonded one substrate to a cold plate, such that dew droplets nucleated and grew until they could touch the opposing surface. The condensation approach was utilized in bridging-droplet vapour chambers by Edalatpour et al. (Reference Edalatpour, Murphy, Mukherjee and Boreyko2020) and Koukoravas, Damoulakis & Megaridis (Reference Koukoravas, Damoulakis and Megaridis2020), where a wicked evaporator was placed opposite a smooth hydrophobic condenser. This asymmetry in surface wettability enabled one-way heat transfer, i.e. a thermal diode. In the forward mode of operation, continuous phase-change heat transfer was facilitated by the bridging-droplet return of dropwise condensate to the opposing wicked evaporator. The heat source was switched to the hydrophobic surface in the reverse mode, such that condensation is now trapped inside the opposing wick, resulting in an insulating vapour gap. In contrast to the existing studies on the physics of droplet transfer, the receiving surface for the bridging-droplet thermal diode was porous instead of solid. This will fundamentally alter the hydrodynamics of the bridging-droplet transfer process, which to date has not been explored and could be used to further optimize the design.
Here, we study bridging-droplet transfer from a solid substrate to an opposing porous ceramic surface. By virtue of the receiving surface being porous rather than solid, droplet transfer could occur spontaneously with no relative movement of the surfaces required. Systematically varying the substrate wettability, receiving pore size and droplet volume and working fluid, we characterize the various wetting and wicking phenomena that comprise the droplet transfer process. During the initial wetting of the receiving surface, we identify a cross-over from donor-independent behaviour to a donor-dependent regime, where the receding viscous wedge at the donor substrate becomes rate limiting. This is followed by a much longer wicking regime, where the liquid bridge slowly recedes along both surfaces and the wicking rate follows Darcy's law.
2. Materials and methods
The wettability of the solid substrate was varied as either hydrophilic, hydrophobic or superhydrophobic. An untreated silicon wafer with 100 nm of SiO $_2$ (WRS Materials, P2742753) was used as the hydrophilic substrate. Prior to use, the wafers were cleaned by submerging in acetone, isopropyl alcohol and water, followed by drying and 4 min in a plasma cleaner (Plasma Etch Inc., PE-25). The hydrophobic substrate was a silicon wafer that was cleaned in the same manner followed by vapour-phase silanization. This was done by placing the wafer in a Petri dish alongside an open vial of 25
  $\mathrm {\mu }$l of trichloro(1H,1H,2H,2H-perfluorooctyl)silane (Sigma Aldrich) on a hot plate set to
  $70\,^{\circ }$C for 6 h. The superhydrophobic surface was created by thermally dewetting a platinum film on a silicon wafer, creating a non-lithographic etch mask that resulted in nanopillars after dry etching (Boreyko et al. Reference Boreyko, Srijanto, Nguyen, Vega, Fuentes-Cabrera and Collier2013, Reference Boreyko, Polizos, Datskos, Sarles and Collier2014). The nanopillars were then rendered superhydrophobic using the same silane treatment as the hydrophobic surface. The advancing and receding contact angles of the surfaces were measured using the shrink–swell method on a goniometer, with the average of ten measurements being shown in table 1. The porous ceramic surfaces were commercially available and exhibited an average nanopore radius of either
  $r_p \approx 80$ nm (SoilMoisture, 0604D01.5-B15M1) or
  $r_p \approx 800$ nm (SoilMoisture, 0604D01.5-B01M1). As specified by the manufacturer, the porous ceramics exhibited a porosity of
  $\phi \approx 0.33$ for both pore sizes. The advancing and receding contact angles of droplets on the porous disk were not measurable due to the dynamic wicking into the nanopores.
Table 1. Contact angle, advancing contact angle, receding contact angle and contact angle hysteresis of water on the three surfaces used in our experiments. The errors are plus/minus one standard deviation of the measurements.

Side-view imaging that summarizes the experimental set-up is shown in figure 1. A liquid droplet was manually deposited onto one of the solid substrates. The droplet volume was varied as either  $V =0.5\,\mathrm {\mu }$l or
  $5\,\mathrm {\mu }$l, while the choice of working fluid was either distilled water, ethanol or 100 cSt silicone oil (table 2). Three trials were performed using water droplets for each combination of donor substrate wettability, droplet volume and receiving pore radius. Fixing the donor substrate to the hydrophobic wettability, three trials were performed for each combination of working fluid, droplet volume and receiving pore radius.

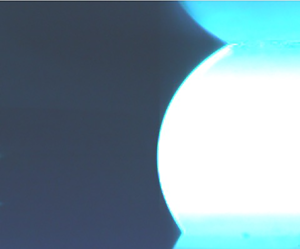
Figure 1. (a) Side-view photograph of a sessile droplet with a static contact angle  $\theta$, just prior to bridging into an overlying porous surface. The porous roof, false coloured to enhance visibility, was slowly lowered until the gap height (
 $h$) matched the height of the droplet. (b) During the bridging process, relevant parameters include the contact radii for the donor and receiving surfaces,
  $r_d$ and
  $r_r$, respectively, the contact angles for the donor and receiving surfaces,
  $\theta _d$ and
  $\theta _r$, respectively, and the height of the gap,
  $h$, which is fixed during the bridging process and equal to the height of the droplet before bridging.
Table 2. Physical characteristics of the liquids used in our experiments.

After the droplet was deposited, an overlying porous ceramic disk was slowly lowered using a linear manual translation stage. The velocity of the disk can be estimated from the high-speed videos and, while not inherently controlled, was significantly slower than any wetting and was stopped after wetting started. The disk was lowered until it touched the top of a droplet of height  $h$ (figure 1a). The disk was stopped as soon as it was observed to touch the droplet. Slowly lowering the roof can be considered analogous to the real-life scenario of a vapour chamber (Edalatpour et al. Reference Edalatpour, Murphy, Mukherjee and Boreyko2020), where the dew droplets would continually grow until touching the static roof. The speed at which the porous disk was lowered was orders of magnitude slower than the resulting bridging hydrodynamics, which was captured using side-view high-speed imaging (Phantom v711). The primary benchmarks captured by the camera were the evolution of the donor contact radius (
 $r_{d}$), donor contact angle (
 $\theta _{d}$), receiving contact radius (
 $r_{r}$) and receiving contact angle (
 $\theta _{r}$). To ensure consistency, the porous disk was laterally repositioned between trials to ensure the pores above the bridging droplet were initially dry. As will be shown later, the wicking behaviour can be assumed to be one-dimensional, resulting in the wetted area of the porous media for each trial being approximately the same as the footprint of each droplet. The porous disk was repositioned so that each trial would have a full droplet diameter separating its part of the disk from any other trials. Wetted porous media were outside the scope of this work. The humidity was not controlled, as the water and surfaces were the same temperature as the room and the evaporation of the droplet would take significantly longer than the absorption for ambient conditions. The bridging hydrodynamics of the deposited droplets is expected to be equivalent to condensed droplets for the hydrophilic and hydrophobic substrates. For the nanostructured superhydrophobic substrate, dew droplets are known to inflate in an imperfect Cassie state (Miljkovic, Enright & Wang Reference Miljkovic, Enright and Wang2012), such that they would exhibit a slightly larger contact angle hysteresis compared with the deposited droplets used here.
3. Visualization of droplet bridging
In the first set of experiments, the high-speed camera was set to a relatively slower capture rate in order to film the entire bridging-droplet process. These videos showed that the bridging can be divided into an initial wetting regime and a subsequent wicking regime (figures 2 and 3). During the wetting regime, the top of the droplet touches the receiving porous surface to grow an additional contact line, while the donor contact line eventually recedes. The wetting regime begins at first contact with the receiving surface and ends when the droplet has reached a new equilibrium shape. During the wicking regime, the droplet's volume transfers to the inside of the porous receiving surface, aside from the pinched-off droplet that remains on the donor surface. The wicking regime begins at the end of the wetting regime and ends when all of the liquid on the receiving surface has been sucked into the wick.

Figure 2. High-speed imaging of the bridging process for water droplets, where the donor substrate was (a) hydrophilic (HPL), (b) hydrophobic (HPB) or (c) superhydrophobic (SHPB). The first row of each trial depicts the wetting regime, while the second row shows the subsequent wicking regime. See supplementary movies 1 and 2 available at https://doi.org/10.1017/jfm.2022.721. (a) Water,  $V = 0.5\,\mathrm {\mu }{\rm l}$, HPL,
  ${r_p = 800}$ nm. (b) Water,
  $V = 0.5,\mathrm {\mu }{\rm l}$, HPB,
  $r_p = 800$ nm. (c) Water,
  $V = 0.5\,\mathrm {\mu }{\rm l}$, SHPB,
  $r_p = 800$ nm.

Figure 3. High-speed imaging of the droplet bridging process, where the working fluid, droplet volume and pore radius were all varied. See supplementary movies 3 and 4. (a) Ethanol,  $V = 0.5\,\mathrm {\mu }{\rm l}$, HPB,
  $r_p = 800\,{\rm nm}$. (b) Si oil,
  $V = 0.5\,\mathrm {\mu }{\rm l}$, HPB,
  $r_p = 800\,{\rm nm}$. (c) Water,
  $V = 5\,\mathrm {\mu }{\rm l}$, HPL,
  $r_p = 800\,{\rm nm}$. (d) Water,
  $V = 0.5\,\mathrm {\mu }{\rm l}$, HPL,
  $r_p = 80\,{\rm nm}$.
Figure 2(a) shows a droplet bridging from a HPL silicon substrate to a porous ceramic surface with an effective pore radius of 800 nm. The first row of images depicts the wetting regime, which culminates in a fairly symmetric liquid bridge due to the similar contact angles of both surfaces. The second row of images shows the wicking regime, where the liquid bridge gradually recedes along both surfaces as the water is sucked into the wick. Eventually, the quasi-steady bridge shape becomes unstable, where the neck radius rapidly decays and then splits into two droplets, one on each surface. Upon becoming unstable, the bridge took approximately  $\sim$1 ms to pinch-off, which is comparable to the capillary–inertial time scale as has been previously reported (Qian & Breuer Reference Qian and Breuer2011). The upper droplet then continues to wick inside of the porous ceramic, exhibiting a constant contact diameter throughout, until it is entirely absorbed. The lower droplet survives indefinitely in the absence of evaporation. There is a vast disparity in time scales between the two regimes, for example here the wetting regime lasted
  $t_{wet} \sim$ 1 ms while the wicking regime lasted
  $t_{wick} \sim$ 100 ms.
When switching the donor substrate to smooth HPB silicon, shown in figure 2(b), the wetting and wicking regimes were still observed but with some important differences. During wetting, the liquid bridge shape was no longer symmetric, as the receiving contact diameter grew to be much larger than the HPB donor one. This, in turn, resulted in the immediate pinch-off of the liquid bridge as the wetting regime switched to the wicking regime. Consequently, the entire wicking regime was comprised of pumping water from a constant-diameter droplet, as opposed to the previous case where the liquid bridge persisted for the majority of the wicking. Finally, when using a SHPB donor substrate in figure 2(c), the entire droplet was able to dewet and transfer to the ceramic during the wetting regime. In other words, there was no pinch-off event at all, such that 100 % of the initial droplet was able to absorb into the ceramic during the wicking regime.
While figure 2 varied the wettability exclusively, figure 3 varies the working fluid, droplet volume and the pore size of the receiving surface. In figure 3(a), an ethanol droplet was used in place of a water droplet to decrease the surface tension by a factor of approximately 3.5. This resulted in longer time scales for both the wetting and wicking regimes, as evidenced by the time stamps. Otherwise, the bridging and pinch-off hydrodynamics was qualitatively consistent with that of the water droplet. When switching the working fluid once again to silicone oil (figure 3b), the viscosity is increased by nearly two orders of magnitude compared with water or ethanol (while the surface tension is comparable to ethanol). As a consequence, the duration of the wetting regime increased by approximately two orders of magnitude to  $t_{wet} \sim 100$ ms, while the wicking regime increased by four orders of magnitude to
  $t_{wick} \sim 1000$ s. Returning to a water droplet, figure 3(c) used a
  $5\,\mathrm {\mu }$l volume instead of
  $0.5\,\mathrm {\mu }$l. Intuitively, this increased the durations of both wetting and wicking, as the droplet had to grow a larger receiving contact line for the former and pump a greater volume for the latter. Finally, figure 3(d) decreased the pore radius of the receiving surface by an order of magnitude. This did not substantially affect the external spreading of the droplet during the wetting regime, but did increase the wicking time scale by one order of magnitude. As will be seen in the next section, this is due to a combination of an order of magnitude increase in the capillary pressure and a two order of magnitude decrease in the permeability.
The evolution of the donor contact radius, the receiving contact radius, the donor contact angle and the receiving contact angle are graphed in figure 4. The contact radii for each timestamp were calculated by using an edge finding program for each frame to get the shapes and positions of the bridge interfaces. Using the two sides of the bridge, the program is able to find each of the contact radii for each frame as well as any needed curvatures for the Laplace pressures or any instantaneous slopes for contact angles. All length measurements have resolutions between 4 and 10  $\mathrm {\mu }$m due to the pixel size and slightly differing zooms used between trials. Each trial appears to have some lag between the wetting and wicking regimes, where the receiving radius is no longer increasing but is not yet decreasing. This intermediate state is especially apparent for the silicone oil trials, where the radii could be fixed for nearly 1000 s before finally decreasing. This apparent stasis is actually the initial portion of the wicking regime, as the receiving contact angle has to decrease from the advancing angle (during the wetting regime) to the receding angle. The contact angle data in the graphs on the right side do not reflect this, remaining surprisingly constant during the period of stasis in the contact radii. We surmise that this is because the apparent angles are being measured, rather than the actual local contact angles on the surface. This is supported in particular by the extremely high contact angles in figure 4( f) during initial spreading, which are well above the expected advancing contact angle of a HPL porous disk. While figure 4 contains a large amount of raw data, the relative time scales and differences between the apparent and local contact angles. The apparent advancing angle of the receiving surface varies from less than
  $25^{\circ }$ to over
  $150^{\circ }$, while the apparent receding angle varies from less than
  $20^{\circ }$ to over
  $60^{\circ }$, depending on the parameters of the experiment. This difference is not likely caused by an error in the image analysis program, as the only angle that can be discerned from the image is the apparent angle (see figure S1 in the supplementary material available at https://10.1017/jfm.2022.721). Rather, it is likely that the apparent angle is modified by the curvature and mass requirements of the liquid bridge. This is somewhat analogous to how multiple apparent and receding angles are observable with inertial contact lines, for example a sphere rapidly sinking past an interface (Kim et al. Reference Kim, Fezzaa, An, Sun and Jung2017). While there should be only one true value each for the advancing and receding angles immediately at the surface, this was not observable with our set-up.

Figure 4. Evolving contact radii and contact angles over the entirety of the droplet bridging process. Each trial is shown as two data series, triangles for the donor radius or contact angle and circles for the receiving radius or contact angle. (a,b) The wettability of the donor substrate and (c,d) working fluid were varied for a  $V =0.5 \,\mathrm {\mu }$l droplet and a receiving pore size of
  $r_{p} =800$ nm. (e, f) The droplet volume and pore radius were changed, for a HPB donor substrate using silicone oil as the working fluid. The measurements of the contact radii are graphed in (a,c,e) while the measurements of apparent contact angles are graphed in (b,d, f).
4. High-speed imaging of droplet wetting regime
In the first set of experiments, only a few frames were captured that corresponded to the wetting regime, due to the much longer duration of the wicking regime. Across all trials, the time duration of the wetting regime did not agree with any singular capillary-driven time scale. The capillary–inertial time scale,  $t_{ci} \sim \sqrt {\rho R^3 / \gamma }$, is in the range
  $t_{ci} \sim 1\unicode{x2013}100$ ms depending on the droplet's volume and working fluid. This time scale dominates over the visco-capillary time scale,
  $t_{vc} \sim \mu R/ \gamma$, which is in the range
  $t_{ci} \sim 0.1\unicode{x2013}1$ ms. In our case,
  $R$ corresponds to the radius of curvature of the droplet prior to the onset of bridging;
  $R$ is found using
  $R = (3 V / ({\rm \pi} ( 2 + \cos {\theta })(1 - \cos {\theta })^2))^{1/3}$, where the volume and contact angle of the droplet before bridging were known. When graphing the experimental wetting time scale against the capillary–inertial time scale, it can be seen that this single correlation does not agree across the entire range of conditions (figure 5). This indicates that the wetting regime is likely comprised of multiple sub-regimes, such that a higher temporal resolution would be fruitful for correlating experiments and theory.

Figure 5. The experimental time scale for the wetting regime, vs the capillary–inertial time scale. The poor agreement motivates the more detailed modelling of the wetting regime, splitting it into donor-independent and donor-dependent sub-regimes.
To better resolve and model the hydrodynamics of the wetting regime, a second set of experiments was performed at a much higher frame rate to exclusively image the wetting regime. The results of the second set of experiments are graphed in figure 6. For silicone oil droplets, the receiving contact radius,  $r_r(t)$, initially followed a power law of unity with respect to time (figure 6a,b). In contrast, droplets composed of water or ethanol appeared to initially follow a 1/2 power law (figure 6c,d). In both cases, the initial power law growth transitioned to a slower growth rate that no longer exhibited a constant power law. This transition was observed to occur when the diameter of the receiving contact line approached the same magnitude as the height of the gap. It was also observed that the donor contact line began receding at the same time as this transition. Therefore, we hypothesize that the two sub-regimes observed during wetting can be conceptualized as a donor-independent regime followed a donor-dependent regime. The exception is the case of water droplets transferring from a SHPB substrate, in which case early pinch-off precludes the donor-dependent regime entirely. The donor-dependent regime can be abbreviated for water droplets transferring from a HPB substrate, as pinch-off tends to occur in the midst of the regime.

Figure 6. Receiving contact radii vs time during the wetting regime. (a,b) Silicone oil droplets bridging from a HPB substrate, for various droplet volumes and receiving pore radii. (c,d) Water and ethanol droplets, of varying volume and donor wettability, bridging into  $r_{p} =800$ nm pores; (a,c) are dimensional expressions of the receiving contact radius, whereas (b,d) are normalized by the gap height. During the first portion of the wetting process,
  $r_{r}$ follows the scaling laws for droplet coalescence: (b) the mass-limited viscous regime (5.3) and (d) the capillary–inertial regime (5.4). Here,
  $t_{cross}$ is the cross-over time between the donor-dependent and donor-independent regimes, which occurs when
  $r_{r} \approx h$. The donor-dependent regime does not follow the same scalings, resulting in the divergence between the model and experiments when
  $t > t_{cross}$ and
  $r_r > h$.
5. Modelling and analysis
This system is difficult to model due to the lack of a characteristic (i.e. controlled) velocity. Previous studies of solid-to-solid droplet transfer used a moving receiving surface with a given velocity (Chen et al. Reference Chen, Amirfazli and Tang2013, Reference Chen, Tang and Amirfazli2014, Reference Chen, Tang and Amirfazli2015), while studies of spreading on porous surfaces controlled the droplet's impact velocity and were simulations. As this experiment lacks a moving substrate or droplet impact, a different approach had to be taken. All of the velocities of the system are driven by differences in Laplace pressures. Previous works on the spreading of a droplet on a porous surface revealed that when the droplet is much larger than the pores, there is a substantive disparity in the spreading velocity vs the (approximately one-dimensional) wicking velocity (Alleborn & Raszillier Reference Alleborn and Raszillier2004; Frank & Perré Reference Frank and Perré2012; Fu et al. Reference Fu, Li, Wang and Wu2019). As such, we use two separate non-dimensional parameters to help begin modelling the system.
The Ohnesorge number,  $Oh$, is the ratio of capillary–inertial and viscocapillary velocities
 \begin{equation} Oh=\frac{v_{CI}}{v_{VC}}=\frac{\mu}{\sqrt{\rho \gamma R}}, \end{equation}
where  $Oh>1$ indicates that the capillary–inertial velocity is faster, such that the viscocapillary interactions are rate limiting. The roles are flipped for
  $Oh<1$, resulting in capillary–inertial interactions being dominant for wetting. For these experiments, the values for
  $Oh$ range from
  $10^{-2.5}$ to 1, indicating that the primary wetting dynamics could potentially be approximated as capillary–inertial.
The coupling parameter,  $CP$, is the ratio of the (capillary–inertial) wetting speed to the wicking speed
 \begin{equation} CP=\frac{v_{CI}}{v_{Darcy}}=\frac{\sqrt{\gamma /\rho R}}{\dfrac{\phi^2 r_{p} \gamma}{4 \mu \tau R (1 - \cos{\theta_{r}})}}, \end{equation}
where  $\tau$ is the tortuosity of the porous ceramic, defined as the ratio of actual distance travelled in a porous medium to the straight line distance between the beginning and end points of the flow front (i.e.
  $\tau \ge 1$). For these experiments,
  $CP$ values ranged from
  $10^{3.5}$ to
  $10^{4.5}$, indicating that wetting occurs significantly faster than wicking, allowing the system to be analysed as if it is decoupled. In other words, we approximate the wetting regime as occurring prior to the wicking regime. Treating the regimes as sequential is further justified by the high-speed imaging of the bridging process, where the contact lines moved very quickly to their equilibrium position, stopped and then later adjusted slowly as the fluid wicked into the porous disk.
5.1. Donor-independent wetting regime
The initial donor-independent regime lasts from  $r_r(t = 0) =0$ until
  $r_r(t_{cross}) \approx h$, where
  $r_r(t)$ is the contact radius on the receiving porous surface and
  $t_{cross}$ is the cross-over time to the donor-dependent regime. The mechanism for this transition is the donor contact line's sudden onset of receding at
  $r_r \approx h$, which is required by conservation of mass in order for the receiving contact line to continue advancing. The power laws observed for
  $r_r \sim t^\alpha$ in the donor-independent regime, of
  $\alpha \approx 1/2$ and 1, correspond to the previously reported scaling laws for early contact line growth after gentle deposition on a HPL surface (Biance, Clanet & Quéré Reference Biance, Clanet and Quéré2004; Mitra & Mitra Reference Mitra and Mitra2016) and neck growth during droplet coalescence (Eggers, Lister & Stone Reference Eggers, Lister and Stone1999; Paulsen, Burton & Nagel Reference Paulsen, Burton and Nagel2011; Paulsen et al. Reference Paulsen, Burton, Nagel, Appathurai, Harris and Basaran2012). This similarity between droplet deposition and coalescence is due to the sharp curvature generated in either case. This sharp curvature is similarly observed here during the donor-independent regime.
The receiving contact radius, initially grows in a viscocapillary (VC) regime (Paulsen et al. Reference Paulsen, Burton, Nagel, Appathurai, Harris and Basaran2012):
 \begin{equation} r_r(t) = \beta_{VC}\frac{\gamma}{\mu} t, \end{equation}
where  $\beta _{VC}$ is a numerical pre-factor using the best-fit value of a power law intercept for a given exponent. This regime is defined by the ultra-small neck radius, which limits the flow rate into the neck and increases the resisting viscous stress. The silicone oil droplets were observed to follow the power law of 1 from (5.3), indicating that early growth of
  $r_r(t)$ follows the VC regime. This was confirmed by non-dimensionalizing
  $r_r(t)$ in figure 6(b) using
  $t/t_{cross}$ and
  $r_r/h$, where
  $t_{cross} =h\mu /(\beta _{VC} \gamma )$ and
  $h$ are the cross-over time and radius, respectively. All data corresponding to the donor-independent regime effectively collapsed onto a master curve of
  $r_r/h \approx t/t_{cross}$ when the respective trials were fitted with
  $\beta _{VC} =0.1$ (5
  $\mathrm {\mu }$l Si oil droplets,
  $r_p \approx 800$ nm),
  $\beta _{VC} =0.08$ (5
  $\mathrm {\mu }$l Si oil droplets,
  $r_p \approx 80$ nm),
  $\beta _{VC} =0.15$ (0.5
  $\mathrm {\mu }$l Si oil droplets,
  $r_p \approx 800$ nm) and
  $\beta _{VC} =0.07$ (0.5
  $\mathrm {\mu }$l Si oil droplets,
  $r_p \approx 80$ nm) values. As (5.3) already has the VC velocity included in it, the
  $\beta _{VC}$ values are purely fitting factors, which will also be true for the
  $\beta$ values used for (5.4). This results in a universal cross-over from the VC regime to the donor-dependent regime occurring at
  $t/t_{cross} \approx 1$ and
  $r_r/h \approx 1$. We expect the slight variation in
  $\beta _{VC}$ with
  $r_p$ is due to the differences in effective surface roughness mildly, but not substantially, affecting the wetting.
We expect the water and ethanol trials shown in figure 6(c) similarly started in the VC regime, but it was not observed due to its short duration ( $\sim$100 ns) at low Ohnesorge numbers. In the absence of a viscous outer fluid (Paulsen et al. Reference Paulsen, Carmigniani, Kannan, Burton and Nagel2013), the VC regime universally transitions into the capillary–inertial regime
 \begin{equation} r(t) = \beta_{CI}\left(\frac{\gamma R}{\rho}\right)^{1/4} t^{1/2}, \end{equation}
where  $\beta _{CI}$ is a numerical pre-factor and
  $R$ is the initial radius of the droplet. The data were again non-dimensionalized using
  $t/t_{cross}$ and
  $r_r/h$, where now
  $t_{cross} =(h/\beta _{CI})^2[\rho /(\gamma R)]^{1/2}$. This collapsed all experimental data for the donor-independent regime onto a universal curve of
  $r_r/h \approx (t/t_{cross})^{1/2}$ when using
  $\beta _{CI} =0.7$ (0.5
  $\mathrm {\mu }$l water droplets on a HPL substrate),
  $\beta _{CI} =1.4$ (0.5
  $\mathrm {\mu }$l water, HPB),
  $\beta _{CI} =0.68$ (0.5
  $\mathrm {\mu }$l water, SHPB),
  $\beta _{CI} =1.22$ (5
  $\mathrm {\mu }$l water, HPL) and
  $\beta _{CI} =1.32$ (5
  $\mathrm {\mu }$l ethanol, HPB). Cross-over from the capillary–inertial regime to the donor-dependent regime once again occurred at
  $t/t_{cross} \approx 1$ and
  $r_r/h \approx 1$, validating that the capillary–inertial scaling law is in excellent agreement with these experimental trials during this regime. While the silicone oil droplets in figure 6(b) would hypothetically also transition to the capillary–inertial regime eventually, this could not happen in our context due to the earlier transition to the donor-dependent wetting regime, which will now be discussed.
5.2. Donor-dependent wetting
For  $r_r > h$, the kinetics of the receding contact line are rate limiting to the wetting process, rather than the kinetics of the advancing contact line. This cross-over is forced by conservation of mass as the flow field grows within the droplet. The dimensions of the flow field in the donor-independent regime scale as
  $dz \sim r_r$ (where
  $dz$ is the height of the advancing neck on the receiving surface) for both the VC and capillary–inertial regimes. This scaling stems from the neck being much smaller than the size of the droplet:
  $r_r \ll R$. The evolving shape of the droplet visibly shows the growth of this flow field as mass is pulled from the sessile profile inwards, up and then out towards the advancing contact line, allowing a trace of the height of the flow field,
  $dz$, during the wetting process. This scaling breaks down when the height of the flow field matches the height of the gap,
  $dz = h$, as
  $dz$ can no longer grow but
  $r_r$ continues to grow and
  $r_d$ starts shrinking, transitioning from donor independent to donor dependent. The need to recede the donor contact line,
  $r_d$, acts as a new resistance, causing the transition at
  $r_r \sim h$. The SHPB cases do not exhibit donor-dependent behaviour as it is energetically favourable for those cases to pinch off. This is true for some of the HPB cases as well, which appear to produce bridge shapes very close to instability. This pinch-off is encouraged by the difference in contact angles between the donor and receiving surfaces, resulting in a large disparity in contact radii as well as the larger
  $h$ values that result from higher initial contact angles on the donor surface. In regards to necking when it does occur in wetting, the larger the contact angle of the droplet on the donor surface, the closer the pinch-off point gets to the donor surface. An initial value of
  $\theta \geq 90$ results in the necking occurring at the surface, usually resulting in skipping the donor-dependent regime entirely.
This donor-dependent wetting regime does not appear to have any clean scaling law, as supported by the constantly evolving power law slope in figure 6. We hypothesize that this messiness is due to the driving force now being a change in Laplace pressure across the entire liquid bridge ( $\Delta P_{adv} - \Delta P_{rec}$), as opposed to the donor-independent regime where the dominant capillary force was entirely localized at the advancing contact line's neck. It is non-trivial to predict the global change in Laplace pressure across the liquid bridge, as the variance in pressure across the liquid bridge renders its shape unsteady in the absence of contact line pinning. This, in turn, makes the bridge profile indeterminate, even if the contact angles and radii are known. The dominant resisting force is not readily apparent, as it could alternately be inertial (
 $\Delta P_{\rho }$) or viscous (
 $\Delta P_{\mu }$) in nature. To further complicate the picture, the viscous resistance could either be global (across the entire bridge) or local (within the receding wedge).
Assuming the driving force is indeed the global change in Laplace pressure across the liquid bridge, the governing stress balance is  $\Delta P_{adv} - \Delta P_{rec} \approx \max (\Delta P_{\rho }, \Delta P_{\mu,{global}}$,
  $\Delta P_{\mu,{local}})$, where
  $\Delta P_{adv}$ is the Laplace pressure at the bridge's advancing contact line on the receiving surface,
  $\Delta P_{rec}$ is the Laplace pressure at the bridge's receding contact line on the donor substrate and the right-hand side is governed by whichever resisting pressure drop is largest. Due to the aforementioned indeterminate shape of the liquid bridge, the evolving magnitudes of
  $\Delta P_{adv}$ and
  $\Delta P_{rec}$ had to be modelled semi-empirically, rather than using a single function for each of the pressures or the difference in the pressures that changes with respect to time, which is also true for the donor contact radius. Specifically, the radii of curvature at the advancing and receding contact lines were measured from the high-speed videos using a custom-made image analysis program. The radii of curvature at both the top and bottom of the bridge were then substituted into the Laplace pressure equation,
  $\Delta P = \gamma [(1/R_1)+(1/R_2)]$, to determine
  $\Delta P_{adv} - \Delta P_{rec}$. For all trials that exhibited donor-dependent wetting, we measured
  $\Delta P_{adv} - \Delta P_{rec} \sim$ 1–10 Pa over the vast majority of the regime.
Hypothetically assuming inviscid flow across the liquid bridge and ignoring hydrostatic effects, the inertial resistance can be approximated using Bernoulli's equation. Specifically,  $\Delta P_{\rho } \approx (\rho /2)(v_{r}^2 - v_{d}^2)$, where
  $v_{r}$ and
  $v_{d}$ are the average flow velocities across the liquid bridge near its top and bottom, respectively. The donor-dependent regime always begins at
  $r_r \approx h$, such that
  $r_{d} \sim r_{r}$ (i.e. the contact areas of the liquid bridge are commensurate). The aforementioned exception is the early pinch-off that occurs for water on SHPB substrates, which bypasses the donor-dependent regime entirely, and to a lesser extent for water on HPB substrates, where the donor-dependent regime is abbreviated. By conservation of mass, a natural consequence of
  $r_{d} \sim r_{r}$ is that the velocity of the receding contact line scales with that of the advancing one during the donor-dependent regime,
  $\dot {r}_d \sim \dot {r}_r$. By extension, the flow velocity across the liquid bridge scales with
  $v_{d} \sim \dot {r}_d$ near the bottom and by
  $v_{r} \sim \dot {r}_r$ at the top. This results in
  $\Delta P_{\rho } \sim$ 0, i.e. the inertial resistance is vanishingly small. Plugging experimental measurements of
  $\dot {r}_d$ and
  $\dot {r}_r$ into the Bernoulli equation validates this scaling argument, as this results in
  $\Delta P_{\rho }$ values that are three orders of magnitude smaller than the corresponding driving pressure of
  $\Delta P_{adv} - \Delta P_{rec}$. For example, for a 0.5
  $\mathrm {\mu }$l water droplet transferring from a HPL substrate to a
  $r_p \approx 800$ nm porous surface, we measure
  $\dot {r}_d \approx 2.5\times 10^{-3}\,{\rm m}\,{\rm s}^{-1}$ and
  $\dot {r}_r \approx 3.5\times 10^{-3}\,{\rm m}\,{\rm s}^{-1}$ at
  $t = t_{cross} +10$ ms. Still presuming that
  $v_{d} \sim \dot {r}_d$ and
  $v_{r} \sim \dot {r}_r$, Bernoulli results in
  $\Delta P_{\rho } \approx 0.006$ Pa, which is significantly smaller than
  $\Delta P_{adv} - \Delta P_{rec} \approx 8.32$ Pa. We can therefore assume that the dominant pressure drop is viscous in nature and that the assumption of inviscid flow is not valid.
The bulk viscous stress was modelled as laminar pipe flow. To be conservative, the viscous pressure drop was maximized by assuming zero slip at the free interface and setting the pipe radius to the minimum neck radius of the bridge ( $r_{min}$). This resulted in a Poiseuille pressure drop,
  $\Delta P_{\mu, {global}}$, that was two orders of magnitude smaller than the difference in Laplace pressures,
  $\Delta P_{adv} - \Delta P_{rec}$. For the same example of a 0.5
  $\mathrm {\mu }$l water droplet transferring from a HPL substrate to a
  $r_p \approx 800$ nm porous surface, we obtain
  $\Delta P_{\mu, {global}} \approx 8\mu h \dot {r}_r/r^2_{min} \approx 0.036$ Pa at
  $t = t_{cross} +$ 10 ms. This is again much smaller than
  $\Delta P_{adv} - \Delta P_{rec} \approx 8.32$ Pa, indicating that the bulk viscous stress is similarly insufficient to be rate limiting.
Finally, a local viscous resistance accounts for the small length scale of the receding wedge. Previous reports have scaled the stress of a receding viscous wedge as  $P_{\mu, {local}} \sim \mu \dot {r}_{d}/h_\mu$ (Snoeijer & Andreotti Reference Snoeijer and Andreotti2013; Daniel et al. Reference Daniel, Timonen, Li, Velling and Aizenberg2017; Keiser et al. Reference Keiser, Keiser, Clanet and Quéré2017), where
  $\dot {r}_{d}$ is the wedge velocity and
  $h_\mu$ is the effective height of the viscous wedge (typically a semi-empirical fitting factor). When choosing an effective wedge height of order
  $h_\mu \sim 1\unicode{x2013}10\,\mathrm {\mu }$m for water and plugging in the measured wedge velocity of
  $\dot {r}_{d} \sim 0.1$ m s
 $^{-1}$, we obtain
  $P_{\mu, {local}} \sim 1\unicode{x2013}10$ Pa
  $\sim (\Delta P_{adv} - \Delta P_{rec})$. Therefore, for a choice of
  $h_\mu \sim 1\unicode{x2013}10\,\mathrm {\mu }$m that is consistent with previous reports, the local viscous wedge is dominant over the global inertial or viscous stresses and matches the magnitude of the driving capillary stress (figure 7). The governing equation for donor-dependent wetting is therefore given by
 \begin{equation} (\Delta P_{adv} - \Delta P_{rec})(t) \approx \dfrac{\mu \dot{r}_{d}(t)}{h_\mu}. \end{equation}
Figure 7. Conceptual overview of the donor-dependent wetting regime. The driving force for wetting is an asymmetric Laplace pressure caused by a mismatch in curvatures (a). Wetting is rate limited by a local viscous dissipation near the receding contact line (b).
Equation (5.5) is not fully predictive, given that the precise value of  $h_\mu$ is unknown. For this reason, we use (5.5) to predict semi-empirical values of
  $h_\mu$ over the donor-dependent wetting regime. First, we calculate
  $\dot {r}_{d}$ and
  $\Delta P_{adv} - \Delta P_{rec}$ from each frame of the donor-dependent regime from an experimental video, assuming that these values are roughly constant across the time interval to the subsequent frame. Then, using those values and (5.5), we calculate a value for
  $h_\mu$ for each frame, plotting them in figure 8. The values for
  $h_\mu$ could vary substantively at low values of
  $t - t_{cross}$, where there is a transition from the donor-independent regime coming to an end and the donor-dependent regime beginning. This was especially true for the case of silicone oil. Usually, the order of magnitude of
  $h_\mu$ then stayed roughly constant for the stable duration of the donor-dependent regime, with
  $h_\mu \sim 1\,\mathrm {\mu }$m or
  $h_\mu \sim 10\,\mathrm {\mu }$m depending on the set of conditions. Sudden variations could occur again at the end of the donor-dependent wetting regime (
 $\Delta P_{adv} - \Delta P_{rec} \approx 0$), either due to pinch-off occurring or the wetting achieving its equilibrium state. The magnitude of
  $h_\mu$ being relatively stable in the midst of the donor-dependent wetting regime supports the idea that the two competing pressures controlling the donor contact radius are the global mismatch in Laplace pressure and the local viscous wedge resistance. As an alternative approach, a single best-fit value of
  $h_\mu$ can be chosen for a given trial that no longer varies in time. With this approach, the experimental and (semi-empirical) calculated curves for
  $\dot {r}_{d}(t)$ now differ from each other and can be compared (see figure S2 in the supplementary material).

Figure 8. Viscous wedge heights for the receding contact line during the donor-dependent wetting regime, calculated from (5.5) using measurements of the Laplace pressures and contact line velocity. Time is defined as  $t - t_{cross}$, where
  $t_{cross}$ is the estimated duration of the preceding donor-independent wetting regime. Four cases are shown with different parameter sets: (a) water, 0.5
  $\mathrm {\mu }$l, HPL, (b) water, 5
  $\mathrm {\mu }$l, HPB, (c) ethanol, 5
  $\mathrm {\mu }$l, HPB and (d) Si oil, 0.5
  $\mathrm {\mu }$l, HPB.
5.3. Wicking regime
Droplet transfer enters the wicking regime when both contact lines have stopped moving. In most cases, droplets had to complete both the donor-independent and donor-dependent wetting regimes for this to be the case. However, for water droplets transferring from the SHPB or HPB surface, the wetting process ended in the midst of the donor-independent (SHPB) or donor-dependent (HPB) wetting regimes due to pinch-off occurring. Also note that wicking was occurring during the wetting regime itself; however, it did not appreciably affect the evolution of the liquid bridge due to the wicking process being much slower than wetting (figure 4).
Over our parameter space, the pore radius of the receiving surface is much smaller than the gap height between surfaces ( $r_p \ll h$). The droplet volume's gradual migration into the wick can therefore be modelled using Darcy's law, (5.6) (Bear Reference Bear1988)
 \begin{equation} v_{wick} \sim \kappa \boldsymbol{\nabla}{P}, \end{equation}
where  $v_{wick}$ is the wicking velocity and
  $\kappa = \phi r_p^2/8 \mu \tau$ is the fluid permeability of the porous surface (Gruener et al. Reference Gruener, Hofmann, Wallacher, Kityk and Huber2009). As will be detailed later in the manuscript, a numerical model accurately captured the wicking rate for tortuosity values of
  $\tau \approx 2$ for the
  $r_p \approx 80$ nm ceramic surface and
  $\tau \approx 1.5$ for the
  $r_p \approx 800$ nm ceramic. We note that
  $\tau \le 2$ is not typical for random porous media; therefore, the best-fit values for
  $\tau$ obtained here are assumed to be encompassing a fitting factor that accounts for various uncertainties in the porosity and wettability of the ceramic. The pressure gradient can be expressed in terms of the Laplace pressure of the menisci within the pores,
  $2\gamma /r_p$, divided by the wicking length scale required to fully accommodate the volume of the droplet,
  $L = R_c(1-\cos {\theta _r}) / \phi$. Note that
  $R_c$ is the characteristic radius of curvature of a hypothetical droplet wetting the outside of the porous ceramic prior to wicking, where
  $\theta _r \approx 30^\circ$ is a typical equilibrium contact angle of a droplet on the ceramic. The value for
  $R_c$ is found by volume conservation,
  $R_c = (3 V / ({\rm \pi} ( 2 + \cos {\theta _r})(1 - \cos {\theta _r})^2))^{1/3}$, where
  $V$ is the known droplet volume prior to the bridging process occurring. This results in a wicking velocity for a given droplet of
 \begin{equation} v_{wick} = \frac{\phi r_p \gamma}{4 \mu \tau L}. \end{equation}
This nonlinear velocity profile is consistent with Washburn's law and Darcy's law, as  $L$ is the distance that has to be wicked for total absorption. Finally, using
  $v_{wick}=\dot {L}$, (5.7) can be solved as an ordinary differential equation, resulting in the following total time for wicking of an entire droplet:
 \begin{equation} t_{wick} = \dfrac{2 \mu \tau L^2}{\phi r_p \gamma}. \end{equation}
 Figure 9 compares the experimentally measured duration of the wicking regime against (5.8). Time zero is defined as the transition from the wetting regime to the wicking regime. The end of wicking is defined as when the last visible portion of the liquid wicks inside the porous ceramic, excluding when a pinched-off satellite droplet is trapped on the donor substrate. The experimental wicking times ranged from  $t_{wick} \sim$ 0.1 s, for
  $V =0.5\,\mathrm {\mu }$l water or ethanol droplets and
  $r_p \approx 800$ nm, up to
  $t_{wick} \approx 10\,000$ s, for Si oil droplets and
  $r_p \approx 80$ nm. Plotting these experimental times against the theoretical Darcy time scale results in all data collapsing consistently with a power law slope of approximately
  $y \sim x^{6/5}$. The most likely reason for the slope being slightly above unity is the scaling model's assumption that the liquid being wicked into the ceramic can be approximated as a single droplet. In reality, the liquid is usually in a bridge shape for the first portion of the wicking regime, only pinching off into a droplet part way through. This simplified model also neglects the volume of the pinched-off satellite droplet, which remains on the donor substrate. Regardless, the data collapse nicely against (5.8). To more explicitly capture the evolving bridge shape during the wicking process, we will now utilize a numerical approach.

Figure 9. The experimental duration of the wicking regime compared with the theoretical Darcy time scale (5.8). The best-fit trendline exhibits a power law slope of greater than unity, which we attribute to the scaling model not accounting for the bridge's varying contact area and eventual pinch-off.
5.3.1. Wicking simulation
A simple numerical simulation can capture the receding speed of the liquid bridge during the first portion of the wicking regime. The bridge was treated as a quasi-equilibrium system, resulting in a constant Laplace pressure across the bridge. The quasi-equilibrium condition is supported by the multiple orders of magnitude differential between the wicking and wetting time scales. Therefore, any change to the bridge shape due to wetting will happen faster than the changes caused by wicking, effectively decoupling the two processes. This allows the bridge shape to be numerically solved based on the following geometric constraints:
 \begin{gather} \dfrac{{\rm d}z}{{\rm d}s} = \sin{\theta}, \end{gather}
 \begin{gather} \dfrac{{\rm d}r}{{\rm d}s} = \cos{\theta}, \end{gather}
 \begin{gather} \dfrac{{\rm d}\theta}{{\rm d}s} = \dfrac{\Delta P}{\gamma} - \dfrac{\sin{\theta}}{r}, \end{gather}
where  $\theta$ is the angle of the bridge profile with respect to the horizontal at any given point along the path of the free interface (
 $s$) as shown in figure 10.

Figure 10. Schematic of the coordinate system used to develop a numerical model for the wicking regime. The bridge profile is made up of points moving along the free interface,  $s$, with the changes in
  $\theta$,
  $r$ and
  $z$ governed by their relationships between each other and a constraint of constant Laplace pressure.
By measuring the bridge's contact angles at the donor and receiving surfaces at the beginning of the wicking regime, a bridge shape can be solved for a known liquid volume. Specifically, the contact radii on both surfaces can be solved using an implicit shooting method, where the receiving contact radius represents the area over which wicking occurs. The flow rate is then calculated from Darcy's law, (5.7). This wicking velocity was assumed constant over a sufficiently small time step,  $\Delta t =1$ ms, to calculate a new (i.e. reduced) volume of the liquid bridge. The reduced volume of the liquid bridge is then used to solve for the contact radii and profile of the liquid bridge for the next time step, by assuming fixed contact angles on the surfaces and a constant Laplace pressure. By assuming the liquid wicks one-dimensionally into the wick from the contact area, the effective length scale of the liquid already within the wick is calculated as
  $L_{i+1} = L_i+v_{{wick},i}\Delta t$ to recalculate the pressure gradient for the next time step. The first time step arbitrarily used a wicked length scale of
  $L_0 =10^{-6}$ m, to avoid a singularity in the pressure gradient and account for the minor wicking that occurred during the wetting regime. This process is then repeated iteratively to numerically capture the evolving profile of the shrinking liquid bridge as it wicks into the ceramic over time.
The numerical results are overlaid atop the experimental evolution of liquid bridges in figure 11. The two experiments chosen for comparison were 5  $\mathrm {\mu }$l water droplets wicking from a HPL substrate into
  $r_p =80$ nm (figure 11a) or
  $r_p =800$ nm (figure 11b) pores. The HPL substrate results in a liquid bridge for the vast majority of the bridging process, with pinch-off only occurring near the end. This maximizes the time duration where a comparison with the model's evolving liquid bridge can be made. Right up until the moment of pinch-off (last frame of each figure), the numerical model successfully predicts the evolving curvature and shrinking contact radii of the liquid bridge as it wicks into the porous receiving surface. The numerical model is therefore a nice complement to the simpler scaling model, as it can account for the evolving contact area over which the liquid is wicking into the pores, to obtain a more exact solution. We also used the numerical model to calibrate the porous surface's tortuosity, finding the best matching value to experimental behaviour when
  $\tau \approx 1.5$ for
  $r_p =80$ nm and
  $\tau \approx 2$ for
  $r_p =800$ nm. These values were retroactively used in the scaling model above.

Figure 11. Results of the wicking simulation (red curves) overlaid on experimental time-lapse photographs. The experimental conditions are a  $V =5\,\mathrm {\mu }$l water droplet on a HPL donor substrate, with (a)
  $r_p \approx 80$ nm and (b)
  $r_p \approx 800$ nm. Time zero corresponds to the beginning of the wicking regime, while the last frame of each video is the moment before pinch-off occurs.
The final piece of the simulation is having the program determine when bridge failure should occur. The important factors for bridge failure are  $\lambda =h/(r_d\,+\,r_r)$,
  $K=r_d/r_r$ and
  $V^\star =8 V / (r_d+r_r)^3$, which are the non-dimensional gap height, radii ratio and non-dimensional volume, respectively. Previous studies have performed numerical simulations where, for two given variables, the corresponding third value is solved that results in the onset of an unstable bridge shape (Martínez & Perales Reference Martínez and Perales1986). Here, we fitted an analytical function to the simulation results, using
  $\lambda$ and
  $K$ as inputs and returning the minimum
  $V^\star$ for the bridge to be stable. The
  $K$ values varied from 0.1 to 1 and
  $\lambda$ values varied from 0.6 to 4, with the corresponding critical
  $V^\star$ values being determined by numerical simulation by Martínez & Perales (Reference Martínez and Perales1986). The resulting equation of fit for bridge stability is as follows:
 $$\begin{gather} V^\star> 5.438 -
51.88 K + 6.135 \lambda + 148.6 K^2 -33.36 K \lambda +
4.729 \lambda^2 - 122 K^3\nonumber\\ +\, 55.92 K^2 \lambda -
16.8 K \lambda^2 + 2.252 \lambda^3.
\end{gather}$$
$$\begin{gather} V^\star> 5.438 -
51.88 K + 6.135 \lambda + 148.6 K^2 -33.36 K \lambda +
4.729 \lambda^2 - 122 K^3\nonumber\\ +\, 55.92 K^2 \lambda -
16.8 K \lambda^2 + 2.252 \lambda^3.
\end{gather}$$
As  $K$ and
  $\lambda$ individually increase, the stability of the bridge decreases, while an increase in volume increases stability of the bridge. The wicking simulations were stepped through time until reaching the first time step where (5.12) was not satisfied. For the simulation shown in figure 11(a), pinch-off was predicted at 27.8 s, in good agreement with the experimental pinch-off which occurred at 26.2 s. In figure 11(b), the numerical simulation combined with (5.12) predicted pinch-off at 2.1 s, again in fair agreement with the experimental pinch-off occurring at 1.9 s. Therefore, our numerical model can capture the onset of bridge breakup, in addition to its ability to evolve the bridge shape prior to breakup.
6. Conclusions
In conclusion, we have experimentally and theoretically characterized the hydrodynamics of a droplet transferring from a solid substrate to an opposing porous medium. The most important findings are summarized below:
(i) Droplet transfer is broadly composed of two regimes: wetting and wicking. The wetting regime is several orders of magnitude faster than the wicking regime, such that these regimes can be effectively decoupled when the pore radius is much smaller than the length scale of the bridging droplet.
(ii) The wetting regime is itself comprised of two sub-regimes: donor independent and donor dependent. In the donor-independent regime, the spreading of the receiving contact line on the porous surface follows the same established scaling laws that govern the rate of neck growth during droplet coalescence. In the donor-dependent regime, a local viscous wedge about the receding contact line on the donor substrate becomes rate limiting, with the driving force being the global differential in Laplace pressure across the liquid bridge.
(iii) Using Darcy's law, a simple scaling model was able to collapse all experimental data regarding the total time required to wick the droplet into the receiving surface. The wicking time varied by several orders of magnitude, depending on the effective pore radius, liquid viscosity and droplet volume.
(iv) A numerical model was developed that captured the shrinking contact radii and evolving neck shape of a quasi-steady liquid bridge during the wicking regime. By correlating our model with a pre-existing model of liquid bridge stability, we were also able to predict the onset of pinch-off, where the bridge becomes unstable, pinching off into droplets on either surface.
(v) The wettability of the donor substrate heavily affects when pinch-off occurs and the duration of droplet transfer. For quasi-spherical water droplets, the droplet can fully dewet from its SHPB substrate to perfectly transfer to the porous surface, such that bridging never occurs. For hemi-spherical droplets, i.e. water transferring from a HPB substrate, bridge pinch-off either occurs during donor-dependent wetting or the very beginning of the wicking regime. Finally, for water droplets on a HPL substrate or low surface tension fluids on a HPB substrate exhibiting smaller contact angles, almost the entire liquid volume has wicked into the porous surface before the bridge becomes unstable.
These findings should inform the design of systems employing bridging-droplet transfer into porous media, such as phase-change thermal diodes.
Supplementary material and movies
Supplementary material and movies are available at https://doi.org/10.1017/jfm.2022.721.
Funding
This work is supported by the Air Force Office of Scientific Research with grant no. FA9550-17-1-0500.
Declaration of interests
The authors report no conflict of interest.


