


1 Introduction
The aerodynamics of flapping wings in insect flight has been studied extensively both experimentally (Bennett Reference Bennett1966; Ellington Reference Ellington1984; Dickinson & Gotz Reference Dickinson and Gotz1993) and numerically (Liu & Kawachi Reference Liu and Kawachi1998; Sun & Tang Reference Sun and Tang2002; Wang Reference Wang2004; Miller & Peskin Reference Miller and Peskin2005; Aono, Liang & Liu Reference Aono, Liang and Liu2008), in order to answer the central question of how lift is augmented by unsteady wing motion (Sane Reference Sane2003; Wang Reference Wang2005). A complex combination of aerodynamic mechanisms including leading-edge vortices (LEVs) (Ellington et al. Reference Ellington, Van Den Berg, Willmott and Thomas1996; Van Den Berg & Ellington Reference Van Den Berg and Ellington1997; Dickinson, Lehmann & Sane Reference Dickinson, Lehmann and Sane1999; Birch & Dickinson Reference Birch and Dickinson2001), delayed stall (Dickinson et al. Reference Dickinson, Lehmann and Sane1999), wake capture (Dickinson et al. Reference Dickinson, Lehmann and Sane1999), etc., were found to be used by insect wings to help sustain and increase lift production. In addition, other complementary lift enhancement mechanisms such as clap-and-fling between bilateral wings during the dorsal stroke reversal (Lighthill Reference Lighthill1973; Weis-Fogh Reference Weis-Fogh1973; Maxworthy Reference Maxworthy1979; Sun & Yu Reference Sun and Yu2006; Lehmann & Pick Reference Lehmann and Pick2007; Lehmann Reference Lehmann2008) and ipsilateral wing–wing interactions (Reavis & Luttges Reference Reavis and Luttges1988; Maybury & Lehmann Reference Maybury and Lehmann2004; Wang & Russell Reference Wang and Russell2007; Lehmann Reference Lehmann2008; Dong & Liang Reference Dong and Liang2010) were found to further increase the lift production of single wings via the formation of new vortical structures near the wings.
Although much emphasis has been placed on the wings, the aerodynamic role of the body should be also considered. The bodies of flying animals inevitably have interactions with the flapping wings and thus have more or less influence to the flow structures generated by the wings. In particular, literatures have indicated that the insect body could play an important role in the development of new vortex structures beyond drag wakes. For example, from smoke line visualizations in wind tunnel tests, due to the existence of the body, new vortices with the same rotating direction as the wing LEVs were found attached to the upper body of free-flying butterflies (Srygley & Thomas Reference Srygley and Thomas2002), tethered dragonflies (Reavis & Luttges Reference Reavis and Luttges1988; Thomas et al.
Reference Thomas, Taylor, Srygley, Nudds and Bomphrey2004) and tethered hawkmoths (Luttges Reference Luttges1989; Bomphrey et al.
Reference Bomphrey, Lawson, Harding, Taylor and Thomas2005); whereas only wing root vortices (RVs) were observed near the body for free-flying bumblebees (Bomphrey, Taylor & Thomas Reference Bomphrey, Taylor and Thomas2009). Recent results from numerical studies of a modelled fruit fly in hover have shown that there was less than 2 % increase in lift force generated by the wings due to the interaction between the wings and body (Aono et al.
Reference Aono, Liang and Liu2008; Yu & Sun Reference Yu and Sun2009). Of particular note here is the study by Liang & Sun (Reference Liang and Sun2013) in which an overset grids-based method was used to simulate a modelled fruit fly in steady flows. The study employed a pair of rigid wings with wing roots about 0.25 chord-length (
 $0.25c$
) away from the body. This gap may weaken the effect of wing–body interaction (WBI). Three subset stretching grids were employed in the near field of the wings and the body, whereas much coarser meshes were employed in most regions. The flow solver employed a combined upwind and central differencing method to solve the incompressible Navier–Stokes equations. The simulations were carried out for cases with the speed of the incoming flow varying from 0 to 1.05 times the mean flapping velocity. They found that the lift changes on the wings due to WBI are less than 4.5 % and the overall lift enhancement (sum of the wing lift and the body lift) is less than 7.5 %. However, there were no significant differences in the flow structures found between the wing–body (WB) model and wings-only (WN) model.
$0.25c$
) away from the body. This gap may weaken the effect of wing–body interaction (WBI). Three subset stretching grids were employed in the near field of the wings and the body, whereas much coarser meshes were employed in most regions. The flow solver employed a combined upwind and central differencing method to solve the incompressible Navier–Stokes equations. The simulations were carried out for cases with the speed of the incoming flow varying from 0 to 1.05 times the mean flapping velocity. They found that the lift changes on the wings due to WBI are less than 4.5 % and the overall lift enhancement (sum of the wing lift and the body lift) is less than 7.5 %. However, there were no significant differences in the flow structures found between the wing–body (WB) model and wings-only (WN) model.
The key difference between the previous work and the current effort is that the WB model of the cicada flight was directly recreated from the high-speed videos. The average distance between the wings and body at the end of the upstroke in real cicada flight was found to be much smaller compared with that in the model of previous studies. This has significant implications for the computational modeling of this wing–body system. First, a significantly larger number of surface points needs to be tracked on the insect wings in order to recreate the wing kinematics and relative distance with respect to the body in the computational models. Second, the temporal resolution of the kinematical data should be high enough so as not to miss any key flow features when the wings were at the closest position to the body at the end of the upstrokes. The potential vivid flow structure development in the region in which the body and the wings getting really close to each other also adds further challenges for the computations since it requires a volume of equivalently fine meshes around the wing–body system to resolve the complex flow features generated by the body and the wings.
The current work employs a methodology which is to develop a high-resolution body–wing kinematic model as well as an accurate computational model of the cicada forward flight. It should be noted that the previous paper (Wan, Dong & Gai Reference Wan, Dong and Gai2015) also described certain aspects of the flow features of this wing–body system in a forward flight. However, the focus there was to identify the unique near-field and far-field wake structures in the cicada forward flight. Only one specific case with a fixed set-up of body/wing positions and wing flapping frequency was chosen. It was still unclear whether those body-induced vortices were actually complementary to the aforementioned lift-producing mechanisms found for the wings and how the phenomena could be affected by other parameters.
This work aims to establish an understanding of the potential lift-enhancement mechanism and associated vortex dynamics related to the interactions between the body and the wings in cicada’s forward flight. Specifically, the lift forces computed in the combined WB models are compared to results from companion WN and body-only (BD) models in order to assess the difference of the corresponding vortex dynamics and aerodynamic performance. The flow mechanism is studied by analysing the vorticity fields and the pressure distribution detail. The same comprehensive analysis of flow structures and relative lift increase of the cicada models is then performed over a range of parameters including minimum wing–body distances, body inclination angles and wing flapping frequencies. The rest of the paper is organized as follows. The physical model and the simulation methodology are presented in § 2. A detailed discussion of the aerodynamic performance and the vortex structures observed over different computational models and their changes along with varied wing–body parameters are included in § 3. Finally, the conclusions are provided in § 4.
2 Materials and methods
2.1 Morphological and kinematic model
The focus of the current study is on the forward flight of an annual cicada (Tibicen linnei) at a speed of about
 $U_{f}=1.96~\text{m}~\text{s}^{-1}$
. The data acquisitions using high-speed videography experiments have been described in detail by Koehler et al. (Reference Koehler, Liang, Gaston, Wan and Dong2012) and Wan et al. (Reference Wan, Dong and Gai2015). In particular, the wing and body positions were recorded using a fully calibrated videography system from three orthogonal views using Photron Fastcam SA3 cameras. The images were taken at 1000 f.p.s. with a resolution of
$U_{f}=1.96~\text{m}~\text{s}^{-1}$
. The data acquisitions using high-speed videography experiments have been described in detail by Koehler et al. (Reference Koehler, Liang, Gaston, Wan and Dong2012) and Wan et al. (Reference Wan, Dong and Gai2015). In particular, the wing and body positions were recorded using a fully calibrated videography system from three orthogonal views using Photron Fastcam SA3 cameras. The images were taken at 1000 f.p.s. with a resolution of
 $1024\times 1024$
pixels. Three-dimensional wing and body geometry were measured using all three orthogonal views of the cicada. Details of this three-dimensional surface reconstruction can be found in Koehler et al. (Reference Koehler, Liang, Gaston, Wan and Dong2012). Figure 1 shows the experimental imaging of the wing kinematics (figure 1
a,b) and 3D reconstructed WB models (figure 1
c,d) which clearly highlight the complex motion and significant deformation of the wing. During the flight, the hindwing of the cicada was hooked with its forewing by a grooved coupling along the hindwing costa and forewing margin. As a result, the coupled forewing and hindwing performed like a single wing composed of two pieces which was used for our computational studies.
$1024\times 1024$
pixels. Three-dimensional wing and body geometry were measured using all three orthogonal views of the cicada. Details of this three-dimensional surface reconstruction can be found in Koehler et al. (Reference Koehler, Liang, Gaston, Wan and Dong2012). Figure 1 shows the experimental imaging of the wing kinematics (figure 1
a,b) and 3D reconstructed WB models (figure 1
c,d) which clearly highlight the complex motion and significant deformation of the wing. During the flight, the hindwing of the cicada was hooked with its forewing by a grooved coupling along the hindwing costa and forewing margin. As a result, the coupled forewing and hindwing performed like a single wing composed of two pieces which was used for our computational studies.
In figure 1(c,d),
 $z^{\prime }/c$
(
$z^{\prime }/c$
(
 $z^{\prime }$
is defined in figure 2
a) reflects the distance of the points on the wing away from the body; blue indicates a position near the cicada body and red indicates one far away from the body. It is found that the minimum wing–body distance (
$z^{\prime }$
is defined in figure 2
a) reflects the distance of the points on the wing away from the body; blue indicates a position near the cicada body and red indicates one far away from the body. It is found that the minimum wing–body distance (
 ${\it\delta}$
), which is defined as the mean distance from the wing root region (the region within 30 % span of the wing shown in figure 1
c) to the body at the end of the upstroke, were about
${\it\delta}$
), which is defined as the mean distance from the wing root region (the region within 30 % span of the wing shown in figure 1
c) to the body at the end of the upstroke, were about
 $0.07c$
, where
$0.07c$
, where
 $c$
is the chord length at the mid-span (
$c$
is the chord length at the mid-span (
 $c=19.6$
mm). Another feature indicated by figure 1(c,d) was the wider wing root region compared with other insects such as fruit flies and dragonflies. We estimated that the area of the region within 30 % of the span away from the root of a cicada wing is about 35.3 % of the total area of the wing, which is higher than those of fruit flies (21.2 %) and dragonflies (forewing: 25.3 %, hindwing: 32.3 %). This resulted from the hooked forewing and hindwing, which may lead to a stronger WBI in cicada flight compared with other insects.
$c=19.6$
mm). Another feature indicated by figure 1(c,d) was the wider wing root region compared with other insects such as fruit flies and dragonflies. We estimated that the area of the region within 30 % of the span away from the root of a cicada wing is about 35.3 % of the total area of the wing, which is higher than those of fruit flies (21.2 %) and dragonflies (forewing: 25.3 %, hindwing: 32.3 %). This resulted from the hooked forewing and hindwing, which may lead to a stronger WBI in cicada flight compared with other insects.

Figure 1. Snapshots of the cicada in forward flight at the beginning of the downstroke (a) and the upstroke, respectively, from the top camera. The corresponding reconstructed model from the side view are shown in (c) and (d), respectively. The contour colour on the wing surface reflects the normalized distance
 $z^{\prime }/c$
from the wing root.
$z^{\prime }/c$
from the wing root.

Figure 2. (a) Definition of wing Euler angles, wing position angle (
 ${\it\phi}$
), wing deviation angle (
${\it\phi}$
), wing deviation angle (
 ${\it\theta}$
) and wing pitch angle (
${\it\theta}$
) and wing pitch angle (
 ${\it\alpha}$
). (b) Time course of wing Euler angles during a complete flapping cycle.
${\it\alpha}$
). (b) Time course of wing Euler angles during a complete flapping cycle.
The kinematics of the body and the wings are quantified as follows. The body inclination angle (
 ${\it\chi}$
in figure 1
c) is defined as the angle between the horizontal and the mid-frontal plane of the body (Tobalske et al.
Reference Tobalske, Warrick, Clark, Powers, Hedrick, Hyder and Biewener2007). In our experiment
${\it\chi}$
in figure 1
c) is defined as the angle between the horizontal and the mid-frontal plane of the body (Tobalske et al.
Reference Tobalske, Warrick, Clark, Powers, Hedrick, Hyder and Biewener2007). In our experiment
 ${\it\chi}$
is
${\it\chi}$
is
 $28^{\circ }$
. The wing flapping kinematics obtained from the reconstruction are described by three Euler angles in a local coordinate system (fixed at the wing root as shown in figure 2
a). Stroke angle
$28^{\circ }$
. The wing flapping kinematics obtained from the reconstruction are described by three Euler angles in a local coordinate system (fixed at the wing root as shown in figure 2
a). Stroke angle
 ${\it\phi}$
defines the angular position of the wing in the mean stroke plane
${\it\phi}$
defines the angular position of the wing in the mean stroke plane
 $o^{\prime }y^{\prime }z^{\prime }$
with
$o^{\prime }y^{\prime }z^{\prime }$
with
 $0^{\circ }$
aligning with the direction of the
$0^{\circ }$
aligning with the direction of the
 $y^{\prime }$
-axis. The angle between the mean stroke plane
$y^{\prime }$
-axis. The angle between the mean stroke plane
 $o^{\prime }y^{\prime }z^{\prime }$
and the horizontal plane is about
$o^{\prime }y^{\prime }z^{\prime }$
and the horizontal plane is about
 $36^{\circ }$
in forward flight. Deviation angle
$36^{\circ }$
in forward flight. Deviation angle
 ${\it\theta}$
is the angle between the base-to-tip line of the wing and the mean stroke plane. Pitch angle
${\it\theta}$
is the angle between the base-to-tip line of the wing and the mean stroke plane. Pitch angle
 ${\it\alpha}$
is defined as the angle of the wing mid-chord with respect to the stroke plane. Time courses of those three angles during a flapping cycle are shown in figure 2(b). Based on our experimental measurement, the Reynolds number (defined as
${\it\alpha}$
is defined as the angle of the wing mid-chord with respect to the stroke plane. Time courses of those three angles during a flapping cycle are shown in figure 2(b). Based on our experimental measurement, the Reynolds number (defined as
 $Re=cU_{f}/{\it\nu}$
) is 2460, where
$Re=cU_{f}/{\it\nu}$
) is 2460, where
 ${\it\nu}$
is the kinematic viscosity (
${\it\nu}$
is the kinematic viscosity (
 ${\it\nu}=1.56\times 10^{-5}~\text{m}^{2}~\text{s}^{-1}$
at room temperature
${\it\nu}=1.56\times 10^{-5}~\text{m}^{2}~\text{s}^{-1}$
at room temperature
 $25\,^{\circ }\text{C}$
). The reduced frequency (defined as
$25\,^{\circ }\text{C}$
). The reduced frequency (defined as
 $k=fL/U_{f}$
) is 0.83, where
$k=fL/U_{f}$
) is 0.83, where
 $f$
is the flapping frequency (
$f$
is the flapping frequency (
 $f=46.5~\text{Hz}$
) and
$f=46.5~\text{Hz}$
) and
 $L$
is the span length (
$L$
is the span length (
 $L=35.0~\text{mm}$
).
$L=35.0~\text{mm}$
).
2.2 Numerical method and simulation set-up
The numerical methodology of the immersed-boundary-method-based Navier–Stokes equation solver employed in the current study is briefly introduced here. The 3D incompressible Navier–Stokes equations are discretized using a cell-centred, collocated arrangement of the primitive variables and are solved using a finite-difference-based Cartesian grid immersed boundary method (Mittal et al. Reference Mittal, Dong, Bozkurttas, Najjar, Vargas and von Loebbecke2008). The equations are integrated in time using the fractional step method. The Eulerian form of the Navier–Stokes equations is discretized on a Cartesian mesh and boundary conditions on the immersed boundary are imposed through a ghost-cell procedure. This method was successfully applied in many simulations of flapping propulsion (Dong et al. Reference Dong, Bozkurttas, Mittal, Madden and Lauder2010; Liu et al. Reference Liu, Ren, Zhu, Bart-Smith and Dong2015; Wan et al. Reference Wan, Dong and Gai2015). More details about this method can be found in Dong, Mittal & Najjar (Reference Dong, Mittal and Najjar2006) and Mittal et al. (Reference Mittal, Dong, Bozkurttas, Najjar, Vargas and von Loebbecke2008). Validations about this solver can be found in our previous works (Li, Dong & Liu Reference Li, Dong and Liu2015; Wan et al. Reference Wan, Dong and Gai2015).
In order to examine the effects of WBI, two simplified models, WN and BD, are created based on the original reconstructed WB model. In the WN model, the same wing kinematics are kept as the WB model. For the BD model, only the body with the same inclination angle as that of the WB model is employed. By isolating the coupling of the body and wing models, we desire to investigate the inherent nature of body-involved unsteady force generation mechanism by comparing both aerodynamic performance and associated wake structures. In addition, the effects of several key parameters governing the unsteady flow features are also studied. Table 1 provides a concise summary of all of the parameters involved and their ranges.
Table 1. Parameters involved and ranges of variation in the current study.
As shown in figure 3, the simulations were carried out on a non-uniform Cartesian grid. The computational domain size was chosen as
 $30c\times 30c\times 30c$
with
$30c\times 30c\times 30c$
with
 $273\times 185\times 225$
(about 11.36 million) grid points in total. A cuboidal region around the cicada with high-resolution uniform grids in size of
$273\times 185\times 225$
(about 11.36 million) grid points in total. A cuboidal region around the cicada with high-resolution uniform grids in size of
 $8.0c\times 5.6c\times 7.0c$
with the spacing of about
$8.0c\times 5.6c\times 7.0c$
with the spacing of about
 $0.03c$
is designed to resolve the near-field vortex structures. At the right-hand boundary, we provide a constant inflow velocity boundary condition. The left-hand boundary is the outflow boundary, allowing the vortices to convect out of this boundary without significant reflections. The zero gradient boundary condition is provided at all lateral boundaries. A homogeneous Neumann boundary condition is used for the pressure at all boundaries.
$0.03c$
is designed to resolve the near-field vortex structures. At the right-hand boundary, we provide a constant inflow velocity boundary condition. The left-hand boundary is the outflow boundary, allowing the vortices to convect out of this boundary without significant reflections. The zero gradient boundary condition is provided at all lateral boundaries. A homogeneous Neumann boundary condition is used for the pressure at all boundaries.

Figure 3. Schematic of the computational mesh and boundary conditions employed in the current simulation for the WB model. For WN and BD models, the same numerical set-up is applied by removing either the cicada body or the flapping wings.
The selection of the current grid set-up is based on extensive tests to ensure that the domain is large enough to achieve accurate results, and grid refinement has been performed to make sure that the simulation results are grid-independent. Figure 4 shows the comparison of lift coefficient history of WN model in three grids. It shows that the difference of both the mean value and the peak value of lift between the medium-grid case (adopted in this paper) and the fine-grid case is less than 1.5 %. This demonstrates that the aerodynamic force in the current study was grid-independent.

Figure 4. Comparison of lift coefficient of WN model for demonstrating the grid independence of the computed results. The grid employed in simulations are
 $257\times 161\times 193=7.99\times 10^{6}$
(for coarse mesh),
$257\times 161\times 193=7.99\times 10^{6}$
(for coarse mesh),
 $273\times 185\times 225=11.36\times 10^{6}$
(for medium mesh) and
$273\times 185\times 225=11.36\times 10^{6}$
(for medium mesh) and
 $301\times 201\times 245=14.82\times 10^{6}$
(for fine mesh).
$301\times 201\times 245=14.82\times 10^{6}$
(for fine mesh).
3 Results
In this section, we first present the simulation results of the three models (WB, WN and BD) at
 ${\it\delta}=0.07c$
,
${\it\delta}=0.07c$
,
 ${\it\chi}=28^{\circ }$
and
${\it\chi}=28^{\circ }$
and
 $k=0.83$
in §§ 3.1–3.3. This is followed by a parametric study to examine the aerodynamic effects of
$k=0.83$
in §§ 3.1–3.3. This is followed by a parametric study to examine the aerodynamic effects of
 ${\it\delta}$
,
${\it\delta}$
,
 ${\it\chi}$
and
${\it\chi}$
and
 $k$
in § 3.4.
$k$
in § 3.4.
3.1 Aerodynamic performance
The forces on the insect’s body and wings were computed through direct integration of the surface pressure and shear. The lift force (
 $F_{L}$
, along the vertical direction) are presented here as non-dimensional coefficients, which were computed by,
$F_{L}$
, along the vertical direction) are presented here as non-dimensional coefficients, which were computed by,
 $C_{L}=F_{L}/0.5{\it\rho}U_{tip}^{2}A_{wing}$
, where
$C_{L}=F_{L}/0.5{\it\rho}U_{tip}^{2}A_{wing}$
, where
 $C_{L}$
is the lift coefficient. Here
$C_{L}$
is the lift coefficient. Here
 $U_{tip}$
is the mean wing tip velocity (
$U_{tip}$
is the mean wing tip velocity (
 $U_{tip}=3.1U_{f}$
), which is defined as
$U_{tip}=3.1U_{f}$
), which is defined as
 $U_{tip}=(1/T)\int _{0}^{T}\sqrt{u_{tip}^{2}+v_{tip}^{2}+w_{tip}^{2}}\,\text{d}t$
, where
$U_{tip}=(1/T)\int _{0}^{T}\sqrt{u_{tip}^{2}+v_{tip}^{2}+w_{tip}^{2}}\,\text{d}t$
, where
 $u_{tip}$
,
$u_{tip}$
,
 $v_{tip}$
and
$v_{tip}$
and
 $w_{tip}$
are the tip velocity components in
$w_{tip}$
are the tip velocity components in
 $x$
,
$x$
,
 $y$
and
$y$
and
 $z$
directions, respectively. We use
$z$
directions, respectively. We use
 $A_{wing}$
to denote the area of the wing.
$A_{wing}$
to denote the area of the wing.
Here, the comparisons of the instantaneous forces on the cicada body and the right wing are shown in figures 5(a) and 5(b), respectively. In each plot, solid lines indicate simulation results from the WB case while dashed lines represent either the BD or WN model. Cycle-averaged drag shows that the wing–body system in the WB model experiences a very small drag force (less than 2.9 % of the overall lift force). This is consistent with our experimental observation, in which the cicada was performing a slightly decelerating forward flight. The cycle-averaged lift and their relative enhancement (
 ${\rm\Delta}\bar{C}_{L}=(\bar{C}_{L}|_{WB}-\bar{C}_{L}|_{WN/BD})/\bar{C}_{L}|_{WN/BD}$
) due to WBI are shown in table 2. According to figure 5(a), most of the wing lift is generated by the downstroke, which is in line with the previous study (Yu & Sun Reference Yu and Sun2009). The average lift enhancement on wings due to the WBI is about 6.7 %. This is slightly higher than that found in previous studies (Aono et al.
Reference Aono, Liang and Liu2008; Yu & Sun Reference Yu and Sun2009; Liang & Sun Reference Liang and Sun2013), which is due to the stronger WBI.
${\rm\Delta}\bar{C}_{L}=(\bar{C}_{L}|_{WB}-\bar{C}_{L}|_{WN/BD})/\bar{C}_{L}|_{WN/BD}$
) due to WBI are shown in table 2. According to figure 5(a), most of the wing lift is generated by the downstroke, which is in line with the previous study (Yu & Sun Reference Yu and Sun2009). The average lift enhancement on wings due to the WBI is about 6.7 %. This is slightly higher than that found in previous studies (Aono et al.
Reference Aono, Liang and Liu2008; Yu & Sun Reference Yu and Sun2009; Liang & Sun Reference Liang and Sun2013), which is due to the stronger WBI.

Figure 5. Time traces of lift and thrust coefficients of the body (a) and a single wing (b) during the fourth flapping cycle when both the aerodynamic forces and flow reach a periodic state. Peak 1 and 2 in figure (a) occur at
 $t/T=0.3$
and 0.74, respectively.
$t/T=0.3$
and 0.74, respectively.
Table 2. Cycle-averaged lift coefficient and its enhancement due to WBI.

The overall lift force produced by the wings and the body together is increased by about 18.7 % according to table 2, which suggests a significant aerodynamic benefit generated by WBI. This is mainly because of the lift increment on the cicada body (
 $0.109-0.013=0.096$
), which contributes about 65 % of the total lift enhancement (
$0.109-0.013=0.096$
), which contributes about 65 % of the total lift enhancement (
 $0.930-0.791=0.148$
). The body lift accounts for about 11.6 % of the total lift generation in the WB model, whereas the body can only produce less than 2 % of the total lift when separated from the wings and simulated under the same flow conditions. Therefore, the body plays a more important role in force generation when it interacts with the flapping wings. A clear correlation between the instantaneous forces produced by the body and the periodic flapping motion of the wings can be observed in figure 5. The WB produces periodic forces with much larger amplitudes than that of BD model. In addition, the peak force values generated by the body for the WB model occur midway through the downstroke, which follows the force peaks generated by the wings. This further indicates that the lift enhancement on the body is associated with WBI.
$0.930-0.791=0.148$
). The body lift accounts for about 11.6 % of the total lift generation in the WB model, whereas the body can only produce less than 2 % of the total lift when separated from the wings and simulated under the same flow conditions. Therefore, the body plays a more important role in force generation when it interacts with the flapping wings. A clear correlation between the instantaneous forces produced by the body and the periodic flapping motion of the wings can be observed in figure 5. The WB produces periodic forces with much larger amplitudes than that of BD model. In addition, the peak force values generated by the body for the WB model occur midway through the downstroke, which follows the force peaks generated by the wings. This further indicates that the lift enhancement on the body is associated with WBI.

Figure 6. A series of instantaneous wake structures, visualized by
 ${\it\lambda}=2.5$
, during downstroke for WB model (a–c) and WN model (d–f): (a,d)
${\it\lambda}=2.5$
, during downstroke for WB model (a–c) and WN model (d–f): (a,d)
 $t/T=0.14$
; (b,e)
$t/T=0.14$
; (b,e)
 $t/T=0.3$
; (c,f)
$t/T=0.3$
; (c,f)
 $t/T=0.48$
.
$t/T=0.48$
.
3.2 Wake topology
The 3D vortex structures are visualized by the isosurface of the imaginary part of the complex eigenvalue (
 ${\it\lambda}$
) derived from the instantaneous velocity gradient tensor, which identifies flow regions where rotation dominates over strain (Mittal & Balachandar Reference Mittal and Balachandar1995). Since the BD model generates very little lift force compared with the other two models, this section mainly focuses on the flow features due to WBI by comparing the vortex structures in WB with those in WN.
${\it\lambda}$
) derived from the instantaneous velocity gradient tensor, which identifies flow regions where rotation dominates over strain (Mittal & Balachandar Reference Mittal and Balachandar1995). Since the BD model generates very little lift force compared with the other two models, this section mainly focuses on the flow features due to WBI by comparing the vortex structures in WB with those in WN.
Figures 6 and 7 show the comparison of instantaneous wake structures of the WB model and the WN model during the downstroke and upstroke, respectively. The WB model is on the top row (labelled as a–c, see also supplementary movie 1 available at http://dx.doi.org/10.1017/jfm.2016.175) and the WN model is on the bottom row (d–f, see also supplementary movie 2). In general, the vortical structures including the LEVs and the tip vortices around the wings are identical in both cases. This is consistent with those found in the previous studies of insect forward flight (Yu & Sun Reference Yu and Sun2009; Liang & Sun Reference Liang and Sun2013). However, there are two unique sets of vortical structures generated by the cicada body, the thorax vortex (TXV) and the posterior body vortex (PBV), which were never reported in previous studies on other insects. Specifically, the TXVs are developed from the upper surface of the body thorax and then shed onto the wings. The PBVs are spiraled vortex tubes, which emanate from the posterior region of the body and entangle with the RVs. As a result, the RVs in the wing root region (labeled V1 in figures 6 and 7) are formed very differently in these two cases. From figure 6, in the downstroke, the RVs in WB model are entangled with the PBVs. However, in WN, the RVs are found developed completely with stronger profiles (see figure 6 b,c,e,f). During the upstroke (figure 7), the RVs in WB model are shed from the wings at the early stage and then merged with the downstream wakes, while in WN model they stay attached to the wing root until the end of the stroke. Results have also shown that the strengths of the body vortices are comparable with those of wing vortices (figure 6 b,c). This indicates the potential aerodynamic contributions from the body vortices need to be evaluated separately. Next, we will describe the formation and the development of the two kinds of body vortices and their aerodynamic contributions.

Figure 7. A series of instantaneous wake structures, visualized by
 ${\it\lambda}=2.5$
, during upstroke for WB model (a–c) and WN model (d–f): (a,d)
${\it\lambda}=2.5$
, during upstroke for WB model (a–c) and WN model (d–f): (a,d)
 $t/T=0.74$
; (b,e)
$t/T=0.74$
; (b,e)
 $t/T=0.9$
; (c,f)
$t/T=0.9$
; (c,f)
 $t/T=0.98$
.
$t/T=0.98$
.
In the early stage of the downstroke (figure 6
a), when the wing is still close to the body, only a pair of PBVs are found connecting the body and the wings of the cicada. There is no visible TXVs identified by the 3D isosurface with a value of
 ${\it\lambda}=2.5$
. As the wings flap down, the TXVs are then generated such that distinct vortex tubes starting from the thorax and shedding onto the wings can be clearly observed at the mid-downstroke (figure 6
b). Meanwhile, the PBVs grow stronger and tangle with the vortex tubes shed from the wing roots. As the wing flaps down continuously, one side of the PBV detaches with the wing surface while the other side remains attached to the body (figure 6
c). However, the TXVs are always attached to the body and keep growing until the end of the downstroke before wing reversal. After the reversal, the PBVs will detach from the body and convect downstream. The TXVs merge with LEVs as the wings are squeezing the flow during upstroke. At this point, visible frontiers between TXVs and LEVs cannot be found any more (figure 7
a). As the wings further flaps upward, the TXVs slightly move backward along the body but are never shed (see both figure 7
b,c). Interestingly, the TXVs at the end of the upstroke become the rudiments of the PBVs for the following downstroke (figure 7
c).
${\it\lambda}=2.5$
. As the wings flap down, the TXVs are then generated such that distinct vortex tubes starting from the thorax and shedding onto the wings can be clearly observed at the mid-downstroke (figure 6
b). Meanwhile, the PBVs grow stronger and tangle with the vortex tubes shed from the wing roots. As the wing flaps down continuously, one side of the PBV detaches with the wing surface while the other side remains attached to the body (figure 6
c). However, the TXVs are always attached to the body and keep growing until the end of the downstroke before wing reversal. After the reversal, the PBVs will detach from the body and convect downstream. The TXVs merge with LEVs as the wings are squeezing the flow during upstroke. At this point, visible frontiers between TXVs and LEVs cannot be found any more (figure 7
a). As the wings further flaps upward, the TXVs slightly move backward along the body but are never shed (see both figure 7
b,c). Interestingly, the TXVs at the end of the upstroke become the rudiments of the PBVs for the following downstroke (figure 7
c).
According to both the aerodynamic forces and vortex dynamics discussed above, there is a clear correlation between the force behaviour and the body-generated vortices in the cicada flight. The first peak of the body lift shown in figure 5(a) is at about
 $t/T=0.3$
when both the TXVs and the PBVs are well developed. After
$t/T=0.3$
when both the TXVs and the PBVs are well developed. After
 $t/T=0.3$
, the PBVs are prone to shed and the body lift is about to decrease. The second lift peak occurs at about the time that the TXVs and LEVs are compressed by the upward flapping of the wing. As a result, the profiles of TXVs are found even larger when compared with the downstroke. These correlations imply that the lift force enhancement on the body is related to the formation and evolution of TXVs and PBVs. This will be further discussed in § 3.3.
$t/T=0.3$
, the PBVs are prone to shed and the body lift is about to decrease. The second lift peak occurs at about the time that the TXVs and LEVs are compressed by the upward flapping of the wing. As a result, the profiles of TXVs are found even larger when compared with the downstroke. These correlations imply that the lift force enhancement on the body is related to the formation and evolution of TXVs and PBVs. This will be further discussed in § 3.3.
In order to further understand the aerodynamic importance of the TXVs and PBVs, we compare spanwise vorticity (
 ${\it\omega}_{z}$
) contours of the slice-cuts close to the wing root region between the WB and WN models (figure 8). In WB, two slice-cuts along the body (slice 1) and the wing-chord (slice 2) are shown at the mid-downstroke and mid-upstroke in figures 8(a) and 8(c), respectively, whereas in figure 8(b,d) only the corresponding slice-cut along the wing-chord are shown due to the non-existence of the body. It can be seen in the slice 1, a strong vortex with the same orientation as the wing LEV is formed and attached to the body thorax and another vortex can be seen above the posterior body part. These two vortices correspond to the TXV and the PBV shown in figures 6 and 7. As such, the wing LEVs in slice 2 (figure 8
a,c) are significantly different from those in WN model (figure 8
b,d). They are greatly strengthened due to the involvement of the TXVs and the PBVs. This indicates a considerable amount of force increments on both the body and the wing root region.
${\it\omega}_{z}$
) contours of the slice-cuts close to the wing root region between the WB and WN models (figure 8). In WB, two slice-cuts along the body (slice 1) and the wing-chord (slice 2) are shown at the mid-downstroke and mid-upstroke in figures 8(a) and 8(c), respectively, whereas in figure 8(b,d) only the corresponding slice-cut along the wing-chord are shown due to the non-existence of the body. It can be seen in the slice 1, a strong vortex with the same orientation as the wing LEV is formed and attached to the body thorax and another vortex can be seen above the posterior body part. These two vortices correspond to the TXV and the PBV shown in figures 6 and 7. As such, the wing LEVs in slice 2 (figure 8
a,c) are significantly different from those in WN model (figure 8
b,d). They are greatly strengthened due to the involvement of the TXVs and the PBVs. This indicates a considerable amount of force increments on both the body and the wing root region.

Figure 8. Slices of the vorticity contour (
 ${\it\omega}_{z}$
) in the near wake for WB model (a,c) and WN model (b,d): (a,b)
${\it\omega}_{z}$
) in the near wake for WB model (a,c) and WN model (b,d): (a,b)
 $t/T=0.3$
; (b,d)
$t/T=0.3$
; (b,d)
 $t/T=0.74$
. In WB, slice 1 is taken along the body at
$t/T=0.74$
. In WB, slice 1 is taken along the body at
 $0.17L$
away from body middle plane and slice 2 is cut along the wing chord at
$0.17L$
away from body middle plane and slice 2 is cut along the wing chord at
 $0.1L$
away from the wing root. In WN, the position of the slice is the same as that of slice 2 in WB. The vorticity is normalized by
$0.1L$
away from the wing root. In WN, the position of the slice is the same as that of slice 2 in WB. The vorticity is normalized by
 $U_{f}/c$
.
$U_{f}/c$
.
To further illustrate the reinforcement of the LEVs near the wing root region due to the body vortices, we plot a series of spanwise vorticity (
 ${\it\omega}_{z}$
) contours along the wing span for both WB and WN models at the mid-downstroke in figure 9(a) and (b), respectively. At this time instant, the wings are nearly parallel to
${\it\omega}_{z}$
) contours along the wing span for both WB and WN models at the mid-downstroke in figure 9(a) and (b), respectively. At this time instant, the wings are nearly parallel to
 $z$
-axis, so the contours of
$z$
-axis, so the contours of
 ${\it\omega}_{z}$
actually represent the shape of LEVs on the wings. It is found that the LEVs in both models are almost identical to one another in the area away from the wing root (
${\it\omega}_{z}$
actually represent the shape of LEVs on the wings. It is found that the LEVs in both models are almost identical to one another in the area away from the wing root (
 ${>}0.7L$
), whereas substantial difference of wing LEVs can be observed near the wing root. Specifically, multiple vortex cores have been generated by TXVs and PBVs (e.g. at
${>}0.7L$
), whereas substantial difference of wing LEVs can be observed near the wing root. Specifically, multiple vortex cores have been generated by TXVs and PBVs (e.g. at
 $0.1L$
and
$0.1L$
and
 $0.3L$
) for the wing LEVs in the WB model. As a result, the overall strength of the wing LEVs have been enhanced by WBI. Figure 9(c) shows the mean circulation of the spanwise vorticity during downstroke for both WB and WN models as well as the circulation difference between these two models (
$0.3L$
) for the wing LEVs in the WB model. As a result, the overall strength of the wing LEVs have been enhanced by WBI. Figure 9(c) shows the mean circulation of the spanwise vorticity during downstroke for both WB and WN models as well as the circulation difference between these two models (
 ${\it\Gamma}_{WB}-{\it\Gamma}_{WN}$
). We found that the circulation of the spanwise vorticity over the wing root region is significantly enhanced, for example, at
${\it\Gamma}_{WB}-{\it\Gamma}_{WN}$
). We found that the circulation of the spanwise vorticity over the wing root region is significantly enhanced, for example, at
 $0.1L$
, it is increased by 78 %.
$0.1L$
, it is increased by 78 %.

Figure 9. Comparison of spanwise vorticity (
 ${\it\omega}_{z}$
) contour between (a) WB model and (b) WN model. The slices are taken from the wing root to the wing tip and the vorticity is normalized by
${\it\omega}_{z}$
) contour between (a) WB model and (b) WN model. The slices are taken from the wing root to the wing tip and the vorticity is normalized by
 $U_{f}/c$
. (c) Comparison of the averaged circulation of
$U_{f}/c$
. (c) Comparison of the averaged circulation of
 ${\it\omega}_{z}$
over downstroke between the WB model and WN model. Here
${\it\omega}_{z}$
over downstroke between the WB model and WN model. Here
 $z_{s}$
represents the position along the wing span.
$z_{s}$
represents the position along the wing span.
3.3 Surface pressure
In this section, pressure distribution on the body and the wings are analysed. The pressure coefficient is defined as
 $C_{p}=(p-p_{\infty })/0.5{\it\rho}U_{tip}^{2}$
, where
$C_{p}=(p-p_{\infty })/0.5{\it\rho}U_{tip}^{2}$
, where
 $p_{\infty }$
is the pressure in the freestream. The above force comparison indicates that the lift on the body increased a lot, so we plot the surface pressure on the body in figure 10. Figure 10(a) is the pressure on the body in the WB model at
$p_{\infty }$
is the pressure in the freestream. The above force comparison indicates that the lift on the body increased a lot, so we plot the surface pressure on the body in figure 10. Figure 10(a) is the pressure on the body in the WB model at
 $t/T=0.3$
at which the first peak of the body lift is observed (see figure 5
a). Two low-pressure regions on the thorax and posterior body can be clearly observed at this moment, which coincide with the locations of TXVs and PBVs, implying that they were generated by the two vortices. At the time instant
$t/T=0.3$
at which the first peak of the body lift is observed (see figure 5
a). Two low-pressure regions on the thorax and posterior body can be clearly observed at this moment, which coincide with the locations of TXVs and PBVs, implying that they were generated by the two vortices. At the time instant
 $t/T=0.74$
, at which the second lift peak occurs (see figure 5
a), the low-pressure regions generated by the PBVs disappears (figure 10
b), leaving only one low-pressure region on the body. This is because PBVs have already detached with the body. In addition, during upstroke, this low-pressure region moves to the top surface of the body and follows the movement of TXVs (figure 10
c). According to this analysis about the spacial and temporal change of the pressure on the body, the high body lift generated during downstroke is attributed to both TXVs and PBVs, while the lift peak which occurs at the mid-upstroke is mainly due to the TXVs.
$t/T=0.74$
, at which the second lift peak occurs (see figure 5
a), the low-pressure regions generated by the PBVs disappears (figure 10
b), leaving only one low-pressure region on the body. This is because PBVs have already detached with the body. In addition, during upstroke, this low-pressure region moves to the top surface of the body and follows the movement of TXVs (figure 10
c). According to this analysis about the spacial and temporal change of the pressure on the body, the high body lift generated during downstroke is attributed to both TXVs and PBVs, while the lift peak which occurs at the mid-upstroke is mainly due to the TXVs.

Figure 10. Surface pressure coefficient distribution on the body for the WB model at selected instants: (a)
 $t/T=0.3$
; (b)
$t/T=0.3$
; (b)
 $t/T=0.74$
; (c)
$t/T=0.74$
; (c)
 $t/T=0.9$
.
$t/T=0.9$
.
To compare the surface pressure on the wing, we plot the difference of the pressure coefficient between the lower surface and the upper surface (
 ${\rm\Delta}C_{p}$
) in figure 11. Figure 11(a,b) indicate that the overall features of the pressure on the wing in WB and WN are similar. The outer half of the wing, especially on the leading-edge region, generates most of the lift force. The difference of
${\rm\Delta}C_{p}$
) in figure 11. Figure 11(a,b) indicate that the overall features of the pressure on the wing in WB and WN are similar. The outer half of the wing, especially on the leading-edge region, generates most of the lift force. The difference of
 ${\rm\Delta}C_{p}$
between WB and WN is mainly located on the wing root region (see figure 11
c). An average 6.5 % enhancement in wing lift production can be found in the WB model. This is attributed to the aforementioned enhancement of the strength of the LEVs near the wing root.
${\rm\Delta}C_{p}$
between WB and WN is mainly located on the wing root region (see figure 11
c). An average 6.5 % enhancement in wing lift production can be found in the WB model. This is attributed to the aforementioned enhancement of the strength of the LEVs near the wing root.
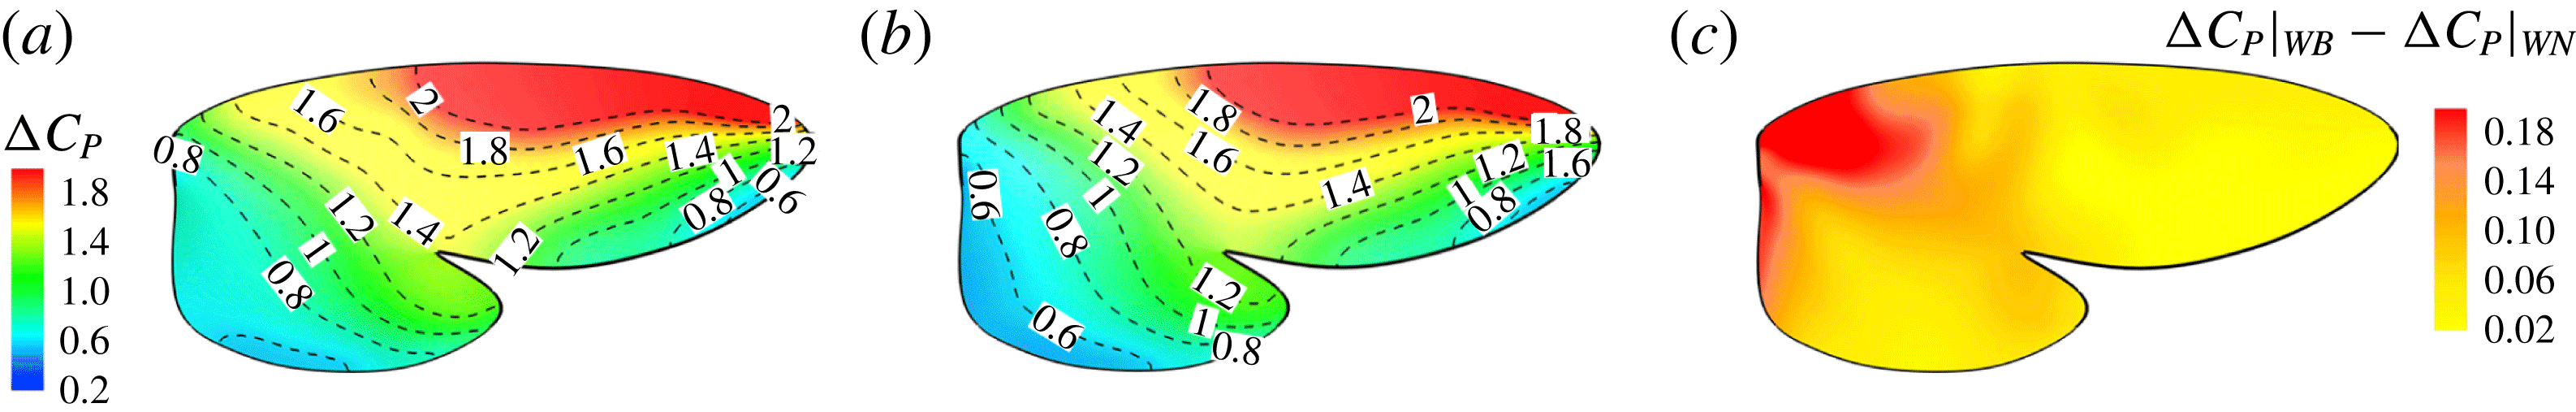
Figure 11. Pressure difference between the upper and lower wing surface (
 ${\rm\Delta}C_{p}$
) of the right wing for the WB model (a) and WN model (b), respectively. (c) Shows the difference of
${\rm\Delta}C_{p}$
) of the right wing for the WB model (a) and WN model (b), respectively. (c) Shows the difference of
 ${\rm\Delta}C_{p}$
between (a) and (b).
${\rm\Delta}C_{p}$
between (a) and (b).
Isosurface contours of a low-pressure level have been plotted in figure 12(a) and (b) for WN and WB, respectively, at
 $t/T=0.3$
. These figures represent the same mid-downstroke instant of the wing as shown in figure 6(e) for the WN model and in figure 6(b) for the WB model, respectively. Noticeable in both plots is a large region of low pressure right behind the wings which is due to the LEVs, RVs, forewing tip vortices (FTVs) and hindwing tip vortices (HTVs). However, for the WB model, an additional low-pressure region can be found behind the head and the thorax, which extends to the region between the sides of the abdomen and the hindwings. Figure 12(c) and (d) show the schematic of the correlation between vortex structures and regions of low pressure in figure 12(a) and (b), respectively. The major vortical structures of the WN and WB models are identified. According to figure 12, the extension of the low-pressure region is due to the distinct and strong vortex structures, TXVs and PBVs, created by WBI. As a result, lift production on both the body and the wings were enhanced.
$t/T=0.3$
. These figures represent the same mid-downstroke instant of the wing as shown in figure 6(e) for the WN model and in figure 6(b) for the WB model, respectively. Noticeable in both plots is a large region of low pressure right behind the wings which is due to the LEVs, RVs, forewing tip vortices (FTVs) and hindwing tip vortices (HTVs). However, for the WB model, an additional low-pressure region can be found behind the head and the thorax, which extends to the region between the sides of the abdomen and the hindwings. Figure 12(c) and (d) show the schematic of the correlation between vortex structures and regions of low pressure in figure 12(a) and (b), respectively. The major vortical structures of the WN and WB models are identified. According to figure 12, the extension of the low-pressure region is due to the distinct and strong vortex structures, TXVs and PBVs, created by WBI. As a result, lift production on both the body and the wings were enhanced.

Figure 12. Isosurface of pressure coefficient (
 $C_{p}=-0.2$
) at
$C_{p}=-0.2$
) at
 $t/T=0.3$
for (a) the WN model and (b) the WB model. Wake schematic for (c) the WN model and (d) the WB model at
$t/T=0.3$
for (a) the WN model and (b) the WB model. Wake schematic for (c) the WN model and (d) the WB model at
 $t/T=0.3$
.
$t/T=0.3$
.
3.4 Effects of key parameters on lift enhancement due to WBIs
In this section, we examine the effect of three key parameters which are important to wing–body, body and wings, respectively, on the lift enhancement between the WB models and WN models. These parameters are the minimum wing–body distances (
 ${\it\delta}$
), body inclination angles (
${\it\delta}$
), body inclination angles (
 ${\it\chi}$
) and reduced frequency (
${\it\chi}$
) and reduced frequency (
 $k$
). For a range of each parameter, the lift forces computed in the WB models are compared with the results from companion WN and BD models in order to assess the difference of the corresponding vortex dynamics and aerodynamic performance. Only major conclusive results are listed below.
$k$
). For a range of each parameter, the lift forces computed in the WB models are compared with the results from companion WN and BD models in order to assess the difference of the corresponding vortex dynamics and aerodynamic performance. Only major conclusive results are listed below.
First, we focus on the effect of the minimum wing–body distance. For this analysis, the reduced frequency and the body inclination angle are fixed at 0.83 and
 $28^{\circ }$
, respectively. Figure 13(a) shows the variation in the cycle-averaged lift coefficients with the minimum wing–body distance for WB and WN. It is found that for all cases, the lift decreases monotonically with
$28^{\circ }$
, respectively. Figure 13(a) shows the variation in the cycle-averaged lift coefficients with the minimum wing–body distance for WB and WN. It is found that for all cases, the lift decreases monotonically with
 ${\it\delta}$
. The corresponding relative increase in the lift with the minimum distance is shown in figure 13(b). The plots show that for a given flapping flight, the gain in lift for
${\it\delta}$
. The corresponding relative increase in the lift with the minimum distance is shown in figure 13(b). The plots show that for a given flapping flight, the gain in lift for
 ${\it\delta}<0.2c$
is much larger than that of
${\it\delta}<0.2c$
is much larger than that of
 ${\it\delta}>0.2c$
. The lift coefficient increases by nearly 18.7 % at the lower end of the minimum distance range. Such a behaviour has a particular relevance for the studies of the fruit fly model (Liang & Sun Reference Liang and Sun2013), in which the
${\it\delta}>0.2c$
. The lift coefficient increases by nearly 18.7 % at the lower end of the minimum distance range. Such a behaviour has a particular relevance for the studies of the fruit fly model (Liang & Sun Reference Liang and Sun2013), in which the
 ${\it\delta}$
is about
${\it\delta}$
is about
 $0.25c$
and the relative lift increase is about 7.2 %.
$0.25c$
and the relative lift increase is about 7.2 %.

Figure 13. Variation in (a) cycle-averaged lift and (b) relative overall lift enhancement for the WB model with changing the minimum wing–body distances (
 ${\it\delta}$
).
${\it\delta}$
).
Figure 14 presents perspective views of the vortex topology and the spanwise vorticity slices for
 ${\it\delta}=0.2c$
and this can be examined in conjunction with the corresponding plot for
${\it\delta}=0.2c$
and this can be examined in conjunction with the corresponding plot for
 ${\it\delta}=0.07c$
(figures 6
b and 9
a). The important feature that needs to be pointed out here is the absence of the PBVs and the significantly weakened TXVs compared to the flow at
${\it\delta}=0.07c$
(figures 6
b and 9
a). The important feature that needs to be pointed out here is the absence of the PBVs and the significantly weakened TXVs compared to the flow at
 ${\it\delta}=0.07c$
. This clearly indicates that the minimum wing–body distance of the model will significantly affect the formation of PBVs and TXVs and the associated aerodynamic force.
${\it\delta}=0.07c$
. This clearly indicates that the minimum wing–body distance of the model will significantly affect the formation of PBVs and TXVs and the associated aerodynamic force.

Figure 14. (a) 3D wake structures and (b) spanwise vorticity contours of the WB model at
 ${\it\delta}=0.2c$
.
${\it\delta}=0.2c$
.
Figure 15(a,b) show the variation in the cycle-averaged lift coefficient with body inclination angle and the corresponding relative lift increase at
 $k=0.83$
and
$k=0.83$
and
 ${\it\delta}=0.07c$
. It is worth noting that the increases of the body inclination angle lead to the monotonically increase of the lift production on wings but has different influence on bodies, especially for the WB models. The maximum relative lift increase was found at
${\it\delta}=0.07c$
. It is worth noting that the increases of the body inclination angle lead to the monotonically increase of the lift production on wings but has different influence on bodies, especially for the WB models. The maximum relative lift increase was found at
 ${\it\chi}=20^{\circ }$
. The body inclination angle of the cicada forward flight in our experimental observation is close to this optimal value.
${\it\chi}=20^{\circ }$
. The body inclination angle of the cicada forward flight in our experimental observation is close to this optimal value.

Figure 15. Variation in (a) cycle-averaged lift and (b) relative overall lift enhancement for the WB and WN/BD models with changing body inclination angle (
 ${\it\chi}$
).
${\it\chi}$
).
For the reduced frequency study, it is useful to examine the effect of this parameter on the lift production. Figure 16 shows the variation of mean lift versus reduced frequency of the flapping wings at
 ${\it\delta}=0.07c$
and
${\it\delta}=0.07c$
and
 ${\it\chi}=28^{\circ }$
. The plot shows that at the lower end of the reduced frequency the lift enhancement of the body is much stronger than that at the high end of the reduced frequency. It shows that the maximum relative lift increase (24.7 %) occurs at
${\it\chi}=28^{\circ }$
. The plot shows that at the lower end of the reduced frequency the lift enhancement of the body is much stronger than that at the high end of the reduced frequency. It shows that the maximum relative lift increase (24.7 %) occurs at
 $k=0.75k_{0}$
and it decreases after
$k=0.75k_{0}$
and it decreases after
 $k>0.75k_{0}$
. This implies that larger size cicadas with slightly smaller flapping frequency are prone to utilize this lift enhancement mechanism for additional lift gain due to WBIs.
$k>0.75k_{0}$
. This implies that larger size cicadas with slightly smaller flapping frequency are prone to utilize this lift enhancement mechanism for additional lift gain due to WBIs.

Figure 16. Variation in (a) cycle-averaged lift and (b) relative overall lift enhancement for the WB and WN/BD models with changing the reduced frequency (
 $k$
). In which, the unit of the horizontal axis (
$k$
). In which, the unit of the horizontal axis (
 $\times k_{0}$
) represents the original reduced frequency, where
$\times k_{0}$
) represents the original reduced frequency, where
 $k_{0}=0.83$
.
$k_{0}=0.83$
.
4 Conclusions
In this work, vortex formation and the associated aerodynamic effects of WBI in cicada forward flight have been numerically investigated. The unsteady flow simulations of the WB, BD and WN models for the insect forward flight were carried out using a high-fidelity immersed-boundary-method-based computational fluid dynamics (CFD) solver. The focus of this paper is to examine the 3D vortex dynamics and lift production in all three models and the effects of key parameters on the WBI results. It is also expected that the current study would lead to some general insights into the vortex dynamics of the body-involved lift-enhancement mechanism in flapping flight.
The simulations reveal that, due to the WBI, the lift force produced by the wings has been increased by about 6.7 %. In the meantime, the lift force generated by the body has been increased by more than seven-fold. This resulted in an 18.7 % enhancement of total lift production to the whole wing–body system. It is worth noting that this significant percentage increase is comparable to those found in other reported lift-enhancement mechanisms (as listed in table 3). For instance, the lift enhancement due to clap-and-fling in bilateral wing interactions was found from 2 % to 17 % and that due to forewing–hindwing interactions was found in a range of 8–40 %.
Table 3. Lift enhancement due to WBI, clap-and-fling and forewing-hindwing interaction (FHI).

Vortex dynamics results show that in WN model the motion of the wings creates a number of vortex structures including LEVs, tip vortices from forewing and hindwing tips, and RVs. These vortices interact with each other and then convect downstream as interconnected vortex loops. In addition, due to the existence of the insect body in the WB model, two distinct sets of vortex structures, TXVs and PBVs, are found developed on the body and interacted with both the LEVs and wing RVs along with the motion of the wings. Consequently the LEVs near the wing root region are found strengthened due to the involvement with the two body vortices. This results in stronger low-pressure regions not only above the wings but also above the body than those in WN model during the flapping flight and thus significantly enhances the lift production in WB model.
Analysis of the lift enhancement of the WB models with varying key parameters show that the enhancement weakens monotonically with the wing–body distance. This is because the strength of TXVs and PBVs decreases quickly as the wing–body distance increases. Furthermore, there exists a clear maximum in relative lift increase with respect to the body inclination angle and the reduced frequency of the wings, respectively. Results have also shown that the maximum relative lift enhancement could reach up to 24.7 % under certain flight conditions.
Acknowledgement
This work was supported by National Science Foundation CBET-1313217 and AFOSR FA9550-12-1-0071.
Supplementary movies
Supplementary movies are available at http://dx.doi.org/10.1017/jfm.2016.175.


