


1 Introduction
Fluid flow in flexible geometries occurs in many biological, medical, and industrial environments (Duprat & Stone Reference Duprat and Stone2015). Systems that couple the elasticity of a solid body with the motion of a fluid often have interesting properties; for instance, interactions between fluid-mechanical and elastic forces can lead to nonlinear pressure-drop/flow-rate relations (Luo & Pedley Reference Luo and Pedley2000; Grotberg & Jensen Reference Grotberg and Jensen2004; Heil & Hazel Reference Heil, Hazel, Duprat and Stone2015) and the generation of instabilities (Heil & Hazel Reference Heil and Hazel2011), even in relatively simple channel geometries.
Soft channels and valves play important roles in biological fluid systems: from flexible veins that carry nutrients in animals (Heil & Hazel Reference Heil and Hazel2011) to valves which maintain unidirectional flow through the human heart (Sotiropoulos, Le & Gilmanov Reference Sotiropoulos, Le and Gilmanov2016). Soft valves are also relevant to fluid transport in plants; for instance, in torus-margo pit pores, microscopic channels that permit water flow between neighbouring xylem tracheid conduits in coniferous trees (Choat, Cobb & Jansen Reference Choat, Cobb and Jansen2008; Jensen et al. Reference Jensen, Berg-Sørensen, Bruus, Holbrook, Liesche, Schulz, Zwieniecki and Bohr2016). The pore structure prevents air embolisms from spreading inside the plant by blocking the pore with a circular disc if a large pressure difference develops between adjacent tracheids. The disc is held in place by soft cellulose fibres which can deform elastically. This soft geometry may modify flow even in the absence of air embolisms; however, previous studies have assumed either a static geometry (Lancashire & Ennos Reference Lancashire and Ennos2002; Schulte Reference Schulte2012) or inviscid flows (Chapman, Rand & Cooks Reference Chapman, Rand and Cooks1977), and the effect of fluid–structure interactions at low Reynolds numbers on this system is not currently well understood.
Systems that couple the elasticity of a solid body with the motion of a fluid link two sets of dynamics that, even when treated separately, can be quite complicated. The properties of biological channels and valves have been studied extensively; however, the geometry is often so complex that numerical simulations or ad hoc assumptions must be used to gain insight into the details of the complex interactions between the fluid and solid mechanics (Bellhouse & Talbot Reference Bellhouse and Talbot1969; McCulloh, Sperry & Adler Reference McCulloh, Sperry and Adler2003; Kim & Bush Reference Kim and Bush2012; Park, Kim & Kim Reference Park, Kim and Kim2014; Yang et al. Reference Yang, Pham, Choo and Hu2014; Gart et al. Reference Gart, Socha, Vlachos and Jung2015; Jensen et al. Reference Jensen, Berg-Sørensen, Bruus, Holbrook, Liesche, Schulz, Zwieniecki and Bohr2016). Studies on models systems inspired by nature provide a promising alternative to in vivo experiments or full-scale numerical simulations. For instance, experiments on microfluidic devices have demonstrated that fluid-induced deformation of elastic sheets and fibres in channels can influence the flow at low Reynolds numbers (Wexler et al. Reference Wexler, Trinh, Berthet, Quennouz, du Roure, Huppert, Lindner and Stone2013; Ledesma-Alonso, Guzmán & Zenit Reference Ledesma-Alonso, Guzmán and Zenit2014), and similar results have been obtained using external mechanical actuation (Holmes et al. Reference Holmes, Tavakol, Froehlicher and Stone2013).
In this paper, we present experiments and theory on a simple spring-actuated valve system inspired by biology. It captures many of the nonlinear interactions that characterize flow in soft geometries where the hydraulic resistance varies with applied pressure. The valve is suitable for regulation of small-scale fluid flows and relevant to several biofluid dynamics problems. Moreover, the simple geometry allows us to derive a closed-form solution, based on lubrication theory, which is compared to experimental data.

Figure 1. Schematics of the soft valve system and the experimental set-up. (a) Schematic of the spring-actuated soft valve. A sphere of radius
 $a$
is suspended from a spring (spring constant
$a$
is suspended from a spring (spring constant
 $k$
) inside a tapering channel. The sphere’s position is determined by force equilibrium between the hydrodynamic and spring forces. (b) Photograph of the set-up showing the steel sphere, extension spring and pipette tip. (c) Schematic of the pressure-drop/flow-rate measurement system. The pressure drop is controlled by the liquid column height
$k$
) inside a tapering channel. The sphere’s position is determined by force equilibrium between the hydrodynamic and spring forces. (b) Photograph of the set-up showing the steel sphere, extension spring and pipette tip. (c) Schematic of the pressure-drop/flow-rate measurement system. The pressure drop is controlled by the liquid column height
 $l(t)$
, and the flow rate
$l(t)$
, and the flow rate
 $Q=\unicode[STIX]{x03C0}(D/2)^{2}\text{d}l/\text{d}t$
and pressure drop
$Q=\unicode[STIX]{x03C0}(D/2)^{2}\text{d}l/\text{d}t$
and pressure drop
 $\unicode[STIX]{x0394}p=\unicode[STIX]{x1D70C}gl(t)$
are determined by image analysis (see additional details in text).
$\unicode[STIX]{x0394}p=\unicode[STIX]{x1D70C}gl(t)$
are determined by image analysis (see additional details in text).
2 Experiment
We consider the effect of couplings between flow and elasticity on the idealized soft valve shown in figure 1(a): a sphere connected to an extension spring located inside a tapering cylindrical pipe. The spring is aligned with the central axis of the channel and a pressure drop
 $\unicode[STIX]{x0394}p$
is applied across the sphere. The sphere’s equilibrium position is determined by a balance between elastic and hydrodynamic forces. This leads to a nonlinear relation between applied pressure
$\unicode[STIX]{x0394}p$
is applied across the sphere. The sphere’s equilibrium position is determined by a balance between elastic and hydrodynamic forces. This leads to a nonlinear relation between applied pressure
 $\unicode[STIX]{x0394}p$
and flow rate
$\unicode[STIX]{x0394}p$
and flow rate
 $Q=\unicode[STIX]{x0394}p/R(\unicode[STIX]{x0394}p)$
, where
$Q=\unicode[STIX]{x0394}p/R(\unicode[STIX]{x0394}p)$
, where
 $R(\unicode[STIX]{x0394}p)$
is the pressure-dependent hydraulic resistance.
$R(\unicode[STIX]{x0394}p)$
is the pressure-dependent hydraulic resistance.
2.1 Experimental methods
The valve was fabricated using a steel sphere of radius
 $a=5~\text{mm}$
and mass
$a=5~\text{mm}$
and mass
 $m_{sphere}=4\times 10^{-3}~\text{kg}$
(KVJ Aktieselskab, 45RB5) which was glued onto an extension spring (spring constant
$m_{sphere}=4\times 10^{-3}~\text{kg}$
(KVJ Aktieselskab, 45RB5) which was glued onto an extension spring (spring constant
 $k=0.16~\text{N mm}^{-1}$
, RS Components 821-273) (see figure 1
b). The spring and sphere were anchored to a M4 bolt that allowed us to control the vertical position of the sphere along the central axis of a 3 mL pipette tip of opening angle
$k=0.16~\text{N mm}^{-1}$
, RS Components 821-273) (see figure 1
b). The spring and sphere were anchored to a M4 bolt that allowed us to control the vertical position of the sphere along the central axis of a 3 mL pipette tip of opening angle
 $\unicode[STIX]{x1D6FE}=0.024~\text{rad}$
(Alpha Laboratories, LW8930). Finally, both ends of the pipette were connected to silicone tubing (inner diameter
$\unicode[STIX]{x1D6FE}=0.024~\text{rad}$
(Alpha Laboratories, LW8930). Finally, both ends of the pipette were connected to silicone tubing (inner diameter
 $D=12~\text{mm}$
). We used the hydrostatic pressure difference provided by a vertical liquid column of height
$D=12~\text{mm}$
). We used the hydrostatic pressure difference provided by a vertical liquid column of height
 $l(t)$
in the silicone tubing to drive flow across the valve, thus sweeping a broad range of pressure drops
$l(t)$
in the silicone tubing to drive flow across the valve, thus sweeping a broad range of pressure drops
 $\unicode[STIX]{x0394}p$
in each experiment (see figure 1
c). The liquid column height
$\unicode[STIX]{x0394}p$
in each experiment (see figure 1
c). The liquid column height
 $l(t)$
was tracked over time using image analysis of photographs captured using a digital camera (Canon, EOS 5D MARK III, 35 mm Sigma lens F1.4 DG HSM Art) as described in the Appendix. The pressure drop
$l(t)$
was tracked over time using image analysis of photographs captured using a digital camera (Canon, EOS 5D MARK III, 35 mm Sigma lens F1.4 DG HSM Art) as described in the Appendix. The pressure drop
 $\unicode[STIX]{x0394}p=\unicode[STIX]{x1D70C}gl(t)$
and flow rate
$\unicode[STIX]{x0394}p=\unicode[STIX]{x1D70C}gl(t)$
and flow rate
 $Q=\unicode[STIX]{x03C0}(D/2)^{2}\text{d}l/\text{d}t$
were subsequently determined, where
$Q=\unicode[STIX]{x03C0}(D/2)^{2}\text{d}l/\text{d}t$
were subsequently determined, where
 $\unicode[STIX]{x1D70C}$
is the liquid density and
$\unicode[STIX]{x1D70C}$
is the liquid density and
 $g$
is the gravitational acceleration (see figure 1
c). In the experiments, we varied the initial ball position in the range
$g$
is the gravitational acceleration (see figure 1
c). In the experiments, we varied the initial ball position in the range
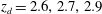
 $z_{d}\sim 2.5$
–
$z_{d}\sim 2.5$
–
 $4.5~\text{mm}$
(corresponding to initial gap thicknesses of
$4.5~\text{mm}$
(corresponding to initial gap thicknesses of
 $h_{0}=z_{d}\sin \unicode[STIX]{x1D6FE}\sim 60$
–
$h_{0}=z_{d}\sin \unicode[STIX]{x1D6FE}\sim 60$
–
 $110~\unicode[STIX]{x03BC}\text{m}$
), and the liquid viscosity from deionized (DI) water (1 cSt) to silicone oil (100 cSt).
$110~\unicode[STIX]{x03BC}\text{m}$
), and the liquid viscosity from deionized (DI) water (1 cSt) to silicone oil (100 cSt).

Figure 2. Pressure-drop/flow-rate relation for viscous flow in a soft valve. (a) Flow rate
 $Q$
plotted as a function of applied pressure
$Q$
plotted as a function of applied pressure
 $\unicode[STIX]{x0394}p$
for DI water flow with viscosity
$\unicode[STIX]{x0394}p$
for DI water flow with viscosity
 $\unicode[STIX]{x1D702}=1$
cSt, spring constant
$\unicode[STIX]{x1D702}=1$
cSt, spring constant
 $k=0.16~\text{N}\,\text{mm}^{-1}$
, and sphere radius
$k=0.16~\text{N}\,\text{mm}^{-1}$
, and sphere radius
 $a=5~\text{mm}$
. Results for initial ball position
$a=5~\text{mm}$
. Results for initial ball position
 $z_{d}=2.6,2.7,2.9$
and 3.6 mm are shown as green, red, blue and black symbols, respectively. Maximum Reynolds number in each case is
$z_{d}=2.6,2.7,2.9$
and 3.6 mm are shown as green, red, blue and black symbols, respectively. Maximum Reynolds number in each case is
 ${\sim}$
13, 16, 19 and 48, respectively. (b) Flow rate
${\sim}$
13, 16, 19 and 48, respectively. (b) Flow rate
 $Q$
plotted as a function of applied pressure
$Q$
plotted as a function of applied pressure
 $\unicode[STIX]{x0394}p$
for silicone oil with initial ball position
$\unicode[STIX]{x0394}p$
for silicone oil with initial ball position
 $z_{d}\sim 4.5~\text{mm}$
, spring constant
$z_{d}\sim 4.5~\text{mm}$
, spring constant
 $k=0.16~\text{N}\,\text{mm}^{-1}$
, and sphere radius
$k=0.16~\text{N}\,\text{mm}^{-1}$
, and sphere radius
 $a=5$
mm. Results for viscosities
$a=5$
mm. Results for viscosities
 $\unicode[STIX]{x1D702}=10,\,20$
and 100 cSt are shown as green, red and blue symbols, respectively. Maximum Reynolds number in each case is
$\unicode[STIX]{x1D702}=10,\,20$
and 100 cSt are shown as green, red and blue symbols, respectively. Maximum Reynolds number in each case is
 ${\sim}$
1, 0.24 and 0.008, respectively.
${\sim}$
1, 0.24 and 0.008, respectively.
2.2 Observations
Our experiments reveal that the flow rate increases linearly with pressure when the pressure drop is relatively small, because the position of the sphere is not influenced by the flow (figure 2). However, as pressure increases, hydrodynamic forces push the sphere towards the channel wall, thus reducing the gap size
 $h_{0}$
(see figure 1
a). This leads to an increase in the resistance to flow. After reaching a maximum in flow
$h_{0}$
(see figure 1
a). This leads to an increase in the resistance to flow. After reaching a maximum in flow
 $Q_{max}$
, at the pressure
$Q_{max}$
, at the pressure
 $\unicode[STIX]{x0394}p_{max}$
, the flow rate starts to decrease with increasing pressure and slowly approaches
$\unicode[STIX]{x0394}p_{max}$
, the flow rate starts to decrease with increasing pressure and slowly approaches
 $Q=0$
at the critical pressure drop
$Q=0$
at the critical pressure drop
 $\unicode[STIX]{x0394}p_{\text{c}}$
. The absolute magnitude of the flow can be tuned by varying the initial ball position
$\unicode[STIX]{x0394}p_{\text{c}}$
. The absolute magnitude of the flow can be tuned by varying the initial ball position
 $z_{d}$
(and hence the thickness of the gap between the sphere and tapering channel walls) or by changing the viscosity
$z_{d}$
(and hence the thickness of the gap between the sphere and tapering channel walls) or by changing the viscosity
 $\unicode[STIX]{x1D702}$
of the fluid. We observe that both the peak flow rate
$\unicode[STIX]{x1D702}$
of the fluid. We observe that both the peak flow rate
 $Q_{max}$
and optimum pressure
$Q_{max}$
and optimum pressure
 $\unicode[STIX]{x0394}p_{max}$
increase with
$\unicode[STIX]{x0394}p_{max}$
increase with
 $z_{d}$
. By contrast, only the flow rate
$z_{d}$
. By contrast, only the flow rate
 $Q$
appears to be affected significantly by variations in viscosity
$Q$
appears to be affected significantly by variations in viscosity
 $\unicode[STIX]{x1D702}$
. We note that the observed pressure-drop/flow-rate relation is similar to that of flows through externally pressurized elastic tubes (Luo & Pedley Reference Luo and Pedley2000).
$\unicode[STIX]{x1D702}$
. We note that the observed pressure-drop/flow-rate relation is similar to that of flows through externally pressurized elastic tubes (Luo & Pedley Reference Luo and Pedley2000).
The focus of our paper is on predicting the flow rate as a function of the system parameters. The Reynolds number
 $Re=\unicode[STIX]{x1D70C}u_{gap}h_{0}/\unicode[STIX]{x1D702}=(\unicode[STIX]{x1D70C}Q)/(2\unicode[STIX]{x03C0}\unicode[STIX]{x1D702}a)\leqslant 10$
in most our experiments, and hence viscous effects dominate the flow. Here,
$Re=\unicode[STIX]{x1D70C}u_{gap}h_{0}/\unicode[STIX]{x1D702}=(\unicode[STIX]{x1D70C}Q)/(2\unicode[STIX]{x03C0}\unicode[STIX]{x1D702}a)\leqslant 10$
in most our experiments, and hence viscous effects dominate the flow. Here,
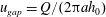 $u_{gap}=Q/(2\unicode[STIX]{x03C0}ah_{0})$
is the characteristic flow speed in the gap. We take advantage of the low-Reynolds-number conditions by using steady-state lubrication theory in the following analysis. However, we note that in experiments conducted with water at or above Reynolds number
$u_{gap}=Q/(2\unicode[STIX]{x03C0}ah_{0})$
is the characteristic flow speed in the gap. We take advantage of the low-Reynolds-number conditions by using steady-state lubrication theory in the following analysis. However, we note that in experiments conducted with water at or above Reynolds number
 $Re_{c}\simeq 30$
, periodic oscillations of the sphere’s vertical position and flow rate were observed. For instance, in a
$Re_{c}\simeq 30$
, periodic oscillations of the sphere’s vertical position and flow rate were observed. For instance, in a
 $Re\simeq 30$
experiment with initial ball displacement
$Re\simeq 30$
experiment with initial ball displacement
 $z_{d}=3.6~\text{mm}$
and pressure drop in the range
$z_{d}=3.6~\text{mm}$
and pressure drop in the range
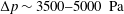 $\unicode[STIX]{x0394}p\sim 3500{-}5000~\text{Pa}$
, we observed periodic disturbances with a frequency of
$\unicode[STIX]{x0394}p\sim 3500{-}5000~\text{Pa}$
, we observed periodic disturbances with a frequency of
 $f_{\text{osc}}=2.7~\text{Hz}$
(see figure 5 in the Appendix and Supplementary movie 2 available at https://doi.org/10.1017/jfm.2017.805). This pattern has features that resemble self-excited oscillations found in other elastic flow systems (see e.g. Luo & Pedley Reference Luo and Pedley1996). In our system, the onset of oscillation and their detailed pattern are influenced by a number of effects; including hydrodynamic instabilities in the flow, the coupling between the flow and the spring–sphere system, as well as the dual relationship between flow rate
$f_{\text{osc}}=2.7~\text{Hz}$
(see figure 5 in the Appendix and Supplementary movie 2 available at https://doi.org/10.1017/jfm.2017.805). This pattern has features that resemble self-excited oscillations found in other elastic flow systems (see e.g. Luo & Pedley Reference Luo and Pedley1996). In our system, the onset of oscillation and their detailed pattern are influenced by a number of effects; including hydrodynamic instabilities in the flow, the coupling between the flow and the spring–sphere system, as well as the dual relationship between flow rate
 $Q$
and pressure drop
$Q$
and pressure drop
 $\unicode[STIX]{x0394}p$
. We note first that the natural frequency of the spring–steel sphere system with moving water column
$\unicode[STIX]{x0394}p$
. We note first that the natural frequency of the spring–steel sphere system with moving water column
 $f_{spring}=(2\unicode[STIX]{x03C0})^{-1}(k/(m_{sphere}+m_{water}))^{1/2}\sim 6~\text{Hz}$
in approximate agreement with the observed signal, where
$f_{spring}=(2\unicode[STIX]{x03C0})^{-1}(k/(m_{sphere}+m_{water}))^{1/2}\sim 6~\text{Hz}$
in approximate agreement with the observed signal, where
 $m_{water}$
is the mass of the fluid column above and below the valve (
$m_{water}$
is the mass of the fluid column above and below the valve (
 ${\sim}0.1~\text{kg}$
). The motion of the sphere is, moreover, in rough accord with the sphere’s vortex shedding frequency
${\sim}0.1~\text{kg}$
). The motion of the sphere is, moreover, in rough accord with the sphere’s vortex shedding frequency
 $f_{v}=St\,u_{gap}/(2a)=St\,Re\,\unicode[STIX]{x1D708}/(2ah_{0})=3~\text{Hz}$
, computed with values of
$f_{v}=St\,u_{gap}/(2a)=St\,Re\,\unicode[STIX]{x1D708}/(2ah_{0})=3~\text{Hz}$
, computed with values of
 $St=0.1$
for the Strouhal number (see e.g. Bearman Reference Bearman1984; Williamson Reference Williamson1996; Williamson & Govardhan Reference Williamson and Govardhan2004),
$St=0.1$
for the Strouhal number (see e.g. Bearman Reference Bearman1984; Williamson Reference Williamson1996; Williamson & Govardhan Reference Williamson and Govardhan2004),
 $Re=30$
,
$Re=30$
,
 $a=5~\text{mm}$
,
$a=5~\text{mm}$
,
 $h_{0}=0.1~\text{mm}$
and
$h_{0}=0.1~\text{mm}$
and
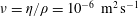 $\unicode[STIX]{x1D708}=\unicode[STIX]{x1D702}/\unicode[STIX]{x1D70C}=10^{-6}~\text{m}^{2}\,\text{s}^{-1}$
. This may indicate that vortex shedding is an important factor in determining the characteristics of the oscillations. However, the onset of this instability is also influenced by the blockage ratio
$\unicode[STIX]{x1D708}=\unicode[STIX]{x1D702}/\unicode[STIX]{x1D70C}=10^{-6}~\text{m}^{2}\,\text{s}^{-1}$
. This may indicate that vortex shedding is an important factor in determining the characteristics of the oscillations. However, the onset of this instability is also influenced by the blockage ratio
 $h_{0}/(2a)$
. For instance, Sahin & Owens (Reference Sahin and Owens2004) and Patil & Tiwari (Reference Patil and Tiwari2008) found that the critical Reynolds number
$h_{0}/(2a)$
. For instance, Sahin & Owens (Reference Sahin and Owens2004) and Patil & Tiwari (Reference Patil and Tiwari2008) found that the critical Reynolds number
 $Re_{c}$
for the onset of oscillations decreases with increasing blockage ratio. Finally, we note that the pressure could vary back and forth if a constant flow rate is maintained through the system. This may affect the characteristics of the periodic motion since the pressure drop
$Re_{c}$
for the onset of oscillations decreases with increasing blockage ratio. Finally, we note that the pressure could vary back and forth if a constant flow rate is maintained through the system. This may affect the characteristics of the periodic motion since the pressure drop
 $\unicode[STIX]{x0394}p$
is a multivalued function of flow rate
$\unicode[STIX]{x0394}p$
is a multivalued function of flow rate
 $Q$
.
$Q$
.
3 Theory
To rationalize the experimental observations (figure 2), we seek to characterize the pressure-drop/flow-rate relation as a function of the system parameters
 $$\begin{eqnarray}Q=\frac{\unicode[STIX]{x0394}p}{R}.\end{eqnarray}$$
The pressure-dependent hydraulic resistance
 $R(\unicode[STIX]{x0394}p)$
is a function of the vertical position
$R(\unicode[STIX]{x0394}p)$
is a function of the vertical position
 $z$
of the sphere, which in turn is determined by the force balance on the sphere due to the spring and hydrodynamics forces along the
$z$
of the sphere, which in turn is determined by the force balance on the sphere due to the spring and hydrodynamics forces along the
 $z$
-axis (see figure 1
a):
$z$
-axis (see figure 1
a):
 $$\begin{eqnarray}F_{spring}+F_{hyd}=0.\end{eqnarray}$$
We proceed in two steps to compute the pressure-dependent resistance
 $R$
in (3.1): First, we use lubrication theory to determine the flow field in the narrow gap between the sphere and the tapering channel walls for a fixed vertical position of the sphere and pressure drop
$R$
in (3.1): First, we use lubrication theory to determine the flow field in the narrow gap between the sphere and the tapering channel walls for a fixed vertical position of the sphere and pressure drop
 $\unicode[STIX]{x0394}p$
. This leads to a position-dependent hydraulic resistance
$\unicode[STIX]{x0394}p$
. This leads to a position-dependent hydraulic resistance
 $R(z)$
. Our analysis of the static problem follows Smistrup & Stone (Reference Smistrup and Stone2007), who considered a magenetically actuated ball valve. Then, we use the force-balance equation (3.2) to solve for the equilibrium position
$R(z)$
. Our analysis of the static problem follows Smistrup & Stone (Reference Smistrup and Stone2007), who considered a magenetically actuated ball valve. Then, we use the force-balance equation (3.2) to solve for the equilibrium position
 $z_{eq}(\unicode[STIX]{x0394}p)$
, which leads to an expression for
$z_{eq}(\unicode[STIX]{x0394}p)$
, which leads to an expression for
 $R(\unicode[STIX]{x0394}p)$
.
$R(\unicode[STIX]{x0394}p)$
.
The valve system comprises a sphere connected to a spring in a tapering cylindrical channel with opening angle
 $\unicode[STIX]{x1D6FE}$
(see figure 1
a). In the experiments, the sphere radius is
$\unicode[STIX]{x1D6FE}$
(see figure 1
a). In the experiments, the sphere radius is
 $a=5\times 10^{-3}~\text{m}$
while the typical size of the gap between the sphere and the channel walls is
$a=5\times 10^{-3}~\text{m}$
while the typical size of the gap between the sphere and the channel walls is
 $h_{0}\leqslant 10^{-4}~\text{m}$
. We therefore consider the limit where the gap is narrow (
$h_{0}\leqslant 10^{-4}~\text{m}$
. We therefore consider the limit where the gap is narrow (
 $h_{0}\ll a$
), and let
$h_{0}\ll a$
), and let
 $\unicode[STIX]{x1D6FD}a$
denote the vertical displacement of the sphere above the point of contact where
$\unicode[STIX]{x1D6FD}a$
denote the vertical displacement of the sphere above the point of contact where
 $h_{0}=0$
and
$h_{0}=0$
and
 $\unicode[STIX]{x1D6FD}=0$
. The gap thickness can then be expressed in terms of
$\unicode[STIX]{x1D6FD}=0$
. The gap thickness can then be expressed in terms of
 $\unicode[STIX]{x1D6FD}$
, the sphere radius
$\unicode[STIX]{x1D6FD}$
, the sphere radius
 $a$
, and the opening angle
$a$
, and the opening angle
 $\unicode[STIX]{x1D6FE}$
as
$\unicode[STIX]{x1D6FE}$
as
 $h_{0}=a\unicode[STIX]{x1D6FD}\sin (\unicode[STIX]{x1D6FE})$
. Because the gap is narrow, the coordinate system can locally be considered as Cartesian, with
$h_{0}=a\unicode[STIX]{x1D6FD}\sin (\unicode[STIX]{x1D6FE})$
. Because the gap is narrow, the coordinate system can locally be considered as Cartesian, with
 $x$
- and
$x$
- and
 $y$
-axes indicated in figure 1(a). Note that the
$y$
-axes indicated in figure 1(a). Note that the
 $z$
-axis in the diagram does not belong to this coordinate system.
$z$
-axis in the diagram does not belong to this coordinate system.
3.1 Lubrication theory
The flow is governed by the Navier–Stokes and continuity equations
 $$\begin{eqnarray}\displaystyle & \displaystyle \unicode[STIX]{x1D70C}\left[{\displaystyle \frac{\unicode[STIX]{x2202}\boldsymbol{u}}{\unicode[STIX]{x2202}t}}+(\boldsymbol{u}\boldsymbol{\cdot }\unicode[STIX]{x1D735})\boldsymbol{u}\right]=-\unicode[STIX]{x1D735}p+\unicode[STIX]{x1D702}\unicode[STIX]{x1D6FB}^{2}\boldsymbol{u}, & \displaystyle\end{eqnarray}$$
 $$\begin{eqnarray}\displaystyle & \displaystyle \unicode[STIX]{x1D735}\boldsymbol{\cdot }\boldsymbol{u}=0, & \displaystyle\end{eqnarray}$$
where
 $\unicode[STIX]{x1D70C}$
denotes the density,
$\unicode[STIX]{x1D70C}$
denotes the density,
 $\unicode[STIX]{x1D702}$
the viscosity,
$\unicode[STIX]{x1D702}$
the viscosity,
 $p$
the pressure, and
$p$
the pressure, and
 $\boldsymbol{u}$
the velocity field. In the steady low-Reynolds-number limit, the Navier–Stokes and continuity equations for the flow in the narrow gap (
$\boldsymbol{u}$
the velocity field. In the steady low-Reynolds-number limit, the Navier–Stokes and continuity equations for the flow in the narrow gap (
 $h_{0}/a\ll 1$
) reduce to the lubrication equations
$h_{0}/a\ll 1$
) reduce to the lubrication equations
 $$\begin{eqnarray}\displaystyle & \displaystyle \unicode[STIX]{x1D702}{\displaystyle \frac{\unicode[STIX]{x2202}^{2}u_{x}}{\unicode[STIX]{x2202}y^{2}}}={\displaystyle \frac{\unicode[STIX]{x2202}p}{\unicode[STIX]{x2202}x}}, & \displaystyle\end{eqnarray}$$
 $$\begin{eqnarray}\displaystyle & \displaystyle 0={\displaystyle \frac{\unicode[STIX]{x2202}p}{\unicode[STIX]{x2202}y}}, & \displaystyle\end{eqnarray}$$
 $$\begin{eqnarray}\displaystyle & \displaystyle {\displaystyle \frac{\unicode[STIX]{x2202}u_{x}}{\unicode[STIX]{x2202}x}}+{\displaystyle \frac{\unicode[STIX]{x2202}u_{y}}{\unicode[STIX]{x2202}y}}=0. & \displaystyle\end{eqnarray}$$
From equation (3.5b
) it is seen that the pressure does not depend on
 $y$
, and hence
$y$
, and hence
 $u_{x}$
can be found from equation (3.5a
), by using no-slip boundary conditions at
$u_{x}$
can be found from equation (3.5a
), by using no-slip boundary conditions at
 $y=0$
and
$y=0$
and
 $y=h(x)$
, as
$y=h(x)$
, as
 $$\begin{eqnarray}u_{x}(x,y)={\displaystyle \frac{1}{2\unicode[STIX]{x1D702}}}{\displaystyle \frac{\unicode[STIX]{x2202}p}{\unicode[STIX]{x2202}x}}(y^{2}-yh(x)).\end{eqnarray}$$
The gap
 $h(x)$
between the sphere and the channel walls is locally approximated by a parabola
$h(x)$
between the sphere and the channel walls is locally approximated by a parabola
 $$\begin{eqnarray}h(x)=h_{0}\left[1+{\displaystyle \frac{x^{2}}{2h_{0}a}}+O\left({\displaystyle \frac{x^{4}}{h_{0}a^{3}}}\right)\right].\end{eqnarray}$$
The total flow rate,
 $Q$
, is found by integrating the flow field (3.6) in the gap around sphere:
$Q$
, is found by integrating the flow field (3.6) in the gap around sphere:
 $$\begin{eqnarray}Q=2\unicode[STIX]{x03C0}a\cos (\unicode[STIX]{x1D6FE})\int _{0}^{h(x)}u_{x}(x,y)\,\text{d}y=-{\displaystyle \frac{\unicode[STIX]{x2202}p}{\unicode[STIX]{x2202}x}}{\displaystyle \frac{\unicode[STIX]{x03C0}a\cos (\unicode[STIX]{x1D6FE})h^{3}(x)}{6\unicode[STIX]{x1D702}}},\end{eqnarray}$$
where the factor
 $2\unicode[STIX]{x03C0}a\cos (\unicode[STIX]{x1D6FE})$
comes from integrating along the circular gap of radius
$2\unicode[STIX]{x03C0}a\cos (\unicode[STIX]{x1D6FE})$
comes from integrating along the circular gap of radius
 $a\cos (\unicode[STIX]{x1D6FE})$
. Since the flow rate must be independent of
$a\cos (\unicode[STIX]{x1D6FE})$
. Since the flow rate must be independent of
 $x$
, the pressure drop across the sphere is
$x$
, the pressure drop across the sphere is
 $$\begin{eqnarray}\displaystyle \unicode[STIX]{x0394}p=\displaystyle \int _{\infty }^{-\infty }{\displaystyle \frac{\unicode[STIX]{x2202}p}{\unicode[STIX]{x2202}x}}\,\text{d}x & = & \displaystyle {\displaystyle \frac{6\unicode[STIX]{x1D702}Q}{\unicode[STIX]{x03C0}a\cos (\unicode[STIX]{x1D6FE})}}\int _{-\infty }^{\infty }{\displaystyle \frac{1}{h^{3}(x)}}\,\text{d}x\end{eqnarray}$$
 $$\begin{eqnarray}\displaystyle & = & \displaystyle \displaystyle {\displaystyle \frac{9\unicode[STIX]{x1D702}Q}{2\sqrt{2}\cos (\unicode[STIX]{x1D6FE})(ah_{0}^{5})^{1/2}}}\end{eqnarray}$$
 $$\begin{eqnarray}\displaystyle & = & \displaystyle \displaystyle \frac{9\unicode[STIX]{x1D702}Q}{2\sqrt{2}\,a^{3}\cos \unicode[STIX]{x1D6FE}(\unicode[STIX]{x1D6FD}\sin \unicode[STIX]{x1D6FE})^{5/2}},\end{eqnarray}$$
 $h_{0}=\unicode[STIX]{x1D6FD}a\sin (\unicode[STIX]{x1D6FE})$
in the final step. Note that the hydraulic resistance
$h_{0}=\unicode[STIX]{x1D6FD}a\sin (\unicode[STIX]{x1D6FE})$
in the final step. Note that the hydraulic resistance
 $R=\unicode[STIX]{x0394}p/Q$
scales with the gap viscosity, thickness and sphere radius as
$R=\unicode[STIX]{x0394}p/Q$
scales with the gap viscosity, thickness and sphere radius as
 $R\sim \unicode[STIX]{x1D702}a^{-1/2}h_{0}^{-5/2}$
.
$R\sim \unicode[STIX]{x1D702}a^{-1/2}h_{0}^{-5/2}$
.
3.2 Force balance
To derive the flow-rate/pressure-drop relation for the system, we proceed to determine the equilibrium position
 $z_{d,eq}$
of the sphere from the force balance (3.2) (see figure 1
a). This leads to an expression for the equilibrium relative displacement
$z_{d,eq}$
of the sphere from the force balance (3.2) (see figure 1
a). This leads to an expression for the equilibrium relative displacement
 $\unicode[STIX]{x1D6FD}_{eq}=z_{eq}/a$
which then used in (3.9c
) to determine the resistance.
$\unicode[STIX]{x1D6FD}_{eq}=z_{eq}/a$
which then used in (3.9c
) to determine the resistance.
To model the extension spring we assume a linear spring force of
 $$\begin{eqnarray}F_{spring}=-k\unicode[STIX]{x0394}z,\end{eqnarray}$$
where
 $k$
is the spring constant and
$k$
is the spring constant and
 $\unicode[STIX]{x0394}z$
is the vertical displacement from the equilibrium position. Let
$\unicode[STIX]{x0394}z$
is the vertical displacement from the equilibrium position. Let
 $z_{0}$
be the equilibrium length when no pressure is applied and let
$z_{0}$
be the equilibrium length when no pressure is applied and let
 $z_{max}$
be the maximum extension of the spring, obtained when the sphere touches the inclined wall. For a sphere located a distance
$z_{max}$
be the maximum extension of the spring, obtained when the sphere touches the inclined wall. For a sphere located a distance
 $z_{d}=\unicode[STIX]{x1D6FD}a$
above the contact point, the spring extension is
$z_{d}=\unicode[STIX]{x1D6FD}a$
above the contact point, the spring extension is
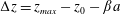 $\unicode[STIX]{x0394}z=z_{max}-z_{0}-\unicode[STIX]{x1D6FD}a$
, and hence the spring force is given by
$\unicode[STIX]{x0394}z=z_{max}-z_{0}-\unicode[STIX]{x1D6FD}a$
, and hence the spring force is given by
 $F_{spring}=-k(z_{max}-z_{0}-\unicode[STIX]{x1D6FD}a)$
.
$F_{spring}=-k(z_{max}-z_{0}-\unicode[STIX]{x1D6FD}a)$
.
The hydrodynamic force on the sphere is given by
 $$\begin{eqnarray}F_{hyd,i}=\int _{\unicode[STIX]{x2202}\unicode[STIX]{x1D6FA}}\left[-p\unicode[STIX]{x1D6FF}_{ij}+\unicode[STIX]{x1D702}(\unicode[STIX]{x2202}_{i}u_{j}+\unicode[STIX]{x2202}_{j}u_{i})\right]n_{j}\,\text{d}a,\end{eqnarray}$$
where we use the index notation and
 $\unicode[STIX]{x2202}\unicode[STIX]{x1D6FA}$
denotes the surface of the sphere. In the lubrication limit, we expect that the pressure term dominates the vertical force on the sphere. The main pressure gradient occurs in a narrow region near the gap, and the pressure force can thus be approximated by assuming constant pressures above (
$\unicode[STIX]{x2202}\unicode[STIX]{x1D6FA}$
denotes the surface of the sphere. In the lubrication limit, we expect that the pressure term dominates the vertical force on the sphere. The main pressure gradient occurs in a narrow region near the gap, and the pressure force can thus be approximated by assuming constant pressures above (
 $p_{0}+\unicode[STIX]{x0394}p$
) and below (
$p_{0}+\unicode[STIX]{x0394}p$
) and below (
 $p_{0}$
) the sphere:
$p_{0}$
) the sphere:
 $$\begin{eqnarray}\displaystyle F_{hyd}^{(p)} & \simeq & \displaystyle \displaystyle 2\unicode[STIX]{x03C0}a^{2}(p_{0}+\unicode[STIX]{x0394}p)\int _{0}^{\unicode[STIX]{x03C0}/2+\unicode[STIX]{x1D6FE}}\cos (\unicode[STIX]{x1D703})\sin (\unicode[STIX]{x1D703})\,\text{d}\unicode[STIX]{x1D703}+2\unicode[STIX]{x03C0}a^{2}p_{0}\int _{\unicode[STIX]{x03C0}/2+\unicode[STIX]{x1D6FE}}^{\unicode[STIX]{x03C0}}\cos (\unicode[STIX]{x1D703})\sin (\unicode[STIX]{x1D703})\,\text{d}\unicode[STIX]{x1D703}\nonumber\\ \displaystyle & = & \displaystyle \unicode[STIX]{x03C0}a^{2}\cos (\unicode[STIX]{x1D6FE})^{2}\unicode[STIX]{x0394}p,\end{eqnarray}$$
where
 $\unicode[STIX]{x1D703}$
is the angle measured from the vertical. To obtain the viscous force, we note that in the lubrication approximation
$\unicode[STIX]{x1D703}$
is the angle measured from the vertical. To obtain the viscous force, we note that in the lubrication approximation
 $\unicode[STIX]{x2202}/\unicode[STIX]{x2202}x\ll \unicode[STIX]{x2202}/\unicode[STIX]{x2202}y$
, so the dominant term is
$\unicode[STIX]{x2202}/\unicode[STIX]{x2202}x\ll \unicode[STIX]{x2202}/\unicode[STIX]{x2202}y$
, so the dominant term is
 $$\begin{eqnarray}\displaystyle & \displaystyle F_{hyd}^{(visc)}\simeq 2\unicode[STIX]{x03C0}a\cos (\unicode[STIX]{x1D6FE})\unicode[STIX]{x1D702}\int _{-\infty }^{\infty }\left.{\displaystyle \frac{\unicode[STIX]{x2202}u_{x}}{\unicode[STIX]{x2202}y}}\right|_{y=h(x)}\cos (\unicode[STIX]{x1D6FE})\,\text{d}x={\displaystyle \frac{4\unicode[STIX]{x03C0}}{3}}\cos ^{2}(\unicode[STIX]{x1D6FE})\sin (\unicode[STIX]{x1D6FE})\unicode[STIX]{x1D6FD}a^{2}\unicode[STIX]{x0394}p, & \displaystyle\end{eqnarray}$$
where the prefactor
 $2\unicode[STIX]{x03C0}a\cos \unicode[STIX]{x1D6FE}$
comes from integration around the contact line, and the factor
$2\unicode[STIX]{x03C0}a\cos \unicode[STIX]{x1D6FE}$
comes from integration around the contact line, and the factor
 $\cos \unicode[STIX]{x1D6FE}$
in the integral from the force projection along the
$\cos \unicode[STIX]{x1D6FE}$
in the integral from the force projection along the
 $z$
-axis. Comparing the magnitude of the pressure (3.12) and viscous (3.13) forces, we find
$z$
-axis. Comparing the magnitude of the pressure (3.12) and viscous (3.13) forces, we find
 $$\begin{eqnarray}\frac{F_{hyd}^{(visc)}}{F_{hyd}^{(p)}}=\frac{4}{3}\frac{h_{0}}{a}.\end{eqnarray}$$
In our case, where
 $h_{0}\ll a$
, the pressure force is seen to dominate the hydrodynamic force on the sphere.
$h_{0}\ll a$
, the pressure force is seen to dominate the hydrodynamic force on the sphere.
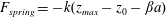
To find the vertical equilibrium position of the sphere, we now combine the spring force (3.10) and the pressure force (3.12) using the force-balance equation (3.2), and find
 $$\begin{eqnarray}\unicode[STIX]{x03C0}a^{2}\cos (\unicode[STIX]{x1D6FE})^{2}\unicode[STIX]{x0394}p-k(z_{d}-a\unicode[STIX]{x1D6FD})=0,\end{eqnarray}$$
where we have written the initial height as
 $z_{d}=z_{0}-z_{max}$
. This leads to an expression for the relative position
$z_{d}=z_{0}-z_{max}$
. This leads to an expression for the relative position
 $\unicode[STIX]{x1D6FD}$
at equilibrium:
$\unicode[STIX]{x1D6FD}$
at equilibrium:
 $$\begin{eqnarray}\unicode[STIX]{x1D6FD}=\frac{kz_{d}-\unicode[STIX]{x0394}p\unicode[STIX]{x03C0}a^{2}\cos (\unicode[STIX]{x1D6FE})^{2}}{ka}.\end{eqnarray}$$
Combining (3.16) and (3.9c
) leads to a nonlinear pressure-dependent flow rate
 $Q$
$Q$
 $$\begin{eqnarray}Q={\displaystyle \frac{2\sqrt{2}}{9}}{\displaystyle \frac{\cos ^{6}(\unicode[STIX]{x1D6FE})a^{3}}{\unicode[STIX]{x1D702}}}\left({\displaystyle \frac{a\unicode[STIX]{x03C0}\sin (\unicode[STIX]{x1D6FE})}{k}}\right)^{5/2}\left({\displaystyle \frac{kz_{d}}{\unicode[STIX]{x03C0}a^{2}\cos ^{2}(\unicode[STIX]{x1D6FE})}}-\unicode[STIX]{x0394}p\right)^{5/2}\unicode[STIX]{x0394}p.\end{eqnarray}$$
Introducing the low-pressure-limit resistance
 $$\begin{eqnarray}R_{0}=\frac{9}{2\sqrt{2}\sin (\unicode[STIX]{x1D6FE})^{5/2}\cos (\unicode[STIX]{x1D6FE})}\frac{\unicode[STIX]{x1D702}}{(az_{d}^{5})^{1/2}}\end{eqnarray}$$
and the critical pressure drop
 $\unicode[STIX]{x0394}p_{c}$
that makes the ball block the channel
$\unicode[STIX]{x0394}p_{c}$
that makes the ball block the channel
 $$\begin{eqnarray}\unicode[STIX]{x0394}p_{c}={\displaystyle \frac{kz_{d}}{\unicode[STIX]{x03C0}a^{2}\cos ^{2}(\unicode[STIX]{x1D6FE})}},\end{eqnarray}$$
leads to a convenient expression for the flow rate:
 $$\begin{eqnarray}Q=\frac{\unicode[STIX]{x0394}p}{R_{0}}\left(1-\unicode[STIX]{x0394}p/\unicode[STIX]{x0394}p_{c}\right)^{5/2}.\end{eqnarray}$$
When
 $\unicode[STIX]{x0394}p\ll \unicode[STIX]{x0394}p_{c}$
the flow rate scales linearly with pressure drop
$\unicode[STIX]{x0394}p\ll \unicode[STIX]{x0394}p_{c}$
the flow rate scales linearly with pressure drop
 $\unicode[STIX]{x0394}p$
, in accord with experimental observations (figure 2). A maximum in the flow rate occurs at the pressure drop
$\unicode[STIX]{x0394}p$
, in accord with experimental observations (figure 2). A maximum in the flow rate occurs at the pressure drop
 $\unicode[STIX]{x0394}p_{max}=2/7\unicode[STIX]{x0394}p_{c}$
, above which the valve gradually closes and the flow rate
$\unicode[STIX]{x0394}p_{max}=2/7\unicode[STIX]{x0394}p_{c}$
, above which the valve gradually closes and the flow rate
 $Q$
starts to decay.
$Q$
starts to decay.

Figure 3. Normalized flow rate
 $Q/Q_{max}$
plotted as a function of (a) relative pressure drop
$Q/Q_{max}$
plotted as a function of (a) relative pressure drop
 $\unicode[STIX]{x0394}p/\unicode[STIX]{x0394}p_{max}$
and (b)
$\unicode[STIX]{x0394}p/\unicode[STIX]{x0394}p_{max}$
and (b)
 $(2/5)^{5/2}(7/2-\unicode[STIX]{x0394}p/\unicode[STIX]{x0394}p_{max})^{5/2}\unicode[STIX]{x0394}p/\unicode[STIX]{x0394}p_{max}$
, using data from figure 2(a,b). The solid line shows the theoretical prediction obtained using lubrication theory (3.21).
$(2/5)^{5/2}(7/2-\unicode[STIX]{x0394}p/\unicode[STIX]{x0394}p_{max})^{5/2}\unicode[STIX]{x0394}p/\unicode[STIX]{x0394}p_{max}$
, using data from figure 2(a,b). The solid line shows the theoretical prediction obtained using lubrication theory (3.21).
3.3 Comparison between experiment and theory
The lubrication-theory model for the flow rate
 $Q$
(3.17) captures the essential qualitative behaviour of the experimental data (figure 2), and we find good quantitative agreement between experiments and theory with no free parameters. Moreover, the data collapsed onto a single line when scaled according to the maximum flow rate
$Q$
(3.17) captures the essential qualitative behaviour of the experimental data (figure 2), and we find good quantitative agreement between experiments and theory with no free parameters. Moreover, the data collapsed onto a single line when scaled according to the maximum flow rate
 $Q_{max}$
and corresponding pressure
$Q_{max}$
and corresponding pressure
 $\unicode[STIX]{x0394}p_{max}$
(figure 3). The data collapse is seen to be in good accord with the prediction from (3.20), which yields
$\unicode[STIX]{x0394}p_{max}$
(figure 3). The data collapse is seen to be in good accord with the prediction from (3.20), which yields
 $$\begin{eqnarray}\frac{Q}{Q_{max}}=\left(\frac{\unicode[STIX]{x0394}p_{c}-\unicode[STIX]{x0394}p}{\unicode[STIX]{x0394}p_{c}-\unicode[STIX]{x0394}p_{max}}\right)^{5/2}\frac{\unicode[STIX]{x0394}p}{\unicode[STIX]{x0394}p_{max}}=\left(\frac{2}{5}\right)^{5/2}\left(\frac{7}{2}-\frac{\unicode[STIX]{x0394}p}{\unicode[STIX]{x0394}p_{max}}\right)^{5/2}\frac{\unicode[STIX]{x0394}p}{\unicode[STIX]{x0394}p_{max}},\end{eqnarray}$$
where we have used that the maximum pressure is
 $\unicode[STIX]{x0394}p_{max}=(2/7)\unicode[STIX]{x0394}p_{c}$
.
$\unicode[STIX]{x0394}p_{max}=(2/7)\unicode[STIX]{x0394}p_{c}$
.
3.4 Implications for biological soft valves
Elastic conduits and flexible valves are found in numerous biological fluid systems. Our geometry is qualitatively similar to torus-margo pits, microscopic channels that link neighbouring vascular channels in coniferous trees (Choat et al. Reference Choat, Cobb and Jansen2008; Jensen et al. Reference Jensen, Berg-Sørensen, Bruus, Holbrook, Liesche, Schulz, Zwieniecki and Bohr2016). In these pores, an oblate spheroid is suspended from numerous flexible cellulose fibres above a narrow hole. Despite the difference in geometry, it is probable that the flow-rate/pressure-drop relation of these structures is qualitatively to our experiments (figure 2, (3.20)).
Elastic and geometric properties of pit pores were obtained by Capron et al. (Reference Capron, Tordjeman, Charru, Badel and Cochard2014), who found values of
 $z_{d}=2~\unicode[STIX]{x03BC}\text{m}$
,
$z_{d}=2~\unicode[STIX]{x03BC}\text{m}$
,
 $a=3.5~\unicode[STIX]{x03BC}\text{m}$
, and
$a=3.5~\unicode[STIX]{x03BC}\text{m}$
, and
 $k\simeq 10~\text{N}\,\text{m}^{-1}$
. With these values, our theory predict a critical pressure for closing the valve of
$k\simeq 10~\text{N}\,\text{m}^{-1}$
. With these values, our theory predict a critical pressure for closing the valve of
 $\unicode[STIX]{x0394}p_{c}\sim 0.5~\text{MPa}$
, while the maximum flow is obtained at
$\unicode[STIX]{x0394}p_{c}\sim 0.5~\text{MPa}$
, while the maximum flow is obtained at
 $\unicode[STIX]{x0394}p_{max}\sim 0.15~\text{MPa}$
.
$\unicode[STIX]{x0394}p_{max}\sim 0.15~\text{MPa}$
.
4 Discussion and conclusion
In this paper we have presented an experimental and theoretical study of a bioinspired soft valve. The model system comprised a sphere connected to a spring located inside a tapering channel. A coupling between elasticity and fluid motion determines the hydraulic resistance of the valve because the position of the sphere is influenced by the flow, and vice versa. Using a simple set-up, we performed experiments to characterize the pressure-drop/flow-rate relationship for the system. Our data revealed a strongly nonlinear behaviour and the existence of an optimal pressure drop for the system where the flow rate is maximized.
Assuming low-Reynolds-number flow, we proposed a mathematical model that reduced the complexity of the flow to a two-dimensional lubrication approximation. The model revealed a relatively complete picture of the geometric and material parameters that affect flow through the system. The model predictions compared favourably to the results of our experiments. Our analysis is limited to steady viscous flows, though preliminary observations demonstrate the onset of self-excited oscillations.
Acknowledgements
This work was supported by a research grant (13166) from VILLUM FONDEN. We also thank P. E. Andersen, D. Shacham and E. Hansen for assistance in the design of the experimental set-up.
Supplementary movies
Supplementary movies are available at https://doi.org/10.1017/jfm.2017.805.
Appendix. Tracing the meniscus
The pressure-drop/flow-rate relation was determined experimentally as outlined in figures 1(c) and 4. A stack of images showing the meniscus movement was converted to grey scale and cropped to show the silicone tube above the soft valve. The two-dimensional images
 $I(z,x,t)$
were converted to a one-dimensional intensity profile
$I(z,x,t)$
were converted to a one-dimensional intensity profile
 $I^{\prime }(z,t)=\sum _{x}I(z,x,t)$
by summing the values in each horizontal image row. We traced the position of the meniscus by locating the maximum in the intensity gradient
$I^{\prime }(z,t)=\sum _{x}I(z,x,t)$
by summing the values in each horizontal image row. We traced the position of the meniscus by locating the maximum in the intensity gradient
 ${\sim}\unicode[STIX]{x2202}_{z}I^{\prime }(z,t)$
at the position
${\sim}\unicode[STIX]{x2202}_{z}I^{\prime }(z,t)$
at the position
 $z_{max}(t)$
. This yielded the meniscus position
$z_{max}(t)$
. This yielded the meniscus position
 $z_{max}=l(t)$
, which in turn allowed us to determine the flow rate
$z_{max}=l(t)$
, which in turn allowed us to determine the flow rate
 $Q$
. In order to minimize effects of image noise in determining
$Q$
. In order to minimize effects of image noise in determining
 $z_{max}$
, we manually indicated the initial meniscus position and used a tracing window.
$z_{max}$
, we manually indicated the initial meniscus position and used a tracing window.

Figure 4. Experimental result for
 $z_{d}=2.9~\text{mm}$
with water. (a) Time versus liquid column height graph with a montage of images of every 10 s. Tracking points (circles) are well fitted with experimental images (horizontal white lines). (b) Pressure-drop and flow-rate graph from (a). Inset shows the ball position at a certain pressure drop.
$z_{d}=2.9~\text{mm}$
with water. (a) Time versus liquid column height graph with a montage of images of every 10 s. Tracking points (circles) are well fitted with experimental images (horizontal white lines). (b) Pressure-drop and flow-rate graph from (a). Inset shows the ball position at a certain pressure drop.

Figure 5. (a) Experimental kymograph of a soft valve with water and
 $z_{d}=2.9~\text{mm}$
. Image variation shows ball movement during the experiment (see Supplementary movie 1). (b) Kymograph of a soft valve with water and
$z_{d}=2.9~\text{mm}$
. Image variation shows ball movement during the experiment (see Supplementary movie 1). (b) Kymograph of a soft valve with water and
 $z_{d}=3.6~\text{mm}$
for the first 4 s of Supplementary movie 2. The pressure drop decreases from 4800 to 4500 Pa and the corresponding Reynolds number is
$z_{d}=3.6~\text{mm}$
for the first 4 s of Supplementary movie 2. The pressure drop decreases from 4800 to 4500 Pa and the corresponding Reynolds number is
 ${\sim}30$
. The observed oscillation frequency
${\sim}30$
. The observed oscillation frequency
 $f_{\text{obs}}\sim 2.7~\text{Hz}$
. See also Supplementary movie 2.
$f_{\text{obs}}\sim 2.7~\text{Hz}$
. See also Supplementary movie 2.


