


1. Introduction
The impact of liquid droplets on solid and liquid targets has been studied extensively since the seminal work of Worthington (Reference Worthington1876, Reference Worthington1882) and is important to many physical, biological and industrial processes. For instance, the splashing of raindrops on vegetation can eject tiny secondary droplets which may carry seeds, bacteria and pathogenic fungal spores over long distances (Fitt, McCartney & Walklate Reference Fitt, McCartney and Walklate1989; Amador et al. Reference Amador, Yamada, McCurley and Hu2013). Rainfall can damp waves on the ocean surface (Tsimplis & Thorpe Reference Tsimplis and Thorpe1989) and cause soil erosion on agricultural lands (Ellison Reference Ellison1944). Furthermore, drop impact is important in metallurgical spray quenching (Bernardin, Stebbins & Mudawar Reference Bernardin, Stebbins and Mudawar1997), spray painting (Hines Reference Hines1966), pesticide spraying (Alm, Reichard & Hall Reference Alm, Reichard and Hall1987) and chemical dispersant application on oil spills (Fingas Reference Fingas2013).
As reviewed by Rein (Reference Rein1993), droplet impact has been studied in a number of configurations, and the resulting splash behaviour depends greatly on the droplet and target properties. For example, the target may be solid or liquid, which causes large differences in splash behaviour. For liquid targets, the receiving fluid may be the same as or different from the droplet fluid, and, if different, these two fluids may be miscible or immiscible (Lhuissier et al. Reference Lhuissier, Sun, Prosperetti and Lohse2013). The depth of the target liquid also influences the splash behaviour. For example, the underlying boundary of a shallow pool alters the cavity shape and the speed and size of the rebounding jet compared with those occurring in a deep pool (e.g. Hobbs & Osheroff Reference Hobbs and Osheroff1967; Macklin & Hobbs Reference Macklin and Hobbs1969; Macklin & Metaxas Reference Macklin and Metaxas1976; Rein Reference Rein1993). Numerous recent studies have investigated phenomena associated with droplet impact on very thin liquid films over solid boundaries (e.g. Cossali, Coghe & Marengo Reference Cossali, Coghe and Marengo1997; Weiss & Yarin Reference Weiss and Yarin1999; Wang & Chen Reference Wang and Chen2000; Rioboo et al. Reference Rioboo, Bauthier, Conti, Voué and De Coninck2003; Okawa, Shiraishi & Mori Reference Okawa, Shiraishi and Mori2006; Krechetnikov & Homsy Reference Krechetnikov and Homsy2009; Zhang et al. Reference Zhang, Brunet, Eggers and Deegan2010; Thoraval et al. Reference Thoraval, Takehara, Etoh and Thoroddsen2013; Agbaglah & Deegan Reference Agbaglah and Deegan2014; Guildenbecher et al. Reference Guildenbecher, Engvall, Gao, Grasser, Reu and Chen2014; Shetabivash, Ommi & Heidarinejad Reference Shetabivash, Ommi and Heidarinejad2014). However, little is known about splashing phenomena occurring when the droplet falls on a thin layer of liquid floating on a deep pool of a denser fluid. Examples involving immiscible liquid layers include oil slicks created by crude oil spilled or released by natural seeps in oceans (Fingas Reference Fingas2013), oily sheens created when prey fish are consumed by predators (Franklin, Brownrigg & Farish Reference Franklin and Brownrigg1774) and the lipid-rich sea surface microlayer (Hardy Reference Hardy1982). The impact of these oil layers on air–sea interface processes, such as marine aerosol formation (Lewis & Schwartz Reference Lewis and Schwartz2004) and interfacial gas and heat transfer (Csanady Reference Csanady2001), is largely unknown. Crude oil slicks, which range in thickness from less than a micron to several millimetres, are particularly important because of their negative environmental, economic and public health impacts (e.g. see reviews in Teal & Howarth Reference Teal and Howarth1984; Aguilera et al. Reference Aguilera, Méndez, Pásaro and Laffon2010; Fingas Reference Fingas2013). These slicks may cover large areas, up to several thousand square kilometres in the case of the 2010 Deepwater Horizon accident (Grimaldi et al. Reference Grimaldi, Coviello, Lacava, Pergola, Tramutoli, Ji, Liu, MacFayden and Wesiberg2011). This study focuses on thin crude oil slicks on seawater.

Figure 1. The
 $\mathit{We}_{d}{-}\mathit{Fr}_{d}$
plane showing classification of miscible droplet impact behaviour into five regimes based on previous studies:
$\mathit{We}_{d}{-}\mathit{Fr}_{d}$
plane showing classification of miscible droplet impact behaviour into five regimes based on previous studies:
 $\times$
C&VR, coalescence and vortex ring; ▵ RE, regular entrainment; ○ S&TJ, swell and thin jet; ▫ C&TJ, crown and thick jet; ♢ BC, bubble canopy. Solid black line (raindrop TS), 0.4–5.8 mm raindrops falling at terminal speed (Gunn & Kinzer Reference Gunn and Kinzer1949); solid grey line (drop TS (
$\times$
C&VR, coalescence and vortex ring; ▵ RE, regular entrainment; ○ S&TJ, swell and thin jet; ▫ C&TJ, crown and thick jet; ♢ BC, bubble canopy. Solid black line (raindrop TS), 0.4–5.8 mm raindrops falling at terminal speed (Gunn & Kinzer Reference Gunn and Kinzer1949); solid grey line (drop TS (
 $C_{d}=1$
)), constant Fr for drops falling at terminal speed with an assumed drag coefficient
$C_{d}=1$
)), constant Fr for drops falling at terminal speed with an assumed drag coefficient
 $C_{d}=1$
; dashed line, onset of the bubble canopy regime at
$C_{d}=1$
; dashed line, onset of the bubble canopy regime at
 $\mathit{We}_{d}=2000$
. The
$\mathit{We}_{d}=2000$
. The
 $d{-}u$
axes indicate the directions of increasing drop diameter and drop speed respectively. Dotted lines, constant drop diameter of
$d{-}u$
axes indicate the directions of increasing drop diameter and drop speed respectively. Dotted lines, constant drop diameter of
 $d=0.5$
and 10 mm; dash-dot lines, constant drop speeds of
$d=0.5$
and 10 mm; dash-dot lines, constant drop speeds of
 $u=0.5$
and
$u=0.5$
and
 $10~\text{m}~\text{s}^{-1}$
.
$10~\text{m}~\text{s}^{-1}$
.
The introduction of an immiscible crude oil layer on the sea surface alters the processes occurring during droplet (e.g. raindrop or spume droplet) impact, with consequences for marine aerosol creation and oil spill dispersal. These processes are expected to depend on the oil slick thickness, oil properties (viscosity, density, surface tension with air and interfacial tension with seawater) and drop properties (size, speed and surface tension). For high-speed raindrop impact, the resulting splash has the potential to eject secondary droplets of both the thin oil layer and the bulk target fluid into the air as aerosol. While aerosolization of chemicals, phytoplankton and bacteria from the sea surface microlayer is a recognized and important transport process (e.g. Hardy Reference Hardy1982; Blanchard Reference Blanchard1989; Tervahattu et al. Reference Tervahattu, Hartonen, Kerminen, Kupiainen, Aarnio, Koskentalo, Tuck and Vaida2002; Cheng et al. Reference Cheng, Zhou, Irvin, Pierce, Naar, Backer, Fleming, Kirkpatrick and Baden2005; Prather et al. Reference Prather, Bertram, Grassian, Deane, Stokes, DeMott, Aluwihare, Palenik, Azam, Seinfeld, Moffet, Molina, Cappa, Geiger, Roberts, Russell, Ault, Baltrusaitis, Collins, Corrigan, Cuadra-Rodriguez, Ebben, Forestieri, Guasco, Hersey, Kim, Lambert, Modini, Mui, Pedler, Ruppel, Ryder, Schoepp, Sullivan and Zhao2013), aerosolization of polluting hydrocarbons, due to bubble bursting on the ocean surface, has only recently been demonstrated (Ehrenhauser et al. Reference Ehrenhauser, Avij, Shu, Dugas, Woodson, Liyana-Arachchi, Zhang, Hung and Valsaraj2014). Furthermore, droplet impact could entrain the immiscible oil layer into the bulk fluid, thereby contributing to dispersion of the oil slick into the water column (Delvigne & Sweeney Reference Delvigne and Sweeney1988; Thorpe Reference Thorpe1995; Li & Garrett Reference Li and Garrett1998; Li et al. Reference Li, Lee, King, Boufadel and Venosa2008).
The flow resulting from droplet impact on a deep liquid pool of the same fluid has received considerable attention. For low-viscosity fluids, such as water, we have mapped out previous experimental studies of the splash behaviour in figure 1 as a function of the droplet Weber number (
 $\mathit{We}_{d}$
) and Froude number (
$\mathit{We}_{d}$
) and Froude number (
 $\mathit{Fr}_{d}$
). Here,
$\mathit{Fr}_{d}$
). Here,
 $\mathit{We}_{d}={\it\rho}u^{2}d/{\it\sigma}$
and
$\mathit{We}_{d}={\it\rho}u^{2}d/{\it\sigma}$
and
 $\mathit{Fr}_{d}=u^{2}/gd$
,
$\mathit{Fr}_{d}=u^{2}/gd$
,
 $u$
is the droplet impact speed,
$u$
is the droplet impact speed,
 $d$
is the droplet diameter,
$d$
is the droplet diameter,
 ${\it\rho}$
is the fluid density,
${\it\rho}$
is the fluid density,
 $g$
is the gravitational acceleration and
$g$
is the gravitational acceleration and
 ${\it\sigma}$
is the surface tension of the droplet with air. In cases where only the fall distance
${\it\sigma}$
is the surface tension of the droplet with air. In cases where only the fall distance
 $H$
was given, impact speed was calculated from
$H$
was given, impact speed was calculated from
 $u=(2gH)^{1/2}$
. The results are classified into five regimes, including (i) droplet coalescence and formation of a subsurface vortex ring (C&VR, Chapman & Critchlow Reference Chapman and Critchlow1967; Esmailizadeh & Mesler Reference Esmailizadeh and Mesler1986; Cai Reference Cai1989; Sigler & Mesler Reference Sigler and Mesler1989; Pumphrey & Elmore Reference Pumphrey and Elmore1990; Rein Reference Rein1996; Elmore, Chahine & Oguz Reference Elmore, Chahine and Oguz2001; Leng Reference Leng2001; Deng, Anilkumar & Wang Reference Deng, Anilkumar and Wang2007; Liow & Cole Reference Liow and Cole2009), (ii) regular entrainment of bubbles (RE, Pumphrey & Elmore Reference Pumphrey and Elmore1990; Rein Reference Rein1996; Morton, Rudman & Leng Reference Morton, Rudman and Leng2000; Elmore et al.
Reference Elmore, Chahine and Oguz2001; Leng Reference Leng2001; Deng et al.
Reference Deng, Anilkumar and Wang2007; Liow & Cole Reference Liow, Cole, Jacobs, McIntyre, Cleary, Buttsworth, Mee, Clements, Morgan and Lemckert2007), (iii) swell and thin jet (S&TJ, Hallet & Christensen Reference Hallet and Christensen1984; Rein Reference Rein1996; Elmore et al.
Reference Elmore, Chahine and Oguz2001; Leng Reference Leng2001; Deng et al.
Reference Deng, Anilkumar and Wang2007), (iv) crown and thick jet (C&TJ, Worthington Reference Worthington1882; Worthington & Cole Reference Worthington and Cole1896; Worthington Reference Worthington1908; Franz Reference Franz1959; van de Sande, Smith & van Oord Reference van de Sande, Smith and van Oord1974; Macklin & Metaxas Reference Macklin and Metaxas1976; Hallet & Christensen Reference Hallet and Christensen1984; Hsiao, Lichter & Quintero Reference Hsiao, Lichter and Quintero1988; Khaleeq-ur-Rahman & Saunders Reference Khaleeq-ur-Rahman and Saunders1988; Cai Reference Cai1989; Pumphrey & Elmore Reference Pumphrey and Elmore1990; Rein Reference Rein1993, Reference Rein1996; Morton et al.
Reference Morton, Rudman and Leng2000; Leng Reference Leng2001; Fedorchenko & Wang Reference Fedorchenko and Wang2004; Tomita, Saito & Ganbara Reference Tomita, Saito and Ganbara2007; Bisighini et al.
Reference Bisighini, Cossali, Tropea and Roisman2010) and (v) bubble canopy (BC, Worthington Reference Worthington1882; Worthington & Cole Reference Worthington and Cole1896; Worthington Reference Worthington1908; Franz Reference Franz1959; Engel Reference Engel1966; van de Sande et al.
Reference van de Sande, Smith and van Oord1974; Hallet & Christensen Reference Hallet and Christensen1984; Snyder Reference Snyder1990; Medwin et al.
Reference Medwin, Nystuen, Jacobus, Ostwald and Snyder1992; Bisighini et al.
Reference Bisighini, Cossali, Tropea and Roisman2010). The jet thickness for splashes with
$u=(2gH)^{1/2}$
. The results are classified into five regimes, including (i) droplet coalescence and formation of a subsurface vortex ring (C&VR, Chapman & Critchlow Reference Chapman and Critchlow1967; Esmailizadeh & Mesler Reference Esmailizadeh and Mesler1986; Cai Reference Cai1989; Sigler & Mesler Reference Sigler and Mesler1989; Pumphrey & Elmore Reference Pumphrey and Elmore1990; Rein Reference Rein1996; Elmore, Chahine & Oguz Reference Elmore, Chahine and Oguz2001; Leng Reference Leng2001; Deng, Anilkumar & Wang Reference Deng, Anilkumar and Wang2007; Liow & Cole Reference Liow and Cole2009), (ii) regular entrainment of bubbles (RE, Pumphrey & Elmore Reference Pumphrey and Elmore1990; Rein Reference Rein1996; Morton, Rudman & Leng Reference Morton, Rudman and Leng2000; Elmore et al.
Reference Elmore, Chahine and Oguz2001; Leng Reference Leng2001; Deng et al.
Reference Deng, Anilkumar and Wang2007; Liow & Cole Reference Liow, Cole, Jacobs, McIntyre, Cleary, Buttsworth, Mee, Clements, Morgan and Lemckert2007), (iii) swell and thin jet (S&TJ, Hallet & Christensen Reference Hallet and Christensen1984; Rein Reference Rein1996; Elmore et al.
Reference Elmore, Chahine and Oguz2001; Leng Reference Leng2001; Deng et al.
Reference Deng, Anilkumar and Wang2007), (iv) crown and thick jet (C&TJ, Worthington Reference Worthington1882; Worthington & Cole Reference Worthington and Cole1896; Worthington Reference Worthington1908; Franz Reference Franz1959; van de Sande, Smith & van Oord Reference van de Sande, Smith and van Oord1974; Macklin & Metaxas Reference Macklin and Metaxas1976; Hallet & Christensen Reference Hallet and Christensen1984; Hsiao, Lichter & Quintero Reference Hsiao, Lichter and Quintero1988; Khaleeq-ur-Rahman & Saunders Reference Khaleeq-ur-Rahman and Saunders1988; Cai Reference Cai1989; Pumphrey & Elmore Reference Pumphrey and Elmore1990; Rein Reference Rein1993, Reference Rein1996; Morton et al.
Reference Morton, Rudman and Leng2000; Leng Reference Leng2001; Fedorchenko & Wang Reference Fedorchenko and Wang2004; Tomita, Saito & Ganbara Reference Tomita, Saito and Ganbara2007; Bisighini et al.
Reference Bisighini, Cossali, Tropea and Roisman2010) and (v) bubble canopy (BC, Worthington Reference Worthington1882; Worthington & Cole Reference Worthington and Cole1896; Worthington Reference Worthington1908; Franz Reference Franz1959; Engel Reference Engel1966; van de Sande et al.
Reference van de Sande, Smith and van Oord1974; Hallet & Christensen Reference Hallet and Christensen1984; Snyder Reference Snyder1990; Medwin et al.
Reference Medwin, Nystuen, Jacobus, Ostwald and Snyder1992; Bisighini et al.
Reference Bisighini, Cossali, Tropea and Roisman2010). The jet thickness for splashes with
 $\mathit{We}_{d}<100$
is not well defined. The figure also contains axes pointing in directions of increasing droplet speed and diameter, along with characteristic bounding dimensions. Figure 1 shows that, as droplet size and speed increase with increasing
$\mathit{We}_{d}<100$
is not well defined. The figure also contains axes pointing in directions of increasing droplet speed and diameter, along with characteristic bounding dimensions. Figure 1 shows that, as droplet size and speed increase with increasing
 $\mathit{Fr}_{d}$
and
$\mathit{Fr}_{d}$
and
 $\mathit{We}_{d}$
, the resulting flow transitions across a number of regimes. For the C&VR domain, slowly falling droplets with negligible momentum coalesce with the bulk fluid. The high surface tension contributes to generation of a downward moving vortex ring as the droplet penetrates (Chapman & Critchlow Reference Chapman and Critchlow1967; Cai Reference Cai1989; Leng Reference Leng2001). With increasing
$\mathit{We}_{d}$
, the resulting flow transitions across a number of regimes. For the C&VR domain, slowly falling droplets with negligible momentum coalesce with the bulk fluid. The high surface tension contributes to generation of a downward moving vortex ring as the droplet penetrates (Chapman & Critchlow Reference Chapman and Critchlow1967; Cai Reference Cai1989; Leng Reference Leng2001). With increasing
 $\mathit{Fr}_{d}$
and
$\mathit{Fr}_{d}$
and
 $\mathit{We}_{d}$
into the S&TJ regime, impact involves formation of a cavity in the receiving fluid and an outward moving surface wave swell (or rim), which is sometimes followed by a rebound of the cavity to form a high-speed upward jet that breaks into small droplets (Rein Reference Rein1996). The RE domain is a subrange of the S&TJ regime. Here, a capillary wave moving down the crater surface meets to pinch off an air bubble in a reproducible fashion, and this regime is consequently known as regular entrainment (Oguz & Propseretti Reference Oguz and Propseretti1990; Pumphrey & Elmore Reference Pumphrey and Elmore1990). As the impact becomes more energetic, in the C&TJ regime, the cavity grows deeper and the wave swell develops a crown rim from which small jets or ligaments shed secondary splash droplets. Moreover, a thick jet forms from the rebound of the cavity (Rein Reference Rein1996; Leng Reference Leng2001). Even prior to crown formation and associated aerosols, the initial droplet impact generates a cloud of small droplets. Processes involved with the initial impact, and formation and breakup of the ejecta sheet have been investigated both numerically and experimentally (Thoroddsen Reference Thoroddsen2002; Deegan, Brunet & Eggers Reference Deegan, Brunet and Eggers2008; Thoroddsen et al.
Reference Thoroddsen, Thoraval, Takehara and Etoh2011; Zhang et al.
Reference Zhang, Toole, Fezzaa and Deegan2011; Thoraval et al.
Reference Thoraval, Takehara, Etoh, Popinet, Ray, Josserand and Thoroddsen2012; Agbaglah & Deegan Reference Agbaglah and Deegan2014; Agbaglah et al.
Reference Agbaglah, Thoraval, Thoroddsen, Zhang, Fezzaa and Deegan2015).
$\mathit{We}_{d}$
into the S&TJ regime, impact involves formation of a cavity in the receiving fluid and an outward moving surface wave swell (or rim), which is sometimes followed by a rebound of the cavity to form a high-speed upward jet that breaks into small droplets (Rein Reference Rein1996). The RE domain is a subrange of the S&TJ regime. Here, a capillary wave moving down the crater surface meets to pinch off an air bubble in a reproducible fashion, and this regime is consequently known as regular entrainment (Oguz & Propseretti Reference Oguz and Propseretti1990; Pumphrey & Elmore Reference Pumphrey and Elmore1990). As the impact becomes more energetic, in the C&TJ regime, the cavity grows deeper and the wave swell develops a crown rim from which small jets or ligaments shed secondary splash droplets. Moreover, a thick jet forms from the rebound of the cavity (Rein Reference Rein1996; Leng Reference Leng2001). Even prior to crown formation and associated aerosols, the initial droplet impact generates a cloud of small droplets. Processes involved with the initial impact, and formation and breakup of the ejecta sheet have been investigated both numerically and experimentally (Thoroddsen Reference Thoroddsen2002; Deegan, Brunet & Eggers Reference Deegan, Brunet and Eggers2008; Thoroddsen et al.
Reference Thoroddsen, Thoraval, Takehara and Etoh2011; Zhang et al.
Reference Zhang, Toole, Fezzaa and Deegan2011; Thoraval et al.
Reference Thoraval, Takehara, Etoh, Popinet, Ray, Josserand and Thoroddsen2012; Agbaglah & Deegan Reference Agbaglah and Deegan2014; Agbaglah et al.
Reference Agbaglah, Thoraval, Thoroddsen, Zhang, Fezzaa and Deegan2015).
The most energetic bubble canopy (BC) regime is particularly relevant to the present study. High-speed impacts are characterized by the creation of a large crater and the vertical ejection of a thin cylindrical film from the edge of this cavity (Worthington Reference Worthington1882; Engel Reference Engel1966). Droplets are shed upwards from the thickened upper rim of this film (the crown), as this rim moves radially outward, upward and subsequently radially inward, until it closes violently. This process creates a bubble canopy and sends jets of water upwards and downwards from the canopy apex. The downward jet may impinge on the bottom cavity surface and entrain air bubbles into the bulk fluid or may join with the rebounding crater to form a toroidal bubble floating on the surface (Franz Reference Franz1959; Engel Reference Engel1966; Hallet & Christensen Reference Hallet and Christensen1984; Bisighini et al.
Reference Bisighini, Cossali, Tropea and Roisman2010). The data compilation in figure 1 suggests that the complex processes associated with high-energy (BC) impacts occur for
 $\mathit{We}_{d}>2000$
. These processes have received much less attention than those corresponding to lower energy, presumably due to the extremely short time scales involved. Briefly, the growth and collapse of the crater was studied experimentally and modelled by Engel (Reference Engel1966, Reference Engel1967), van de Sande et al. (Reference van de Sande, Smith and van Oord1974) and Bisighini et al. (Reference Bisighini, Cossali, Tropea and Roisman2010). Others mention high-energy impacts in passing (Hallet & Christensen Reference Hallet and Christensen1984) or focus on other aspects, such as sound radiation (Franz Reference Franz1959; Snyder Reference Snyder1990) or coronal discharge (Khaleeq-ur-Rahman & Saunders Reference Khaleeq-ur-Rahman and Saunders1988). Raindrops greater than 2.56 mm in diameter falling on a water surface at terminal speed will fall in the BC regime. The
$\mathit{We}_{d}>2000$
. These processes have received much less attention than those corresponding to lower energy, presumably due to the extremely short time scales involved. Briefly, the growth and collapse of the crater was studied experimentally and modelled by Engel (Reference Engel1966, Reference Engel1967), van de Sande et al. (Reference van de Sande, Smith and van Oord1974) and Bisighini et al. (Reference Bisighini, Cossali, Tropea and Roisman2010). Others mention high-energy impacts in passing (Hallet & Christensen Reference Hallet and Christensen1984) or focus on other aspects, such as sound radiation (Franz Reference Franz1959; Snyder Reference Snyder1990) or coronal discharge (Khaleeq-ur-Rahman & Saunders Reference Khaleeq-ur-Rahman and Saunders1988). Raindrops greater than 2.56 mm in diameter falling on a water surface at terminal speed will fall in the BC regime. The
 $\mathit{We}_{d}$
and
$\mathit{We}_{d}$
and
 $\mathit{Fr}_{d}$
numbers for raindrops at terminal speed (Gunn & Kinzer Reference Gunn and Kinzer1949) also are shown in figure 1. Using an assumed drag coefficient of 1, which is only relevant for high Reynolds numbers, and equalizing the weight with the drag force would result in
$\mathit{Fr}_{d}$
numbers for raindrops at terminal speed (Gunn & Kinzer Reference Gunn and Kinzer1949) also are shown in figure 1. Using an assumed drag coefficient of 1, which is only relevant for high Reynolds numbers, and equalizing the weight with the drag force would result in
 $\mathit{Fr}=1100$
, consistent with the measured values. As is evident, very few studies have extended into the terminal speed regime.
$\mathit{Fr}=1100$
, consistent with the measured values. As is evident, very few studies have extended into the terminal speed regime.
The droplets used in the current study mimic large raindrops falling near terminal velocity on thin layers of crude oil on the ocean surface. The purpose of this study is to determine the effects of varying the oil layer thickness and properties on splash processes, with particular regard to those influencing the aerosolization of droplets. Thus, the effects of oil viscosity, surface tension and interfacial tension are examined, as well the effects of droplet size and impact speed. A non-dimensional scaling is developed to account for these parameters. The effects of premixing the oil with chemical dispersants, which substantially reduce the oil–water interfacial tension, are also investigated. These dispersants are commonly sprayed onto or injected into the oil spill in order to accelerate its breakup to microdroplets and subsequent dispersion in the water column (Li et al. Reference Li, Lee, King, Boufadel and Venosa2008; Fingas Reference Fingas2013). The experiments involve applications of high-speed imaging and holography. We show that the oil layer thickness, surface tension and viscosity have substantial impact on the splash structure and droplet statistics. Careful examination of images elucidates the mechanisms involved and the reasons for variations with the layer thickness and oil properties.
2. Methods
The crude oil used during the present experiments is a Louisiana light sweet crude oil with chemical and physical properties similar to those of the crude oil released during the Deepwater Horizon accident. A variety of commercially available fluids not miscible with water, including gasoline, silicone oil, fish (cod liver) oil, castor oil, motor oil and two gear oils, are also used. The dispersant is Corexit 9500A (Nalco) and in experiments examining the effect of decreased interfacial tension it is mixed with the crude oil at a dispersant to oil volumetric ratio (DOR) of 1:25. To mimic rainfall in the ocean, the droplets consist of filtered tap water, and the bulk fluid is artificial seawater (Instant Ocean) with a salinity of 33 ppt. The measured densities, viscosities, interfacial tensions and surface tensions of the fluids involved in this study are given in table 1. Details concerning fluid provenance and measurement of fluid properties are given in appendix A.
Table 1. The measured physical properties of artificial seawater, different oil types and crude oil–dispersant mixture at a dispersant to oil ratio (DOR) of 1:25.

Figure 2. (a) Set-up for high-speed visualization experiments. (b) A sample image showing the fields of view of holographic observations relative to the splash crown and liquid surface (
 $t=3~\text{ms}$
after impact;
$t=3~\text{ms}$
after impact;
 $h=400~{\rm\mu}\text{m}$
). The upper field of view (black outline) is used for measuring droplet statistics while the lower field of view (white outline) is used for examination of droplet generation mechanisms at early time points. The scale bar is 4 mm. (c) Top view of the holographic set-up.
$h=400~{\rm\mu}\text{m}$
). The upper field of view (black outline) is used for measuring droplet statistics while the lower field of view (white outline) is used for examination of droplet generation mechanisms at early time points. The scale bar is 4 mm. (c) Top view of the holographic set-up.
Figure 2(a) is a schematic of the experimental set-up for the high-speed visualizations. The droplet size and speed and oil layer composition and thickness are varied in three experimental series, detailed in table 2. In the first series (crude oil only), the droplet size and impact speed are kept constant while the oil layer thickness is varied. The interfacial tension is also varied by the addition of dispersant. In the second series, the oil layer composition and thickness are varied. In the third series, the oil layer composition and thickness and droplet speed are varied. In all cases, filtered tap water ‘raindrops’ are produced by a computer-controlled syringe pump (NE-500, New Era Pump Systems Inc.) connected via flexible tubing to a stainless steel blunt-tip dispensing needle, which is mounted at heights of up to 401.3 cm above the tank base to achieve various raindrop impact speeds. The acrylic tank has interior dimensions of
 $15.2\times 15.2\times 15.2~\text{cm}^{3}$
and is filled with artificial seawater to a depth of 8 cm. For the visualizations, the tank is backlit by a 500 W halogen bulb and the light is diffused by translucent bond paper. Images are recorded by a high-speed camera (pco.dimax) equipped with a 200 mm (Nikon Micro Nikkor) lens. For series one visualizations, the CMOS sensor resolution is
$15.2\times 15.2\times 15.2~\text{cm}^{3}$
and is filled with artificial seawater to a depth of 8 cm. For the visualizations, the tank is backlit by a 500 W halogen bulb and the light is diffused by translucent bond paper. Images are recorded by a high-speed camera (pco.dimax) equipped with a 200 mm (Nikon Micro Nikkor) lens. For series one visualizations, the CMOS sensor resolution is
 $2016~\text{pixel}\times 2016~\text{pixel}$
, the field of view is
$2016~\text{pixel}\times 2016~\text{pixel}$
, the field of view is
 $5.7~\text{cm}\times 5.7~\text{cm}$
, the acquisition rate is 1000 Hz and the exposure time is
$5.7~\text{cm}\times 5.7~\text{cm}$
, the acquisition rate is 1000 Hz and the exposure time is
 $100~{\rm\mu}\text{s}$
. The spatial resolution is
$100~{\rm\mu}\text{s}$
. The spatial resolution is
 $28.8~{\rm\mu}\text{m}~\text{pixel}^{-1}$
above the water surface and
$28.8~{\rm\mu}\text{m}~\text{pixel}^{-1}$
above the water surface and
 $28.2~{\rm\mu}\text{m}~\text{pixel}^{-1}$
below the surface. For visualizations with other oils (series two and three), the sensor size is decreased to
$28.2~{\rm\mu}\text{m}~\text{pixel}^{-1}$
below the surface. For visualizations with other oils (series two and three), the sensor size is decreased to
 $1824\times 1888$
and the acquisition rate is increased to 1500 Hz, with an exposure time of
$1824\times 1888$
and the acquisition rate is increased to 1500 Hz, with an exposure time of
 $300~{\rm\mu}\text{s}$
. During experiments, droplets are steadily produced at a rate of 0.5 Hz to achieve reproducibility. An absorbent paper placed above the tank serves as a ‘shutter’, allowing only a single droplet through to impact the oil slick when it is momentarily removed. The droplet horizontal diameter
$300~{\rm\mu}\text{s}$
. During experiments, droplets are steadily produced at a rate of 0.5 Hz to achieve reproducibility. An absorbent paper placed above the tank serves as a ‘shutter’, allowing only a single droplet through to impact the oil slick when it is momentarily removed. The droplet horizontal diameter
 $d_{h}$
and vertical diameter
$d_{h}$
and vertical diameter
 $d_{v}$
are measured, and, based on the calculated volume, an average diameter
$d_{v}$
are measured, and, based on the calculated volume, an average diameter
 $d$
is defined. The droplet impact speed
$d$
is defined. The droplet impact speed
 $u$
is measured from droplet positions in the last two frames before impact. Tools available in the ImageJ software (Schneider, Rasband & Eliceiri Reference Schneider, Rasband and Eliceiri2012) are used for these measurements. A comparison with data available in Gunn & Kinzer (Reference Gunn and Kinzer1949) for the average diameter
$u$
is measured from droplet positions in the last two frames before impact. Tools available in the ImageJ software (Schneider, Rasband & Eliceiri Reference Schneider, Rasband and Eliceiri2012) are used for these measurements. A comparison with data available in Gunn & Kinzer (Reference Gunn and Kinzer1949) for the average diameter
 $d$
for the droplets in series one experiments indicates that the impact speed is approximately 81 % of the terminal velocity of the droplet.
$d$
for the droplets in series one experiments indicates that the impact speed is approximately 81 % of the terminal velocity of the droplet.
Table 2. The parameters of the three experimental series showing fluid layer composition, layer thickness
 $h$
, nominal layer thickness for series one, mean droplet width
$h$
, nominal layer thickness for series one, mean droplet width
 $d_{h}$
and height
$d_{h}$
and height
 $d_{v}$
and mean droplet speed
$d_{v}$
and mean droplet speed
 $u$
.
$u$
.

The oil layers are created by gently dripping a known volume of the immiscible fluid from a syringe several millimetres above the surface of the artificial seawater. The oil is manually distributed across the surface in an effort to create a layer of uniform thickness
 $h$
. A separate top-view image of the layer is recorded immediately before each experiment in order to measure its area using ImageJ. The thickness of each particular layer is determined from this area and the known oil volume. Experiments are conducted for the oil layer thicknesses listed in table 2. The experiments in series one are repeated multiple times to gain statistics on crown and cavity kinematics while those in series two and three are conducted once or twice for classification of splash phenomena for scaling purposes. Details on oil layer production and dimensions are found in appendix B.
$h$
. A separate top-view image of the layer is recorded immediately before each experiment in order to measure its area using ImageJ. The thickness of each particular layer is determined from this area and the known oil volume. Experiments are conducted for the oil layer thicknesses listed in table 2. The experiments in series one are repeated multiple times to gain statistics on crown and cavity kinematics while those in series two and three are conducted once or twice for classification of splash phenomena for scaling purposes. Details on oil layer production and dimensions are found in appendix B.
Using the optical set-up illustrated in figure 2(c), digital inline holography (e.g. Malkiel et al.
Reference Malkiel, Sheng, Katz and Strickler2003; Sheng, Malkiel & Katz Reference Sheng, Malkiel and Katz2006; Katz & Sheng Reference Katz and Sheng2010) is implemented for the same conditions as series one experiments (with crude oil) to observe how the crown formation process and airborne droplet size distributions are affected by the oil layer thickness and application of chemical dispersants. Accordingly, as indicated in figure 2(b), the sample volume encompasses part of the splash crown. The bottom of the
 $8.9~\text{mm}\times 10~\text{mm}$
(width
$8.9~\text{mm}\times 10~\text{mm}$
(width
 $\times$
height) field of view is located 13 mm above the water surface, and the resolution,
$\times$
height) field of view is located 13 mm above the water surface, and the resolution,
 $6.22~{\rm\mu}\text{m}~\text{pixel}^{-1}$
, is higher than that of the high-speed visualizations. Since the rate of crown growth varies with oil layer thickness, as shown later, the frame selected for comparative analysis of size distributions is the first one recorded after the first upward moving airborne droplet exits the top of the field of view. Most of the droplet size distributions correspond to conditions occurring 3–4 ms after impact. These holograms are acquired at 2000 Hz with a sensor size of
$6.22~{\rm\mu}\text{m}~\text{pixel}^{-1}$
, is higher than that of the high-speed visualizations. Since the rate of crown growth varies with oil layer thickness, as shown later, the frame selected for comparative analysis of size distributions is the first one recorded after the first upward moving airborne droplet exits the top of the field of view. Most of the droplet size distributions correspond to conditions occurring 3–4 ms after impact. These holograms are acquired at 2000 Hz with a sensor size of
 $1440~\text{pixel}\times 1612~\text{pixel}$
. In addition, we also record high-speed holograms focusing on the droplet impact/contact area in order to characterize the initial ejecta. These holograms are recorded at multiple frame rates and resolutions. Holograms taken at 3000 Hz with a reduced sensor area of
$1440~\text{pixel}\times 1612~\text{pixel}$
. In addition, we also record high-speed holograms focusing on the droplet impact/contact area in order to characterize the initial ejecta. These holograms are recorded at multiple frame rates and resolutions. Holograms taken at 3000 Hz with a reduced sensor area of
 $960~\text{pixel}\times 1572~\text{pixel}$
, field of view of
$960~\text{pixel}\times 1572~\text{pixel}$
, field of view of
 $5.95~\text{mm}\times 9.75~\text{mm}$
and resolution of
$5.95~\text{mm}\times 9.75~\text{mm}$
and resolution of
 $6.22~{\rm\mu}\text{m}~\text{pixel}^{-1}$
allowed size measurement of fine ejected droplets. Holograms taken at 20 300 Hz with a reduced sensor area of
$6.22~{\rm\mu}\text{m}~\text{pixel}^{-1}$
allowed size measurement of fine ejected droplets. Holograms taken at 20 300 Hz with a reduced sensor area of
 $384~\text{pixel}\times 392~\text{pixel}$
, field of view of
$384~\text{pixel}\times 392~\text{pixel}$
, field of view of
 $8.3~\text{mm}\times 8.4~\text{mm}$
and resolution of
$8.3~\text{mm}\times 8.4~\text{mm}$
and resolution of
 $21.5~{\rm\mu}\text{m}~\text{pixel}^{-1}$
allowed time-resolved characterization of prompt splash processes. Holographic measurements are conducted for the following conditions: a control case without oil (
$21.5~{\rm\mu}\text{m}~\text{pixel}^{-1}$
allowed time-resolved characterization of prompt splash processes. Holographic measurements are conducted for the following conditions: a control case without oil (
 $n=25$
), oil layers of
$n=25$
), oil layers of
 $h=30~{\rm\mu}\text{m}~(n=14)$
and
$h=30~{\rm\mu}\text{m}~(n=14)$
and
 $400~{\rm\mu}\text{m}~(n=13)$
, and an oil and dispersant mixture with DOR of 1:25 and
$400~{\rm\mu}\text{m}~(n=13)$
, and an oil and dispersant mixture with DOR of 1:25 and
 $h=500~{\rm\mu}\text{m}~(n=12)$
. Here,
$h=500~{\rm\mu}\text{m}~(n=12)$
. Here,
 $n$
is the number of replicated experiments, selected to have a minimum of at least 1000 droplets for the statistical analysis. Droplet diameter distributions are normalized to account for the masked fluid ligament areas and the number of measurements to obtain the average size distributions per realization. Details of hologram acquisition and reconstruction are found in appendix C.
$n$
is the number of replicated experiments, selected to have a minimum of at least 1000 droplets for the statistical analysis. Droplet diameter distributions are normalized to account for the masked fluid ligament areas and the number of measurements to obtain the average size distributions per realization. Details of hologram acquisition and reconstruction are found in appendix C.

Figure 3. Sample images from a time series showing the impact of a freshwater drop (
 $d=4.1~\text{mm}$
;
$d=4.1~\text{mm}$
;
 $u=7.2~\text{m}~\text{s}^{-1}$
;
$u=7.2~\text{m}~\text{s}^{-1}$
;
 $\mathit{Fr}_{d}=1288$
;
$\mathit{Fr}_{d}=1288$
;
 $\mathit{We}_{d}=2964$
) on artificial seawater without an oil layer (control case): (a)
$\mathit{We}_{d}=2964$
) on artificial seawater without an oil layer (control case): (a)
 $-2$
ms, (b) 1 ms, (c) 3 ms, (d) 8 ms, (e) 17 ms, (f) 31 ms, (g) 43 ms, (h) 85 ms, (i) 118 ms, (j) 420 ms, (k) 765 ms, (l) 785 ms, inset to (l) 775 ms. Inset to (k): production of film drops from ligaments on the receding bubble cap rim. The arrows in the inset to (l) show fine droplets produced from the impact of the rim onto the surface. White asterisks indicate examples of tracked crown rim positions.
$-2$
ms, (b) 1 ms, (c) 3 ms, (d) 8 ms, (e) 17 ms, (f) 31 ms, (g) 43 ms, (h) 85 ms, (i) 118 ms, (j) 420 ms, (k) 765 ms, (l) 785 ms, inset to (l) 775 ms. Inset to (k): production of film drops from ligaments on the receding bubble cap rim. The arrows in the inset to (l) show fine droplets produced from the impact of the rim onto the surface. White asterisks indicate examples of tracked crown rim positions.
In subsequent sections, splash phenomena resulting from droplet impact on immiscible layers of varying thicknesses are classified and illustrated using visualizations of droplet impact on crude oil layers. A control case without oil is presented first as a baseline, and the effect of dispersant is described last. Splash phenomena from a variety of oils are classified to include the effects of layer thickness and fluid properties, and a dimensionless scaling is presented. For thick layers for which the underlying water plays no role in the splash, the effects of fluid layer viscosity and surface tension on splash phenomena such as canopy closure are investigated. These findings consequently shed light on quantitative measurements of cavity and canopy kinematics for the crude oil layers. In the last section, the early stage of splash behaviour, airborne droplet size and droplet spatial distributions investigated by holography are presented and linked to droplet production processes within the first millisecond of the splash. Finally, implications for both non-oily and oily marine aerosol production resulting from raindrop impact are discussed.
3. Phenomenological observations and scaling trends
3.1. Control case
Figure 3 shows a series of characteristic images of the control case, i.e. the impact of a 4.1 mm drop at a velocity of
 $7.2~\text{m}~\text{s}^{-1}$
(
$7.2~\text{m}~\text{s}^{-1}$
(
 $\mathit{Fr}_{d}=1288$
;
$\mathit{Fr}_{d}=1288$
;
 $\mathit{We}_{d}=2964$
) on artificial seawater without an oil slick. The time point of impact is defined as
$\mathit{We}_{d}=2964$
) on artificial seawater without an oil slick. The time point of impact is defined as
 $t=0$
. The horizontal black line in the middle of each image is the water meniscus at the tank wall. Within 1 ms after impact (figure 3), a flat-bottomed disk-shaped cavity forms within the receiving fluid, and expands into a hemispherical shape. As noted by Engel (Reference Engel1966), the raindrop fluid is distributed along the bottom of this cavity and is stretched into a thin layer as the cavity grows. In addition to an initial spray of fine droplets (discussed in detail later), a layer of fluid is ejected upwards and outwards from the bulk and forms a thin-walled crown. This crown is surmounted by a thickened rim due to the effect of surface tension (Worthington & Cole Reference Worthington and Cole1896). Liquid ligaments emanate from fairly regularly spaced vertical extensions in the rim and eject droplets outwards and upwards. In Worthington & Cole (Reference Worthington and Cole1896) and Engel (Reference Engel1966) it is surmised that a very thin layer of the drop fluid is also distributed along the interior surface of the crown. The orientation of the ligaments transitions from almost horizontal to a steep angle in the first several milliseconds. Accordingly, the direction of droplet motion originating from these ligaments sweeps from outwards to upwards over the first 10 ms after impact. Thickening of the rim and its ligaments over this time period also results in an increase of the size of newly produced droplets. By 3 ms, while continuing to grow vertically, the radially outward progress of the upper rim of the sheet ceases, and it begins to move radially inwards under the influence of surface tension. At the same time, as the bulk fluid surface is forced outward by the widening and deepening cavity, more fluid travels up the widening and thickening sheet (Engel Reference Engel1966; Bisighini et al.
Reference Bisighini, Cossali, Tropea and Roisman2010).
$t=0$
. The horizontal black line in the middle of each image is the water meniscus at the tank wall. Within 1 ms after impact (figure 3), a flat-bottomed disk-shaped cavity forms within the receiving fluid, and expands into a hemispherical shape. As noted by Engel (Reference Engel1966), the raindrop fluid is distributed along the bottom of this cavity and is stretched into a thin layer as the cavity grows. In addition to an initial spray of fine droplets (discussed in detail later), a layer of fluid is ejected upwards and outwards from the bulk and forms a thin-walled crown. This crown is surmounted by a thickened rim due to the effect of surface tension (Worthington & Cole Reference Worthington and Cole1896). Liquid ligaments emanate from fairly regularly spaced vertical extensions in the rim and eject droplets outwards and upwards. In Worthington & Cole (Reference Worthington and Cole1896) and Engel (Reference Engel1966) it is surmised that a very thin layer of the drop fluid is also distributed along the interior surface of the crown. The orientation of the ligaments transitions from almost horizontal to a steep angle in the first several milliseconds. Accordingly, the direction of droplet motion originating from these ligaments sweeps from outwards to upwards over the first 10 ms after impact. Thickening of the rim and its ligaments over this time period also results in an increase of the size of newly produced droplets. By 3 ms, while continuing to grow vertically, the radially outward progress of the upper rim of the sheet ceases, and it begins to move radially inwards under the influence of surface tension. At the same time, as the bulk fluid surface is forced outward by the widening and deepening cavity, more fluid travels up the widening and thickening sheet (Engel Reference Engel1966; Bisighini et al.
Reference Bisighini, Cossali, Tropea and Roisman2010).
Table 3. Characteristics of canopy bubble formation and rupture. Here,
 $n$
represents the number of replicates and NA indicates a case where measurement was not available.
$n$
represents the number of replicates and NA indicates a case where measurement was not available.

By approximately 20 ms after impact (a sample at 17 ms is shown in figure 3), growth of the cavity depth stops, but it continues to expand radially. The upper rim of the sheet, bearing several residual ligaments, closes, creating a bubble canopy surmounted by a column of fluid. This closure produces a downward liquid jet evident at 31 ms, which pierces through the bottom of the cavity at 43 ms. Air entrained by this jet generates a few bubbles, seen at 85 ms, which remain under the cavity. Rebound of the cavity produces a broad upwards jet, evident at 85 ms, which merges with the previously generated central column of fluid, converting the bubble into a toroid. The column of fluid on top of the bubble canopy then flows down over this bubble exterior. Subsequently, the inner column thickens and coalesces with one of the bubble walls, creating a horseshoe-shaped bubble at 118 ms, which transforms into the hemispherical bubble seen at 420 ms. On average, this bubble eventually pops at 633 ms after impact (765 ms for the case in figure 3), and the hole in the film cap rapidly expands, with fluid collecting in the retracting rim (table 3). The rim becomes unstable and forms regularly spaced ligaments which shed airborne droplets (inset to figure 3 k). These ‘film drops’ are a well-studied source of marine aerosol (Resch, Darrozes & Afeti Reference Resch, Darrozes and Afeti1986; Blanchard Reference Blanchard1989; Afeti & Resch Reference Afeti and Resch1990; Resch & Afeti Reference Resch and Afeti1991; Lhuissier & Villermaux Reference Lhuissier and Villermaux2012). Table 3 shows that 35 film drops form on average for the control case; this number compares well with previous measurements of film drop production for similarly sized bubbles (Resch & Afeti Reference Resch and Afeti1991). Retraction of the bubble wall and the impact of these droplets also cause ejection of fine droplets into the air (marked by black arrows in the inset to figure 3 l, at 775 ms) and entrainment of air bubbles into the water at 785 ms. Before concluding, it should be noted that in a minority of cases (16 %), the crown fails to close into a bubble (table 3). Instead, the crown collapses and merges with the fluid jet rebounding from the crater. The stochastic nature of successful bubble canopy formation is also noted in Worthington (Reference Worthington1882).
3.2. The effect of oil layer thickness
Figure 4 shows the following three regimes of splash behaviour for crude oil layers of increasing thickness: immediate rupture and single crown, delayed rupture and double crown, and non-rupture and single crown. These three regimes will be illustrated with visualizations of droplet impact onto crude oil layers.

Figure 4. Conceptual schematic of the cavity and splash crown behaviour for oil layers of various thicknesses at approximately 1–3 ms after drop impact. Dark grey areas, seawater; black lines, oil; light grey areas/lines, raindrop fluid. (a) The oil layer ruptures immediately on impact; a single crown is formed. (b) The oil layer remains initially stretched over the cavity but then undergoes delayed rupture; a double crown is formed. (c) The oil layer does not rupture; a single crown composed of the layer fluid forms.
Immediate rupture and single crown. The first regime (figure 4
a) occurs when the oil layer ruptures immediately upon impact (e.g. within the first millisecond). Rupture of the layer, illustrated in a series of images in figure 5(a–c) for
 $h=100~{\rm\mu}\text{m}$
, causes the oil to retract into thin threads and droplets and allows the freshwater raindrop to mingle with the surrounding seawater. Figure 5(d–i) shows the rupture of crude oil layers of
$h=100~{\rm\mu}\text{m}$
, causes the oil to retract into thin threads and droplets and allows the freshwater raindrop to mingle with the surrounding seawater. Figure 5(d–i) shows the rupture of crude oil layers of
 $h=10$
, 30 and
$h=10$
, 30 and
 $100~{\rm\mu}\text{m}$
at two time points, with the presence of the layer becoming clearer with increasing thickness. For
$100~{\rm\mu}\text{m}$
at two time points, with the presence of the layer becoming clearer with increasing thickness. For
 $h=30~{\rm\mu}\text{m}$
, after 1 ms, several threads of oil emanate from the central portion of a rapidly retracting veil of oil. By 8 ms, most of the oil is concentrated within a string, which splits into droplets, presumably via a capillary instability. This pattern is reminiscent of the ‘bubble chandeliers’ found by Thoroddsen et al. (Reference Thoroddsen, Thoraval, Takehara and Etoh2012) and Tran et al. (Reference Tran, de Maleprade, Sun and Lohse2013), where a thin layer of air is entrained during a low-We impact of a droplet on a water pool. They report that multiple ruptures occur simultaneously in an azimuthal ring due to stretching of the air layer, which creates air strings that extend from a thicker film at the base. In a similar manner, although at a higher We, the present crude oil layer is stretched and broken by the rapidly growing cavity. This pattern disappears for thicker layers, such as for
$h=30~{\rm\mu}\text{m}$
, after 1 ms, several threads of oil emanate from the central portion of a rapidly retracting veil of oil. By 8 ms, most of the oil is concentrated within a string, which splits into droplets, presumably via a capillary instability. This pattern is reminiscent of the ‘bubble chandeliers’ found by Thoroddsen et al. (Reference Thoroddsen, Thoraval, Takehara and Etoh2012) and Tran et al. (Reference Tran, de Maleprade, Sun and Lohse2013), where a thin layer of air is entrained during a low-We impact of a droplet on a water pool. They report that multiple ruptures occur simultaneously in an azimuthal ring due to stretching of the air layer, which creates air strings that extend from a thicker film at the base. In a similar manner, although at a higher We, the present crude oil layer is stretched and broken by the rapidly growing cavity. This pattern disappears for thicker layers, such as for
 $h=100~{\rm\mu}\text{m}$
, where the oil film ruptures on one side and retracts to the other, e.g. from right to left in the sample presented in figure 5(h,i), leaving oil droplets behind. After 8 ms, in all three cases, the oil is already collected into several droplets below the air cavity.
$h=100~{\rm\mu}\text{m}$
, where the oil film ruptures on one side and retracts to the other, e.g. from right to left in the sample presented in figure 5(h,i), leaving oil droplets behind. After 8 ms, in all three cases, the oil is already collected into several droplets below the air cavity.
Shifting to the crown, figure 5(a–c) shows that the oil layer also induces changes to the dynamics of the surface-tension-dominated sheet ejected from the cavity. The darker canopy film (compared with the control case) in (b) is a result of the changing composition of the ejected sheet. As illustrated in figure 4(a), the outside of this sheet is coated with a thin layer of oil drawn up from the surrounding oil film. However, since the oil layer is ruptured, the interior of the crown contains water originating from both the raindrop and the bulk fluid. In addition, the canopy in (b) is closed while that of the control case is still open (quantification follows). The higher inward rim speed with the oily canopy surface causes shorter closure times. After crown closure, the extent of the upward liquid jets above the canopy and the depth of the entrained column of air under the cavity increase with oil layer thickness, as is evident from the images of the
 $100~{\rm\mu}\text{m}$
layers in (c). In the
$100~{\rm\mu}\text{m}$
layers in (c). In the
 $100~{\rm\mu}\text{m}$
case, the entrained air is already partially broken into bubbles. The faster downward jet entrains a greater volume of air into the bulk fluid and forces the oil droplets under the air cavity to a larger depth. As will be shown later, the earlier closure of the crown for the
$100~{\rm\mu}\text{m}$
case, the entrained air is already partially broken into bubbles. The faster downward jet entrains a greater volume of air into the bulk fluid and forces the oil droplets under the air cavity to a larger depth. As will be shown later, the earlier closure of the crown for the
 $100~{\rm\mu}\text{m}$
oil layers also results in a smaller cavity and bubble canopy above the surface.
$100~{\rm\mu}\text{m}$
oil layers also results in a smaller cavity and bubble canopy above the surface.

Figure 5. (a–c) Sample images showing the impact of the water droplet (same as in figure 3) on an oil layer of thickness
 $h=100~{\rm\mu}\text{m}$
. The insets (all at the same magnification) show magnified sections of the images. The white inset scale bar at 1 ms in (a) is 2 mm: (a) 1 ms, (b) 8 ms and (c) 43 ms. (d–i) Magnified images showing the oil layer rupture and breakup for oil layer thicknesses of (d,e)
$h=100~{\rm\mu}\text{m}$
. The insets (all at the same magnification) show magnified sections of the images. The white inset scale bar at 1 ms in (a) is 2 mm: (a) 1 ms, (b) 8 ms and (c) 43 ms. (d–i) Magnified images showing the oil layer rupture and breakup for oil layer thicknesses of (d,e)
 $h=10~{\rm\mu}\text{m}$
, (f,g)
$h=10~{\rm\mu}\text{m}$
, (f,g)
 $h=30~{\rm\mu}\text{m}$
and (h,i)
$h=30~{\rm\mu}\text{m}$
and (h,i)
 $h=100~{\rm\mu}\text{m}$
. Here,
$h=100~{\rm\mu}\text{m}$
. Here,
 $a$
is the air cavity,
$a$
is the air cavity,
 $r$
is the raindrop fluid layer and
$r$
is the raindrop fluid layer and
 $s$
is the seawater. The arrows show the retracting oil film at 1 ms (d,f,h) and the collected oil droplets at 8 ms (e,g,i).
$s$
is the seawater. The arrows show the retracting oil film at 1 ms (d,f,h) and the collected oil droplets at 8 ms (e,g,i).

Figure 6. (a–h) Sample images showing the impact of the water droplet (same as in figure 3) on an oil layer thickness of
 $h=200~{\rm\mu}\text{m}$
: (a) 1 ms, (b) 2 ms, (c) 4 ms, (d) 8 ms, (e) 19 ms, (f) 85 ms, (g) 380 ms, (h) 395 ms. The scale bars in the insets are 2 mm for that time point. The white arrows in (b–d) show the edge of the receding raindrop fluid. The white asterisks indicate examples of tracked lower crown rim positions. Magnified views showing the impact of the water droplet on an oil layer thickness of
$h=200~{\rm\mu}\text{m}$
: (a) 1 ms, (b) 2 ms, (c) 4 ms, (d) 8 ms, (e) 19 ms, (f) 85 ms, (g) 380 ms, (h) 395 ms. The scale bars in the insets are 2 mm for that time point. The white arrows in (b–d) show the edge of the receding raindrop fluid. The white asterisks indicate examples of tracked lower crown rim positions. Magnified views showing the impact of the water droplet on an oil layer thickness of
 $h=200~{\rm\mu}\text{m}$
at (i) 1 ms, (j) 2 ms, (k) 15 ms and (l) 19 ms. Here,
$h=200~{\rm\mu}\text{m}$
at (i) 1 ms, (j) 2 ms, (k) 15 ms and (l) 19 ms. Here,
 $a$
is the air cavity,
$a$
is the air cavity,
 $r$
is the raindrop fluid layer and
$r$
is the raindrop fluid layer and
 $s$
is the seawater. The white arrows show the edge of the retracting raindrop fluid, the black arrows show the intact oil sheet in (i) and (j) and oil droplets in (k) and (l), and the dashed black arrows show the annular rim separating the upper and lower crowns in (i) and (k).
$s$
is the seawater. The white arrows show the edge of the retracting raindrop fluid, the black arrows show the intact oil sheet in (i) and (j) and oil droplets in (k) and (l), and the dashed black arrows show the annular rim separating the upper and lower crowns in (i) and (k).
Delayed rupture and double crown. In the second regime, illustrated in figure 4(b), the floating oil layer no longer ruptures within the first millisecond of droplet impact. Instead, the oil layer becomes thinner but remains intact as the cavity grows. Accordingly, a continuous oil layer should presumably extend from the bottom of the cavity to the top of the crown, and to the undisturbed surrounding surface. This intact oil layer, shown in figure 6(a–c,i,j) for impact on a layer of
 $h=200~{\rm\mu}\text{m}$
, prevents the raindrop from mixing with the bulk fluid as would occur in the previously described immediate rupture cases. Instead, a thin layer of raindrop fluid travels up the crown wall and subsequently retracts down the wall, at speeds of up to
$h=200~{\rm\mu}\text{m}$
, prevents the raindrop from mixing with the bulk fluid as would occur in the previously described immediate rupture cases. Instead, a thin layer of raindrop fluid travels up the crown wall and subsequently retracts down the wall, at speeds of up to
 $0.8~\text{m}~\text{s}^{-1}$
, to the cavity bottom. Retraction of the drop fluid into the cavity bottom is also reported by Fujimatsu et al. (Reference Fujimatsu, Fujita, Hirota and Okada2003) and by Lhuissier et al. (Reference Lhuissier, Sun, Prosperetti and Lohse2013) for water drops impacting silicone oil at lower We than that studied here that do not involve a crown. By this time (
$0.8~\text{m}~\text{s}^{-1}$
, to the cavity bottom. Retraction of the drop fluid into the cavity bottom is also reported by Fujimatsu et al. (Reference Fujimatsu, Fujita, Hirota and Okada2003) and by Lhuissier et al. (Reference Lhuissier, Sun, Prosperetti and Lohse2013) for water drops impacting silicone oil at lower We than that studied here that do not involve a crown. By this time (
 ${\sim}8~\text{ms}$
), due to the cavity growth, the oil layer lining its walls has been stretched to a thickness of approximately
${\sim}8~\text{ms}$
), due to the cavity growth, the oil layer lining its walls has been stretched to a thickness of approximately
 $4~{\rm\mu}\text{m}$
, estimated by assuming that the circular area underlying the droplet is stretched into a hemisphere. Passage of the retracting raindrop fluid over the thinned oil layer appears to cause its breakup into fine threads and droplets and allows the raindrop fluid to mix with the seawater, as the sample images in figure 6(d,e,k,l) demonstrate. For a thicker layer of
$4~{\rm\mu}\text{m}$
, estimated by assuming that the circular area underlying the droplet is stretched into a hemisphere. Passage of the retracting raindrop fluid over the thinned oil layer appears to cause its breakup into fine threads and droplets and allows the raindrop fluid to mix with the seawater, as the sample images in figure 6(d,e,k,l) demonstrate. For a thicker layer of
 $h=400~{\rm\mu}\text{m}$
, as shown in figure 7, passage of the retracting raindrop does not always rupture the layer. Instead, once the retracting droplet reaches the bottom of the cavity, it generates miniature upward and downward liquid jets. The downward jet may puncture the oil layer or may protrude through the oil layer and become encapsulated as a ‘vesicle’, a parcel of water coated with a light-coloured thin film of oil which may remain intact for at least several seconds (shown bursting in figure 7
j–m). Formation of similar structures is observed by Wacheul et al. (Reference Wacheul, Le Bars, Monteux and Aurnou2014) for liquid gallium falling through glycerine solutions.
$h=400~{\rm\mu}\text{m}$
, as shown in figure 7, passage of the retracting raindrop does not always rupture the layer. Instead, once the retracting droplet reaches the bottom of the cavity, it generates miniature upward and downward liquid jets. The downward jet may puncture the oil layer or may protrude through the oil layer and become encapsulated as a ‘vesicle’, a parcel of water coated with a light-coloured thin film of oil which may remain intact for at least several seconds (shown bursting in figure 7
j–m). Formation of similar structures is observed by Wacheul et al. (Reference Wacheul, Le Bars, Monteux and Aurnou2014) for liquid gallium falling through glycerine solutions.

Figure 7. (a–h) Sample images showing the impact of a freshwater drop (same as in figure 3) on crude oil layer with thickness
 $h=400~{\rm\mu}\text{m}$
: (a) 2 ms, (b) 5 ms, (c) 8 ms, (d) 31 ms, (e) 52 ms, (f) 118 ms, (g) 219 ms, (h) 255 ms. The inset to (b) shows a magnified section. The scale bar in the inset is 2 mm. The white arrows show the edge of the retracting raindrop fluid, the black arrows show the vesicle, the dashed black arrows show the annular rim between the upper and lower crowns and the white asterisks indicate examples of lower crown rim positions. (i) Magnified view of double-crown formation at 2 ms. The dashed black arrows show the annular rim between the upper and lower crowns. (j–l) Sample images showing an oil vesicle rising to the surface and rupturing. The view is partially obscured by the oil layer at the tank wall: (j) 656 ms, (k) 761 ms, (l) 767 ms, (m) 773 ms.
$h=400~{\rm\mu}\text{m}$
: (a) 2 ms, (b) 5 ms, (c) 8 ms, (d) 31 ms, (e) 52 ms, (f) 118 ms, (g) 219 ms, (h) 255 ms. The inset to (b) shows a magnified section. The scale bar in the inset is 2 mm. The white arrows show the edge of the retracting raindrop fluid, the black arrows show the vesicle, the dashed black arrows show the annular rim between the upper and lower crowns and the white asterisks indicate examples of lower crown rim positions. (i) Magnified view of double-crown formation at 2 ms. The dashed black arrows show the annular rim between the upper and lower crowns. (j–l) Sample images showing an oil vesicle rising to the surface and rupturing. The view is partially obscured by the oil layer at the tank wall: (j) 656 ms, (k) 761 ms, (l) 767 ms, (m) 773 ms.
Delayed rupture of the oil layer also affects the composition and behaviour of the crown. The floating oil layer is propelled upwards first and thus forms the upper part of a double crown. As the cavity grows, it also then propels the underlying seawater. Accordingly, the lower crown contains seawater, coated with oil, as illustrated in figure 4(b), and its thickened rim represents the upper extent of the seawater. For the
 $h=200~{\rm\mu}\text{m}$
oil layer, the film of the upper crown, which is composed of oil, collapses by 2 ms, leaving behind a skeleton of fragmenting ligaments protruding from the rim of the lower crown (figure 6
j). In comparison to the
$h=200~{\rm\mu}\text{m}$
oil layer, the film of the upper crown, which is composed of oil, collapses by 2 ms, leaving behind a skeleton of fragmenting ligaments protruding from the rim of the lower crown (figure 6
j). In comparison to the
 $200~{\rm\mu}\text{m}$
oil layer, raindrop impact on the
$200~{\rm\mu}\text{m}$
oil layer, raindrop impact on the
 $h=400~{\rm\mu}\text{m}$
oil layer produces a taller and more robust upper crown. For example, by comparing figures 6 and 7, the upper crown still exists at 5 ms for
$h=400~{\rm\mu}\text{m}$
oil layer produces a taller and more robust upper crown. For example, by comparing figures 6 and 7, the upper crown still exists at 5 ms for
 $h=400~{\rm\mu}\text{m}$
, while it has already disappeared at 2 ms for
$h=400~{\rm\mu}\text{m}$
, while it has already disappeared at 2 ms for
 $h=200~{\rm\mu}\text{m}$
. The upper crown for
$h=200~{\rm\mu}\text{m}$
. The upper crown for
 $h=400~{\rm\mu}\text{m}$
also appears to be thicker, presumably since a greater oil volume is propelled upward. As the upper crown film collapses into ligaments by 8 ms, it also contracts inward, presumably under the effect of surface tension. Subsequently, the remaining ligaments stretch upward, while continuing their radially inward motion, and eventually, by 10–20 ms, break into droplets.
$h=400~{\rm\mu}\text{m}$
also appears to be thicker, presumably since a greater oil volume is propelled upward. As the upper crown film collapses into ligaments by 8 ms, it also contracts inward, presumably under the effect of surface tension. Subsequently, the remaining ligaments stretch upward, while continuing their radially inward motion, and eventually, by 10–20 ms, break into droplets.

Figure 8. Sample parts of a time series showing the impact of a freshwater drop (same as in figure 3) on a crude oil layer above artificial seawater with thickness of
 $h=2300~{\rm\mu}\text{m}$
: (a) 2 ms, (b) 8 ms, (c) 23 ms, (d) 113 ms. The white arrow shows the edge of the retracting raindrop fluid.
$h=2300~{\rm\mu}\text{m}$
: (a) 2 ms, (b) 8 ms, (c) 23 ms, (d) 113 ms. The white arrow shows the edge of the retracting raindrop fluid.
The lower crown for the
 $h=400~{\rm\mu}\text{m}$
layer appears slightly later than that for the
$h=400~{\rm\mu}\text{m}$
layer appears slightly later than that for the
 $h=200~{\rm\mu}\text{m}$
layer, presumably since entrainment of the seawater begins later. With increased oil layer thickness, the lower crown is also less likely to close into a bubble canopy, with only 13 % of replicates successfully forming a bubble (table 3). While slow bubble canopy closure occurs for
$h=200~{\rm\mu}\text{m}$
layer, presumably since entrainment of the seawater begins later. With increased oil layer thickness, the lower crown is also less likely to close into a bubble canopy, with only 13 % of replicates successfully forming a bubble (table 3). While slow bubble canopy closure occurs for
 $h=200~{\rm\mu}\text{m}$
(slower than that of the control case or rupturing layers), it rarely occurs for
$h=200~{\rm\mu}\text{m}$
(slower than that of the control case or rupturing layers), it rarely occurs for
 $h=400~{\rm\mu}\text{m}$
, as the image in figure 7(e) shows. Instead, the crown falls on the periphery as the rebounding cavity forms a thick central jet evident at 118 ms. The collapse of this thick jet subsequently creates a high-speed jet (255 ms) with droplet ejection speeds of up to
$h=400~{\rm\mu}\text{m}$
, as the image in figure 7(e) shows. Instead, the crown falls on the periphery as the rebounding cavity forms a thick central jet evident at 118 ms. The collapse of this thick jet subsequently creates a high-speed jet (255 ms) with droplet ejection speeds of up to
 $9.9~\text{m}~\text{s}^{-1}$
. When oily canopy bubbles do form, they have shorter lifetimes, presumably due to lower surface tension, with a mean time from impact to bubble bursting of 215 ms for
$9.9~\text{m}~\text{s}^{-1}$
. When oily canopy bubbles do form, they have shorter lifetimes, presumably due to lower surface tension, with a mean time from impact to bubble bursting of 215 ms for
 $h=200~{\rm\mu}\text{m}$
(table 3). Kientzler et al. (Reference Kientzler, Arons, Blanchard and Woodcock1954) also found shortened bubble lifetime with the addition of a surface-tension-lowering agent. In contrast to the control case, bursting of this large bubble does not produce ligaments and produces very few film drops (395 ms). Table 3 shows that no more than two film drops are produced on average for any of the cases with oil. The onset of the instability, which would corrugate the receding rim and produce ligaments and droplets, is probably delayed by the higher viscosity of the oil (Lhuissier & Villermaux Reference Lhuissier and Villermaux2012), which, based on colour, covers the entire canopy. Table 3 also shows that the receding rim for the oil layer cases moves more slowly than that of the control case. The rim for the control case travels at a mean speed of
$h=200~{\rm\mu}\text{m}$
(table 3). Kientzler et al. (Reference Kientzler, Arons, Blanchard and Woodcock1954) also found shortened bubble lifetime with the addition of a surface-tension-lowering agent. In contrast to the control case, bursting of this large bubble does not produce ligaments and produces very few film drops (395 ms). Table 3 shows that no more than two film drops are produced on average for any of the cases with oil. The onset of the instability, which would corrugate the receding rim and produce ligaments and droplets, is probably delayed by the higher viscosity of the oil (Lhuissier & Villermaux Reference Lhuissier and Villermaux2012), which, based on colour, covers the entire canopy. Table 3 also shows that the receding rim for the oil layer cases moves more slowly than that of the control case. The rim for the control case travels at a mean speed of
 $1.8~\text{m}~\text{s}^{-1}$
while the oily rims travel at mean speeds of
$1.8~\text{m}~\text{s}^{-1}$
while the oily rims travel at mean speeds of
 $0.9{-}1.2~\text{m}~\text{s}^{-1}$
due to the decreased surface tension of the oil.
$0.9{-}1.2~\text{m}~\text{s}^{-1}$
due to the decreased surface tension of the oil.
Non-rupture and single crown. In the third regime, illustrated in figure 4(c), the floating oil layer is thick enough so that the influence of the underlying water on splash phenomena is greatly diminished. The oil layer thins as the cavity grows but is thick enough to remain intact as the raindrop retracts to the cavity bottom. As seen in figure 8 for an oil layer of
 $h=2300~{\rm\mu}\text{m}$
, because of the increased oil layer thickness, only oil is entrained into the crown, thus producing a single crown similar to the control or rupturing layer cases. Similarly to the rupturing cases, the crown closes more rapidly than the control (at 11 ms – not shown). The resulting oil-comprised bubble is small compared with those previously considered. The rapid closure also creates a jet of oil that moves downward through the splash cavity wall, as seen at 113 ms, and subsequently separates into several large oil droplets (2–6 mm in diameter) which float to the surface and rejoin the oil layer.
$h=2300~{\rm\mu}\text{m}$
, because of the increased oil layer thickness, only oil is entrained into the crown, thus producing a single crown similar to the control or rupturing layer cases. Similarly to the rupturing cases, the crown closes more rapidly than the control (at 11 ms – not shown). The resulting oil-comprised bubble is small compared with those previously considered. The rapid closure also creates a jet of oil that moves downward through the splash cavity wall, as seen at 113 ms, and subsequently separates into several large oil droplets (2–6 mm in diameter) which float to the surface and rejoin the oil layer.

Figure 9. Sample parts of a time series showing the impact of a freshwater drop (same as in figure 3) on artificial seawater with an
 $h=500~{\rm\mu}\text{m}$
thick layer of premixed 1:25 DOR oil–dispersant mixture: (a)
$h=500~{\rm\mu}\text{m}$
thick layer of premixed 1:25 DOR oil–dispersant mixture: (a)
 $-2$
ms, (b) 1 ms, (c) 3 ms, (d) 18 ms, (e) 28 ms, (f) 43 ms, (g) 75 ms, (h) 111 ms, (i) 168 ms, (j) 241 ms, (k) 721 ms, (l) 2538 ms, inset to (j) 274 ms, inset to (k) 977 ms. The white scale bars in the insets are 2 mm. The dashed black arrows show the upper rim of the lower crown and the white arrow shows the hole in the oil–dispersant layer.
$-2$
ms, (b) 1 ms, (c) 3 ms, (d) 18 ms, (e) 28 ms, (f) 43 ms, (g) 75 ms, (h) 111 ms, (i) 168 ms, (j) 241 ms, (k) 721 ms, (l) 2538 ms, inset to (j) 274 ms, inset to (k) 977 ms. The white scale bars in the insets are 2 mm. The dashed black arrows show the upper rim of the lower crown and the white arrow shows the hole in the oil–dispersant layer.
3.3. Oil premixed with dispersant
Figure 9 shows droplet impact on an
 $h=500~{\rm\mu}\text{m}$
layer of oil premixed with dispersant at a DOR of 1:25. As the subsurface cavity expands, the oil–dispersant layer becomes thinner and subsequently ruptures in multiple locations 2–4 ms after impact (inset to (c)). The ruptured oil–dispersant layer contracts into thin strands (e), allowing the freshwater to join with the bulk seawater. Both upper and lower crowns are evident early in the splash (inset to (b)), but, due to low interfacial tension (table 1), the boundary between these layers is not as distinct as those of the cases without dispersant. In contrast to oil layers of similar thicknesses, the front of the retracting raindrop fluid down the interior surface of the crown into the cavity is not as clear, also presumably due to the negligible interfacial tension. The space above the crown at 3–8 ms appears to contain many long ligaments, which stretch upwards as far as 1.5 cm above the crown rim. Their number and elevation are larger than those occurring without dispersant, presumably due to the lower capillary instability of the oil–dispersant mixture. When these ligaments eventually break up due to capillary instability, copious fine droplets appear. Also in contrast to the cases without dispersant, after the upper crown disintegrates, the lower crown collapses inward to form a canopy bubble in all of the replicates (table 3), followed by formation of an upward jet (18 ms) and a downward jet evident at 28 ms. This downward jet plunges through the bottom of the cavity at
$h=500~{\rm\mu}\text{m}$
layer of oil premixed with dispersant at a DOR of 1:25. As the subsurface cavity expands, the oil–dispersant layer becomes thinner and subsequently ruptures in multiple locations 2–4 ms after impact (inset to (c)). The ruptured oil–dispersant layer contracts into thin strands (e), allowing the freshwater to join with the bulk seawater. Both upper and lower crowns are evident early in the splash (inset to (b)), but, due to low interfacial tension (table 1), the boundary between these layers is not as distinct as those of the cases without dispersant. In contrast to oil layers of similar thicknesses, the front of the retracting raindrop fluid down the interior surface of the crown into the cavity is not as clear, also presumably due to the negligible interfacial tension. The space above the crown at 3–8 ms appears to contain many long ligaments, which stretch upwards as far as 1.5 cm above the crown rim. Their number and elevation are larger than those occurring without dispersant, presumably due to the lower capillary instability of the oil–dispersant mixture. When these ligaments eventually break up due to capillary instability, copious fine droplets appear. Also in contrast to the cases without dispersant, after the upper crown disintegrates, the lower crown collapses inward to form a canopy bubble in all of the replicates (table 3), followed by formation of an upward jet (18 ms) and a downward jet evident at 28 ms. This downward jet plunges through the bottom of the cavity at
 ${\sim}43~\text{ms}$
and, due to the reduced interfacial tension with the seawater, breaks up into a plume of fine oil droplets and threads as well as entrained air bubbles (43 ms and onward).
${\sim}43~\text{ms}$
and, due to the reduced interfacial tension with the seawater, breaks up into a plume of fine oil droplets and threads as well as entrained air bubbles (43 ms and onward).
When the bubble canopy bursts (111 ms) at about the same time as the corresponding non-dispersant case (see the data in table 3), the receding rim travels slowly due to the low surface tension, and produces very few airborne film drops. However, the canopy collapse also causes entrainment of oil near the surface, starting from 168 ms. Many of the oil droplets entrained by both processes are smaller than the camera resolution (
 $28.2~{\rm\mu}\text{m}~\text{pixel}^{-1}$
), and appear from 168 ms onwards as clouds. As air bubbles generated by the jet impact rise to the surface, some pull threads of oil in their wakes (inset to (j)). The larger oil droplets also rise, although more slowly, and similarly pull oil threads in their wakes. The resulting oil microthreads and microdroplets appear to be similar to those found by Gopalan & Katz (Reference Gopalan and Katz2010, e.g. the inset to (k)). In the last recorded frame (l), the large droplets have already risen to the surface, but plumes of fine droplets, which have expanded and dispersed, remain. The mixing is caused by subsurface flows resulting from impingement of the downward jet (43 ms), collapse of the canopy walls, and rising bubbles and droplets. It should be noted that unlike the corresponding non-dispersant oil case (figure 7), which involves multiple upward and downward jets, interaction of the rebounding cavity with the bubble canopy (75 and 111 ms) prevents subsequent jet generation, similarly to the control case.
$28.2~{\rm\mu}\text{m}~\text{pixel}^{-1}$
), and appear from 168 ms onwards as clouds. As air bubbles generated by the jet impact rise to the surface, some pull threads of oil in their wakes (inset to (j)). The larger oil droplets also rise, although more slowly, and similarly pull oil threads in their wakes. The resulting oil microthreads and microdroplets appear to be similar to those found by Gopalan & Katz (Reference Gopalan and Katz2010, e.g. the inset to (k)). In the last recorded frame (l), the large droplets have already risen to the surface, but plumes of fine droplets, which have expanded and dispersed, remain. The mixing is caused by subsurface flows resulting from impingement of the downward jet (43 ms), collapse of the canopy walls, and rising bubbles and droplets. It should be noted that unlike the corresponding non-dispersant oil case (figure 7), which involves multiple upward and downward jets, interaction of the rebounding cavity with the bubble canopy (75 and 111 ms) prevents subsequent jet generation, similarly to the control case.

Figure 10. The
 $\mathit{ReFr}_{h}{-}\mathit{We}_{h}$
plane showing classification of splash behaviour for droplet impact onto immiscible oil layers. Crown behaviour is classified by symbols into regimes separated by dashed lines. Oil layer behaviour is classified by colour into regimes separated by dotted lines. Alternate axes indicate directions of increasing oil layer viscosity
$\mathit{ReFr}_{h}{-}\mathit{We}_{h}$
plane showing classification of splash behaviour for droplet impact onto immiscible oil layers. Crown behaviour is classified by symbols into regimes separated by dashed lines. Oil layer behaviour is classified by colour into regimes separated by dotted lines. Alternate axes indicate directions of increasing oil layer viscosity
 ${\it\mu}_{h}$
, layer thickness
${\it\mu}_{h}$
, layer thickness
 $h$
, droplet impact speed
$h$
, droplet impact speed
 $u$
and droplet diameter
$u$
and droplet diameter
 $d$
.
$d$
.
3.4. Scaling trends of oil layer breakup and crown behaviour
Visualizations from all of the experimental series, layer thicknesses and fluid properties, which are listed in table 2, have been examined and categorized based on crown and oil layer behaviours for the purpose of developing scaling trends. The contributing experiments cover broad ranges of droplet sizes (1.75–4.1 mm) and speeds (
 $1.1{-}7.3~\text{m}~\text{s}^{-1}$
), as well as oil layer thicknesses (
$1.1{-}7.3~\text{m}~\text{s}^{-1}$
), as well as oil layer thicknesses (
 $5{-}21\,500~{\rm\mu}\text{m}$
), viscosities (0.6–1286 cSt), surface tensions (
$5{-}21\,500~{\rm\mu}\text{m}$
), viscosities (0.6–1286 cSt), surface tensions (
 $16{-}72~\text{mN}~\text{m}^{-1}$
) and interfacial tensions (0.28–58.3
$16{-}72~\text{mN}~\text{m}^{-1}$
) and interfacial tensions (0.28–58.3
 $\text{mN}~\text{m}^{-1}$
). For scaling purposes, we classify the crown behaviours as (i) a crown that closes into a canopy, (ii) a crown that does not close into a canopy and (iii) no crown formation, e.g. formation of a swell. For the cases with a crown, it is further classified as either a double crown or a single crown. The subsurface oil layer behaviours are categorized into (i) immediate rupture, (ii) delayed rupture and (iii) non-rupture. Immediate rupture refers to cases when the time for rupture is less than 7.5 % of the time required for the cavity to reach maximum depth. This constraint, in practice, limits this regime to ruptures within 1 ms after impact. Delayed rupture refers to cases for which the layer is ruptured at later times. Associated phenomena are discussed in the previous section. We have tested many combinations of dimensionless parameters in attempts to classify these behaviours, keeping in mind the parameters used in figure 1 and the observed influence of viscosity. A scaling that appears to work for all of the data is depicted in figure 10. While figure 1 involves only low-viscosity single-phase fluids, the present classification accounts for both the layer thickness and varying fluid properties. Here, the results are classified in terms of
$\text{mN}~\text{m}^{-1}$
). For scaling purposes, we classify the crown behaviours as (i) a crown that closes into a canopy, (ii) a crown that does not close into a canopy and (iii) no crown formation, e.g. formation of a swell. For the cases with a crown, it is further classified as either a double crown or a single crown. The subsurface oil layer behaviours are categorized into (i) immediate rupture, (ii) delayed rupture and (iii) non-rupture. Immediate rupture refers to cases when the time for rupture is less than 7.5 % of the time required for the cavity to reach maximum depth. This constraint, in practice, limits this regime to ruptures within 1 ms after impact. Delayed rupture refers to cases for which the layer is ruptured at later times. Associated phenomena are discussed in the previous section. We have tested many combinations of dimensionless parameters in attempts to classify these behaviours, keeping in mind the parameters used in figure 1 and the observed influence of viscosity. A scaling that appears to work for all of the data is depicted in figure 10. While figure 1 involves only low-viscosity single-phase fluids, the present classification accounts for both the layer thickness and varying fluid properties. Here, the results are classified in terms of
 $\mathit{We}_{h}$
and a product of Re and
$\mathit{We}_{h}$
and a product of Re and
 $\mathit{Fr}_{h}$
, where
$\mathit{Fr}_{h}$
, where
 $\mathit{We}_{h}={\it\rho}_{h}u^{2}h/{\it\sigma}_{h}$
,
$\mathit{We}_{h}={\it\rho}_{h}u^{2}h/{\it\sigma}_{h}$
,
 $\mathit{Re}={\it\rho}_{d}ud/{\it\mu}_{h}$
and
$\mathit{Re}={\it\rho}_{d}ud/{\it\mu}_{h}$
and
 $\mathit{Fr}_{h}=u^{2}/gh$
. Here, the subscripts
$\mathit{Fr}_{h}=u^{2}/gh$
. Here, the subscripts
 $d$
and
$d$
and
 $h$
refer to droplet and oil layer properties respectively. These parameters account for the existence of two independent length scales,
$h$
refer to droplet and oil layer properties respectively. These parameters account for the existence of two independent length scales,
 $d$
and
$d$
and
 $h$
, and
$h$
, and
 $\mathit{ReFr}_{h}={\it\rho}_{d}u^{3}d/{\it\mu}_{h}gh$
accounts for effects of inertia, viscosity and gravity. For convenience of interpretation, figure 10 also contains additional axes showing the directions of increasing
$\mathit{ReFr}_{h}={\it\rho}_{d}u^{3}d/{\it\mu}_{h}gh$
accounts for effects of inertia, viscosity and gravity. For convenience of interpretation, figure 10 also contains additional axes showing the directions of increasing
 $h$
,
$h$
,
 $u$
,
$u$
,
 $d$
and oil layer viscosity,
$d$
and oil layer viscosity,
 ${\it\mu}_{h}$
. The oil layer behaviour is differentiated by colour while the crown behaviour is distinguished by symbols. Regimes of oil layer behaviour are bounded by dotted lines and crown behaviour by dashed lines. Immediate rupture occurs at high
${\it\mu}_{h}$
. The oil layer behaviour is differentiated by colour while the crown behaviour is distinguished by symbols. Regimes of oil layer behaviour are bounded by dotted lines and crown behaviour by dashed lines. Immediate rupture occurs at high
 $\mathit{ReFr}_{h}$
and low
$\mathit{ReFr}_{h}$
and low
 $\mathit{We}_{h}$
, delayed rupture occurs at intermediate values of both, and non-rupture cases are confined to low
$\mathit{We}_{h}$
, delayed rupture occurs at intermediate values of both, and non-rupture cases are confined to low
 $\mathit{ReFr}_{h}$
and high
$\mathit{ReFr}_{h}$
and high
 $\mathit{We}_{h}$
. The double-crown cases, which fall within the delayed rupture regime, are confined to relatively high
$\mathit{We}_{h}$
. The double-crown cases, which fall within the delayed rupture regime, are confined to relatively high
 $\mathit{ReFr}_{h}$
and
$\mathit{ReFr}_{h}$
and
 $\mathit{We}_{h}$
, within this range. Regarding the crown behaviour, crowns are not formed at low
$\mathit{We}_{h}$
, within this range. Regarding the crown behaviour, crowns are not formed at low
 $\mathit{ReFr}_{h}$
and
$\mathit{ReFr}_{h}$
and
 $\mathit{We}_{h}$
either, due to the high oil layer viscosity or low impact speed. In this regime, the flow above the surface appears as an outward swell, in accordance with the swell and thin jet regime indicated in figure 1. For the most viscous oil layers and lowest impact speeds, even this outward swell becomes very small. Increasing
$\mathit{We}_{h}$
either, due to the high oil layer viscosity or low impact speed. In this regime, the flow above the surface appears as an outward swell, in accordance with the swell and thin jet regime indicated in figure 1. For the most viscous oil layers and lowest impact speeds, even this outward swell becomes very small. Increasing
 $\mathit{ReFr}_{h}$
and
$\mathit{ReFr}_{h}$
and
 $\mathit{We}_{h}$
brings us first to the intermediate range of crown, but no bubble canopy regime. Included are cases of crowns with smooth rims, rims with nubs (very short ligaments) and rims with fully formed ligaments. This regime is generally characterized by the same phenomena as the crown and thick jet domain discussed in the context of figure 1. A further increase in
$\mathit{We}_{h}$
brings us first to the intermediate range of crown, but no bubble canopy regime. Included are cases of crowns with smooth rims, rims with nubs (very short ligaments) and rims with fully formed ligaments. This regime is generally characterized by the same phenomena as the crown and thick jet domain discussed in the context of figure 1. A further increase in
 $\mathit{ReFr}_{h}$
and
$\mathit{ReFr}_{h}$
and
 $\mathit{We}_{h}$
leads to the crown and bubble canopy regime, which represents phenomena that are similar to those of the bubble canopy regime in figure 1. However, within this range, when the rupture is delayed, many of the double-crown cases fail to close into a canopy, presumably since the upper crown is short lived.
$\mathit{We}_{h}$
leads to the crown and bubble canopy regime, which represents phenomena that are similar to those of the bubble canopy regime in figure 1. However, within this range, when the rupture is delayed, many of the double-crown cases fail to close into a canopy, presumably since the upper crown is short lived.
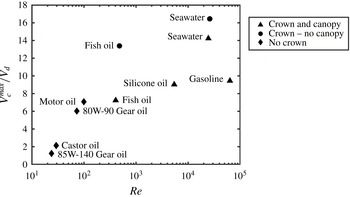
Figure 11. Cavity volume at maximum cavity depth (
 $V_{c}^{max}/V_{d}$
) as a function of Re for droplet impact on thick oil layers (
$V_{c}^{max}/V_{d}$
) as a function of Re for droplet impact on thick oil layers (
 $h=5.7d$
) and for droplet impact on water (both for
$h=5.7d$
) and for droplet impact on water (both for
 $d=3.8~\text{mm}$
,
$d=3.8~\text{mm}$
,
 $u=7.28~\text{m}~\text{s}^{-1}$
). The symbols indicate crown behaviour and correspond to the same symbols as in figure 10.
$u=7.28~\text{m}~\text{s}^{-1}$
). The symbols indicate crown behaviour and correspond to the same symbols as in figure 10.

Figure 12. (a) Sample parts of a time series showing the impact of a freshwater drop (
 $d=3.8~\text{mm}$
,
$d=3.8~\text{mm}$
,
 $u=7.28~\text{m}~\text{s}^{-1}$
) on a thick gasoline layer (
$u=7.28~\text{m}~\text{s}^{-1}$
) on a thick gasoline layer (
 $h=5.7d$
): (a) 1.3, 17.3 ms, (b) 2.7, 21.3 ms. (b) Sample parts of time series showing the impact of the same freshwater drop on a silicone oil layer (
$h=5.7d$
): (a) 1.3, 17.3 ms, (b) 2.7, 21.3 ms. (b) Sample parts of time series showing the impact of the same freshwater drop on a silicone oil layer (
 $h=5.7d$
) above artificial seawater. Here,
$h=5.7d$
) above artificial seawater. Here,
 $Y_{R}^{min}$
at
$Y_{R}^{min}$
at
 $t=21.3~\text{ms}$
indicates the height of the bubble canopy after full expansion of the cavity. In (a,b), the layers float above artificial seawater not visible in the images. (c) Non-dimensionalized crown rim trajectories created for the same drop impact on various oil layers of
$t=21.3~\text{ms}$
indicates the height of the bubble canopy after full expansion of the cavity. In (a,b), the layers float above artificial seawater not visible in the images. (c) Non-dimensionalized crown rim trajectories created for the same drop impact on various oil layers of
 $h=5.7d$
and on artificial seawater. The time delay between points in each trajectory is 0.65 ms and the starting point represents the edge of the falling raindrop on the fluid surface on impact (
$h=5.7d$
and on artificial seawater. The time delay between points in each trajectory is 0.65 ms and the starting point represents the edge of the falling raindrop on the fluid surface on impact (
 $t=0~\text{ms}$
).
$t=0~\text{ms}$
).
Next, to demonstrate the effects of oil properties and to separate them from those of
 $h$
, we consider the transition from the no-crown to crown and canopy regimes for thick layers (
$h$
, we consider the transition from the no-crown to crown and canopy regimes for thick layers (
 $h=5.7d$
). For these cases (series 2), the oil composition is varied while the droplet speed and size are kept constant. The maximum depth and the radius of the cavity at the time of maximum depth are used to calculate the maximum cavity volume
$h=5.7d$
). For these cases (series 2), the oil composition is varied while the droplet speed and size are kept constant. The maximum depth and the radius of the cavity at the time of maximum depth are used to calculate the maximum cavity volume
 $V_{c}^{max}$
assuming an ellipsoidal shape. Values of
$V_{c}^{max}$
assuming an ellipsoidal shape. Values of
 $V_{c}^{max}$
normalized by the droplet volume
$V_{c}^{max}$
normalized by the droplet volume
 $V_{d}$
are plotted as a function of Re in figure 11. With increasing Re,
$V_{d}$
are plotted as a function of Re in figure 11. With increasing Re,
 $V_{c}^{max}/V_{d}$
increases monotonically for the four most viscous fluids, for which there is no crown. Further increase in Re to 400 causes bifurcation in behaviour, where tests performed under the same conditions give different results. When a crown is formed, but fails to close, the cavity volume continues to grow substantially. When the crown closes, the cavity volume appears to plateau. Further increase in Re does not show clear trends in normalized cavity volume, including another case (seawater with no oil layer) where the volume involving canopy closure is smaller than that of a non-closure case. This lack of clear trends can be explained by considering the surface-tension-controlled timing and kinematics of crown formation and closure. As will be shown, they are associated with early closure of the canopy, which retards the cavity growth. Figure 12(a,b) shows sample images of the crown and cavity for thick gasoline (figure 12
a) and silicone oil (12
b) layers. Figure 12(c) shows the manually tracked horizontal and vertical positions of the upper rim of these crowns,
$V_{c}^{max}/V_{d}$
increases monotonically for the four most viscous fluids, for which there is no crown. Further increase in Re to 400 causes bifurcation in behaviour, where tests performed under the same conditions give different results. When a crown is formed, but fails to close, the cavity volume continues to grow substantially. When the crown closes, the cavity volume appears to plateau. Further increase in Re does not show clear trends in normalized cavity volume, including another case (seawater with no oil layer) where the volume involving canopy closure is smaller than that of a non-closure case. This lack of clear trends can be explained by considering the surface-tension-controlled timing and kinematics of crown formation and closure. As will be shown, they are associated with early closure of the canopy, which retards the cavity growth. Figure 12(a,b) shows sample images of the crown and cavity for thick gasoline (figure 12
a) and silicone oil (12
b) layers. Figure 12(c) shows the manually tracked horizontal and vertical positions of the upper rim of these crowns,
 $X_{R}$
and
$X_{R}$
and
 $Y_{R}$
respectively. Length scales and time are non-dimensionalized by
$Y_{R}$
respectively. Length scales and time are non-dimensionalized by
 $d$
and
$d$
and
 $d/u$
respectively. Consecutive points along each trajectory represent 0.65 ms time steps. The crown rim trajectories vary substantially in height, radial extent and time. The gasoline crown rises a shorter distance, does not extend as far outward radially and begins travelling radially inward earlier. This earlier retraction causes earlier closure of the bubble canopy. Figure 13(a,b) shows that the non-dimensionalized closure time,
$d/u$
respectively. Consecutive points along each trajectory represent 0.65 ms time steps. The crown rim trajectories vary substantially in height, radial extent and time. The gasoline crown rises a shorter distance, does not extend as far outward radially and begins travelling radially inward earlier. This earlier retraction causes earlier closure of the bubble canopy. Figure 13(a,b) shows that the non-dimensionalized closure time,
 $t_{c}u/d$
(13
a), and the maximum crown rim height,
$t_{c}u/d$
(13
a), and the maximum crown rim height,
 $Y_{R}^{max}/d$
(13
b), both decrease with increasing
$Y_{R}^{max}/d$
(13
b), both decrease with increasing
 $\mathit{We}_{t}$
, where
$\mathit{We}_{t}$
, where
 $\mathit{We}_{t}={\it\rho}_{h}u^{2}d/{\it\sigma}_{h}$
is the target fluid Weber number. That is, a greater surface tension counterintuitively (presumably) leads to taller crowns and longer closure times. This trend can be explained by considering the growth phase of the crown. A crown with a high-surface-tension fluid, such as the control case shown in figure 3, contains more fluid within the crown walls and rim, allowing it to grow taller and wider while remaining intact. A crown with low-surface-tension fluid, such as the gasoline or silicone oil in figure 12(a,b), cannot ‘hold on’ to that fluid and breaks up into droplets earlier, resulting in thinner shorter crown walls and thinner crown rims. Consequently, the surface tension has to overcome much less inertia in order for the canopy to close. Conversely, crowns composed of high-surface-tension fluids have a higher mass, i.e. have greater upward and outward inertia, which requires a longer time to reverse direction and close.
$\mathit{We}_{t}={\it\rho}_{h}u^{2}d/{\it\sigma}_{h}$
is the target fluid Weber number. That is, a greater surface tension counterintuitively (presumably) leads to taller crowns and longer closure times. This trend can be explained by considering the growth phase of the crown. A crown with a high-surface-tension fluid, such as the control case shown in figure 3, contains more fluid within the crown walls and rim, allowing it to grow taller and wider while remaining intact. A crown with low-surface-tension fluid, such as the gasoline or silicone oil in figure 12(a,b), cannot ‘hold on’ to that fluid and breaks up into droplets earlier, resulting in thinner shorter crown walls and thinner crown rims. Consequently, the surface tension has to overcome much less inertia in order for the canopy to close. Conversely, crowns composed of high-surface-tension fluids have a higher mass, i.e. have greater upward and outward inertia, which requires a longer time to reverse direction and close.

Figure 13. (a) Bubble canopy closure time
 $t_{c}u/d$
as a function of
$t_{c}u/d$
as a function of
 $\mathit{We}_{t}$
. (b) Maximum height of crown
$\mathit{We}_{t}$
. (b) Maximum height of crown
 $Y_{R}^{max}/d$
as a function of
$Y_{R}^{max}/d$
as a function of
 $\mathit{We}_{t}$
. (c) Canopy ceiling fall distance
$\mathit{We}_{t}$
. (c) Canopy ceiling fall distance
 $(Y_{R}^{max}-Y_{R}^{min})/Y_{R}^{max}$
as a function of canopy closure time
$(Y_{R}^{max}-Y_{R}^{min})/Y_{R}^{max}$
as a function of canopy closure time
 $t_{c}u/d$
. The symbols correspond to the fluid types in figure 12.
$t_{c}u/d$
. The symbols correspond to the fluid types in figure 12.
Our observations suggest that closure of the bubble canopy affects the subsurface cavity dimensions. After canopy closure, if the cavity is still in its growth phase, it can only draw in air from within the canopy, by pulling the canopy ceiling downward. Consequently, one should expect that early closure at high
 $\mathit{We}_{t}$
would hinder the cavity growth. For example, in figure 12(a), the gasoline canopy is already pulled down by the cavity to the original fluid level, while for the higher-surface-tension silicone oil in figure 12(b), closure occurs later, and the canopy is not pulled down as much. To quantify this trend,
$\mathit{We}_{t}$
would hinder the cavity growth. For example, in figure 12(a), the gasoline canopy is already pulled down by the cavity to the original fluid level, while for the higher-surface-tension silicone oil in figure 12(b), closure occurs later, and the canopy is not pulled down as much. To quantify this trend,
 $Y_{R}^{min}$
, which is illustrated in figure 12(b), is defined as the minimum height to which the canopy ceiling is pulled downwards before it starts rising again as the cavity starts shrinking. Figure 13(c) shows the value of
$Y_{R}^{min}$
, which is illustrated in figure 12(b), is defined as the minimum height to which the canopy ceiling is pulled downwards before it starts rising again as the cavity starts shrinking. Figure 13(c) shows the value of
 $(Y_{R}^{max}-Y_{R}^{min})/Y_{R}^{max}$
, which represents the vertical displacement of the canopy ceiling while being pulled down (by the growing cavity), as a function of closure time. It shows results for the same cases as in figure 13(a,b). Clearly, with decreasing closure time, the canopy ceiling is pulled further down. Returning back to figure 11, for the viscosity-dominated regime, when there is no canopy closure, the cavity volume increases with Re. Transitioning to conditions where canopy closure does occur, where
$(Y_{R}^{max}-Y_{R}^{min})/Y_{R}^{max}$
, which represents the vertical displacement of the canopy ceiling while being pulled down (by the growing cavity), as a function of closure time. It shows results for the same cases as in figure 13(a,b). Clearly, with decreasing closure time, the canopy ceiling is pulled further down. Returning back to figure 11, for the viscosity-dominated regime, when there is no canopy closure, the cavity volume increases with Re. Transitioning to conditions where canopy closure does occur, where
 $\mathit{We}_{t}$
effects become important, the longer the canopy closure time, the less hindrance there is to cavity growth. Even for the same fluid in this regime, the cavity dimensions are dominated by whether the canopy closes. The cavity dimensions become a function of two competing effects, one dominated only by Re, and the other by
$\mathit{We}_{t}$
effects become important, the longer the canopy closure time, the less hindrance there is to cavity growth. Even for the same fluid in this regime, the cavity dimensions are dominated by whether the canopy closes. The cavity dimensions become a function of two competing effects, one dominated only by Re, and the other by
 $\mathit{We}_{t}$
as well. For the lowest Re, the energy dissipated in the fluid, based on kinematic measurements of cavity expansion (Deng et al.
Reference Deng, Anilkumar and Wang2007), is approximately 40 % of the kinetic energy of the raindrop, whereas for the high-Re regime, a substantial portion of the raindrop energy goes into displacing cavity fluid and creating the surface area of the crown and canopy.
$\mathit{We}_{t}$
as well. For the lowest Re, the energy dissipated in the fluid, based on kinematic measurements of cavity expansion (Deng et al.
Reference Deng, Anilkumar and Wang2007), is approximately 40 % of the kinetic energy of the raindrop, whereas for the high-Re regime, a substantial portion of the raindrop energy goes into displacing cavity fluid and creating the surface area of the crown and canopy.
3.5. Crude oil layer splash kinematics
The galleries and scaling presented in the previous sections demonstrate that the introduction of an oil layer significantly modifies the characteristics of a splash produced by a falling raindrop. Oil layer thickness, viscosity and surface tension affect whether and at what stage the oil layer ruptures and also affect whether a crown is produced and the behaviour of that crown. Timing of crown closure into a canopy can also affect subsurface phenomena such as cavity size. In this section we provide quantitative information on the effect of crude oil slick thickness on the evolution of the cavity volume and crown rim, achieved by manually tracking the lip of the crown, as well as the cavity bottom and side (used to calculate the cavity volume as half an ellipsoid). These features have been measured in eight replicates for the control and
 $h=10$
, 30, 200 and
$h=10$
, 30, 200 and
 $400~{\rm\mu}\text{m}$
cases, six replicates for
$400~{\rm\mu}\text{m}$
cases, six replicates for
 $h=100~{\rm\mu}\text{m}$
and five replicates for the
$h=100~{\rm\mu}\text{m}$
and five replicates for the
 $h=500~{\rm\mu}\text{m}$
layer of oil premixed with dispersant. We provide limited cavity data for
$h=500~{\rm\mu}\text{m}$
layer of oil premixed with dispersant. We provide limited cavity data for
 $h=1100$
and 2300, since the meniscus on the tank walls makes accurate measurements at the intersection of the cavity with the surface difficult. The following figures present averaged results with standard deviations indicated by error bars and with the origin located at the centre of the drop impact on the surface.
$h=1100$
and 2300, since the meniscus on the tank walls makes accurate measurements at the intersection of the cavity with the surface difficult. The following figures present averaged results with standard deviations indicated by error bars and with the origin located at the centre of the drop impact on the surface.

Figure 14. Variation with time of the cavity volume
 $V_{c}/V_{d}$
for several crude oil layer thicknesses. The error bars indicate the standard deviation.
$V_{c}/V_{d}$
for several crude oil layer thicknesses. The error bars indicate the standard deviation.
Figure 14 shows the cavity volume
 $V_{c}/V_{d}$
over the first 60 ms after impact. In all cases, the volume increases sharply until approximately
$V_{c}/V_{d}$
over the first 60 ms after impact. In all cases, the volume increases sharply until approximately
 $tu/d=15$
, at which point different trends begin to emerge. The trends can be divided into three groups. The smallest cavity volumes belong to the
$tu/d=15$
, at which point different trends begin to emerge. The trends can be divided into three groups. The smallest cavity volumes belong to the
 $h=30$
and
$h=30$
and
 $100~{\rm\mu}\text{m}$
ruptured layer cases and the
$100~{\rm\mu}\text{m}$
ruptured layer cases and the
 $h=2300~{\rm\mu}\text{m}$
non-ruptured case. This group begins to diverge from the others at approximately
$h=2300~{\rm\mu}\text{m}$
non-ruptured case. This group begins to diverge from the others at approximately
 $tu/d=20$
, which is just after their canopies have closed. In all three of these cases, a single crown is formed, and, as described previously, this crown rapidly closes into a canopy bubble, thereby preventing further expansion of the cavity. The largest cavity volumes correspond to the control,
$tu/d=20$
, which is just after their canopies have closed. In all three of these cases, a single crown is formed, and, as described previously, this crown rapidly closes into a canopy bubble, thereby preventing further expansion of the cavity. The largest cavity volumes correspond to the control,
 $h=10~{\rm\mu}\text{m}$
,
$h=10~{\rm\mu}\text{m}$
,
 $h=200~{\rm\mu}\text{m}$
and
$h=200~{\rm\mu}\text{m}$
and
 $h=400~{\rm\mu}\text{m}$
cases, which do not appear to greatly differ. As an immediate rupture case, the
$h=400~{\rm\mu}\text{m}$
cases, which do not appear to greatly differ. As an immediate rupture case, the
 $h=10~{\rm\mu}\text{m}$
layer might be expected to exhibit rapid canopy closure, similarly to the
$h=10~{\rm\mu}\text{m}$
layer might be expected to exhibit rapid canopy closure, similarly to the
 $h=30$
and
$h=30$
and
 $100~{\rm\mu}\text{m}$
rupture layer cases. The
$100~{\rm\mu}\text{m}$
rupture layer cases. The
 $h=10~{\rm\mu}\text{m}$
crown, however, was erratic and closed to form a bubble canopy less than half of the time (table 3). This was attributed to incomplete oil coverage over the surface over the crown, which manifested itself as ‘extra’ bumps and ligaments which interfered with crown closure. The volume of the
$h=10~{\rm\mu}\text{m}$
crown, however, was erratic and closed to form a bubble canopy less than half of the time (table 3). This was attributed to incomplete oil coverage over the surface over the crown, which manifested itself as ‘extra’ bumps and ligaments which interfered with crown closure. The volume of the
 $h=10~{\rm\mu}\text{m}$
case was thus quite similar to the control case. The slightly higher cavity volume of the
$h=10~{\rm\mu}\text{m}$
case was thus quite similar to the control case. The slightly higher cavity volume of the
 $h=400~{\rm\mu}\text{m}$
case could be attributed to the fact that the canopy almost never closes, thus allowing unrestrained growth of the cavity. The cavity volumes for
$h=400~{\rm\mu}\text{m}$
case could be attributed to the fact that the canopy almost never closes, thus allowing unrestrained growth of the cavity. The cavity volumes for
 $h=1100~{\rm\mu}\text{m}$
and the
$h=1100~{\rm\mu}\text{m}$
and the
 $h=500~{\rm\mu}\text{m}$
layer of oil mixed with dispersant are intermediate.
$h=500~{\rm\mu}\text{m}$
layer of oil mixed with dispersant are intermediate.

Figure 15. Variation of the mean and standard deviation of the horizontal (
 $X_{R}/d$
) crown rim position with time for crude oil layer experiments for (a) the control and immediately rupturing cases, and (b) the control, delayed rupture and non-rupture cases (lower crown only).
$X_{R}/d$
) crown rim position with time for crude oil layer experiments for (a) the control and immediately rupturing cases, and (b) the control, delayed rupture and non-rupture cases (lower crown only).
The effects of surface tension on crown behaviour previously seen in the raindrop impacts on bulk fluids (i.e. thick fluid layers) are also seen in the crown behaviour for impacts on thin layers of crude oil. Figure 15(a) shows the mean horizontal
 $X_{R}/d$
position of the crown rim (the base of the thickened annular rim defining the upper boundary of a crown) for the control and immediately rupturing layer cases (
$X_{R}/d$
position of the crown rim (the base of the thickened annular rim defining the upper boundary of a crown) for the control and immediately rupturing layer cases (
 $h=10$
, 30 and
$h=10$
, 30 and
 $100~{\rm\mu}\text{m}$
), while figure 15(b) shows the same parameter for the control, delayed rupture and non-rupturing cases (
$100~{\rm\mu}\text{m}$
), while figure 15(b) shows the same parameter for the control, delayed rupture and non-rupturing cases (
 $h=200$
, 400, 1100 and
$h=200$
, 400, 1100 and
 $2300~{\rm\mu}\text{m}$
). The corresponding trajectories are shown in figure 16, where consecutive points along each trajectory represent 1 ms time steps. Over the first two milliseconds, figures 15(a) and 16(a) demonstrate that for the control and immediately rupturing layer cases, the rims rapidly move horizontally outwards and vertically upwards at
$2300~{\rm\mu}\text{m}$
). The corresponding trajectories are shown in figure 16, where consecutive points along each trajectory represent 1 ms time steps. Over the first two milliseconds, figures 15(a) and 16(a) demonstrate that for the control and immediately rupturing layer cases, the rims rapidly move horizontally outwards and vertically upwards at
 ${\sim}50\,\%$
of the raindrop speed. However, as indicated by supporting information provided in table 4, after 2 ms, the rim speeds and vertical positions for cases with oil layers are significantly greater than those of the water only case. The substantially lower surface tension resisting the oil-coated crown growth, at least on the exterior of the crown (figure 4
a), is probably responsible for its more rapid growth. Similarly to the gasoline case examined before, lower surface tension also probably leads to thinner crown walls. This observation is supported by measurements of the rim thickness (table 4). The relatively thin crowns of the
${\sim}50\,\%$
of the raindrop speed. However, as indicated by supporting information provided in table 4, after 2 ms, the rim speeds and vertical positions for cases with oil layers are significantly greater than those of the water only case. The substantially lower surface tension resisting the oil-coated crown growth, at least on the exterior of the crown (figure 4
a), is probably responsible for its more rapid growth. Similarly to the gasoline case examined before, lower surface tension also probably leads to thinner crown walls. This observation is supported by measurements of the rim thickness (table 4). The relatively thin crowns of the
 $h=30$
and
$h=30$
and
 $100~{\rm\mu}\text{m}$
cases begin to close at 2 ms after impact, reaching a maximum inward speed of approximately
$100~{\rm\mu}\text{m}$
cases begin to close at 2 ms after impact, reaching a maximum inward speed of approximately
 $0.76~\text{m}~\text{s}^{-1}$
, while still moving upwards. The thicker seawater (control) crown starts reversing ‘significantly’ later, 4 ms after impact, presumably because its higher surface tension allows it to retain a larger mass; the reversed motion is also much slower, approximately
$0.76~\text{m}~\text{s}^{-1}$
, while still moving upwards. The thicker seawater (control) crown starts reversing ‘significantly’ later, 4 ms after impact, presumably because its higher surface tension allows it to retain a larger mass; the reversed motion is also much slower, approximately
 $0.27~\text{m}~\text{s}^{-1}$
. The crown rim height eventually plateaus and begins to decrease; this occurs slightly before the rims merge together to form the canopy. Again, closure of the crown for the
$0.27~\text{m}~\text{s}^{-1}$
. The crown rim height eventually plateaus and begins to decrease; this occurs slightly before the rims merge together to form the canopy. Again, closure of the crown for the
 $h=30$
and
$h=30$
and
 $100~{\rm\mu}\text{m}$
layers occurs noticeably sooner, at
$100~{\rm\mu}\text{m}$
layers occurs noticeably sooner, at
 $tu/d=\sim 18$
, than that for the control canopy, at
$tu/d=\sim 18$
, than that for the control canopy, at
 $tu/d=\sim 26$
. The rim trajectory for the
$tu/d=\sim 26$
. The rim trajectory for the
 $h=10~{\rm\mu}\text{m}$
layer differs from the others, as discussed before, and rarely closes as a result.
$h=10~{\rm\mu}\text{m}$
layer differs from the others, as discussed before, and rarely closes as a result.

Figure 16. Non-dimensionalized crown rim trajectories created by the control and (a) initially rupturing crude oil layers, (b) delayed and non-rupturing crude oil layers (lower crown only) and (c) crude oil layers with and without dispersant. The time delay between points in each trajectory is 1 ms, and the starting point represents the point where the crown first appears.
Table 4. Kinematic characteristics of the crown and cavity for the control and immediately rupturing oil layers at 2 ms (
 $tu/d=3.5$
) after impact.
$tu/d=3.5$
) after impact.
Moving on to the delayed rupture crude oil layers (figures 15
b and 16
b), for cases with upper and lower crowns, namely
 $h=200$
, 400 and
$h=200$
, 400 and
 $1100~{\rm\mu}\text{m}$
, which are illustrated in figure 4(b), we provide rim trajectory data for the lower crown. The upper crown rapidly disintegrates (within 2 ms for the
$1100~{\rm\mu}\text{m}$
, which are illustrated in figure 4(b), we provide rim trajectory data for the lower crown. The upper crown rapidly disintegrates (within 2 ms for the
 $h=200~{\rm\mu}\text{m}$
layer but slightly later for the more robust upper crowns of the
$h=200~{\rm\mu}\text{m}$
layer but slightly later for the more robust upper crowns of the
 $h=400$
and
$h=400$
and
 $1100~{\rm\mu}\text{m}$
layers), and its rim kinematics are not presented. Disintegration of the upper crown means that the film is not available to form a canopy. Consequently, formation of oil-only upper crowns reduces the likelihood of successful canopy formation, as is evident from the present data (table 3). As expected, the water-containing lower crown rim appears at progressively later times after impact as
$1100~{\rm\mu}\text{m}$
layers), and its rim kinematics are not presented. Disintegration of the upper crown means that the film is not available to form a canopy. Consequently, formation of oil-only upper crowns reduces the likelihood of successful canopy formation, as is evident from the present data (table 3). As expected, the water-containing lower crown rim appears at progressively later times after impact as
 $h$
increases from 200 to
$h$
increases from 200 to
 $1100~{\rm\mu}\text{m}$
. Specifically, it first appears 1, 2 and 4 ms post-impact for the 200, 400 and
$1100~{\rm\mu}\text{m}$
. Specifically, it first appears 1, 2 and 4 ms post-impact for the 200, 400 and
 $1100~{\rm\mu}\text{m}$
layers respectively. Accordingly, the maximum vertical extent decreases and the horizontal extent increases with increasing layer thickness, as is evident from figure 16(b). This rim slowly travels upwards and outwards and then retracts inwards at a very slow pace. Consequently, the likelihood of lower crown closure to form a canopy is low, as table 3 shows. As described previously (figure 8), a single oil-comprised crown forms for the
$1100~{\rm\mu}\text{m}$
layers respectively. Accordingly, the maximum vertical extent decreases and the horizontal extent increases with increasing layer thickness, as is evident from figure 16(b). This rim slowly travels upwards and outwards and then retracts inwards at a very slow pace. Consequently, the likelihood of lower crown closure to form a canopy is low, as table 3 shows. As described previously (figure 8), a single oil-comprised crown forms for the
 $h=2300~{\rm\mu}\text{m}$
non-rupturing layer. This crown rises quickly, even faster than the control case, presumably because of the lower surface tension of the oil, and it closes rapidly into a canopy bubble in over half of the replicates.
$h=2300~{\rm\mu}\text{m}$
non-rupturing layer. This crown rises quickly, even faster than the control case, presumably because of the lower surface tension of the oil, and it closes rapidly into a canopy bubble in over half of the replicates.
For the oil–dispersant mixture (figure 16
c), which has a slightly lower surface tension than that of the oil alone but much lower interfacial tension (table 1), the upper crown initial speed is similar to that of the other oil layer cases, suggesting that the initial upper crown motion is not affected strongly by interfacial tension. However, as noted before, the upper crown is short lived. Figure 16(c) compares the lower crown trajectory for
 $h=500~{\rm\mu}\text{m}$
for the oil–dispersant mixture with those of the control and
$h=500~{\rm\mu}\text{m}$
for the oil–dispersant mixture with those of the control and
 $h=400~{\rm\mu}\text{m}$
. For the first
$h=400~{\rm\mu}\text{m}$
. For the first
 ${\sim}4~\text{ms}$
, the rim for the oil–dispersant mixture follows a similar trajectory to that of the
${\sim}4~\text{ms}$
, the rim for the oil–dispersant mixture follows a similar trajectory to that of the
 $h=400~{\rm\mu}\text{m}$
case, but at a significantly higher speed (2.2 versus
$h=400~{\rm\mu}\text{m}$
case, but at a significantly higher speed (2.2 versus
 $1.9~\text{m}~\text{s}^{-1}$
at 3 ms). Subsequently, they deviate, as the oil–dispersant crown continues to grow rapidly, reaching the maximum height observed for any of the present cases, and then closes to form a canopy bubble. The higher momentum and persistence of the lower crown are consistent with the smaller and shorter-lived upper crown. Presumably, near-elimination of the interfacial tension results in more of the oil–dispersant mixture rising together with the seawater shortly after impact.
$1.9~\text{m}~\text{s}^{-1}$
at 3 ms). Subsequently, they deviate, as the oil–dispersant crown continues to grow rapidly, reaching the maximum height observed for any of the present cases, and then closes to form a canopy bubble. The higher momentum and persistence of the lower crown are consistent with the smaller and shorter-lived upper crown. Presumably, near-elimination of the interfacial tension results in more of the oil–dispersant mixture rising together with the seawater shortly after impact.

Figure 17. Example reconstructed holograms and vertical distribution of airborne droplets for (a) the control case, (b) crude oil with
 $h=30~{\rm\mu}\text{m}$
, (c) crude oil with
$h=30~{\rm\mu}\text{m}$
, (c) crude oil with
 $h=400~{\rm\mu}\text{m}$
and (d) an
$h=400~{\rm\mu}\text{m}$
and (d) an
 $h=500~{\rm\mu}\text{m}$
layer of dispersant–crude oil mixture with
$h=500~{\rm\mu}\text{m}$
layer of dispersant–crude oil mixture with
 $\text{DOR}=1:25$
. The bottom of the field of view is located at
$\text{DOR}=1:25$
. The bottom of the field of view is located at
 $y=13~\text{mm}$
.
$y=13~\text{mm}$
.
4. Airborne droplet statistics
Figure 17 shows sample reconstructed holograms (collapsed in the depth direction so that each droplet is in focus) for four cases, namely the control case, immediate rupture (
 $h=30~{\rm\mu}\text{m}$
) and delayed rupture (
$h=30~{\rm\mu}\text{m}$
) and delayed rupture (
 $h=400~{\rm\mu}\text{m}$
) oil layers, as well as the previously discussed
$h=400~{\rm\mu}\text{m}$
) oil layers, as well as the previously discussed
 $h=500~{\rm\mu}\text{m}$
layer of oil premixed with dispersant. The specific location of these measurements is shown in figure 2, and the timing is discussed in § 2. Overlaid histograms show the vertical distributions of the ensemble averaged number of airborne droplets per realization. Differences in the number of droplets among these cases are apparent, and the total average counts of airborne droplets for these cases are 109, 117, 131 and 162 respectively. The droplet counts gradually increase with the introduction of an oil layer, increasing layer thickness and presence of dispersant. In figure 17(a), the splash crown ligaments have not yet reached the sample area after 3–4 ms, although they appear later, consistent with the lower crown rim speed of this case (figure 16). Conversely, but consistent with the taller rims, both droplets and crown ligaments are already present in all the oil layer holograms, with the ligaments corresponding to the oil–dispersant case (figure 17
d) clearly taller than the rest. The control droplets are also concentrated at a lower elevation than those of the other cases. The height of the peak concentration increases with oil layer thickness and introduction of dispersant. Interestingly, the hologram for
$h=500~{\rm\mu}\text{m}$
layer of oil premixed with dispersant. The specific location of these measurements is shown in figure 2, and the timing is discussed in § 2. Overlaid histograms show the vertical distributions of the ensemble averaged number of airborne droplets per realization. Differences in the number of droplets among these cases are apparent, and the total average counts of airborne droplets for these cases are 109, 117, 131 and 162 respectively. The droplet counts gradually increase with the introduction of an oil layer, increasing layer thickness and presence of dispersant. In figure 17(a), the splash crown ligaments have not yet reached the sample area after 3–4 ms, although they appear later, consistent with the lower crown rim speed of this case (figure 16). Conversely, but consistent with the taller rims, both droplets and crown ligaments are already present in all the oil layer holograms, with the ligaments corresponding to the oil–dispersant case (figure 17
d) clearly taller than the rest. The control droplets are also concentrated at a lower elevation than those of the other cases. The height of the peak concentration increases with oil layer thickness and introduction of dispersant. Interestingly, the hologram for
 $h=400~{\rm\mu}\text{m}$
(figure 17
c) shows several horizontal ligaments, which are remnants of the disintegrating rim of the oil-comprised upper crown. Figure 18 shows the corresponding average (over all replicates) distributions of droplet diameter per realization. In all cases, the distribution is bimodal, thus no attempt is made to fit an analytic expression to it. Bimodal distributions have also been seen in other studies involving breakup of liquid sheets (e.g. Afeti & Resch Reference Afeti and Resch1990; Villermaux & Bossa Reference Villermaux and Bossa2009, Reference Villermaux and Bossa2011). The primary peaks are in the
$h=400~{\rm\mu}\text{m}$
(figure 17
c) shows several horizontal ligaments, which are remnants of the disintegrating rim of the oil-comprised upper crown. Figure 18 shows the corresponding average (over all replicates) distributions of droplet diameter per realization. In all cases, the distribution is bimodal, thus no attempt is made to fit an analytic expression to it. Bimodal distributions have also been seen in other studies involving breakup of liquid sheets (e.g. Afeti & Resch Reference Afeti and Resch1990; Villermaux & Bossa Reference Villermaux and Bossa2009, Reference Villermaux and Bossa2011). The primary peaks are in the
 $25{-}50~{\rm\mu}\text{m}$
range and the secondary broad peak is centred around
$25{-}50~{\rm\mu}\text{m}$
range and the secondary broad peak is centred around
 $225~{\rm\mu}\text{m}$
. The numbers of droplets composing the primary peak for the 30 and
$225~{\rm\mu}\text{m}$
. The numbers of droplets composing the primary peak for the 30 and
 $400~{\rm\mu}\text{m}$
layers are higher by 29 % and 56 % respectively in comparison to the control case. The addition of dispersant causes an additional 32 % increase in the primary peak in comparison to the
$400~{\rm\mu}\text{m}$
layers are higher by 29 % and 56 % respectively in comparison to the control case. The addition of dispersant causes an additional 32 % increase in the primary peak in comparison to the
 $h=400~{\rm\mu}\text{m}$
result.
$h=400~{\rm\mu}\text{m}$
result.

Figure 18. Ensemble averaged size distributions of airborne droplets per realization (12–25 experiments) for (a) the control case, (b) oil with
 $h=30~{\rm\mu}\text{m}$
, (c) oil with
$h=30~{\rm\mu}\text{m}$
, (c) oil with
 $h=400~{\rm\mu}\text{m}$
and (d) an
$h=400~{\rm\mu}\text{m}$
and (d) an
 $h=500~{\rm\mu}\text{m}$
layer of dispersant–oil mixture with
$h=500~{\rm\mu}\text{m}$
layer of dispersant–oil mixture with
 $\text{DOR}=1:25$
. The minimum resolution is
$\text{DOR}=1:25$
. The minimum resolution is
 $12.4~{\rm\mu}\text{m}$
and the bin width is
$12.4~{\rm\mu}\text{m}$
and the bin width is
 $24.9~{\rm\mu}\text{m}$
. Also shown are scatter plots of the corresponding droplet elevation angle
$24.9~{\rm\mu}\text{m}$
. Also shown are scatter plots of the corresponding droplet elevation angle
 ${\it\alpha}$
for 10 realizations for each of the four cases. The bottom of the field of view in which these data are acquired is located at
${\it\alpha}$
for 10 realizations for each of the four cases. The bottom of the field of view in which these data are acquired is located at
 $y=13~\text{mm}$
.
$y=13~\text{mm}$
.

Figure 19. Sample original holograms illustrating the impact of a freshwater droplet (
 $d=3.8~\text{mm}$
,
$d=3.8~\text{mm}$
,
 $u=7.28~\text{m}~\text{s}^{-1}$
) on (a–d) artificial seawater (control case),
$u=7.28~\text{m}~\text{s}^{-1}$
) on (a–d) artificial seawater (control case),
 $49~{\rm\mu}\text{s}$
, (e–h) crude oil layer with
$49~{\rm\mu}\text{s}$
, (e–h) crude oil layer with
 $h=30~{\rm\mu}\text{m}$
,
$h=30~{\rm\mu}\text{m}$
,
 $99~{\rm\mu}\text{s}$
, (i–l) crude oil layer with
$99~{\rm\mu}\text{s}$
, (i–l) crude oil layer with
 $h=400~{\rm\mu}\text{m}$
,
$h=400~{\rm\mu}\text{m}$
,
 $148~{\rm\mu}\text{s}$
, and (m–p) an
$148~{\rm\mu}\text{s}$
, and (m–p) an
 $h=500~{\rm\mu}\text{m}$
layer of premixed dispersant–oil mixture with
$h=500~{\rm\mu}\text{m}$
layer of premixed dispersant–oil mixture with
 $\text{DOR}=1:25$
,
$\text{DOR}=1:25$
,
 $197~{\rm\mu}\text{s}$
, (q–t)
$197~{\rm\mu}\text{s}$
, (q–t)
 $246~{\rm\mu}\text{s}$
.
$246~{\rm\mu}\text{s}$
.
To describe the spatial distribution of droplets, figure 18 also shows scatter plots of the elevation angle of the droplet (
 ${\it\alpha}$
) measured from the undisturbed fluid surface, with the centre of the falling raindrop at impact serving as the vertex. Due to the height of the sample volume, the minimum measurable angle is 9°. For the control case (figure 18
a), the scatter plot shows that the droplets are concentrated at three different angles. The droplets corresponding to the primary size distribution peak, extending up to
${\it\alpha}$
) measured from the undisturbed fluid surface, with the centre of the falling raindrop at impact serving as the vertex. Due to the height of the sample volume, the minimum measurable angle is 9°. For the control case (figure 18
a), the scatter plot shows that the droplets are concentrated at three different angles. The droplets corresponding to the primary size distribution peak, extending up to
 $200~{\rm\mu}\text{m}$
, form a broad-based triangle. In this class, the smallest droplets (
$200~{\rm\mu}\text{m}$
, form a broad-based triangle. In this class, the smallest droplets (
 ${<}50~{\rm\mu}\text{m}$
) appear at all
${<}50~{\rm\mu}\text{m}$
) appear at all
 ${\it\alpha}$
larger than 15°, although they are sparser at
${\it\alpha}$
larger than 15°, although they are sparser at
 ${\it\alpha}>50^{\circ }$
, and larger droplets are concentrated at low angles. The droplets comprising the secondary size distribution peak (
${\it\alpha}>50^{\circ }$
, and larger droplets are concentrated at low angles. The droplets comprising the secondary size distribution peak (
 $175{-}325~{\rm\mu}\text{m}$
) are found at higher elevation angles than those of the primary peak, and there seems to be a distinct gap between the angles corresponding to these classes. Within the ‘lobe’ containing the
$175{-}325~{\rm\mu}\text{m}$
) are found at higher elevation angles than those of the primary peak, and there seems to be a distinct gap between the angles corresponding to these classes. Within the ‘lobe’ containing the
 $175{-}325~{\rm\mu}\text{m}$
droplets, the size increases with decreasing angle. A third less distinct cluster of droplets with a broad size distribution (
$175{-}325~{\rm\mu}\text{m}$
droplets, the size increases with decreasing angle. A third less distinct cluster of droplets with a broad size distribution (
 $175{-}500~{\rm\mu}\text{m}$
) appears to form at high elevation angles of
$175{-}500~{\rm\mu}\text{m}$
) appears to form at high elevation angles of
 ${\it\alpha}=60{-}90^{\circ }$
, with another gap between the second and third clusters. The scatter plots for the oil and oil–dispersant layers show similar patterns, but the cases corresponding to the
${\it\alpha}=60{-}90^{\circ }$
, with another gap between the second and third clusters. The scatter plots for the oil and oil–dispersant layers show similar patterns, but the cases corresponding to the
 $h=400~{\rm\mu}\text{m}$
oil and the
$h=400~{\rm\mu}\text{m}$
oil and the
 $h=500~{\rm\mu}\text{m}$
oil–dispersant layers have higher concentrations of small droplets at high angles. To explain the persistent size–angle dependence, and the angular gaps between clusters, we refer back to the previously described upwards sweep of droplet-generating ligaments within the first several milliseconds after impact (e.g. figures 3 and 7). Consequently, the angle at which the droplets are ejected increases with time. In the following analysis we intend to show that this sweeping process and the increase in the size of ligaments and droplets with time are primary contributors to the scatter plot patterns. Therefore, in figure 18, time can be thought of as increasing diagonally up and to the right, with the primary droplet cluster generated first and the clusters with larger droplets generated subsequently. In this context, the gaps might indicate different generation mechanisms for different size classes, pauses in droplet production and/or sudden shifts in the size of newly produced droplets. Results of high-speed holography conducted near the free surface are used to elucidate the processes involved.
$h=500~{\rm\mu}\text{m}$
oil–dispersant layers have higher concentrations of small droplets at high angles. To explain the persistent size–angle dependence, and the angular gaps between clusters, we refer back to the previously described upwards sweep of droplet-generating ligaments within the first several milliseconds after impact (e.g. figures 3 and 7). Consequently, the angle at which the droplets are ejected increases with time. In the following analysis we intend to show that this sweeping process and the increase in the size of ligaments and droplets with time are primary contributors to the scatter plot patterns. Therefore, in figure 18, time can be thought of as increasing diagonally up and to the right, with the primary droplet cluster generated first and the clusters with larger droplets generated subsequently. In this context, the gaps might indicate different generation mechanisms for different size classes, pauses in droplet production and/or sudden shifts in the size of newly produced droplets. Results of high-speed holography conducted near the free surface are used to elucidate the processes involved.

Figure 20. (a) Sample original holograms illustrating the impact of a freshwater drop (same as figure 3) on the artificial seawater surface (
 $h=0$
): 0 ms, 0.33 ms, 0.67 ms, 1 ms, 1.33 ms. Inset: sample reconstructed hologram at
$h=0$
): 0 ms, 0.33 ms, 0.67 ms, 1 ms, 1.33 ms. Inset: sample reconstructed hologram at
 $t=0$
focusing on microdroplets generated during the initial splash. The arrows at 1 ms indicate droplets in the size range of
$t=0$
focusing on microdroplets generated during the initial splash. The arrows at 1 ms indicate droplets in the size range of
 $188{-}288~{\rm\mu}\text{m}$
already shed or being shed from ligaments. (b) Sample series of holograms illustrating satellite droplet formation from ligament breakup after the impact of a freshwater drop (same as figure 19) on an oil layer with
$188{-}288~{\rm\mu}\text{m}$
already shed or being shed from ligaments. (b) Sample series of holograms illustrating satellite droplet formation from ligament breakup after the impact of a freshwater drop (same as figure 19) on an oil layer with
 $h=400~{\rm\mu}\text{m}$
: 1.13 ms, 1.18 ms, 1.23 ms, 1.28 ms. The white arrows at
$h=400~{\rm\mu}\text{m}$
: 1.13 ms, 1.18 ms, 1.23 ms, 1.28 ms. The white arrows at
 $t=1.28~\text{ms}$
indicate satellite droplets.
$t=1.28~\text{ms}$
indicate satellite droplets.
Figure 19 shows a series of consecutive frames from shortly after droplet impact, the so-called ‘prompt splash’ (Deegan et al.
Reference Deegan, Brunet and Eggers2008), for the four cases. As discussed in Thoroddsen (Reference Thoroddsen2002) and Zhang et al. (Reference Zhang, Toole, Fezzaa and Deegan2011), it involves a radially expanding nearly axisymmetric ejecta sheet that emerges from the contact line. This sheet may appear ruptured initially or disintegrate before or after it impacts with the surface. Thoroddsen et al. (Reference Thoroddsen, Thoraval, Takehara and Etoh2011) classify the ejecta sheet behaviour based on the splash parameter
 $K$
, where
$K$
, where
 $K=\mathit{WeRe}^{1/2}$
, and the Ohnesorge number Oh, where
$K=\mathit{WeRe}^{1/2}$
, and the Ohnesorge number Oh, where
 $\mathit{Oh}={\it\mu}/({\it\rho}{\it\sigma}d)^{1/2}$
. In the control case shown in figure 19(a),
$\mathit{Oh}={\it\mu}/({\it\rho}{\it\sigma}d)^{1/2}$
. In the control case shown in figure 19(a),
 $K=4.7\times 10^{5}$
and
$K=4.7\times 10^{5}$
and
 $\mathit{Oh}=1.9\times 10^{-3}$
, indicating that the ejecta sheet ought to emerge ruptured, as it in fact does. Here, the receiving fluid properties are used for the calculation of
$\mathit{Oh}=1.9\times 10^{-3}$
, indicating that the ejecta sheet ought to emerge ruptured, as it in fact does. Here, the receiving fluid properties are used for the calculation of
 $K$
and Oh since the initial ejecta is thought to largely consist of that fluid. During impact on oil layers, for which
$K$
and Oh since the initial ejecta is thought to largely consist of that fluid. During impact on oil layers, for which
 $K=3.4\times 10^{5}$
and
$K=3.4\times 10^{5}$
and
 $\mathit{Oh}=2.7\times 10^{-2}$
, the sheet ought to emerge intact. Indeed, for
$\mathit{Oh}=2.7\times 10^{-2}$
, the sheet ought to emerge intact. Indeed, for
 $h=30~{\rm\mu}\text{m}$
, figure 19(b) shows a partially intact sheet at
$h=30~{\rm\mu}\text{m}$
, figure 19(b) shows a partially intact sheet at
 $t=49~{\rm\mu}\text{s}$
, with its tip pointing downwards, similar to those described by Thoroddsen et al. (Reference Thoroddsen, Thoraval, Takehara and Etoh2011) and Thoraval et al. (Reference Thoraval, Takehara, Etoh, Popinet, Ray, Josserand and Thoroddsen2012) for this class. However, the tip appears to already be ruptured into a spray of fine droplets. This ejecta sheet grows in time, while being supported by thickened ribs which eventually form ligaments as the thinner region retracts or ruptures, creating in the process a cloud of many droplets. For
$t=49~{\rm\mu}\text{s}$
, with its tip pointing downwards, similar to those described by Thoroddsen et al. (Reference Thoroddsen, Thoraval, Takehara and Etoh2011) and Thoraval et al. (Reference Thoraval, Takehara, Etoh, Popinet, Ray, Josserand and Thoroddsen2012) for this class. However, the tip appears to already be ruptured into a spray of fine droplets. This ejecta sheet grows in time, while being supported by thickened ribs which eventually form ligaments as the thinner region retracts or ruptures, creating in the process a cloud of many droplets. For
 $h=400~{\rm\mu}\text{m}$
, in figure 19(c), the ejecta sheet is shorter lived, and appears to shed small droplets before even hitting the surface. Long thin downward-pointing microligaments appear subsequently. For the
$h=400~{\rm\mu}\text{m}$
, in figure 19(c), the ejecta sheet is shorter lived, and appears to shed small droplets before even hitting the surface. Long thin downward-pointing microligaments appear subsequently. For the
 $h=500~{\rm\mu}\text{m}$
oil–dispersant layer (figure 19
d), where the raindrop falls just outside the field of view,
$h=500~{\rm\mu}\text{m}$
oil–dispersant layer (figure 19
d), where the raindrop falls just outside the field of view,
 $K=3.0\times 10^{5}$
and
$K=3.0\times 10^{5}$
and
 $\mathit{Oh}=3.5\times 10^{-2}$
, resulting in much longer ligaments. Based on these observations, the primary (small droplet) size class appears to be generated by the prompt splash and breakup of microligaments well below 1 ms after impact. These droplets are ejected preferentially at low elevation angles.
$\mathit{Oh}=3.5\times 10^{-2}$
, resulting in much longer ligaments. Based on these observations, the primary (small droplet) size class appears to be generated by the prompt splash and breakup of microligaments well below 1 ms after impact. These droplets are ejected preferentially at low elevation angles.
The transition to generation of larger droplets is elucidated for the control case in figure 20(a), based on holograms recorded at a higher spatial resolution (
 $6.22~{\rm\mu}\text{m}~\text{pixel}^{-1}$
) but a lower frame rate (3000 f.p.s.). The inset for
$6.22~{\rm\mu}\text{m}~\text{pixel}^{-1}$
) but a lower frame rate (3000 f.p.s.). The inset for
 $t=0$
(multiple reconstructed planes compressed in depth) shows a ring of fine spray containing mostly
$t=0$
(multiple reconstructed planes compressed in depth) shows a ring of fine spray containing mostly
 $6{-}19~{\rm\mu}\text{m}$
droplets (1–3 pixels) ejected by the initial prompt splash. We cannot comment whether smaller droplets also exist. Here, we measure droplet speeds up to
$6{-}19~{\rm\mu}\text{m}$
droplets (1–3 pixels) ejected by the initial prompt splash. We cannot comment whether smaller droplets also exist. Here, we measure droplet speeds up to
 $37.5~\text{m}~\text{s}^{-1}$
. The existence of such high speeds, and even much higher ones, is consistent with results presented by Thoroddsen (Reference Thoroddsen2002). By comparing reconstructed fields, the rest of the data associated with figure 20(a) can be used for determining when a certain class of droplets first appears. A comparison with the crown shape can then be used for relating the generation mechanism to the droplet size and angle. Figure 21 shows the corresponding cumulative droplet size distributions in the vicinity of the crown rim, i.e. the location of measurement shifts as the crown swings upwards. Droplets well below the droplet-producing ligaments are excluded to focus on newly generated ones. The trends generally show an increase in droplet size with time. At
$37.5~\text{m}~\text{s}^{-1}$
. The existence of such high speeds, and even much higher ones, is consistent with results presented by Thoroddsen (Reference Thoroddsen2002). By comparing reconstructed fields, the rest of the data associated with figure 20(a) can be used for determining when a certain class of droplets first appears. A comparison with the crown shape can then be used for relating the generation mechanism to the droplet size and angle. Figure 21 shows the corresponding cumulative droplet size distributions in the vicinity of the crown rim, i.e. the location of measurement shifts as the crown swings upwards. Droplets well below the droplet-producing ligaments are excluded to focus on newly generated ones. The trends generally show an increase in droplet size with time. At
 $t=0.33$
and 0.67 ms, 99 % of the counted droplets are smaller than
$t=0.33$
and 0.67 ms, 99 % of the counted droplets are smaller than
 $170~{\rm\mu}\text{m}$
, confirming that the primary size class in figure 18 is generated in less than 0.66 ms after impact. The generation mechanisms include both the prompt splash and the breakup of the initial microligaments seen at
$170~{\rm\mu}\text{m}$
, confirming that the primary size class in figure 18 is generated in less than 0.66 ms after impact. The generation mechanisms include both the prompt splash and the breakup of the initial microligaments seen at
 $t<250~{\rm\mu}\text{s}$
in figure 19 and at
$t<250~{\rm\mu}\text{s}$
in figure 19 and at
 $t<0.67$
in figure 20(a).
$t<0.67$
in figure 20(a).

Figure 21. Time series of cumulative distribution functions of the sizes of airborne droplets in proximity to the crown rim corresponding to the raindrop impact on seawater in figure 20(a).
Figure 21 also shows that droplets larger than
 $200~{\rm\mu}\text{m}$
, which are associated with the secondary size class, are not present until
$200~{\rm\mu}\text{m}$
, which are associated with the secondary size class, are not present until
 $t=1~\text{ms}$
. In figure 20(a), these droplets are highlighted using white arrows. They are located above the crown, whose ligaments already point up at steep angles. These droplets are generated when these relatively large ligaments stretch and break up due to capillary instability, as suggested by their wavy surfaces (Villermaux, Marmottant & Duplat Reference Villermaux, Marmottant and Duplat2004; Eggers & Villermaux Reference Eggers and Villermaux2008), similarly to laminar jets (Donnelly & Glaberson Reference Donnelly and Glaberson1966) and deformed droplets (Stone Reference Stone1994). We do not have a substantiated explanation for the decrease in droplet size with increasing angle for this class evident from figure 18. It might be related to the effect of ligament/droplet inertia as they swing upward. Either the larger ligaments are slower, i.e. remain at a lower elevation, or larger masses of fluid on the ligament tips are shed earlier (at lower
$t=1~\text{ms}$
. In figure 20(a), these droplets are highlighted using white arrows. They are located above the crown, whose ligaments already point up at steep angles. These droplets are generated when these relatively large ligaments stretch and break up due to capillary instability, as suggested by their wavy surfaces (Villermaux, Marmottant & Duplat Reference Villermaux, Marmottant and Duplat2004; Eggers & Villermaux Reference Eggers and Villermaux2008), similarly to laminar jets (Donnelly & Glaberson Reference Donnelly and Glaberson1966) and deformed droplets (Stone Reference Stone1994). We do not have a substantiated explanation for the decrease in droplet size with increasing angle for this class evident from figure 18. It might be related to the effect of ligament/droplet inertia as they swing upward. Either the larger ligaments are slower, i.e. remain at a lower elevation, or larger masses of fluid on the ligament tips are shed earlier (at lower
 ${\it\alpha}$
) than smaller ones since the ratio between inertia and surface tension increases with diameter. Figure 21 also shows that no additional droplets in the secondary size class appear in the next time step (1.33 ms), and that droplets contributing to the third size class (up to
${\it\alpha}$
) than smaller ones since the ratio between inertia and surface tension increases with diameter. Figure 21 also shows that no additional droplets in the secondary size class appear in the next time step (1.33 ms), and that droplets contributing to the third size class (up to
 $400~{\rm\mu}\text{m}$
at high
$400~{\rm\mu}\text{m}$
at high
 ${\it\alpha}$
only appear at
${\it\alpha}$
only appear at
 $t=1.67~\text{ms}$
). This pause suggests that the generation of ever-larger droplets proceeds in a stepwise fashion. After a group of ligaments breaks up, it takes a fraction of a millisecond for new fluid to collect in the tips of these ligaments, as they stretch and shed new droplets. These pauses may therefore cause the gaps between droplet classes seen in figure 18. The intermittent release while the ligaments grow and sweep upwards might be the cause for the size-dependent spatial ordering in droplet elevation angle.
$t=1.67~\text{ms}$
). This pause suggests that the generation of ever-larger droplets proceeds in a stepwise fashion. After a group of ligaments breaks up, it takes a fraction of a millisecond for new fluid to collect in the tips of these ligaments, as they stretch and shed new droplets. These pauses may therefore cause the gaps between droplet classes seen in figure 18. The intermittent release while the ligaments grow and sweep upwards might be the cause for the size-dependent spatial ordering in droplet elevation angle.
The spatial ordering occurring for the control case also persists for the oil and oil–dispersant layers, with one notable addition. For the water-only case, the production of large droplets rarely involves formation of satellite droplets. Conversely, satellite droplets often form for the
 $h=400~{\rm\mu}\text{m}$
and oil–dispersant cases. Figure 20(b) shows a series of reconstructed holograms demonstrating this phenomenon, with the satellite droplets indicated with white arrows. The ligament in the centre ejects a string of large (secondary size class) droplets, some of which are connected by thin threads, which upon breakup create small droplets falling in the primary size class. Satellite droplet formation is thus another mechanism contributing to the primary size class (
$h=400~{\rm\mu}\text{m}$
and oil–dispersant cases. Figure 20(b) shows a series of reconstructed holograms demonstrating this phenomenon, with the satellite droplets indicated with white arrows. The ligament in the centre ejects a string of large (secondary size class) droplets, some of which are connected by thin threads, which upon breakup create small droplets falling in the primary size class. Satellite droplet formation is thus another mechanism contributing to the primary size class (
 $12{-}50~{\rm\mu}\text{m}$
) at high angles, consistent with figure 18(c,d). Disintegration of the upper crown also may contribute to the formation of satellite droplets in the
$12{-}50~{\rm\mu}\text{m}$
) at high angles, consistent with figure 18(c,d). Disintegration of the upper crown also may contribute to the formation of satellite droplets in the
 $h=400~{\rm\mu}\text{m}$
case.
$h=400~{\rm\mu}\text{m}$
case.

Figure 22. Mean and standard deviation of ligament thickness with time. The solid symbols up to 1 ms are for ligament base diameters as measured from holograms. The hollow symbols are for ligament base diameters as measured from the high-speed visualization images. The solid symbols at 3.5 ms are for ligament diameters measured from the holograms at
 $y/d=3.3$
.
$y/d=3.3$
.
The time evolution of ligament diameters has been measured from the holograms at
 $y/d=$
3.3, from the high-speed movies at the base of ligaments and from the holograms focusing on the interface (e.g. figure 20
a). Results are presented in figure 22. At
$y/d=$
3.3, from the high-speed movies at the base of ligaments and from the holograms focusing on the interface (e.g. figure 20
a). Results are presented in figure 22. At
 $t=\sim 0~\text{ms}$
, the early formed microligaments have base diameters as small as
$t=\sim 0~\text{ms}$
, the early formed microligaments have base diameters as small as
 $29~{\rm\mu}\text{m}$
, with a mean value of
$29~{\rm\mu}\text{m}$
, with a mean value of
 $62~{\rm\mu}\text{m}$
. By 1 ms, the diameters grow to
$62~{\rm\mu}\text{m}$
. By 1 ms, the diameters grow to
 $210~{\rm\mu}\text{m}$
. Both are consistent with the droplet size distributions. The varying lengths of ligaments for the four cases can be explained by considering their capillary number,
$210~{\rm\mu}\text{m}$
. Both are consistent with the droplet size distributions. The varying lengths of ligaments for the four cases can be explained by considering their capillary number,
 $\mathit{Ca}={\it\mu}u/{\it\sigma}$
, which is the key parameter affecting capillary instabilities (Stone Reference Stone1994; Guillot et al.
Reference Guillot, Colin, Utada and Ajdari2007; Zhang & Stone Reference Zhang and Stone2007). For water, oil and oil–dispersant ligaments,
$\mathit{Ca}={\it\mu}u/{\it\sigma}$
, which is the key parameter affecting capillary instabilities (Stone Reference Stone1994; Guillot et al.
Reference Guillot, Colin, Utada and Ajdari2007; Zhang & Stone Reference Zhang and Stone2007). For water, oil and oil–dispersant ligaments,
 $\mathit{Ca}=0.1$
, 2.1 and 2.7 respectively. We cannot state the magnitude of Ca for
$\mathit{Ca}=0.1$
, 2.1 and 2.7 respectively. We cannot state the magnitude of Ca for
 $h=30~{\rm\mu}\text{m}$
with certainty, since the ligaments contain both oil and water. The much higher Ca for the oil and oil–dispersant ligaments implies a greater influence of viscosity relative to that of surface tension, resulting in delayed growth of capillary instability, promoting longer and thinner ligaments (figures 17 and 19). These trends are consistent with previously published results for laminar jets (Donnelly & Glaberson Reference Donnelly and Glaberson1966; Kowalewski Reference Kowalewski1996; Javadi et al.
Reference Javadi, Eggers, Bonn, Habibi and Ribe2013) and a Savart sheet (Villermaux, Pistre & Lhuissier Reference Villermaux, Pistre and Lhuissier2013). Conversely, and consistent with the low Ca for the control case, the water ligaments are short, ‘lumpy’ and break into droplets shortly after forming. Accordingly, figure 22 also shows that after 1 ms, the thicknesses for the four cases diverge, with low-Ca ligaments increasing in thickness at a higher rate than the high-Ca ligaments. These differences are expected to affect the size distributions of droplets subsequently produced from these ligaments.
$h=30~{\rm\mu}\text{m}$
with certainty, since the ligaments contain both oil and water. The much higher Ca for the oil and oil–dispersant ligaments implies a greater influence of viscosity relative to that of surface tension, resulting in delayed growth of capillary instability, promoting longer and thinner ligaments (figures 17 and 19). These trends are consistent with previously published results for laminar jets (Donnelly & Glaberson Reference Donnelly and Glaberson1966; Kowalewski Reference Kowalewski1996; Javadi et al.
Reference Javadi, Eggers, Bonn, Habibi and Ribe2013) and a Savart sheet (Villermaux, Pistre & Lhuissier Reference Villermaux, Pistre and Lhuissier2013). Conversely, and consistent with the low Ca for the control case, the water ligaments are short, ‘lumpy’ and break into droplets shortly after forming. Accordingly, figure 22 also shows that after 1 ms, the thicknesses for the four cases diverge, with low-Ca ligaments increasing in thickness at a higher rate than the high-Ca ligaments. These differences are expected to affect the size distributions of droplets subsequently produced from these ligaments.
Finally, we compare the presently observed bimodal distributions with others reported in the literature. In spite of its significance, the size distribution of airborne droplets resulting from raindrop impact on a deep pool has not been reported before, although Blanchard & Woodcock (Reference Blanchard and Woodcock1957) make some semi-quantitative estimates for raindrops falling near terminal velocity. Droplets impacting on a dry surface or on a thin liquid film have produced log-normal (Levin & Hobbs Reference Levin and Hobbs1971; Stow & Stainer Reference Stow and Stainer1977; Guildenbecher et al. Reference Guildenbecher, Engvall, Gao, Grasser, Reu and Chen2014) or exponential distributions (Xu, Barcos & Nagel Reference Xu, Barcos and Nagel2007). Droplet size distributions have also been measured for phenomena that bear some topological similarity to the present conditions, in particular the presence of a sheet with a thickened rim and protruding ligaments (Clanet Reference Clanet2007). Villermaux (Reference Villermaux2007) states that a gamma distribution appears to represent the size of droplets generated by breakup of ligaments, e.g. for raindrop breakup in air (Villermaux & Bossa Reference Villermaux and Bossa2009) or atomization of a liquid jet with coaxial airflow (Villermaux et al. Reference Villermaux, Marmottant and Duplat2004). However, in subsequent studies, this author and colleagues, as well as others, have seen bimodal distributions as well, e.g. for film drops produced by bursting of large bubbles (Afeti & Resch Reference Afeti and Resch1990; Lhuissier & Villermaux Reference Lhuissier and Villermaux2012), collision of oblique jets (Bremond & Villermaux Reference Bremond and Villermaux2006), droplet impact on a post (Villermaux & Bossa Reference Villermaux and Bossa2011) and breakup of a Savart sheet (Villermaux et al. Reference Villermaux, Pistre and Lhuissier2013). This bimodality has been attributed to small droplets produced by collision of neighbouring ligaments (Lhuissier & Villermaux Reference Lhuissier and Villermaux2012), multiple ligament sizes (Villermaux & Bossa Reference Villermaux and Bossa2011) and delayed capillary instability of long threads (Villermaux et al. Reference Villermaux, Pistre and Lhuissier2013). Bimodal distributions are also known to occur from satellite drop formation during breakup of jets (Donnelly & Glaberson Reference Donnelly and Glaberson1966; Vassallo & Ashgriz Reference Vassallo and Ashgriz1991; Kowalewski Reference Kowalewski1996; Wong et al. Reference Wong, Simmons, Decent, Parau and King2004).
5. Summary and conclusions
This study investigates the impact of a droplet falling at high speed on an immiscible fluid layer floating on bulk seawater. This configuration occurs, for example, when raindrops fall on crude oil slicks on the sea surface. Our primary interest is to determine the effect of the oil layer thickness and oil properties on the behaviour of the splash crown, oil layer and subsurface cavity, as well as on the size and spatial distribution of airborne droplets. Our analysis of data obtained using high-speed imaging and digital holography leads to a series of conclusions summarized in this section.
We have started with a compilation of prior studies focusing on splash behaviour resulting from droplets falling on bulk fluids of miscible material. It enables us to classify different previously observed behaviour regimes based on the Weber and Froude numbers. In particular, we find that the threshold level for the bubble canopy regime is
 $\mathit{We}_{d}>2000$
. Our measurements with crude oil layers have focused on the near-terminal speed of 4.1 mm diameter droplets, corresponding to
$\mathit{We}_{d}>2000$
. Our measurements with crude oil layers have focused on the near-terminal speed of 4.1 mm diameter droplets, corresponding to
 $\mathit{We}_{d}=2964$
and
$\mathit{We}_{d}=2964$
and
 $\mathit{Fr}_{d}=1288$
, a regime much less explored than less energetic impacts. With no oil layer present (the control case), the impact forms a subsurface cavity and a crown that closes into a bubble canopy. Visualizations of impacts on crude oil layers of
$\mathit{Fr}_{d}=1288$
, a regime much less explored than less energetic impacts. With no oil layer present (the control case), the impact forms a subsurface cavity and a crown that closes into a bubble canopy. Visualizations of impacts on crude oil layers of
 $10{-}4300~{\rm\mu}\text{m}$
thickness reveal a variety of behaviours in the crown and oil layer. Thin layers (
$10{-}4300~{\rm\mu}\text{m}$
thickness reveal a variety of behaviours in the crown and oil layer. Thin layers (
 $h<200~{\rm\mu}\text{m}$
) rupture within 1 ms after impact, causing the entrained oil to retract into thin threads and droplets. A crown similar to that of the control case, but coated on the outside with oil, forms but closes more quickly than its control case counterpart. For intermediate layers (
$h<200~{\rm\mu}\text{m}$
) rupture within 1 ms after impact, causing the entrained oil to retract into thin threads and droplets. A crown similar to that of the control case, but coated on the outside with oil, forms but closes more quickly than its control case counterpart. For intermediate layers (
 $200<h<1100$
), the oil is stretched initially, and a delayed rupture is caused by retraction of the raindrop fluid across the surface of the cavity. In addition, a double crown is formed, with an upper crown formed of oil and a multiphase lower crown. For thick oil layers (
$200<h<1100$
), the oil is stretched initially, and a delayed rupture is caused by retraction of the raindrop fluid across the surface of the cavity. In addition, a double crown is formed, with an upper crown formed of oil and a multiphase lower crown. For thick oil layers (
 $h>1100~{\rm\mu}\text{m}$
), the underlying water does not greatly influence the splash, the layer does not rupture and the (single) crown is composed of oil. An intermediate-thickness oil layer (
$h>1100~{\rm\mu}\text{m}$
), the underlying water does not greatly influence the splash, the layer does not rupture and the (single) crown is composed of oil. An intermediate-thickness oil layer (
 $h=500~{\rm\mu}\text{m}$
) premixed with dispersant exhibits delayed rupture and a double crown, and creates a subsurface plume of fine oil droplets.
$h=500~{\rm\mu}\text{m}$
) premixed with dispersant exhibits delayed rupture and a double crown, and creates a subsurface plume of fine oil droplets.
We have also conducted experiments with layers of other immiscible fluids and with droplets of different sizes and impact speeds; here, the fluid layer properties (e.g. viscosity and surface tension) and thickness vary widely. Using visualizations for both these oil layers and the crude oil layers, we classify oil layer behaviour into immediate rupture, delayed rupture or non-rupture, and crown behaviour into the formation of a crown and canopy, crown without canopy or no crown formation. Splashes with crowns are further classified into single or double crowns. The results are classified in terms of
 $\mathit{We}_{h}$
and a product of Re and
$\mathit{We}_{h}$
and a product of Re and
 $\mathit{Fr}_{h}$
. These parameters account for two independent length scales,
$\mathit{Fr}_{h}$
. These parameters account for two independent length scales,
 $d$
and
$d$
and
 $h$
, as well as for the effects of inertia, viscosity and gravity. The effects of oil properties on splash processes are separated from those of layer thickness by examining cavity size and crown formation for impacts on thick oil layers (
$h$
, as well as for the effects of inertia, viscosity and gravity. The effects of oil properties on splash processes are separated from those of layer thickness by examining cavity size and crown formation for impacts on thick oil layers (
 $h=21\,500~{\rm\mu}\text{m}$
). At low Re, for which no crown or canopy is formed, the cavity volume at maximum depth is clearly a function of viscosity. At high Re, for which a crown and canopy are formed, the surface-tension-controlled timing and kinematics of crown formation and closure affect the cavity volume. High-
$h=21\,500~{\rm\mu}\text{m}$
). At low Re, for which no crown or canopy is formed, the cavity volume at maximum depth is clearly a function of viscosity. At high Re, for which a crown and canopy are formed, the surface-tension-controlled timing and kinematics of crown formation and closure affect the cavity volume. High-
 $\mathit{We}_{t}$
crowns close into canopies faster, and canopy closure is found to retard cavity growth. Quantitative trends in the cavity growth and crown rim kinematics for crude oil layers of varying thickness are elucidated by these findings. For rupturing layers, the lower surface tension of the oil coating causes more rapid crown growth and canopy closure, leading to smaller subsurface cavities. For delayed rupture layers, disintegration of the upper crown prevents canopy formation, leading to large cavities. For non-rupturing layers, the low-surface-tension oil-comprised crown rises and closes rapidly, creating small cavities.
$\mathit{We}_{t}$
crowns close into canopies faster, and canopy closure is found to retard cavity growth. Quantitative trends in the cavity growth and crown rim kinematics for crude oil layers of varying thickness are elucidated by these findings. For rupturing layers, the lower surface tension of the oil coating causes more rapid crown growth and canopy closure, leading to smaller subsurface cavities. For delayed rupture layers, disintegration of the upper crown prevents canopy formation, leading to large cavities. For non-rupturing layers, the low-surface-tension oil-comprised crown rises and closes rapidly, creating small cavities.
We measured sizes and spatial distributions of airborne droplets ejected from raindrop impact on seawater (control) and on crude oil layers that undergo immediate rupture (
 $h=30~{\rm\mu}\text{m}$
) and delayed rupture (
$h=30~{\rm\mu}\text{m}$
) and delayed rupture (
 $h=400~{\rm\mu}\text{m}$
), as well as on an
$h=400~{\rm\mu}\text{m}$
), as well as on an
 $h=500~{\rm\mu}\text{m}$
layer of oil premixed with dispersant. The droplets for all cases show a bimodal size distribution with a primary peak in the
$h=500~{\rm\mu}\text{m}$
layer of oil premixed with dispersant. The droplets for all cases show a bimodal size distribution with a primary peak in the
 $25{-}50~{\rm\mu}\text{m}$
range and the secondary peak at
$25{-}50~{\rm\mu}\text{m}$
range and the secondary peak at
 $225~{\rm\mu}\text{m}$
; the number of droplets in the primary peak increases with oil layer thickness and the presence of dispersant. Different classes of droplets are clustered at different elevation angles with gaps in between. High-speed holography of the early impact shows that the primary peak droplets are ejected at low angles by the ‘prompt splash’ and by the breakup of microligaments. Impact on seawater produces irregular splashing while impact on oil layers (at higher Oh) produces an ejecta sheet which subsequently ruptures. Larger droplets comprising the secondary peak are produced later, at approximately 1 ms after impact, by capillary instability acting on the larger ligaments extending from the crown rim. Gaps in elevation angle between different droplet classes may be caused by intermittent droplet release while the ligaments grow and sweep upwards. Satellite droplet formation from large ligaments is shown to be responsible for the greater number of small (primary size class) droplets found at high elevation angles for the oil and oil–dispersant layers. Measurements of ligament diameters over time are consistent with the droplet size distributions, and the rapid growth of these ligaments is thought to be the cause of the bimodal distributions found here.
$225~{\rm\mu}\text{m}$
; the number of droplets in the primary peak increases with oil layer thickness and the presence of dispersant. Different classes of droplets are clustered at different elevation angles with gaps in between. High-speed holography of the early impact shows that the primary peak droplets are ejected at low angles by the ‘prompt splash’ and by the breakup of microligaments. Impact on seawater produces irregular splashing while impact on oil layers (at higher Oh) produces an ejecta sheet which subsequently ruptures. Larger droplets comprising the secondary peak are produced later, at approximately 1 ms after impact, by capillary instability acting on the larger ligaments extending from the crown rim. Gaps in elevation angle between different droplet classes may be caused by intermittent droplet release while the ligaments grow and sweep upwards. Satellite droplet formation from large ligaments is shown to be responsible for the greater number of small (primary size class) droplets found at high elevation angles for the oil and oil–dispersant layers. Measurements of ligament diameters over time are consistent with the droplet size distributions, and the rapid growth of these ligaments is thought to be the cause of the bimodal distributions found here.
Both the size distribution and the number of droplets are important parameters in modelling the production of marine aerosol, whether oily or otherwise. Blanchard & Woodcock (Reference Blanchard and Woodcock1957) semi-quantitatively estimate that the impact of a 5 mm raindrop at terminal speed on water would produce approximately 900 droplets greater in size than
 $100~{\rm\mu}\text{m}$
, in addition to several hundred smaller droplets. Accounting for the fact that the present measurements cover a fraction of the flow field, impact of a 4.1 mm droplet on seawater without oil produces approximately 330 droplets of all sizes from the crown breakup by 3–4 ms after impact, in addition to approximately 2000 fine droplets from the initial impact. With a 400 mm oil layer, the number of droplets originating from the crown increases to approximately 390. For the
$100~{\rm\mu}\text{m}$
, in addition to several hundred smaller droplets. Accounting for the fact that the present measurements cover a fraction of the flow field, impact of a 4.1 mm droplet on seawater without oil produces approximately 330 droplets of all sizes from the crown breakup by 3–4 ms after impact, in addition to approximately 2000 fine droplets from the initial impact. With a 400 mm oil layer, the number of droplets originating from the crown increases to approximately 390. For the
 $500~{\rm\mu}\text{m}$
oil–dispersant layer, the estimated number increases to 490. Smaller raindrops (
$500~{\rm\mu}\text{m}$
oil–dispersant layer, the estimated number increases to 490. Smaller raindrops (
 $\mathit{We}<2000$
), which do not fall in the bubble canopy regime and do not form a crown with ligaments, are likely to produce fewer droplets, but fracturing of the previously discussed initial ejecta sheet, particularly for impacts where an oil slick is present, still produces a spray of fine droplets. Since the impact of a single large raindrop produces thousands of fine droplets, raindrop impact is thus a viable mechanism for the transfer of material from the sea surface to the atmosphere.
$\mathit{We}<2000$
), which do not fall in the bubble canopy regime and do not form a crown with ligaments, are likely to produce fewer droplets, but fracturing of the previously discussed initial ejecta sheet, particularly for impacts where an oil slick is present, still produces a spray of fine droplets. Since the impact of a single large raindrop produces thousands of fine droplets, raindrop impact is thus a viable mechanism for the transfer of material from the sea surface to the atmosphere.
Acknowledgements
This project has been funded by the Gulf of Mexico Research Initiative (GoMRI), with the Johns Hopkins group being part of the DROPPS consortium headed by E. Buskey from the University of Texas, Marine Science Institute. The pendant drop code for measuring dynamic surface tension was provided by L. Vaccari and K. Stebe from the University of Pennsylvania. The following students have assisted us in data processing: X. Xue, A. Naticchia, B. Keyser, Y. Ahdab and E. Rodbell.
Appendix A
The crude oil was produced from the Marlin platform located 60 km northeast of the Deepwater Horizon platform and was provided by BP as a surrogate (Pelz et al.
Reference Pelz, Brown, Huddleston, Rand, Gardinali, Stubblefield, BenKinney and Ahnell2011; Aeppli et al.
Reference Aeppli, Nelson, Radović, Carmichael, Valentine and Reddy2014). In order to achieve a range of physical properties, 85W-140 and 80W-90 grade gear oils (Lucas Oil) are also used, as are SAE 30 motor oil (Service Pro), castor oil (Now Solutions), fish (cod liver) oil (Twinlabs) and E200 Silicone Fluid (Esco). The density of the fluids is measured by weighing a known volume, and the viscosity is measured using a Cannon-Fenske opaque viscometer (Cannon Instrument Company). The dynamic surface tensions of the oil and oil–dispersant mixture for a dispersant to oil volumetric ratio (DOR) of 1:25 are measured using the pendant drop method (Rotenberg, Boruvka & Neumann Reference Rotenberg, Boruvka and Neumann1983; Song & Springer Reference Song and Springer1996). The dynamic interfacial tension of the crude oil with seawater is measured in the same way. Results are presented in figure 23. As is evident, the surface tension of the oil with air decreases slightly, from 28 to
 $27~\text{mN}~\text{m}^{-1}$
over time, and the interfacial tension of the crude oil with seawater decreases from 18 to
$27~\text{mN}~\text{m}^{-1}$
over time, and the interfacial tension of the crude oil with seawater decreases from 18 to
 $8~\text{mN}~\text{m}^{-1}$
. These reductions are probably due to migration of surface-active asphaltenes in the crude oil to the air or seawater interface, a well-studied phenomenon (Bauget, Langevin & Lenormand Reference Bauget, Langevin and Lenormand2001; Freer & Radke Reference Freer and Radke2004). The present range of values is consistent with published data (Harvey Reference Harvey1925; Farooq et al.
Reference Farooq, Simon, Tweheyo, Øye and Sjöblom2013). The surface tension of the oil–dispersant mixture starts at the same level as the original oil, but then decreases by 21 % and plateaus at a lower value. Migration of the dispersant to the surface is the likely cause of this trend, a well-known phenomenon (Reichert & Walker Reference Reichert and Walker2013; Riehm & McCormick Reference Riehm and McCormick2014). Due to the large amount of new surface created in a short time during the splash, we have used the initial values of surface and interfacial tensions as listed in table 1 during calculations (Marmottant, Villermaux & Clanet Reference Marmottant, Villermaux and Clanet2000). The surface and interfacial tensions of the other fluids are similarly measured, although over shorter time periods, and the initial values listed in table 1 are used in calculations. The interfacial tension of the oil–dispersant mixture with seawater, estimated by measuring the oblateness of a submillimetre oil–dispersant droplet rising at a known speed in quiescent seawater (Taylor Reference Taylor1934; Hu, Pine & Leal Reference Hu, Pine and Leal2000; Gopalan & Katz Reference Gopalan and Katz2010), is also listed in table 1. As expected, the dispersant reduces the interfacial tension with seawater by an order of magnitude.
$8~\text{mN}~\text{m}^{-1}$
. These reductions are probably due to migration of surface-active asphaltenes in the crude oil to the air or seawater interface, a well-studied phenomenon (Bauget, Langevin & Lenormand Reference Bauget, Langevin and Lenormand2001; Freer & Radke Reference Freer and Radke2004). The present range of values is consistent with published data (Harvey Reference Harvey1925; Farooq et al.
Reference Farooq, Simon, Tweheyo, Øye and Sjöblom2013). The surface tension of the oil–dispersant mixture starts at the same level as the original oil, but then decreases by 21 % and plateaus at a lower value. Migration of the dispersant to the surface is the likely cause of this trend, a well-known phenomenon (Reichert & Walker Reference Reichert and Walker2013; Riehm & McCormick Reference Riehm and McCormick2014). Due to the large amount of new surface created in a short time during the splash, we have used the initial values of surface and interfacial tensions as listed in table 1 during calculations (Marmottant, Villermaux & Clanet Reference Marmottant, Villermaux and Clanet2000). The surface and interfacial tensions of the other fluids are similarly measured, although over shorter time periods, and the initial values listed in table 1 are used in calculations. The interfacial tension of the oil–dispersant mixture with seawater, estimated by measuring the oblateness of a submillimetre oil–dispersant droplet rising at a known speed in quiescent seawater (Taylor Reference Taylor1934; Hu, Pine & Leal Reference Hu, Pine and Leal2000; Gopalan & Katz Reference Gopalan and Katz2010), is also listed in table 1. As expected, the dispersant reduces the interfacial tension with seawater by an order of magnitude.

Figure 23. Dynamic surface tensions of crude oil (squares) and premixed dispersant–oil mixture with DOR 1:25 (circles) at 22 °C. Dynamic interfacial tension of crude oil with seawater (diamonds) at 19 °C. The measurements were performed with the pendant drop technique. Grey level shadings indicate replicate measurement series.
Appendix B
Due to differences in oil colour atop the water, we have suspected that, for some oils, the oil layer thickness varies slightly across the surface and varies from experiment to experiment. Consequently, for those experiments repeated multiple times (i.e. series one experiments), we have quantified the uncertainty in layer thickness. In addition to 40 control experiments with no crude oil, 156 high-speed visualization experiments have been performed with crude oil layers in the range of
 $10~{\rm\mu}\text{m}<h<4.3~\text{mm}$
, created with crude oil volumes of 0.05–100 ml. Included are layers containing only crude oil with thicknesses of
$10~{\rm\mu}\text{m}<h<4.3~\text{mm}$
, created with crude oil volumes of 0.05–100 ml. Included are layers containing only crude oil with thicknesses of
 $h=7\pm 4~{\rm\mu}\text{m}$
,
$h=7\pm 4~{\rm\mu}\text{m}$
,
 $31\pm 3~{\rm\mu}\text{m}$
,
$31\pm 3~{\rm\mu}\text{m}$
,
 $101\pm 15~{\rm\mu}\text{m}$
,
$101\pm 15~{\rm\mu}\text{m}$
,
 $189\pm 75~{\rm\mu}\text{m}$
,
$189\pm 75~{\rm\mu}\text{m}$
,
 $382\pm 129~{\rm\mu}\text{m}$
,
$382\pm 129~{\rm\mu}\text{m}$
,
 $1100~{\rm\mu}\text{m}$
and
$1100~{\rm\mu}\text{m}$
and
 $2300~{\rm\mu}\text{m}$
, where the uncertainty for the thinner layers (
$2300~{\rm\mu}\text{m}$
, where the uncertainty for the thinner layers (
 ${<}1~\text{mm}$
) represents the standard deviation. In subsequent discussions, the values are rounded to
${<}1~\text{mm}$
) represents the standard deviation. In subsequent discussions, the values are rounded to
 $h=10~{\rm\mu}\text{m}$
,
$h=10~{\rm\mu}\text{m}$
,
 $30~{\rm\mu}\text{m}$
,
$30~{\rm\mu}\text{m}$
,
 $100~{\rm\mu}\text{m}$
,
$100~{\rm\mu}\text{m}$
,
 $200~{\rm\mu}\text{m}$
,
$200~{\rm\mu}\text{m}$
,
 $400~{\rm\mu}\text{m}$
,
$400~{\rm\mu}\text{m}$
,
 $1100~{\rm\mu}\text{m}$
and
$1100~{\rm\mu}\text{m}$
and
 $2300~{\rm\mu}\text{m}$
respectively. For the crude oil premixed with dispersant,
$2300~{\rm\mu}\text{m}$
respectively. For the crude oil premixed with dispersant,
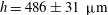 $h=486\pm 31~{\rm\mu}\text{m}$
is rounded to
$h=486\pm 31~{\rm\mu}\text{m}$
is rounded to
 $500~{\rm\mu}\text{m}$
. Because the variations in oil layer thickness are large for several of these cases, we perform a statistical analysis to show that the layer thicknesses are, in fact, significantly different. Student’s
$500~{\rm\mu}\text{m}$
. Because the variations in oil layer thickness are large for several of these cases, we perform a statistical analysis to show that the layer thicknesses are, in fact, significantly different. Student’s
 $t$
tests with a Bonferroni correction for multiple comparisons show that all neighbouring layer thicknesses (i.e.
$t$
tests with a Bonferroni correction for multiple comparisons show that all neighbouring layer thicknesses (i.e.
 $30~{\rm\mu}\text{m}$
versus
$30~{\rm\mu}\text{m}$
versus
 $100~{\rm\mu}\text{m}$
or
$100~{\rm\mu}\text{m}$
or
 $100~{\rm\mu}\text{m}$
versus
$100~{\rm\mu}\text{m}$
versus
 $200~{\rm\mu}\text{m}$
) are significantly different (
$200~{\rm\mu}\text{m}$
) are significantly different (
 $p<0.01$
). In addition, for layers with thicknesses of less than approximately
$p<0.01$
). In addition, for layers with thicknesses of less than approximately
 $500~{\rm\mu}\text{m}$
, the oil does not climb along the water meniscus to contact the tank wall. For thicker layers, the oil adheres to the wall and forms a significant meniscus, which obstructs part of the field of view near the surface.
$500~{\rm\mu}\text{m}$
, the oil does not climb along the water meniscus to contact the tank wall. For thicker layers, the oil adheres to the wall and forms a significant meniscus, which obstructs part of the field of view near the surface.
Each oil slick is used within several minutes after spreading it. Crude oil layers (series one) with
 $h<1~\text{mm}$
, namely the vast majority of experiments, are used only once and replaced with new ones for each test. Thicker layers involving larger volumes of oil are used for up to five impact tests, but are gently stirred between experiments to push the oil and water involved in a previous test to the side, leaving the droplet impact zone with fresh oil. The oil layers in experiment series two are also changed after each experiment. The oil layers in series three are used for up to five experiments. The tank is emptied and cleaned after each experiment or set of experiments to remove any oil residue. To protect the instruments, an oil-absorbent pad with a hole cut in the middle for the droplet to pass through is placed on top of the tank to absorb airborne oil droplets during the visualization experiments. Frequently cleaned thin acrylic sheets attached to the outside of the tank wall and an absorbent pad above them similarly protect the optics during the holographic measurements.
$h<1~\text{mm}$
, namely the vast majority of experiments, are used only once and replaced with new ones for each test. Thicker layers involving larger volumes of oil are used for up to five impact tests, but are gently stirred between experiments to push the oil and water involved in a previous test to the side, leaving the droplet impact zone with fresh oil. The oil layers in experiment series two are also changed after each experiment. The oil layers in series three are used for up to five experiments. The tank is emptied and cleaned after each experiment or set of experiments to remove any oil residue. To protect the instruments, an oil-absorbent pad with a hole cut in the middle for the droplet to pass through is placed on top of the tank to absorb airborne oil droplets during the visualization experiments. Frequently cleaned thin acrylic sheets attached to the outside of the tank wall and an absorbent pad above them similarly protect the optics during the holographic measurements.
Appendix C
The light source for holography is a spatially filtered and collimated diode-pumped Q-switched Nd/YLF laser with a wavelength of 523 nm. To maximize the reconstructed image quality, the hologram plane is located at the centreline of the tank and transmitted to the CMOS array using a Schneider Macro System CPN-S 4.0/80 lens. Prior to experiments, the magnification of the holography system is calibrated by placing, in the focal plane in the middle of the tank, a transparent glass target with a grid of opaque
 $250~{\rm\mu}\text{m}$
diameter dots with
$250~{\rm\mu}\text{m}$
diameter dots with
 $250~{\rm\mu}\text{m}$
edge-to-edge spacing (Edmund Optics). In comparison with the visualization experiments, the water depth is increased to 14 cm for the holography experiments. This difference facilitates recording of holograms without imaging through the acrylic walls (not a major issue). For a distance of 401.3 cm from the nozzle to the tank base, the resulting difference in droplet speed is 0.7 %, i.e. it is considered insignificant.
$250~{\rm\mu}\text{m}$
edge-to-edge spacing (Edmund Optics). In comparison with the visualization experiments, the water depth is increased to 14 cm for the holography experiments. This difference facilitates recording of holograms without imaging through the acrylic walls (not a major issue). For a distance of 401.3 cm from the nozzle to the tank base, the resulting difference in droplet speed is 0.7 %, i.e. it is considered insignificant.
The holograms are reconstructed in multiple depths to obtain in-focus images of all the droplets using available in-house codes (Sheng et al.
Reference Sheng, Malkiel and Katz2006; Talapatra et al.
Reference Talapatra, Hong, McFarland, Nayak, Zhang, Katz, Sullivan, Twardowski, Rines and Donaghay2013; Talapatra & Katz Reference Talapatra and Katz2013). These codes subtract a composite background image in order to reduce variations in background intensity, zero-pad the images to arrays with power of 2 size, and then numerically reconstruct the holograms over a depth of 7.5 cm in intervals of 0.05 cm. Post-processing masks fluid ligaments and replaces them with mean background intensity to prevent their identification as droplets. The 3D field is then compressed into a single 2D array by replacing each pixel by its minimum value across the stack of reconstructed planes. The resulting minimum-intensity image is thresholded and segmented to define particle locations. Then, using the original 3D field, a Hough transform and gradient-based edge detection are used to find the 3D location of each droplet and its size. The sizes (areas) of droplets that are not recognized by the program because of small size or non-circularity (both inherent limitations of the circular Hough transform) or particle overlap are manually measured and the radius of the circle with the corresponding area is used as the droplet radius. Droplet sizes produced from the Hough transform are manually checked against the minimum-intensity image; erroneous droplet sizes are manually re-measured. The minimum droplet size (i.e. diameter) that can be measured is
 $12.44~{\rm\mu}\text{m}$
, corresponding to 2 pixels.
$12.44~{\rm\mu}\text{m}$
, corresponding to 2 pixels.
Since the focal plane of the hologram is located at the centre of the sample volume during these measurements, and reconstruction generates two images of the same object located symmetrically on both sides of the hologram plane (real and virtual images), each droplet appears twice in the reconstructed volume. Consequently, we only have to reconstruct half of the volume to record all of the droplets. However, slight shifts in the location of the impact of the raindrop introduce an uncertainty in the depth position and angular location of these droplets in space relative to this impact point. To estimate the impact of this uncertainty on the droplet spatial distributions, we have calculated them twice, first assuming that all the droplets are located in the real image field and second assuming that they are found in the virtual image field. A comparison between results indicates that the impact is negligible.


