


There is growing interest in explaining why some households are more financially resilient than others, when they are confronted with unanticipated adverse economic events (e.g., Clark et al. Reference Clark, Lusardi and Mitchell2021a, Reference Clark, Lusardi, Mitchell and Davis2021b; Clark & Mitchell Reference Clark and Mitchell2022). This paper first provides a longitudinal investigation of middle-aged and older Americans’ racial and ethnic differences in terms of their financial resilience. We document the stability of financial resilience between 2020 and 2024 and explore how the resilience gaps changed during this period, by demographic group. Moreover, we evaluate whether being more resilient positively affected these households’ financial satisfaction in 2024.
To this end, we track respondents age 45–75 in the Understanding American Study (UAS)Footnote 1 from 2020 to 2024, to investigate how they responded to questions we designed about their financial situations. Following previous work, we define a household’s financial resilience as an indicator of its financial situation, incorporating questions about its ability to withstand economic shocks, whether it plans for the future, tracks expenses, has a manageable level of debt, and is anxious about future finances, (c.f., Lusardi et al. Reference Lusardi, Schneider and Tufano2011; Clark & Mitchell Reference Clark and Mitchell2024). In other words, our index considers both the asset and the liability sides of household balance sheets, along with behaviors related to doing well financially.Footnote 2 This measure of financial resilience, which relies on self-assessed financial behaviors, provides a useful way to gauge how households are faring financially and how well they are prepared to withstand adverse economic shocks. It is similar to measures of financial well-being and financial security; nevertheless, financial resilience is a more comprehensive measure as it considers how well individuals are preparing for future economic shocks.
Five key findings emerge from our research. First, in 2020, Blacks were significantly less financially resilient than Whites and remained so through 2024; Hispanics were also less resilient though better prepared than Blacks. The fact that the resilience index and the gaps by racial and ethnicity were relatively stable over time is an important finding. Second, Blacks were less resilient because they were less able to cope with earnings losses, had not developed retirement plans, and did not set budgetary targets; similar factors explain why Hispanics were less resilient. Third, both Blacks and Hispanics were less financially literate than their White counterparts, and these financial literacy differences informed many of the financial decisions shaping financial resilience. Fourth, greater financial literacy had a smaller positive effect on financial resilience for Blacks and Hispanics, versus White households. Finally, being more financially resilient increased the chances of being more satisfied with the financial status in 2024.
In what follows, we first describe our measure of financial resiliency, discuss our data, and report differences in resilience by racial/ethnic groups. Next we explore the determinants of financial resilience and trace the path of financial resilience over time. We also look at how financial resilience beneficially affects economic outcomes. A final section concludes.
1. Americans’ financial resilience and financial literacy: Prior research and measurement
While unexpected economic shocks can have significant adverse effects on household finances, some households can and often do take protective steps, leaving them better prepared to handle the economic impacts of such shocks.Footnote 3 This was clearly illustrated when the COVID-19 pandemic beginning in 2020 imposed massive challenges on most US households with school closures, widespread unemployment, an illness that could lead to hospitalization, and the highest inflation rates experienced in decade. Moreover, these burdens fell unevenly on population subgroups, since many Black and Hispanics households had small saving cushions with which to face these economic hardships (Lusardi et al. Reference Lusardi, Mitchell, Sconti, Sticha, Mitchell and Roussanovforthcoming ). Other research (Lusardi Reference Lusardi2019; Yakoboski et al. Reference Yakoboski, Lusardi and Hasler2020) has shown that younger, lower-paid, and less-educated groups are typically the least financially well off, and Black as well as Hispanic women accumulate fewer assets and are more likely to undertake costly borrowing, both factors associated with greater financial vulnerability (Clark et al. Reference Clark, Lusardi, Mitchell and Davis2021b). As a result, it is of interest to explore what financial resilience levels looked like at the outset of the pandemic, and how these changed over time by racial and ethnic groups.
We measure financial resilience using survey questions we devised regarding four areas indicative of each household’s personal financial situation. These include their exposure to unexpected earnings loss; whether they had retirement/spending plans and tracked their spending; whether their debt was seen as manageable and its potential impact on spending; and their level of concern regarding finances currently and in the future. The specific questions we used were as follows:
-
1. Ability to respond to unexpected loss of earnings or expenses
-
• Cope With Lost Earnings: How confident is the respondent that he/she could cover expenses for at least 3 months if there were no labor earnings?
-
-
2. Developed a retirement and spending plan and track their spending
-
• Develop Retirement Plan: Has the respondent calculated the financial resources needed in retirement?
-
• Track Spending: Does the respondent track day-to-day spending?
-
• Set Budget Target: Does the respondent create a budget and set targets with that budget?
-
-
3. Level of debt and its impact
-
• Debt Level OK: Does the respondent consider his/her current debt level to be manageable?
-
• No Medical Delays: Has this debt delayed or prevented the respondent from receiving medical treatment (including filling prescriptions)?
-
-
4. Level of concern over finances
-
• Not Financially Anxious: Is the respondent anxious about the state of his/her finances and preparedness?
-
• Money Will Not Run Out: Is the respondent confident that his/her money will not run out in retirement?
-
Using our survey respondents’ answers to these questions, we determine the household’s financial resilience score by adding the number of positive values provided for these eight questions (being able to cope, develop a plan, not being financially anxious, and so on).Footnote 4 Prior studies have examined this metric and noted that it remained relatively stable over the 2020–2022 period, despite the pandemic (Clark and Mitchell Reference Clark and Mitchell2024). In what follows, we examine index scores separately for Black, Hispanic, and White population subgroups. Additionally, we extend these findings to 2024, so we can investigate outcomes after the pandemic.
It is also important to investigate whether being more financially resilient, as measured above, was associated with better financial outcomes, proxied by a measure of financial satisfaction. The latter is captured using a UAS question regarding how respondents answered this question: “Compared to Spring a year ago, are you more satisfied or less satisfied with your current financial situation?” Possible answers to this question were: Much more satisfied, More satisfied, About the same, Less satisfied, Much less satisfied, and Don’t know. Respondents who answered much more/more satisfied were considered as doing better financially, while those choosing the other options were deemed to have the same or a worse financial situation.
Finally, we also evaluated respondents’ financial literacy, measured as a respondent’s total number of correct answers to the Big Three financial literacy questions (Lusardi & Mitchell Reference Lusardi and Mitchell2014). This measure is particularly good at differentiating who has basic financial knowledge, and it has been shown driving key economic outcomes, including financial well-being and wealth inequality (Lusardi & Mitchell Reference Lusardi and Mitchell2023). In what follows, we explore whether respondents’ financial literacy serves as a good predictor of their financial resilience, in addition to other socio-demographic control variables consistent with prior literature.
2. Dataset and financial resilience results
We begin by examining responses from 2,709 individuals age 45–75 that we surveyed in a special module we designed and that was fielded in February/March of 2024 by the Understanding America Study (UAS),Footnote 5 a nationally representative online panel study fielded by the University of Southern California. Our focus is on middle-aged and older respondents, as this group is most likely to be saving and accumulating for retirement. The UAS also collects and links other extensive information on respondents’ economic and demographic characteristics.
Given our interest in differences across race and ethnicity, in Table 1, we report the sample means in 2024 of Black, Hispanic, and White respondents by economic and demographic characteristics. The mean age of the Black and Hispanic households was 59, while the average age of Whites was 63. The White sample also had higher annual income, more education, was more male, and was more likely to be married. Table 2 reports the mean percent of Blacks and Hispanics answering each of the eight questions positively, along with the statistical difference measured vis a vis Whites in 2024.
Table 1. Descriptive statistics by race and ethnicity: 2024

Note: Data from UAS596 fielded in spring 2024; data are weighted.
Source: Authors’ calculations.
Table 2. Mean financial resilience index scores and proportion of respondents answering each question positively, by race and ethnicity: 2024

Note: * p < 0.10, ** p < 0.05, *** p < 0.01. Data from UAS596 fielded in spring 2024; data are weighted.
Source: Authors’ calculations.
A noteworthy finding in Table 1 is that financial satisfaction is found to be higher among Hispanics than Whites and Blacks. Black respondents scored significantly lower on both the financial literacy and financial resilience measures, compared to Hispanics and Whites. The mean financial literacy score for Blacks was 1.44, for Hispanics 1.97, and for Whites 2.25 (out of a total of 3 possible correct answers). The mean financial resilience score, or the number of positive answers to the eight questions in the index described above, also followed the same patterns (see Table 2). For Blacks, the mean financial resilience score was 4.31, for Hispanics 4.85, and for Whites 5.06. In other words, both Blacks and Hispanics were more likely to score low on the financial resilience index, compared to Whites. Figure 1 shows the distribution of financial resilience scores by race and ethnicity, revealing a more skewed pattern for Blacks than for Hispanics and Whites.
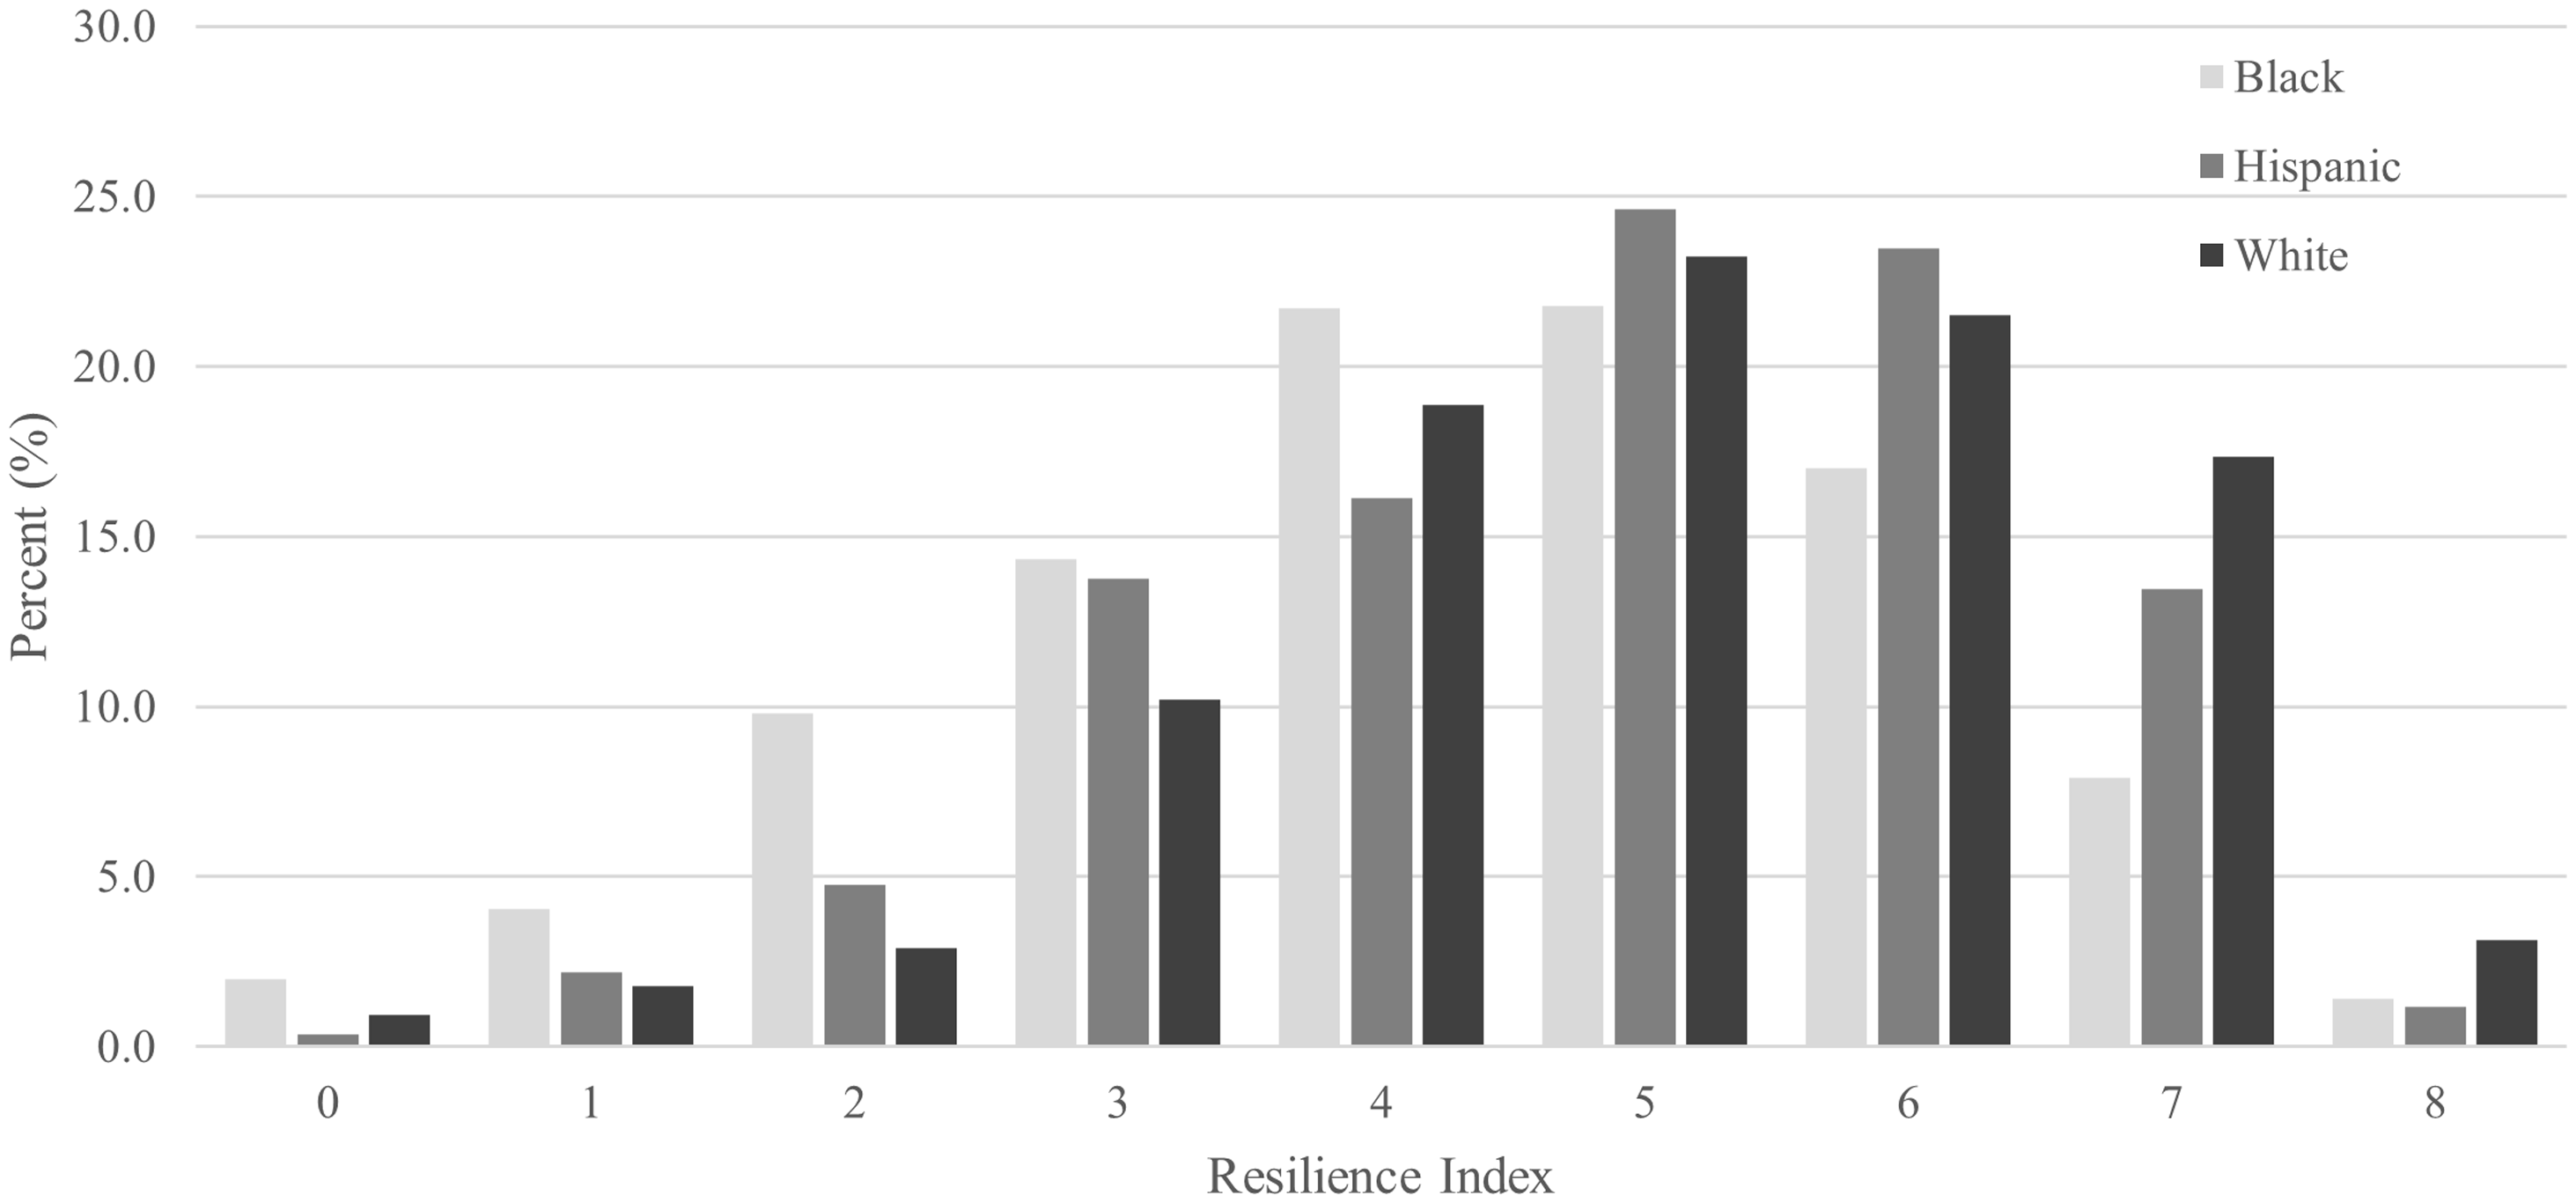
Figure 1. Financial resilience scores by race and ethnicity: 2024.
Note: Data from UAS596 fielded in spring 2024; data are weighted. Source: Authors’ calculations.
Looking at each of the eight questions making up the resilience index in Table 2, as the pandemic wound down in 2024, we found that most Whites (74%) were reasonably confident that they could cope with a short-term loss of earnings; in contrast, fewer Blacks (54%) and Hispanics (63%) were that confident. Answers to the other questions were more similar across demographic groups, since most people indicated they tracked their patterns of spending, set budget targets, had an acceptable debt level, did not experience medical delays due to lack of funds, and were not financially anxious. Yet few respondents had developed a retirement plan, and most were concerned that their money would run out in retirement. For these latter two concepts, Blacks and Hispanics expressed significantly less confidence than their White counterparts.
Our analysis of these components speaks to the quality of our measure and the useful information it provides. We note that our assessment of whether households follow good financial practices is in keeping with generally accepted wisdom; nonetheless, there may be good reasons why, for example, a household might not hold precautionary savings or plan for the future. For instance, during the pandemic, access to and generosity of unemployment insurance benefits increased, leading lower-income households to receive high replacement rates from social insurance benefits. In any event, our measure incorporates several indicators of households’ potential to bend without breaking, when facing unexpected economic shocks.
In addition to the 2024 survey, we collected information from three previous UAS survey waves, from 2020, 2021, and 2022,Footnote 6 which also included the resilience index questions; a subset of 1,984 respondents answered all four surveys. Table 3 reports summary measures on these respondents for each of the four surveys. Interestingly, the mean index score for this sample rose gradually, from 4.6 in 2020 to 4.95 in 2024, suggesting that as economic conditions improved over time, financial resilience also grew, though the changes were not large. The increase in resilience over this period seems to reflect the economic recovery following its collapse due to health-related disruptions. In addition, we find that resilience increases with age; since our sample is four years older in 2024, some of the increase is likely due to the aging effect.
Table 3. Financial resilience indicators: respondents to all four UAS surveys 2020–2024: Mean financial resilience index and proportion of sample answering each question positively
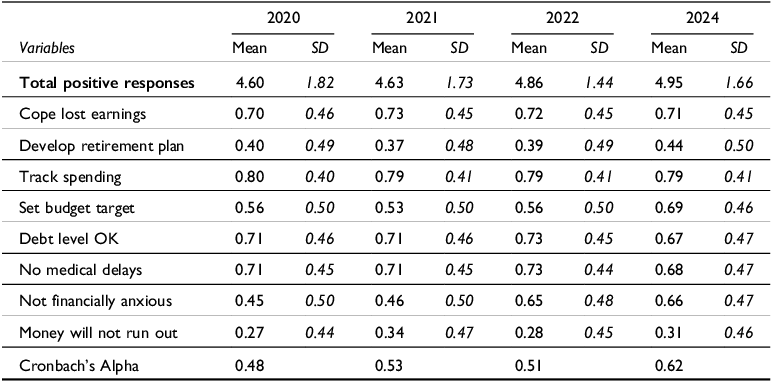
N = 1,984.
Note: Data from UAS Surveys 226, 378, 441, and 596; data weighted.
Source: Authors calculations.
The proportion of respondents with positive responses to each of the questions remained relatively stable for each of the component questions in the index, though some improvement was detected in the more recent years. Figure 2 shows the relative stability of the resilience index and the consistent gap in resilience across the demographic groups. Blacks had the lowest level of financial resilience, averaging about 0.75 points below Whites. Hispanic respondents scored below Whites though the gap closed slightly over the time span examined.

Figure 2. Trends in financial resilience by race and ethnicity: 2020–2024.
Note: Data from respondents who answered the resilience questions in all of the UAS surveys (UAS226 in 2020, UAS378 in 2021, UAS 441 in 2022, and UAS596 in 2024); data are weighted. Source: Authors’ calculations.
To further explore differences in the resilience index across demographic groups, Table 4 reports the mean of the positive answers to each of the questions in the index and how they differ by race/ethnicity over the sample period (2020–2024). The mean index score is relatively stable over time, but the index across all subgroups is higher in the two later years as the economy recovered. We also find that the mean positive answers for the individual questions are relatively constant across the years in our sample.
Table 4. Financial resilience indicators: respondents to all four surveys UAS 2020–2024

Note: Data from UAS Surveys 226, 378, 441, and 596; data weighted.
Source: Authors calculations.
Overall, we find that there were significant racial and ethnic differences in financial resilience, and average resilience scores changed only slightly over the four-year period for each group. Two-thirds (66.5%) of all respondents reported a score in 2024 within +/−1 of their 2020 score. When viewed separately for each of the demographic groups, we see that 62.3% of Blacks, 62.8% of Hispanics, and 66.7% of Whites had 2024 scores within +/−1 point of their 2020 index score. The distribution of resilience scores by demographic groups and by year appears in Figure 3.
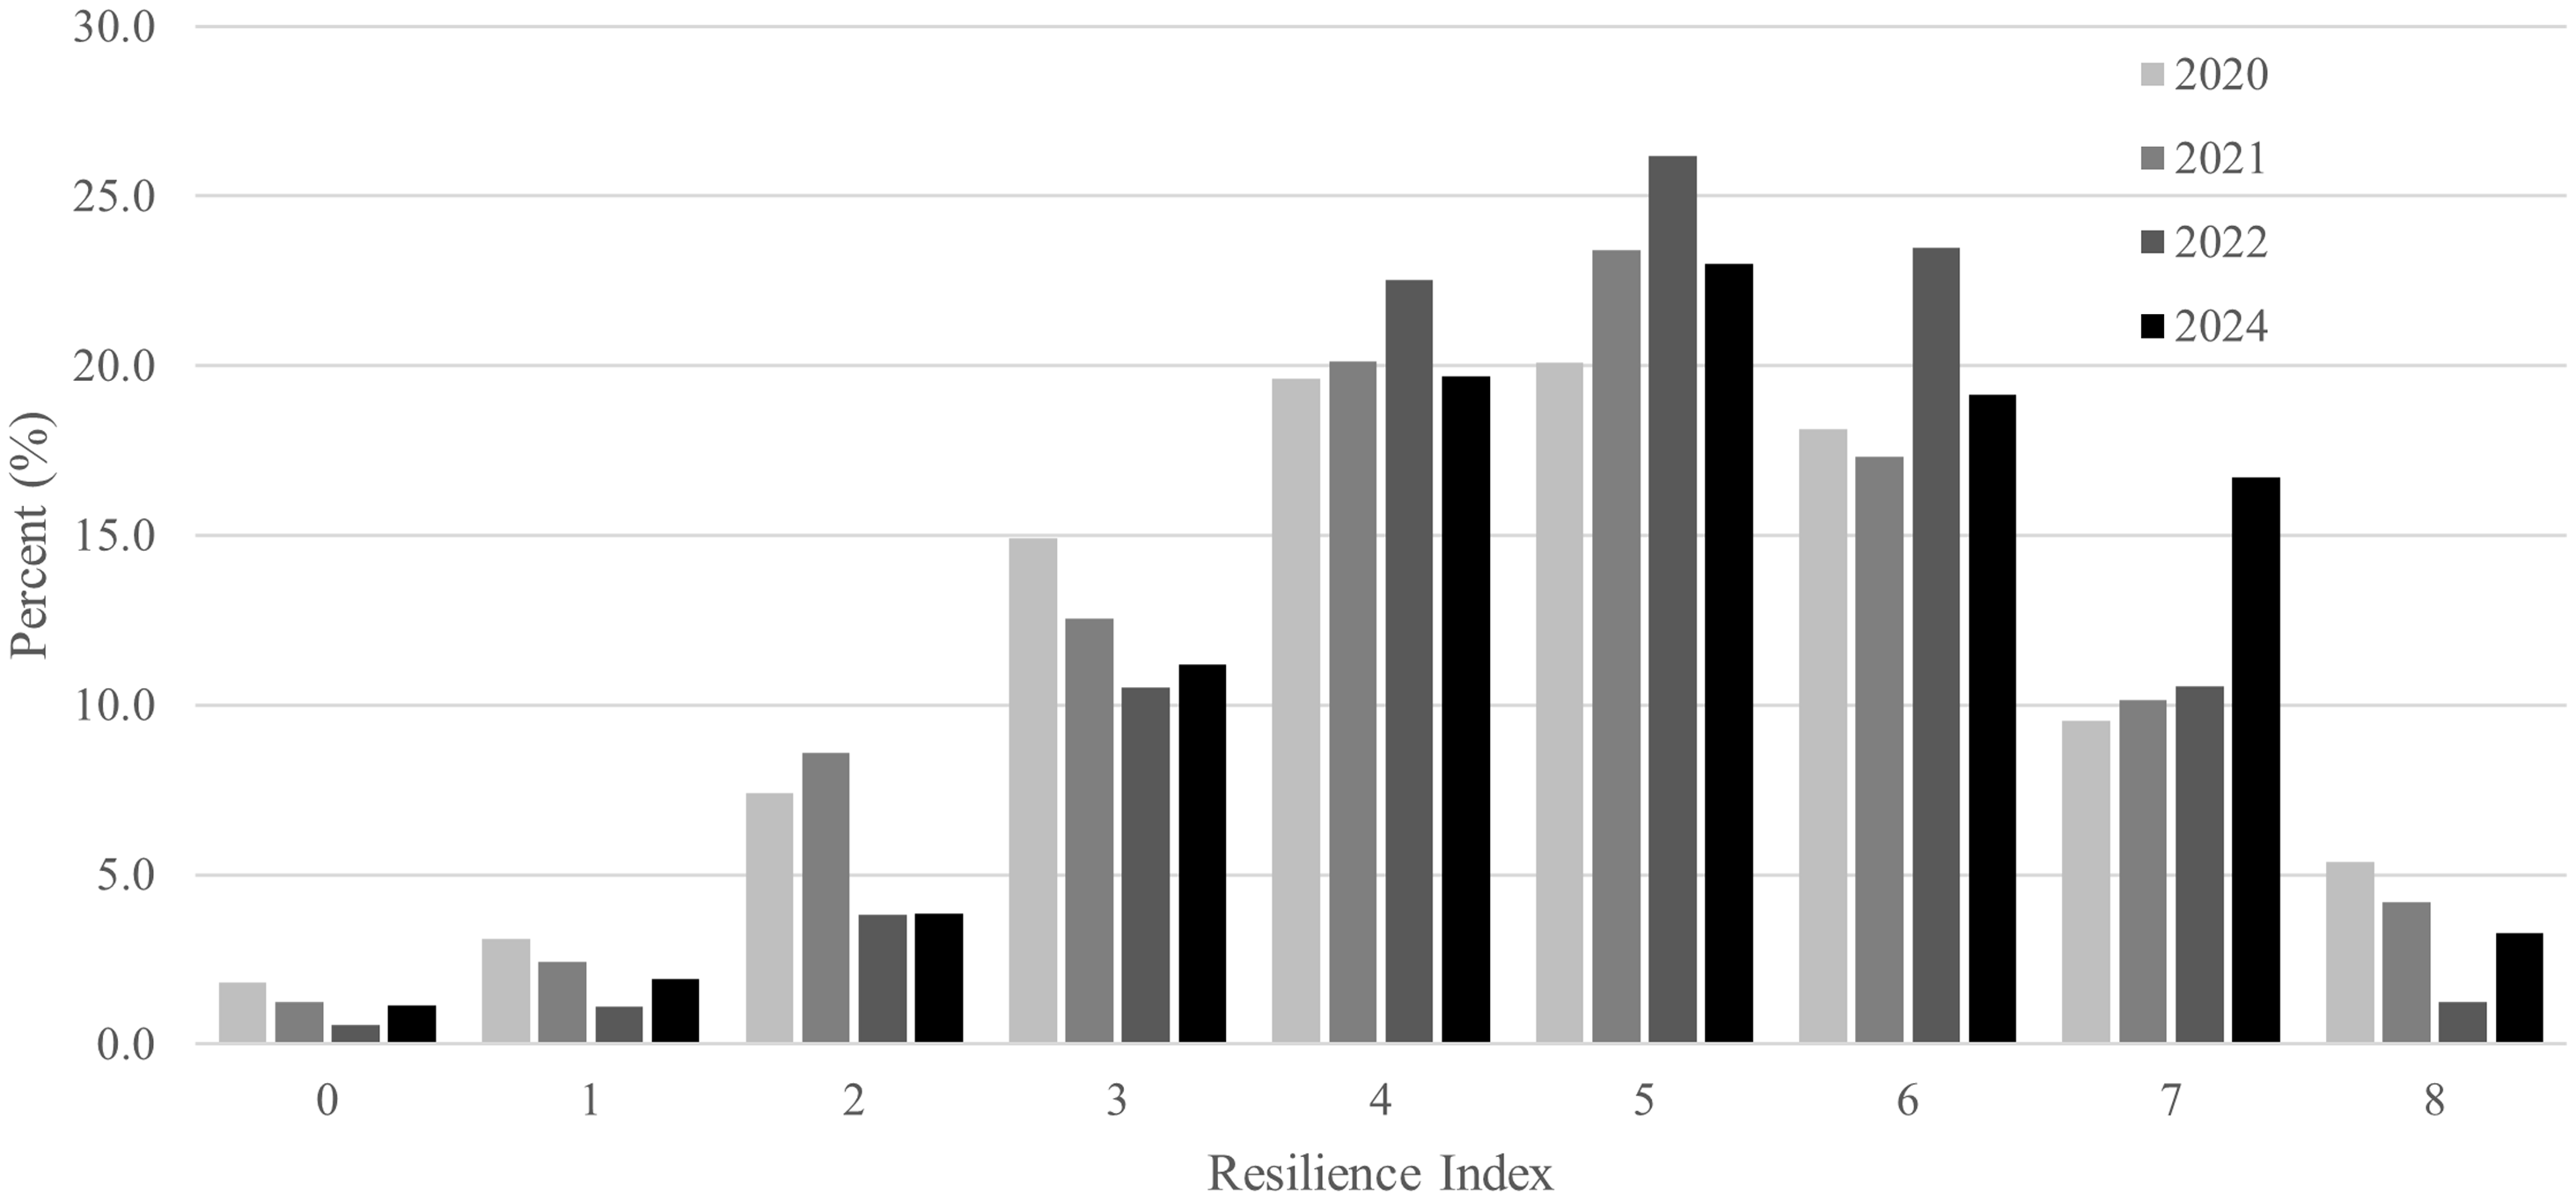
Figure 3. Distribution of financial resilience index scores for respondents completing all four surveys: 2020–2024.
Note: Data from respondents who answered the resilience questions in all four UAS surveys (UAS226 in 2020, UAS378 in 2021, UAS 441 in 2022, and UAS596 in 2024); data are weighted. Source: Authors’ calculations.
3. Racial/Ethnicity differences in factors shaping financial resilience
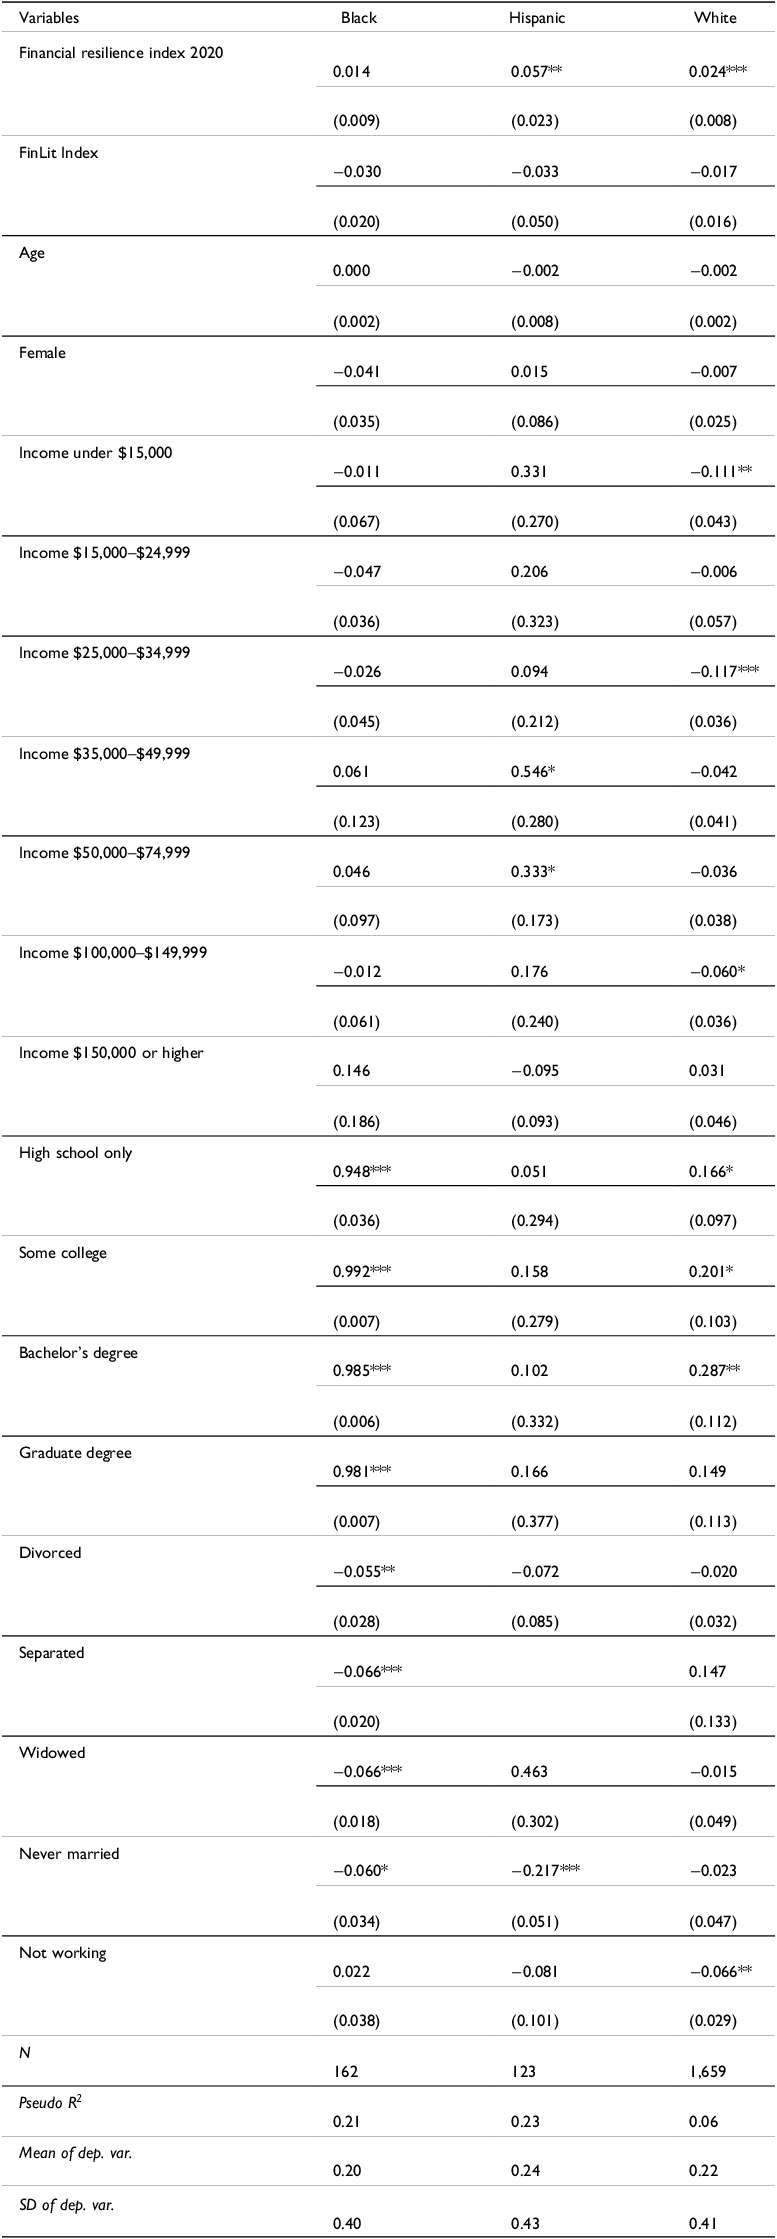
To further explore these patterns of financial resilience, we next present estimates from a multivariate regression model of financial resilience in 2024, as a function of respondents’ socio/economic characteristics including education, sex, marital status, and employment status (see Table 5). To test whether and how financial resilience differs across these groups, we report separate results for Blacks, Hispanics, and Whites, where the dependent variable is the respondent’s total number of positive responses to the questions in the resilience index.
Table 5. Regression results for financial resilience index, by race and ethnicity: 2024

Note: * p < 0.10, ** p < 0.05, *** p < 0.01. Data from UAS596 fielded in spring 2024; data are weighted. Chi-square test indicates whether race/ethnicity coefficients are significantly different from each other.
Source: Authors’ calculations.
A first key finding is that more financial literate respondents were significantly more likely to score higher on the financial resiliency index. Among Whites, one additional correct answer to the Big Three questions was associated with a 0.37 higher financial resiliency index, and the magnitude of this effect was 50% higher than the 0.25 estimated for Blacks and about 10% higher than the effect found for Hispanics. In other words, improving financial literacy has a smaller protective effect for Blacks and Hispanics than for Whites. Another interesting if unsurprising result in Table 5 is the fact that those with higher incomes were more financially resilient. More surprising is that the protective effect of higher income was more important for Whites, but less statistically significant for Black and Hispanic respondents. Having more education was again more protective for Whites, but not statistically significant for either Black or Hispanic financial resilience. Being divorced or widowed was more strongly and negatively associated with resilience for Hispanics, compared to Blacks and Whites. In other words, somewhat different factors account for financial resilience across these three groups.
4. Being resilient increases the likelihood of positive economic outcomes
4.1. Are respondents more satisfied with their financial situations?
We are also interested in whether individuals with higher financial resilience scores were more likely to be more satisfied with their economic status over time. To this end, Table 6 reports which individuals indicated that they were more/much satisfied with their financial situation in 2024 compared to the year before. Interestingly, approximately one-quarter of each of the three demographic subgroups indicated that they were more satisfied in 2024 than the prior year. The mean index score for those more satisfied compared to others was almost one point higher among Blacks and about 0.5 points higher for Hispanics and Whites. Similarly, mean financial literacy scores were higher for the more satisfied respondents. These findings illustrate the potential value of encouraging older individuals across racial/ethnic subgroups to take steps to become more financially literate.
Table 6. Descriptive statistics for respondents who reported being more satisfied compared to one year ago: 2024

Note: * p < 0.10, ** p < 0.05, *** p < 0.01. Data from UAS596 fielded in spring 2024; data are weighted.
Source: Authors’ calculations.
To control for the fact that other personal characteristics also differ across respondents, we next report the results of a multivariate analysis of respondent satisfaction by race/ethnicity in Table 7. In particular, we evaluate whether the resilience index score influenced financial satisfaction in 2024.Footnote 7 Results confirm that, holding other factors constant, higher resilience scores were associated with increased economic satisfaction for all three groups. Interestingly, the estimated effect for being more satisfied for Blacks and Hispanics was over twice as high as the impact of a one-unit resilience increase for Whites. We also confirm that, especially for Hispanics and Whites, lower income was associated with a lower probability of being more satisfied; not being currently married also lowered satisfaction for Blacks. In summary, while the proportion of those satisfied was similar across the three groups, the factors associated with the degree of satisfaction differed across the racial and ethnic groups with greater levels of financial resilience having a larger effect on satisfaction of Blacks and Hispanics
Table 7. Marginal effects: Probit model of financial satisfaction, by race and ethnicity

Note: * p < 0.10, ** p < 0.05, *** p < 0.01. Data from UAS596 fielded in spring 2024. All values are weighted.
Source: Authors’ calculations.
5. Conclusions
We have explored differences in Americans’ financial resilience along with how resilience influences peoples’ satisfaction with their economic situations. We document that Blacks were significantly less resilient than Whites, mainly because they were less able to cope with earnings loss, had not developed a retirement plan, and did not set budgetary targets. Hispanics tended to score higher on the resilience index than Blacks, though they remained less resilient than White households. When examining the determinants of financial resilience, we found that financial literacy plays an important role across every race and ethnicity group.
To address the important question of whether resilience affected peoples’ economic outcomes post-pandemic, we confirmed that the more financially resilient were also more satisfied about their finances. Interestingly, this impact was larger for Blacks and Hispanics than for Whites. This implies that policies encouraging behaviors that boost financial preparedness could be expected to strengthen household outcomes and better insulate them from economic shocks.
Despite the richness of our survey findings, our study does have limitations. First, we focus only on middle-aged and older Americans, so our results may not hold for the younger population. Nevertheless, the young could be less financially resilient than the old, due to their relatively higher debt and lower asset levels. Second, while we oversampled minorities in the 2024 survey, our minority sample sizes in the three prior surveys were relatively small. Third, our measure of financial resilience relies on self-reported rather than objectively measured data. Naturally, this metric emphasizes how respondents actually say they feel and is likely correlated with their levels of financial stress. Notwithstanding these limitations, our analysis provides useful insights on the importance of being financially resilient, how boosting financial resilience can help close racial/ethnic gaps, and the need to enhance these groups’ financial literacy.
Appendix
Table A1. Marginal effects: probit model of financial satisfaction, by race and ethnicity: UAS 2020 and 2024
Note: * p < 0.10, ** p < 0.05, *** p < 0.01. Data from UAS596 fielded in spring 2024 except resilience index; data weighted.
Source: Authors’ calculations.


 Open access