INTRODUCTION
Numbers are pervasive in modern politics. Politicians readily invoke numbers about GDP growth, tax rates, unemployment, war casualties, etc., which thereby typifies the fact that numbers have become, during the last two centuries, “a central feature of public discourse” (Prévost and Beaud, Reference Prévost and Beaud2012).
Numbers are, however, not necessarily very persuasive in politics. Studies often find that exposure to politically relevant numbers have non-significant or very limited effects on related policy attitudes (Cohen, Reference Cohen2003; Gaines et al., Reference Gaines, Kuklinski, Quirk, Peyton and Verkuilen2007; Kuklinski et al., Reference Kuklinski, Quirk, Jerit, Schwieder and Rich2000; Lawrence and Sides, Reference Lawrence and Sides2014; although see Gilens, Reference Gilens2001; Pedersen Reference Pedersen2016; Schueler, Reference Schueler and West2016). With this in mind, politicians’ use of numbers is somewhat puzzling. Does it make sense for politicians to use numbers in their rhetoric when such numbers are seemingly so ineffective in changing the public's attitudes?
Using a survey experiment, this paper shows that the use of numbers by politicians has a substantial, positive impact on the perceptions of these politicians. By using numbers in their rhetoric, politicians may not move policy attitudes, but they can positively affect voters’ perceptions about their competence and thereby also affect their electoral success.
THE EFFECTS OF NUMBERS ON PERSONALITY PERCEPTIONS, POLICY POSITIONS, AND A POLITICIAN'S POPULARITY
A politician is more than past performance, political party, and policy positions. A politician is also a person. As a result, when voters form impressions of political candidates, they evaluate candidates’ personality traits as well as their performance, party, and policies (Kinder et al., Reference Kinder, Peters, Abelson and Fiske1980).Footnote 1 In this study, we focus on the two universal dimensions on which social cognition theory and research have found that we evaluate other people or groups: competence and warmth (Cuddy et al., Reference Cuddy, Fiske, Glick and Mark2008; Fiske et al., Reference Fiske, Cuddy, Glick and Xu2002). The warmth dimension reflects traits related to the intentions of an individual (or group), such as friendliness and helpfulness, whereas the competence dimension captures traits related to the abilities of the individual, such as intelligence and skills (Fiske et al., Reference Fiske, Cuddy and Glick2007; Koch and Obermaier, Reference Koch and Obermaier2014). Much has been written about how voters assess the traits of politicians and how these perceptions affect voting, but relatively little has been done to determine what politicians do, or can do, to affect these perceptions (Fridkin and Kenney, Reference Fridkin and Kenney2011).
Competence and Numbers
The key proposition in this study is that when a politician uses numbers, voters will see this politician as more competent and—by extension—be more likely to vote for this politician. To understand how numbers might affect perceptions of competence, it is useful to consider the role played by numbers in politics and society in general. The language of politics has not always been full of numbers, but numbers have played a role in public discourse since as early as the 1820s and 1830s—a period sometimes termed the “great explosion” of numbers by historians of statistics. Today, political issues are heavily infused with numbers (Desrosiéres, Reference Desrosiéres1998; Porter, Reference Porter1986; Prévost and Beaud, Reference Prévost and Beaud2012). Crucially, this quantification of the public discourse and politics has been seen, from the start, as a development toward a more rational form of politics and debate (e.g., Prévost and Beaud, Reference Prévost and Beaud2012, p. 44).
Given this widespread cultural perception of numbers as being closely associated with rationality and knowledge, the presence of numbers in a politician's rhetoric may be used as a cognitive shortcut (a heuristic) by voters when forming an assessment of that politician. Voters have been found to use several heuristics when assessing political candidates, for example, party ID, candidate endorsements, poll standings, and facial features (Berggren et al., Reference Berggren, Jordahl and Poutvaara2010; Campbell and Cowley, Reference Campbell and Cowley2014; Lau and Redlawsk, Reference Lau and Redlawsk2001, Reference Lau and Redlawsk2006; Utych and Kam, Reference Utych and Kam2014). This study suggests that we add a numbers-as-competence heuristic to this list of heuristics. Based on this, we hypothesize that the use of numbers by a political actor increases the perceived competence of that actor.
Warmth and Numbers
The use of numbers could potentially also have effects on perceived warmth. However, the direction of such an effect could be in both directions. On the one hand, competence and warmth often correlate positively, and a higher assessment of competence could therefore be associated with a higher assessment of warmth through the halo effect (Fiske et al., Reference Fiske, Cuddy and Glick2007). On the other hand, there is sometimes a compensatory effect when comparing several people on different traits, such that when one person is judged more positively on one dimension, the second person is judged more positively on the other dimension (Judd et al., Reference Judd, James-Hawkins, Yzerbyt and Kashima2005; Kervyn et al., Reference Kervyn, Yzerbyt and Judd2010). We therefore do not have any expectations regarding the effect of numerical rhetoric on perceived warmth, but, for completeness, the study also tests whether the use of numbers by a political actor increases or decreases the perceived warmth of that actor.
Policy Positions and Numbers
Given that numerical rhetoric may have an effect on perceptions of personality traits, it is tempting to assume that this type of rhetoric will also be more persuasive, i.e., effective in changing the policy attitudes of voters on the subject being discussed. However, as previously noted, a large number of studies have shown that numbers are generally quite ineffective at achieving this; presenting people with politically relevant numbers often does little to affect their opinions regarding policies on those issues (Gaines et al., Reference Gaines, Kuklinski, Quirk, Peyton and Verkuilen2007; Kuklinski et al., Reference Kuklinski, Quirk, Jerit, Schwieder and Rich2000; Lawrence and Sides, Reference Lawrence and Sides2014). Therefore, we hypothesize that the use of numbers by a political actor will have limited and/or insignificant effects on voters’ policy attitudes.
Voting and Numbers
If the use of numbers does lead voters to see a politician as more competent, this can have electoral consequences. Several studies have shown that trait perceptions are associated with voters’ overall evaluation of candidates and, in some cases, vote choice (Bartels, Reference Bartels and King2002; Fridkin and Kenney, Reference Fridkin and Kenney2011; Funk, Reference Funk1999; Hayes, Reference Hayes2010; Miller et al., Reference Miller, Wattenberg and Malanchuk1986). Furthermore, studies focusing specifically on the role of competence have found that perceptions of this trait do affect overall assessments and voting intentions (Funk, Reference Funk1996; Koch and Obermaier, Reference Koch and Obermaier2014). Assessments of a candidate's competence are obviously not the only factor affecting a voter's propensity to vote for that candidate, and using vote choice as a dependent variable is therefore a very stringent test of numerical rhetoric's effect. Nevertheless, we hypothesize that the use of numbers by a political actor increases the propensity of voters to vote for that politician. Furthermore, we expect that this effect of numerical rhetoric is mediated by perceived competence.
METHODS
The experiment was conducted in a commercial web panel (Epinion). Footnote 2 Members of the panel were invited by email to participate, and out of the 1,294 respondents who started the survey, 79% completed the entire survey. More importantly, the drop-off after exposure to the experimental stimuli did not differ significantly across experimental conditions, χ 2(3, N = 1,210) = 0.61, p = 0.89. The sample exhibited substantial variation in demographic and attitudinal variables: 52% of the sample was female, the ages ranged from 18 to 79 (M = 49, SD = 16), and 47% had completed tertiary-level education (college level). Furthermore, the sample represented the full left-right political spectrum (M = 0.49, SD = 0.27, scale range: 0–1).
Stimuli: Respondents were instructed to read a brief discussion between two fictitious politicians on the issue of genetically modified foods (GM foods). Respondents were randomly assigned to one of four conditions (randomization was undertaken by the survey company). In condition 1 (baseline condition), both politicians argued without using any numbers, one in favor of GM foods and one against. In condition 2, the argument made by the politician against GM foods remained exactly the same, whereas the arguments made by the politician in favor of GM foods were quantified. Instead of arguing, for example, that “GM foods markedly reduce the use of pesticides,” the politician now stated that “GM foods reduce the use of pesticides by 50%.” In condition 3, this was reversed so that the politician arguing against GM foods was now using numbers, whereas the politician in favor did not use any numbers. Finally, in condition 4, both politicians used numbers.Footnote 3 Because the only variation was the quantification of the statements, the texts in all four conditions were of almost identical length (135–139 words in original language. See the full text in replication materials).
The issue of GM foods is a relatively unsettled political issue, and while parties on the left side of the political spectrum tend to be more skeptical of GM foods than parties on the right, the policy positions on this issue do not implicitly provide respondents with clear party cues. In contrast, positions on many economic issues would most likely be completely crystalized and, at the same time, provide respondents with implicit party cues, thereby minimizing the likelihood of the respondent being affected by the arguments (for a similar line of reasoning, see Druckman et al. (Reference Druckman, Peterson and Slothuus2013)).Footnote 4 As a result, choosing this issue maximized the chance that the discussion might actually change the respondents’ policy positions, not just their perceptions of the politicians. As a relatively technical political issue, a political debate on GM foods may lend itself particularly well to quantification, and we will return to the issue of generalizability across policy issues in the concluding discussion.
The experiment used a stimulus with two politicians for two reasons. First, while experiments on communication effects have often used one-sided stimuli where the respondents are restricted to hearing just one position on a political issues, the most typical information environment for citizens is an environment in which alternative interpretations of a political issue are presented (Chong and Druckman, Reference Chong and Druckman2007; Sniderman and Theriault, Reference Sniderman, Theriault, Saris and Sniderman2004). Second, people are inclined to evaluate other people in a comparative rather than an absolute manner (Goffin and Olson, Reference Goffin and Olson2011). By asking respondents to rate the traits of two politicians rather than just one, we can arrive at more precise estimates of the effects of numerical rhetoric.
Dependent variables: After reading the discussion, respondents were asked to evaluate the two politicians on four traits associated with competence (Intelligent, competent, credible, knowledgeable), and four traits associated with warmth (likeable, conscientious, friendly, caring).Footnote 5 These items formed reliable scales for both competence (Cronbach's α = 0.88–0.90) and warmth (α = 0.83–0.85).Footnote 6 Scales for competence and warmth were standardized to range from zero to one. Scales for the differences in perceptions between the two politicians were simply constructed by subtracting the assessment of the “con” politician from the assessment of the “pro” politician; these scales consequently ranged from −1 to 1 for both traits. Finally, respondents were asked about which politician they would vote for, their personal opinion about GM foods, and two questions about their recall of the use of numbers in the discussion (see replication materials for exact question wordings).
FINDINGS
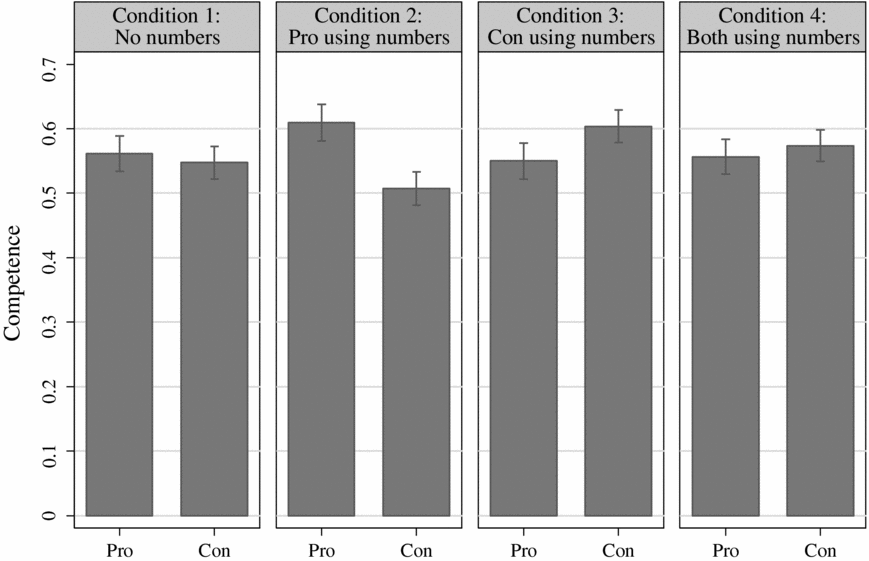
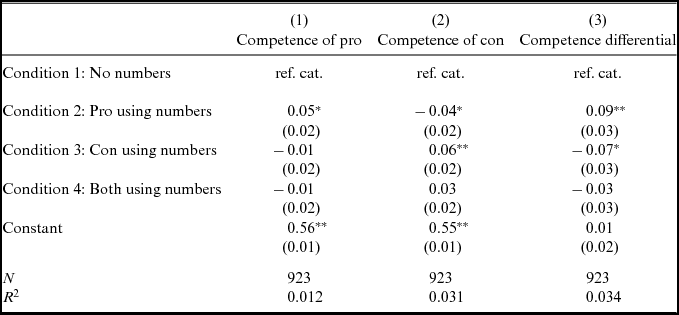
Effects on trait perceptions: An ANOVA test with differences in competence assessments as the dependent variable, shows highly significant effects for the experimental treatment (F(3,920) =10.72, p < 0.001). Figure 1 shows the mean assessments of the two politicians sorted by experimental conditions (based on Models 1 and 2 in the appendix). In condition 1, where none of the politicians used numbers, the two politicians are regarded as essentially similar in competence, with mean scores of 0.56 and 0.55, respectively. In condition 2, where the “pro” politician used numbers, this politician have a mean assessment of 0.61, while the “con” politician have a mean assessment of just 0.51. Here, the difference in assessments became significantly larger than in the baseline condition (p = 0.002, based on Model 3). In condition 3, where the “con” politician used numbers, this pattern was reversed, as expected, and the “con” politician have a higher mean assessment (0.60) than the “pro” politician (0.55). Again, the relative assessment is significantly different from the baseline in condition 1 (p = 0.017).
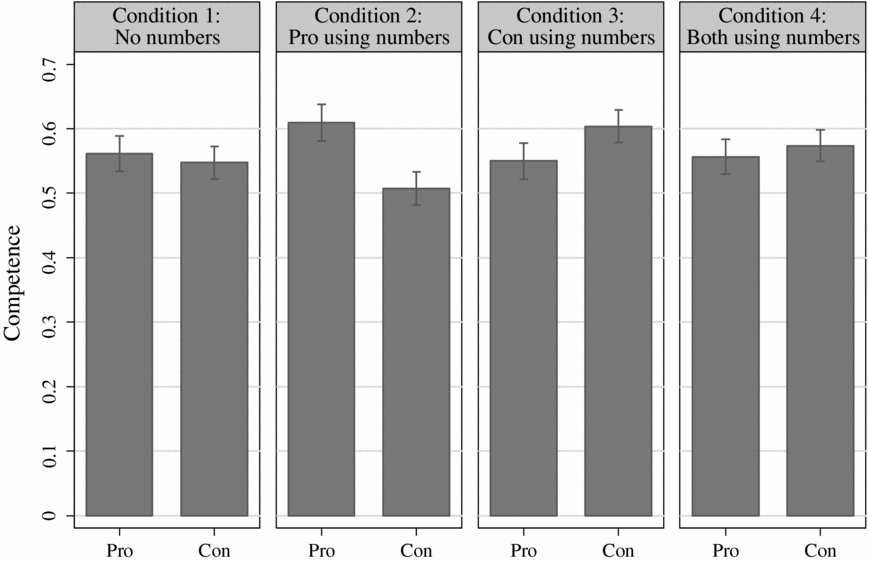
Figure 1 Mean Assessments of the Two Politicians’ Competence, Contingent on Experimental Conditions (with 95% CIs). Based on Models 1 and 2 in the Appendix
Finally, in condition 4, where both politicians use numbers, we see results similar to the results in condition 1. The two politicians are rated equally, at the same level as in condition 1. While it may seem surprising that the assessment of competence of the two politicians is not higher than in the baseline condition, the result in condition 4 likely reflect that people tend to rate other people in a comparative rather than an absolute manner (Goffin and Olson, Reference Goffin and Olson2011). A reasonable conclusion could therefore be that the use of numerical rhetoric increases a politician's relative competence, regardless of whether the opposing politician uses numbers or not. A comparison between conditions 2 and 4 confirms that the “con” politician significantly decreased the difference by using numbers when the “pro” politician was also using numbers (p < 0.001). A comparison between conditions 3 and 4 shows the same pattern, although the effect was not significant (p = 0.20). Nevertheless, in three out of the four comparisons conducted, the effect of using numbers has a clearly significant effect on the relative competence of the politicians, which suggests that the use of such numerical rhetoric may be an efficacious way of improving the electorate's perceptions of a politician.
The effect sizes may seem at first sight to be relatively limited, but it is important to note that the variance of the measure of perceived competence is relatively low. As a result, these ostensibly small differences are of some consequence: For example, when the “pro” candidate uses numbers (in condition 2), this politician is regarded as being more competent than the “con” candidate by 45% of respondents (95% CI[39, 52]). However, when the “pro” candidate does not use numbers and the “con” candidate does (condition 3), the share of respondents judging the “pro” candidate to be more competent than the “con” candidate drops to just 28 % (95% CI[23, 35]).
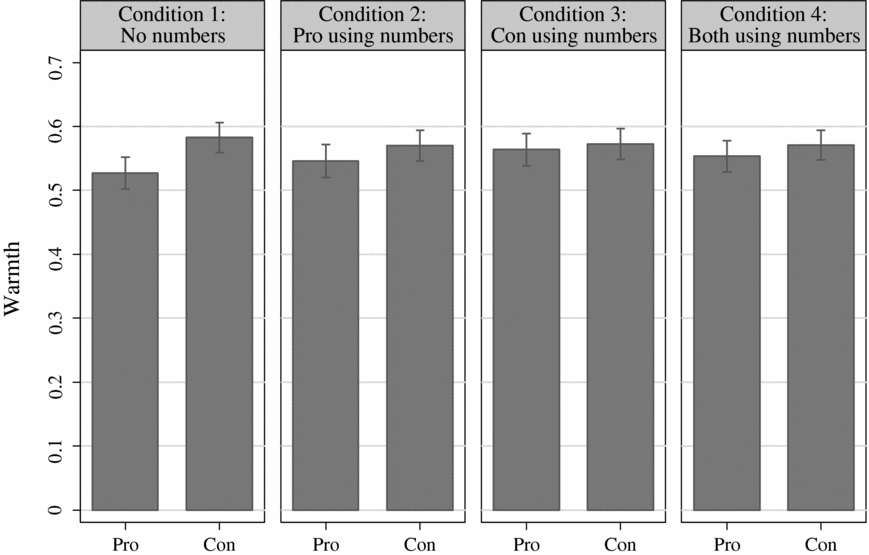
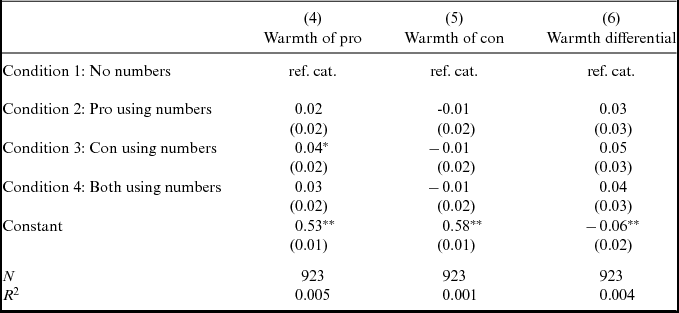
As a next step in the analysis, we ask if the positive effect on perceptions of competence is accompanied by an effect on perceptions regarding the politicians’ warmth. The results of an ANOVA-test indicate that this is not the case, as the experimental treatment has an insignificant effect overall on the differences of perceptions of warmth F(3,920) = 1.27, p = 0.28). Even if we disregard the insignificance of this omnibus test and look at the individual conditions in Figure 2, the result stands: the differences in the assessments of warmth do not differ significantly between any of the four conditions (all p > 0.05 based on Model 6 in the appendix).
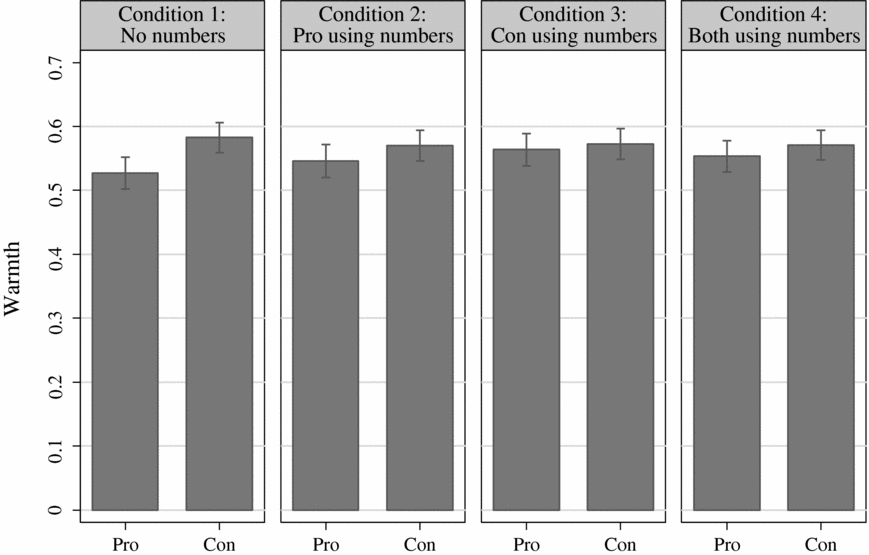
Figure 2 Mean Assessments of the Two Politicians’ Warmth, Contingent on the Experimental Condition (with 95% CIs). Based on Models 4 and 5 in the Appendix
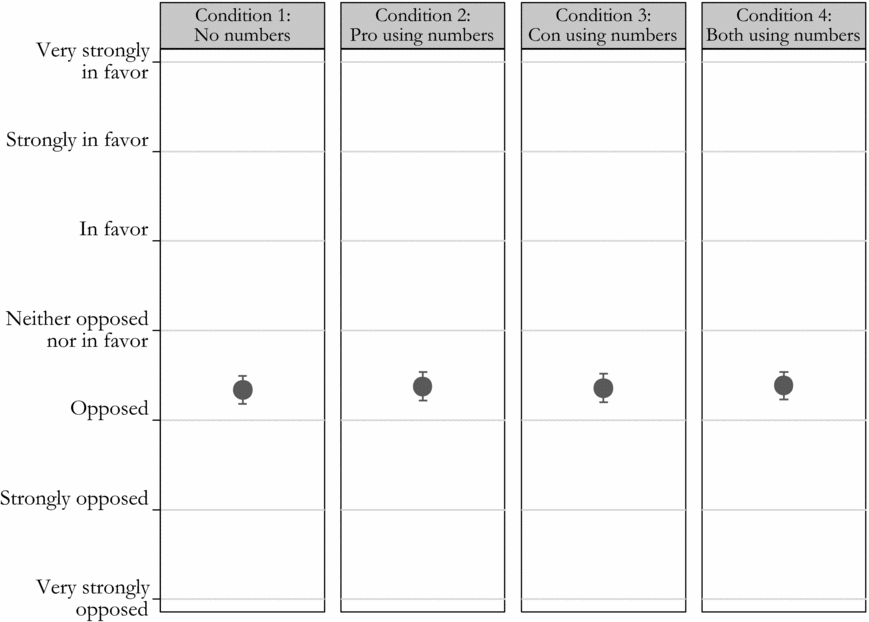
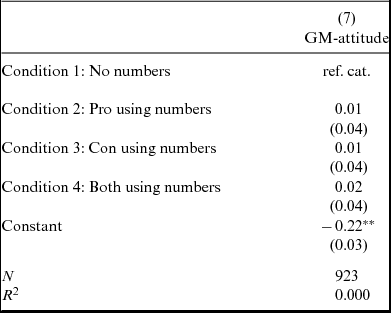
Effects on GM-attitudes: The results of an ANOVA test clearly show that the experimental treatment has an insignificant effect overall on attitudes regarding GM foods (F(3,920) = 0.07, p = 0.97).Footnote 7 As illustrated in Figure 3, the attitudes were strikingly similar across experimental conditions: slightly negative in all cases.
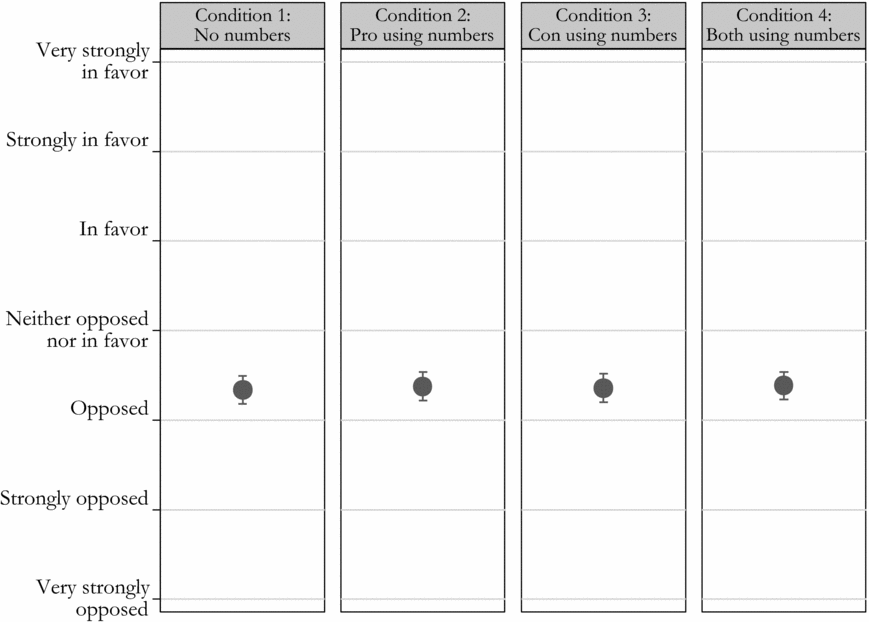
Figure 3 Mean Attitudes on GM Foods, Contingent on the Experimental Condition (with 95% CIs). Based on Model 7 in the Appendix
In this regard, therefore, the experiment aligns very well with previous studies investigating the effect of numbers on policy attitudes (Kuklinski et al., Reference Kuklinski, Quirk, Jerit, Schwieder and Rich2000; Lawrence and Sides, Reference Lawrence and Sides2014). Numbers do not seem to have strong persuasive powers in regard to changing policy attitudes. They do, however, have marked effects on the perceived competence of politicians.
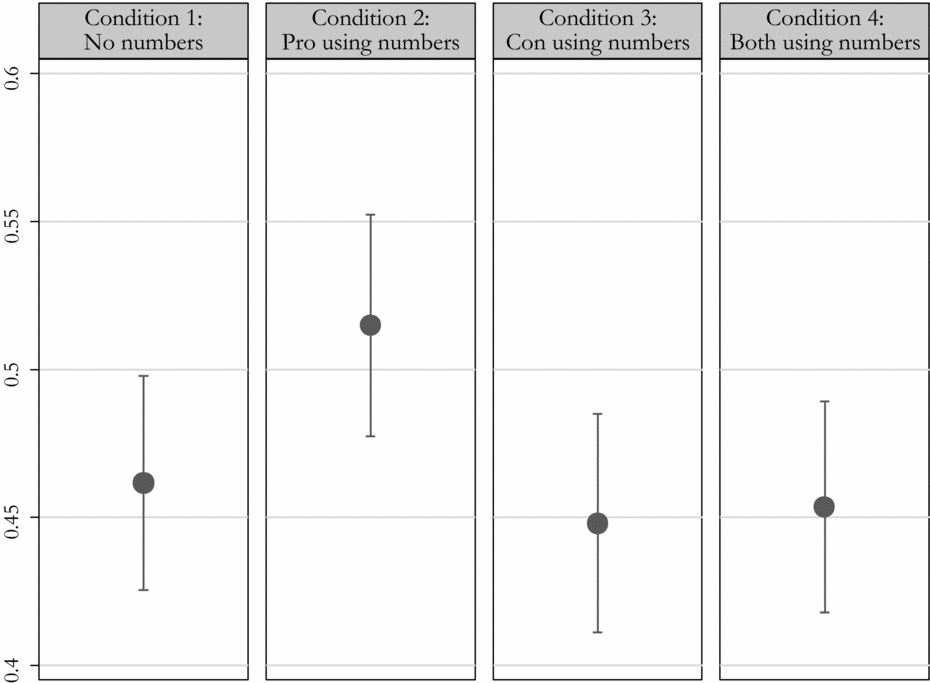
Effects on voting: Does the boost in perceived competence then translate into electoral popularity for the politician using numbers? We start by looking at the total effect. Again, an ANOVA shows significant effects of the experimental treatment on vote choice (F(3,920) = 2.63, p = 0.049).Footnote 8 As illustrated in Figure 4, the pattern across conditions is also as expected: electoral support for the “pro” politician is highest in condition 2—where this politician is the only one using numbers—and it is lowest in condition 3—where the “con” politician is the only one using numbers. However, the effect of numerical rhetoric does not seem to be symmetrical: support for pro is significantly higher in condition 2 than all other conditions (p < 0.05), whereas none of the other conditions differs significantly from each other. We will revisit the question of a potential asymmetrical effect below.
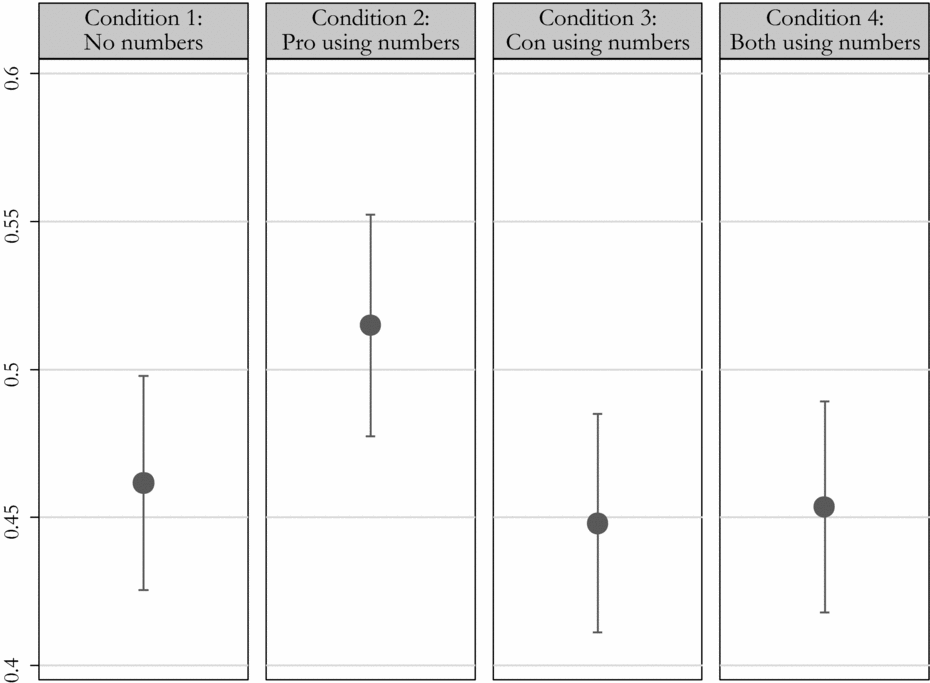
Figure 4 This Figure Illustrates Mean Electoral Support for “pro”, Contingent on the Experimental Condition (with 95% CIs). Based on Model 8 in the Appendix
To investigate whether this effect of numerical rhetoric on vote choice is in fact mediated by perceived competence, the final step in the analysis is to conduct a mediation analyses. It is important to note that, even in experimental studies such as this, the randomization of the treatment variable cannot remove the possibility of a confounding variable affecting both the mediator and the outcome variable. Hence, mediation analyses rest on the strong assumption of “sequential ignorability” (Imai et al., Reference Imai, Keele, Tingley and Yamamoto2011; Keele, Reference Keele2015). To address this challenge, the analysis therefore uses the approach developed by Imai et al. (Reference Imai, Keele and Tingley2010a, Reference Imai, Keele, Tingley and Yamamoto2010b; Tingley et al., Reference Tingley, Yamamoto, Hirose, Keele and Imai2014). In this approach, one first estimates the mediation effect and then estimates how robust this estimate of the mediation effect is to violations of sequential ignorability.
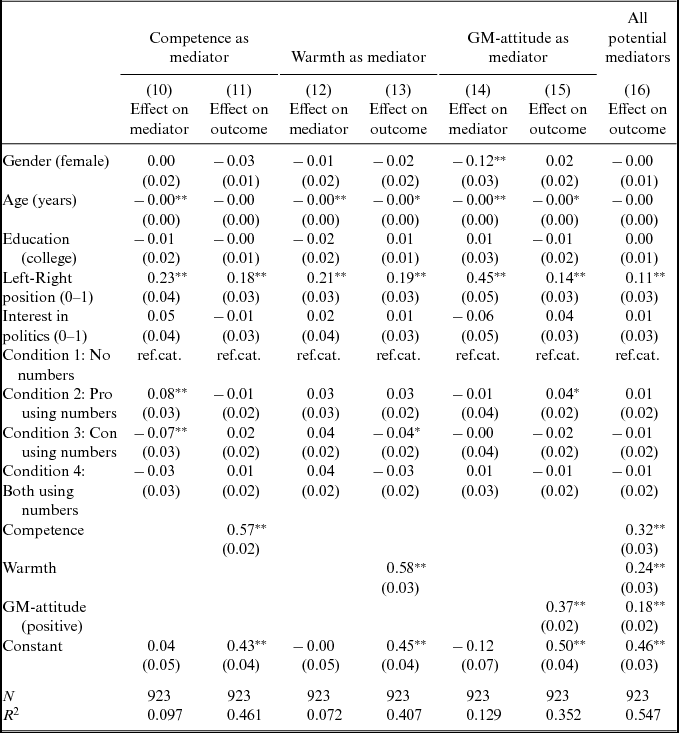
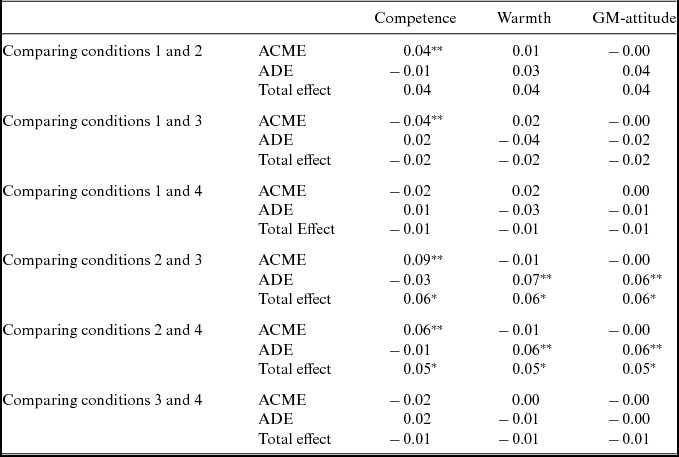
We start the mediation analysis with a comparison of conditions 2 and 3, i.e. the two conditions where either pro or con uses numbers. An estimation based on models 10 and 11 shows that perceived competence is indeed a mediator. The average causal mediation effect (ACME) of perceived competence is 0.09 points on the 0–1 range scale of vote intention. This effect is highly significant (p < 0.001), whereas the average direct effect (ADE), which encompasses all other possible causal mechanisms, is negative (−0.03) and insignificant (p = 0.15). As a result, the effect mediated by competence is actually larger than the total effect, although insignificantly so, clearly indicating that perceived competence is a key mediator—possible the only mediator—connecting numerical rhetoric and vote choice.Footnote 9 An analysis for perceived warmth as a mediator, based on models 12–13 confirms that this variable is not a significant mediator, as ACME is only −0.01 points and insignificant (p = 0.45). Similarly, the estimated mediation effect of GM-attitudes (models 14–15) is just −0.002 points and clearly insignificant (p = 0.84).Footnote 10
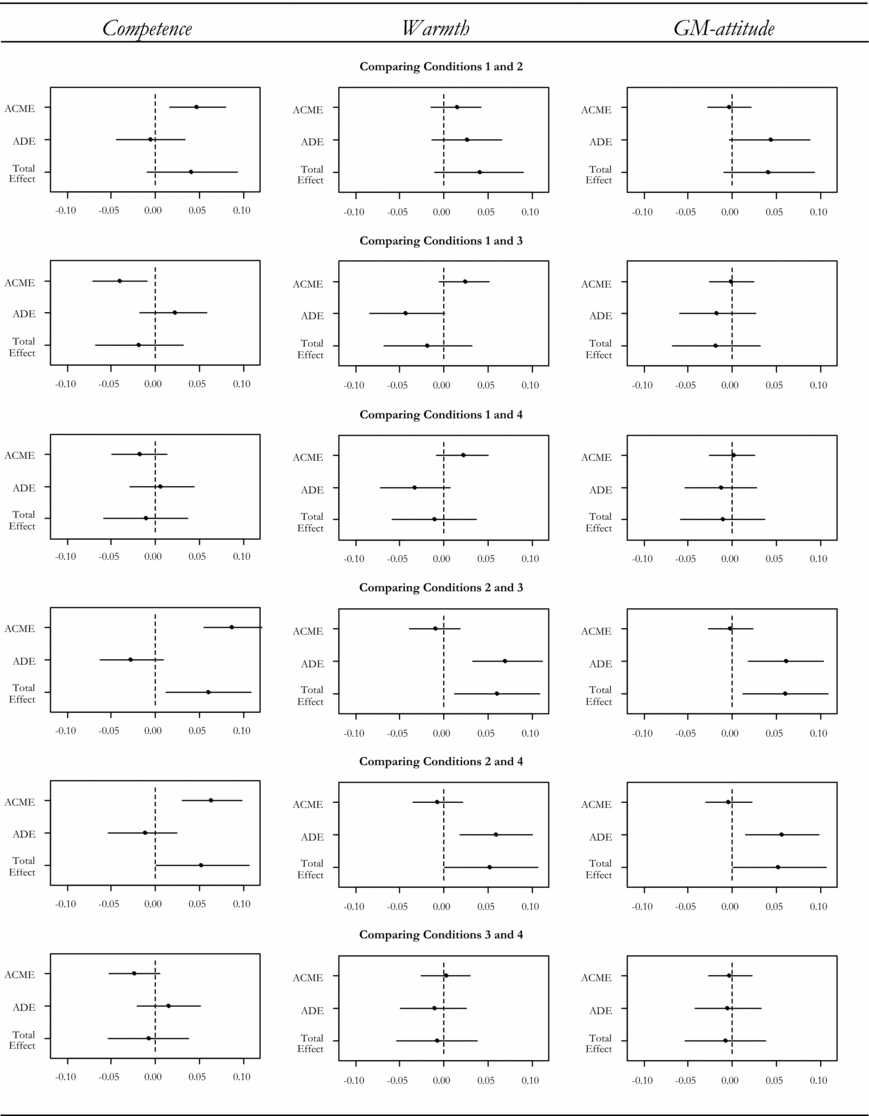
This result is generally supported by all the other comparisons of experimental conditions: the ACMEs of competence are significant in four of the five comparisons where we would expect them to be (there is no reason to expect an effect when comparing conditions 1 and 4), and ACME for warmth and GM-attitude remains insignificant in all comparisons. These additional models do not provide us with a clear answer as to why there is an asymmetrical effect on vote choice, as suggested by Figure 4. In all the relevant comparisons, the ACME of competence is insignificantly smaller for “con” than for “pro,” and the oppositely signed ADE (encompassing all other potential mediators) is insignificantly larger. Together, these small differences lead to the asymmetry. Hence, the asymmetry is not caused by differences in mediation through warmth or GM-attitudes (For full results, see Table A6 and Figure A1 in the appendix).
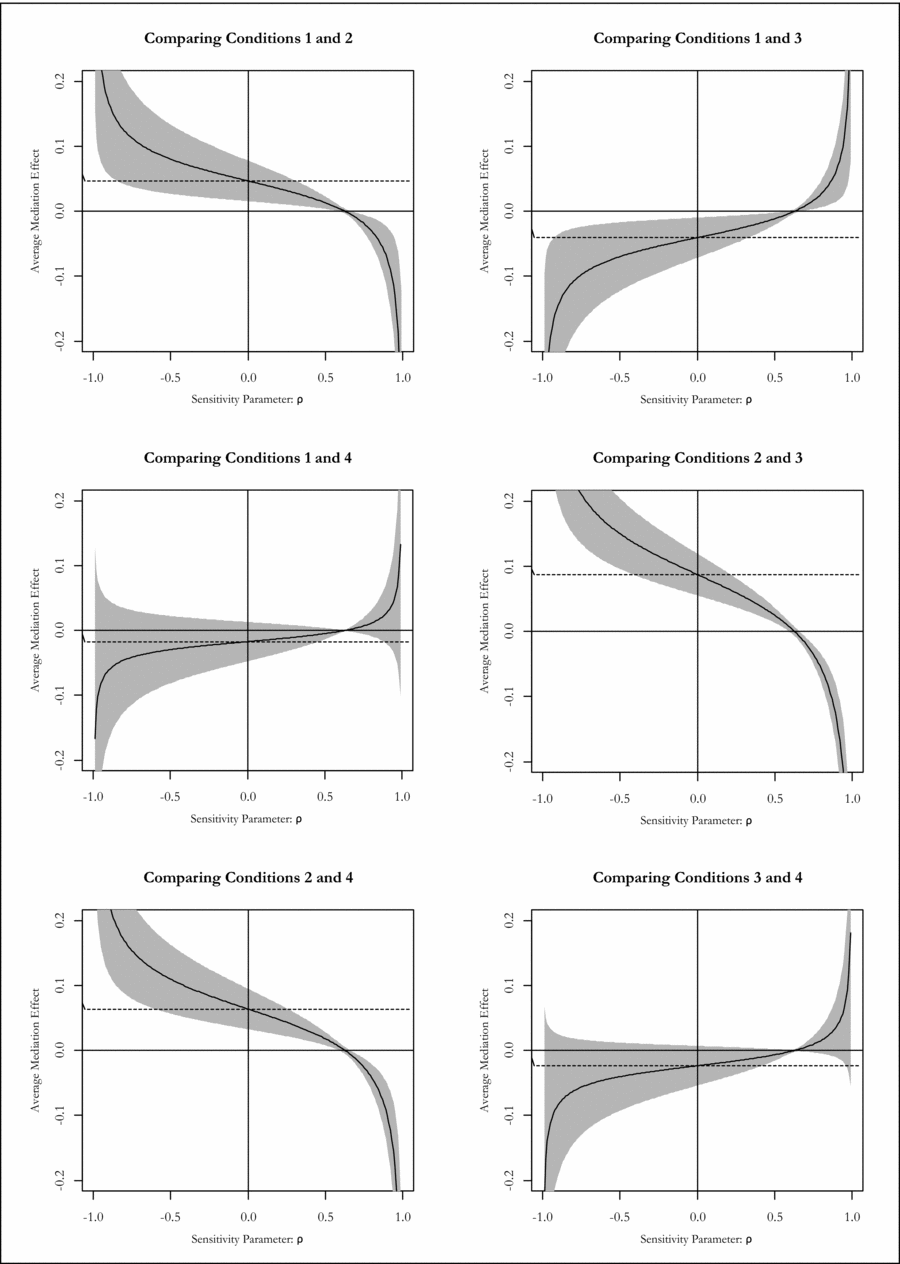
The subsequent sensitivity analysis shows that the significant mediation effect of perceived competence is highly robust to violations of the sequential ignorability assumption. For all of the comparisons in which the ACMEs are significant, they remain significant at a 95% level as long as the sensitivity parameter ρ is below 0.58 (Compare, e.g. to results in Imai and Yamamoto, Reference Imai and Yamamoto2013). For both perceived warmth and GM-attitude, ACME remains insignificant for all values of ρ (full results of sensitivity analysis in the appendix, Figure A2).Footnote 11
While warmth and GM-attitudes do not seem to mediate the effect of numerical rhetoric on vote choice, these two variables are not irrelevant for the respondents’ vote choice. First, both variables have significant impact on vote choice (as shown in model 16). The reason that they do not serve as significant mediators is simply that they are not significantly affected by the experimental treatment, which mediators, by definition, must be (Imai and Yamamoto, Reference Imai and Yamamoto2013, p. 147).
Second, the effects of numerical rhetoric could potentially also be moderated by the respondents’ GM-attitudes.Footnote 12 Specifically, one could imagine that numerical rhetoric mainly has an effect among respondents without a strong policy position on GM-foods, because strong opponents of GM-foods would uniformly regard the “con” politician as more competent and vote for this politicians regardless of rhetoric. Similarly, one would expect that strong proponents of GM-foods would have a strong tendency to consider the “pro” politician as more competent and vote for this politician regardless of rhetoric.
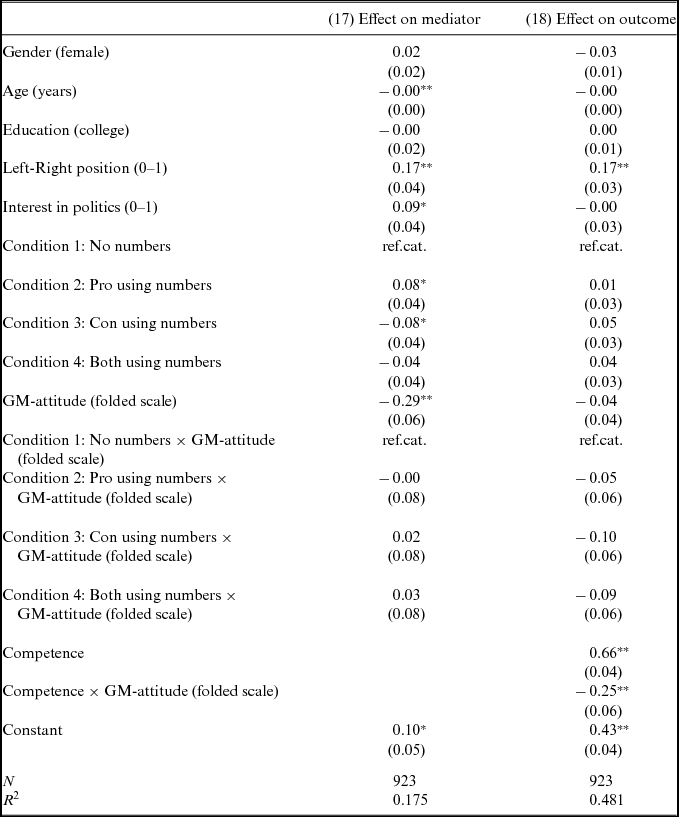
To test this potentially moderating effect of GM-attitudes, models 17 and 18 in Table A7 include the relevant interaction terms. Since one would expect the strength, rather than the valence, of the respondents’ GM-attitude to moderate the effects, the measure of GM-attitudes is folded, such that a value of zero denotes no position on the issue of GM-foods, whereas a value of one denotes a strong position (positive or negative) on the issue.Footnote 13
When analyzed separately, models 17 and 18 reveal no significant interactions between experimental conditions and GM-attitudes, neither when it comes to predicting perceived competence (model 17), nor when it comes to predicting vote choice (model 18).Footnote 14 As an additional check, we can use the two models to test for moderated mediation (Tingley et al., Reference Tingley, Yamamoto, Hirose, Keele and Imai2014), again focusing on conditions 2 and 3. The results of this analysis are, at first sight, suggestive of moderated mediation: the ACME of competence is 0.11 (p < 0.001) for respondents without a clear GM-attitude, while it is ostensibly smaller (0.06, p = 0.08) for respondents with a strong attitude. However, this difference in effect sizes is insignificant (p = 0.15), and when estimating the total effect (ACME + ADE), respondents with a strong attitude are affected to essentially the same degree as respondents without a strong GM-attitude (the total effect is 0.06 points in both cases). Together these results suggest that the numbers-as-competence heuristic is not necessarily just a heuristic used by voters without a clear policy position on which to base their vote choice.
Recall of number use: One final concern might be that the effects found in this experiment are contingent on a level of attention not usually given to political communication by the ordinary voter. However, when asked at the end of the survey whether just the “pro” politician, just the “con” politician, both the politicians, or none of them had used numbers, just 62% of respondents gave the correct answer (95% CI[59, 65]). Furthermore, when respondents in Conditions 2–4, where one or both of the politicians had used numbers, were asked about the specific number for the increase or decrease in the use of pesticides, only 47% (95% CI[43, 51]) of the respondents successfully chose the right answer among six alternatives. In other words, the respondents in this experiment were showing a level of inattention and sloppiness that may be comparable to the level found among the general electorate.
CONCLUSION AND DISCUSSION
The experiment reported in this manuscript is a clear example of how the use of numbers by political actors may increase their perceived competence and thereby their electoral success. Future studies may want to investigate the degree to which this effect is generalizable across policy issues. The issue of genetically modified foods may lend itself more easily to numerical rhetoric than other issues, although it is difficult to imagine policy issues completely devoid of potentially relevant numbers. Future studies may also want to investigate the degree to which the effects depend on the numerical formats themselves. People tend, for example, to see precise numbers as more informed and credible than round numbers (Zhang and Schwarz, Reference Zhang and Schwarz2013), and politicians may use—sometimes exceedingly—precise numbers in order to further boost their perceived competence.
As with other voter heuristics, the pressing question is whether this heuristic somehow helps voters arrive at a more informed, or in other ways qualitatively better, decision, or whether the heuristic misleads the voters (Bartels, Reference Bartels1996; Lau and Redlawsk, Reference Lau and Redlawsk2001). Clearly, the fact that so many subjects in this experiment were unable to recall the numbers used—or even which politician used the numbers—may indicate that numerical rhetoric does not result in voters who are substantially more informed on policy issues. The results here also align well with many previous studies that show that people are, in general, fairly ignorant about policy-relevant numbers (Herda, Reference Herda2010; Kuklinski et al., Reference Kuklinski, Quirk, Jerit, Schwieder and Rich2000; Lawrence and Sides, Reference Lawrence and Sides2014; Nadeau et al., Reference Nadeau, Niemi and Levine1993; Sigelman and Niemi, Reference Sigelman and Niemi2001; Wong, Reference Wong2007). Conversely, one could argue that heuristics are useful exactly because they do not require much information and that politicians’ numerical rhetoric may in fact be a democratically valuable heuristic. The successful use of numerical rhetoric by a politician does arguably require at least some level of knowledge about a given policy issue, as they are very likely to be called out on any wrong numbers. As a result, using numbers might help the electorate choose politicians that are indeed more competent.
Regardless of whether the numbers-as-competence heuristic allows “low information rationality” (Popkin, Reference Popkin1991) at the level of the voter, numerical rhetoric does seem to be a rational strategy at the level of the political candidate. Candidates’ numbers may not move our policy attitudes, but they will make us perceive them as more competent.
APPENDIX: MODELS, TABLES, AND ADDITIONAL FIGURES
Table A1 Effects on Competence
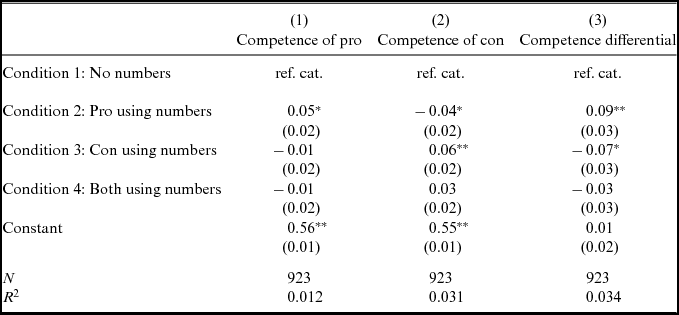
Table A2 Effects on Warmth
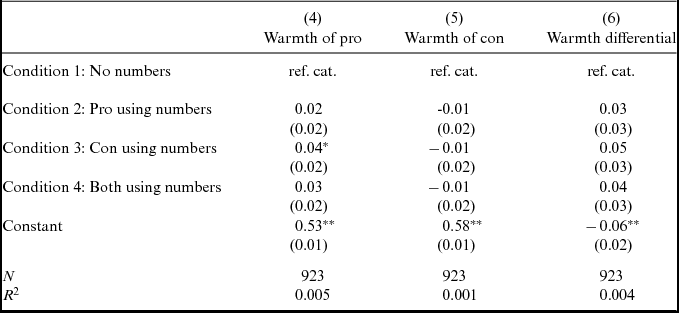
Table A3 Effects on Persuasion
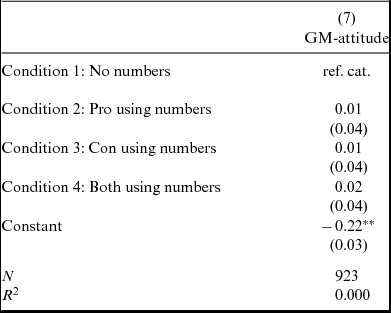
Table A4 Effects on Voting
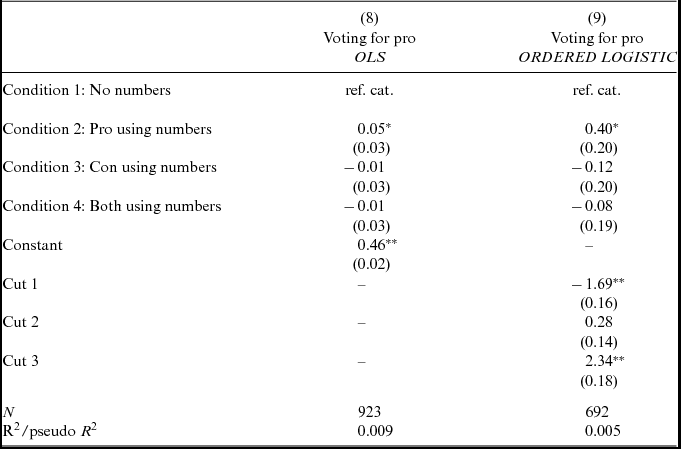
Table A5 Regressions Used for Mediation Analyses
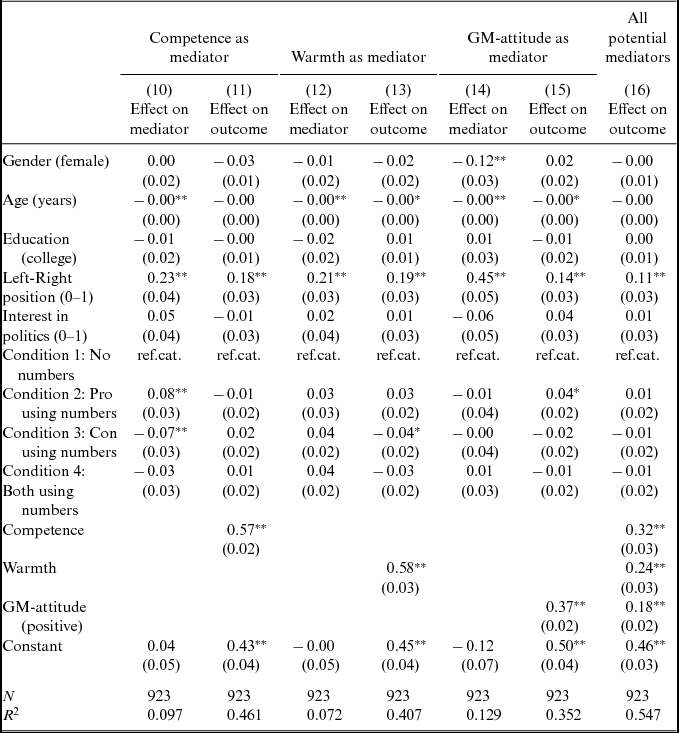
Table A6 Mediation by Competence, Warmth, and GM-Attitude
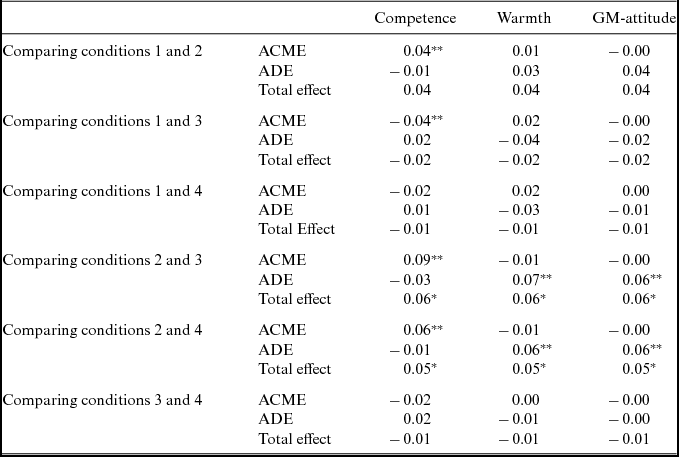
Table A7 Regressions Used for Moderation Analyses
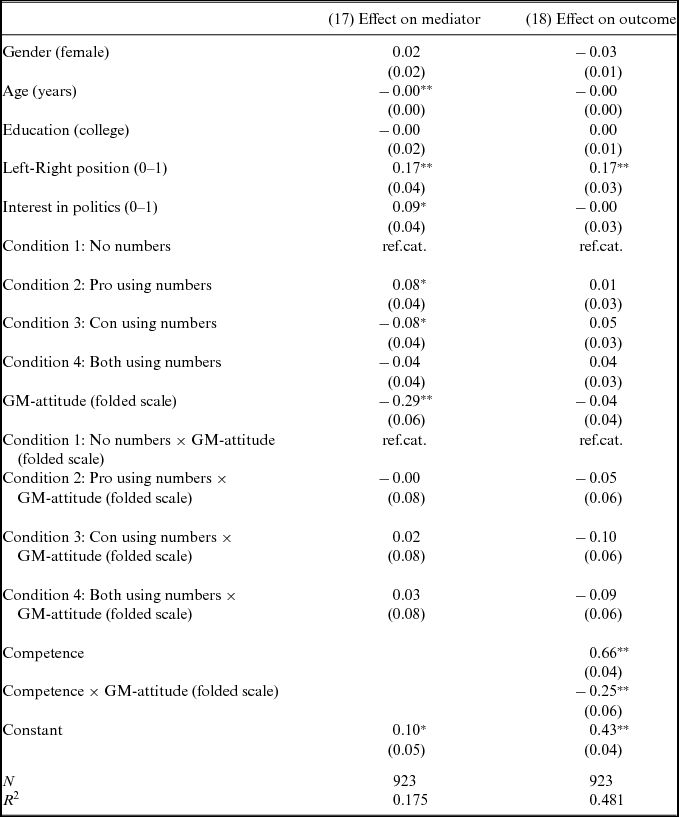
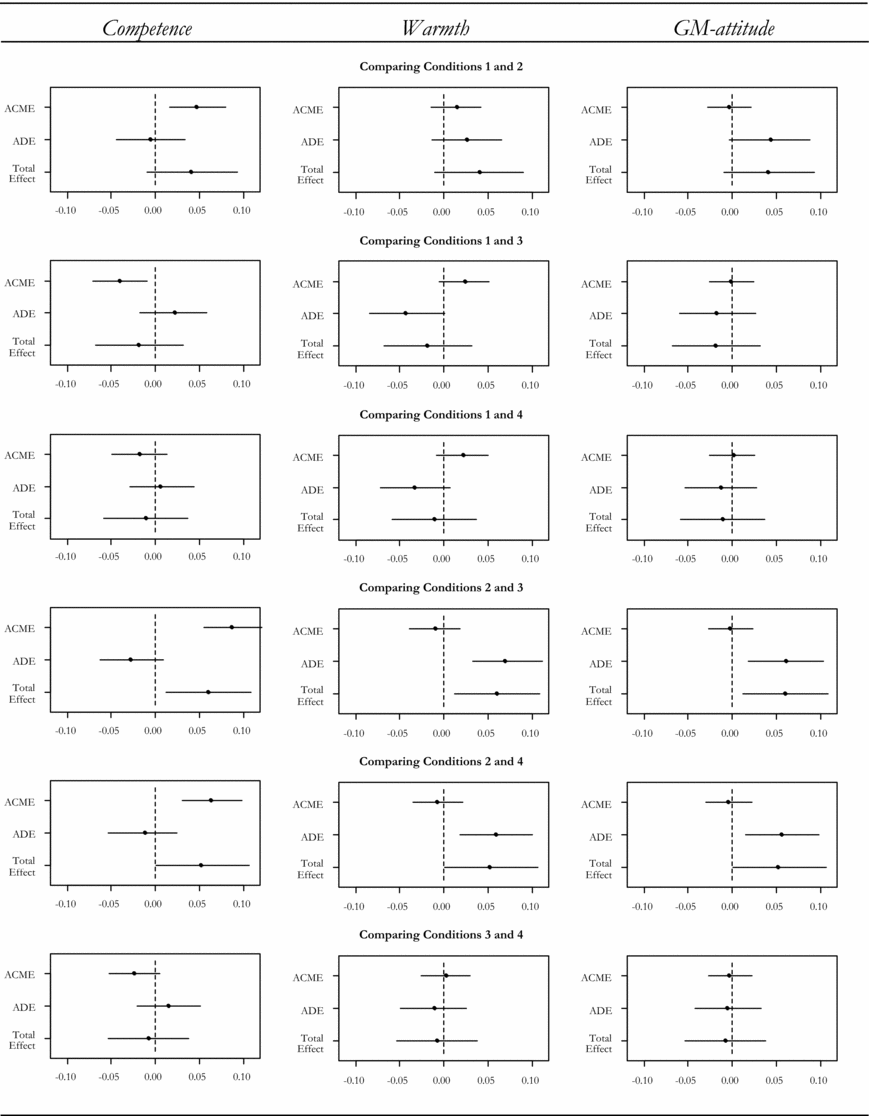
Figure A1 Estimates of ACME, ADE, and Total Effect (With 95% CIs)
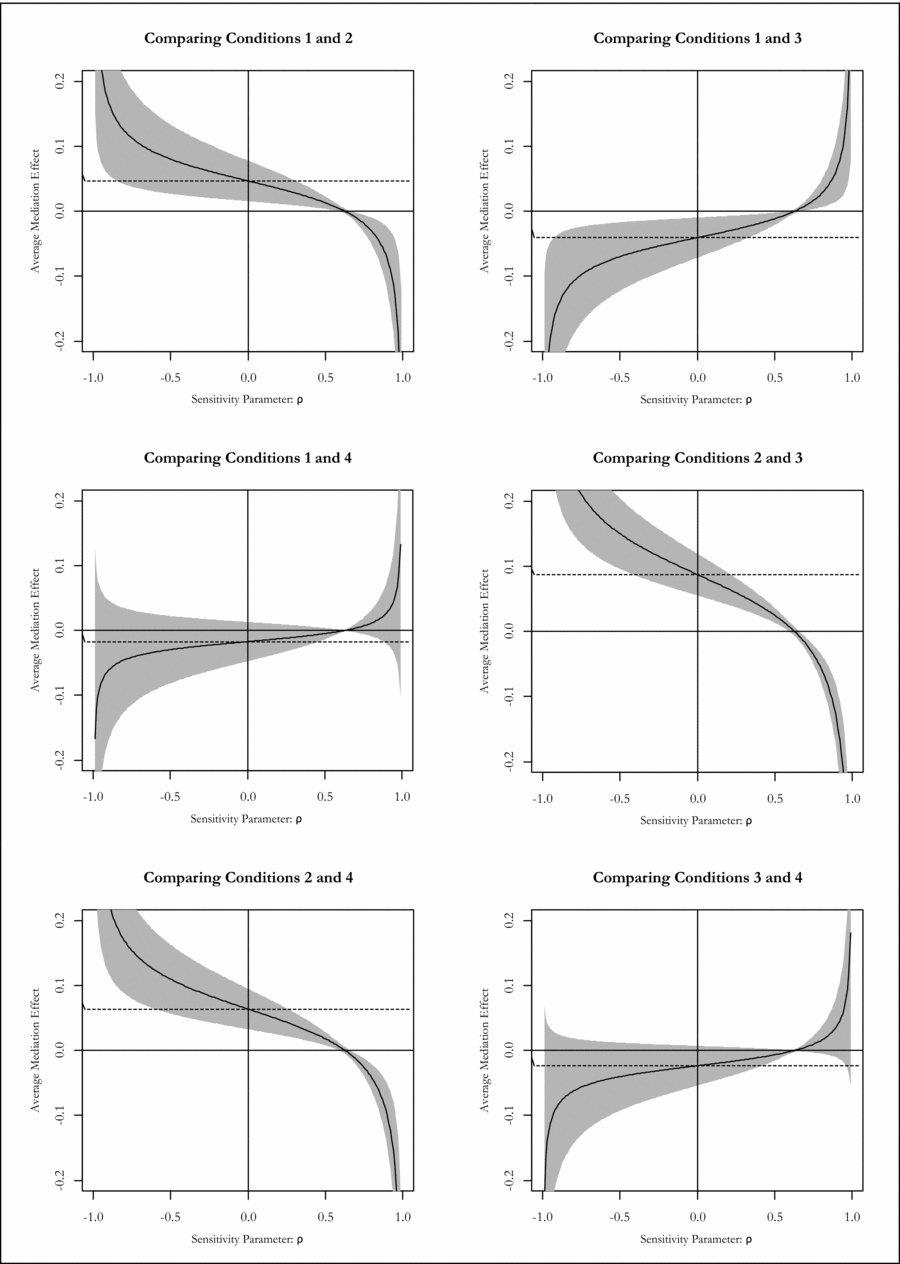
Figure A2 Sensitivity Analyses, Mediation by Competence


