


Scholars have long been interested in properly measuring and understanding individual political opinions, but only recently has research turned to perceptions about the beliefs and opinions of others, called “second-order beliefs.” This work suggests that individuals and elites systematically misperceive the beliefs and opinions of others (Ahler and Sood, Reference Ahler and Sood2018; Broockman and Skovron, Reference Broockman and Skovron2018; Hertel-Fernandez, Mildenberger, and Stokes, Reference Hertel-Fernandez, Mildenberger and Stokes2019; Levendusky and Malhotra, Reference Levendusky and Malhotra2015; Mildenberger and Tingley, Reference Mildenberger and Tingley2017). For example, Mildenberger and Tingley (Reference Mildenberger and Tingley2017) find that individuals tend to underestimate the extent that others believe climate change is a problem.
Perceptions of how other actors think about political issues or candidates can have important consequences for political behavior. These perceptions are used to process political information (Ahn, Huckfeldt, and Ryan, Reference Ahn, Huckfeldt and Ryan2014), to prepare for potential disagreement in a discussion (Carlson and Settle, n.d.), and to make decisions about whether to turn out and for whom to vote (Feddersen and Pesendorfer, Reference Feddersen and Pesendorfer1996; Huckfeldt and Sprague, Reference Huckfeldt and Sprague1995).
Research on second-order beliefs has taken a methodological approach of directly asking subjects to report beliefs about a perception of interest. Scholars have queried beliefs about the percentage of partisans that come from different demographic groups or the percentage of constituents in a legislator’s district that hold a policy opinion. Drawing inferences about bias in these second-order beliefs, however, requires care in classifying bias in beliefs versus bias induced by instrument or method. While researchers know the target quantity they aim to elicit from subjects, subjects often lack incentives to devote effort to evaluate difficult quantities, might not fully understand what the researcher asks, might misinterpret the context or information upon which they are asked to draw, or the instrument might not allow characterization of uncertainty. Moreover, recent work shows that incentives, clarification, and information can all change subject engagement with and the effectiveness of the instrument, and thus the values elicited from subjects (e.g. Hill and Huber, Reference Hill and Huber2019; Prior and Lupia, Reference Prior and Lupia2008).
Given the complexity of second-order beliefs, we propose a new research design to elicit beliefs with more nuance. Our experimental approach includes three extensions to existing measures. First, we ask participants to report beliefs as probabilities. This allows researchers to capture uncertainty in participants’ beliefs and provides more nuanced measures of bias. Second, we provide micro-incentives for accurate reports of subject beliefs to two-thirds of our subjects with the goal of reducing the impact of expressive responding or shirking. Third, our design integrates exposure to information and repeated measures of the quantity of interest. This allows researchers to examine how perceptions and bias change in response to new information. Researchers can use this feature to systematically evaluate factors that might exacerbate or mitigate biased perceptions.
To introduce the method, we focus on perceptions of vote choice in the 2016 presidential election. Footnote 1 Our subjects evaluated the reported vote choice of randomly selected respondents to the 2016 American National Election Studies (ANES). Our main substantive result is that citizens have only small biases in perceptions – less than 5 percentage points, on average – about the 2016 vote choice of others. This magnitude of bias is notably smaller than in other studies, which report bias on the order of 20 points. Most of our results indicate a level of political information or sophistication contrary to other research that suggests dramatic misperceptions. Given the importance and scholarly interest in political misperceptions, it is crucial to critically evaluate the methodology used to measure bias and second-order beliefs. We hope this design stimulates further methodological development on measurement and experiments surrounding political beliefs.
Design to elicit second-order beliefs
In this section, we provide a general overview of the approach and in the following section, we describe our application. Participants are invited to play what we present as a game in which they are asked to provide beliefs about target quantities of interest. Participants report beliefs as probabilities, which provides a measure of respondent uncertainty about their beliefs that is richer than a standard “don’t know” response option. In addition to reporting probabilistic beliefs, we also sequentially provide information to respondents so that we can observe how they revise their beliefs in response to each informational stimulus. Changes in probability provide estimates of the informational value of each stimulus.
While not a requirement for our proposed method, one benefit is that we can provide incentives for accurate reporting of beliefs. When the target quantity is something that is verifiable, we can use scoring methods to provide incentives for subjects to accurately report their probabilistic beliefs about the politics of others. We use the crossover scoring method, which is robust to risk preferences, but other scoring methods might also be applied. Footnote 2 Thus, our design adds three features to existing approaches. We elicit beliefs as probabilities, provide a method for sequential delivery of information, and provide incentives for accuracy.
Application: perceived vote choice in the 2016 election
The method is best illustrated by an example. We fielded an experiment to understand perceptions of vote choice in the 2016 presidential election. We matched subjects at random to individual respondents from the 2016 ANES. We refer to the target ANES respondent as the “other.” We elicited subjects’ probabilistic beliefs that their matched other reported voting for Hillary Clinton or Donald Trump in the postelection survey. Participants were randomly paired with four others and were asked to report the probability that each voted for Trump or Clinton five times. They first reported the probability that the other voted for Trump or Clinton without any information about him or her. Participants were then sequentially presented with four pieces of information about the other, reporting potentially revised beliefs after each piece.
We used the survey platform Lucid to recruit a nationally representative sample of 3,253 US adults. Footnote 3 We selected others from the set of ANES respondents who had both reported voting for either Clinton or Trump and had been validated to have turned out to vote in the November 2016 election (Enamorado, Fifield, and Imai, Reference Enamorado, Fifield and Imai2018). The four pieces of information presented about each ANES other were randomly selected from race, gender, income, state, party identification, and free-response report of the most important problem facing the nation. Footnote 4 Table 1 presents a summary of the inputs we used, examples, and how they were presented to subjects in our experiment. Figure 1 shows an example of what participants would see and how they reported their probabilities.
Table 1. Informational Inputs
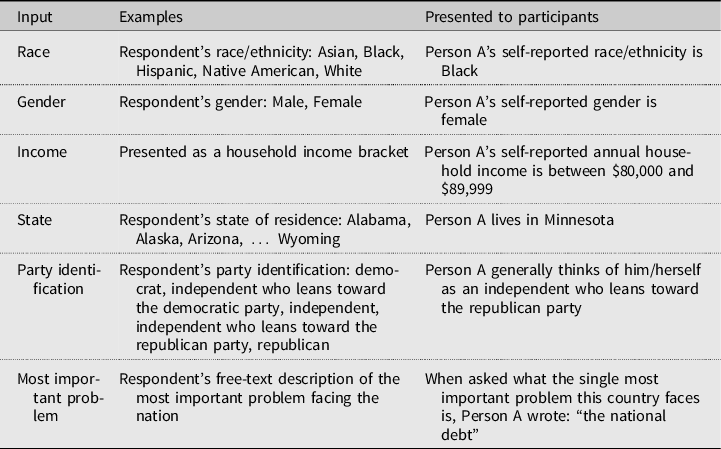

Figure 1. Example of probability elicitation.
NOTES: Taken from the example round participants saw before starting the game. Full instructions and additional examples can be found in Appendix Section H.
We incentivized participants to report beliefs with bonuses for “winning” the game. Participants could earn $0.10 for each of 20 beliefs via the crossover scoring method. The crossover scoring method asks participants to evaluate a true/false statement at what probability p they would be indifferent between being paid if and only if the statement is true or entering a lottery that pays at rate p. Footnote 5
Altogether, we elicited more than 50,000 probabilities. With this sample, we are able to average across thousands of elicitations spanning 14,312 unique combinations of characteristics. While we view the central contribution of this paper as methodological, the richness of the data allows us to explore important substantive questions about the mechanisms of bias using intersections between characteristics of our subjects and characteristics of the others.
Example analysis
We turn now to a brief analysis of the experiment to highlight the scientific benefits of the method. We describe three quantities of interest to show that elicited probabilities can be flexibly adapted to answer a host of research questions. We evaluate subject accuracy, the impact of information delivered (informativeness), and bias. Our variable of interest is subject beliefs about others as elicited in Figure 1. Footnote 6
Results: Subject accuracy
Our first results evaluate subject accuracy. We measure accuracy by comparing the subject’s probabilistic beliefs that the other voted for Trump to the observed proportion of ANES respondents who voted for Trump with the characteristics so far delivered to the subject. For example, a subject might be in the third elicitation and have learned that the other is a female from Texas.
Figure 2 presents this result, averaging across all characteristic combinations with the same rounded Trump share (x-axis), compared to the average probability given by all subjects evaluating a characteristic combination with that vote share (y-axis). Continuing the example of a female from Texas, the x-axis value would be the observed proportion of the 52 females from Texas in our ANES sample who reported voting for Trump (71.5%), and the y-axis value would be the average probability of voting for Trump elicited knowing that the person was a female from Texas. Footnote 7

Figure 2. Subjective probabilities on ANES vote share given other’s characteristics.
NOTES: Each point is the average probability elicited from subjects (y-axis) against ANES vote share given characteristics subject had observed up to that elicitation (x-axis), grouped by vote share.
Most points do not fall on the 45-degree line, which would indicate perfectly informed subjects. However, the data presents a positive linear relationship with little variability about the line. When Trump’s share in the ANES subset is near 100%, on average subjects return a probability around 70. For ANES characteristic-combinations with Trump share near 0, subjects return an average probability of about 30. In Appendix Section D, we examine how accuracy changes with the presentation of new information. We also consider additional measures of accuracy, including estimating whether the respondent’s reported probability that the other voted for Trump falls within the 95% confidence interval that an ANES respondent with the given characteristics voted for Trump. We also consider a perceived probability of greater than 50% in favor of the correct candidate for that other as an alternative definition of accuracy. The probabilities elicited in our approach allow researchers to use different measures of accuracy.
Results: Informativeness of characteristics and traits
In this section, we consider the informativeness of the information delivered to subjects. We measure informativeness by examining how far subjects’ elicited probabilities move toward the truth with the delivery of each class of information. We find that partisanship leads to the greatest increase in accuracy. Those whose prior beliefs were between 0 and 10 (very inaccurate) moved about one-third of the scale toward truth when they were informed of the other’s partisanship. Those who began with an uncertain prior around 50 became about 12 points more accurate after learning the other’s partisanship. The second most informative characteristic was the other’s report of the most important problem, followed by race. See Appendix Section E and Figure A2.
To make inferences about informativeness while accounting for floor and ceiling effects, we estimate a regression model motivated by Bayesian learning. Bayes’ rule states that posterior beliefs are a combination of prior beliefs and new information. While one can estimate a structural model of Bayesian learning with log-odds beliefs and log-likelihood ratios (see Hill, Reference Hill2017), we present here a reduced form version of a Bayesian learning model. We run an OLS regression of posterior beliefs on prior beliefs and indicators for the type of information delivered at that elicitation
 $${y_{ijt}} = \beta {y_{ijt - 1}} + \gamma X + {\varepsilon _{ijt}},$$
where y is the probability given by subject i in round j elicitation t, β is a lag coefficient on the prior belief at
 $t - 1$
, X is an i times j times t by number-of-characteristic-values design matrix indicating which characteristic value was presented to subject i in round j elicitation t, γ is a number-of-characteristic-values-length vector of coefficients of average learning for each characteristic mapped from X to y, and ε is an idiosyncratic disturbance. For example, if a subject returns a probability of Trump vote of 60 after learning the other’s gender was female in elicitation three, and the elicitation two probability was 55,
$t - 1$
, X is an i times j times t by number-of-characteristic-values design matrix indicating which characteristic value was presented to subject i in round j elicitation t, γ is a number-of-characteristic-values-length vector of coefficients of average learning for each characteristic mapped from X to y, and ε is an idiosyncratic disturbance. For example, if a subject returns a probability of Trump vote of 60 after learning the other’s gender was female in elicitation three, and the elicitation two probability was 55,
 ${y_{ijt}} = 60$
,
${y_{ijt}} = 60$
,
 ${y_{ijt - 1}} = 55$
, and the row in X for elicitation ijt would have a one in the column for gender female and zeros in all others.
Footnote 8
${y_{ijt - 1}} = 55$
, and the row in X for elicitation ijt would have a one in the column for gender female and zeros in all others.
Footnote 8
Because this regression model generates 59 informativeness coefficients, we plot the estimates in Figure 3 sorted by magnitude into 2 frames. Each point is the coefficient estimate and lines extend to 95% confidence intervals. Estimates in Figure 3 roughly break into three groups by magnitude of informativeness. At the top in the left frame are the most informative characteristic values, four values of partisanship and race Black. These five pieces of information increased accuracy on average by 25 points or more conditional on prior beliefs. The second group of values increases accuracy by 20–25 points, which include race/ethnicity Hispanic, the other’s report of the most important problem facing the country, and places of residence District of Columbia, Alabama, Kentucky, and Oregon. The remaining characteristic values increase informativeness between about 10 and 20 points. Overall, there is substantial variation in informativeness across the characteristics in this study, but subject beliefs on average move toward truth with each piece of information.

Figure 3. Estimated informativeness of each characteristic value.
NOTES: Points are OLS point estimates of the average treatment effect of information on the subjective probability of target vote correct, lines extending to 95% confidence interval.
Results: Bias and misperception
Finally, we consider bias in subject beliefs. To measure bias, we calculate the average difference in probability elicited from subjects given a profile of characteristics (e.g. female from Texas) from the actual vote rate of ANES respondents with that profile of characteristics. That is, does the average probability returned systematically over- or understate the actual vote rate for one of the two candidates?
Overall, subjects overestimated Trump’s support by an average of 2.3 and median of 0.9 percentage points. This bias is of notably lower magnitude than misperceptions of other target quantities in existing published work. One natural concern is that average bias might mask large underlying bias within relevant subgroups. First, we show that magnitude of bias does not vary by prior beliefs (see Figure A3 in Appendix F). Second, researchers focused on misperceptions of second-order beliefs have suggested at least two mechanisms for misperceptions: egocentric bias and different-trait bias.
Egocentric bias implies that subject beliefs are biased toward the candidate that the subject themselves supported. To measure the extent of egocentric bias, we tabulate average and median bias by the subjects’ 2016 vote, which we queried of all subjects. Clinton voters had an average bias of 3.5 points toward Clinton, median 1.8; Trump voters had an average bias toward Trump of 8.6, median 5.4; and Other candidate voters had an average bias of 0.25 toward Trump, 0.1 median. This evidence is consistent with egocentric bias: subject beliefs tend toward their own vote choice.
The magnitudes show that our finding of small overall bias is not simply a function of bias of magnitude similar to other studies by Clinton and Trump supporters canceling out. However, these Clinton and Trump-supporter magnitudes are larger than the average and could be consequential in some settings. For example, a bias of 8.6 points on Trump’s support of 48% is 18% off.
Different-trait bias is grounded in social identity theory and suggests individuals are likely to assume that out-group members are more homogeneous than in-group members. Bias in perception should thus increase with the number of traits on which subjects differ from the other.
The top frame of Figure 4 presents average bias toward Trump (y-axis) across elicitation numbers and the number of shared characteristics between the subject and the other (x-axis). For example, the leftmost point shows that subjects in elicitation two who did not share the single characteristic so far delivered about the other were biased toward Trump on average by around 5 points. The next point, however, shows that subjects in elicitation two who did share the characteristic were biased toward Trump by less than 1 point. Across elicitations, sharing at least one characteristic with the other led subjects to have less biased perceptions of the other’s vote choice, consistent with a different-trait mechanism.

Figure 4. Average distance between the estimate and ANES vote share by elicitation number and number of shared characteristics, and by subject 2016 vote.
NOTES: Each point is the average distance between elicited probability and actual ANES vote share given the characteristics so far delivered to the subject with error bars to 95% confidence intervals. Gray lines are each characteristic separately. Top frame by elicitation number, bottom by subject vote.

Figure 4b.
The bottom frame of Figure 4 presents average bias toward Trump (y-axis) across subject 2016 vote (Clinton, Trump, or Other, excluding those who did not vote in 2016) and the number of shared characteristics between the subject and the other (x-axis). For subjects who voted for Clinton or Trump, increasing the number of characteristics shared with the other decreases misperception; for Other voters, the relationship is notably flat. Egocentric bias for Clinton voters declines from 5 to 0 points moving from zero shared traits to two shared traits. Egocentric bias for Trump voters declines from 13 to 1 point across the same range – though appears to move toward a Clinton bias of around 4 points with three or four shared traits.
Figure 4 highlights additional scientific understanding about beliefs that our method allows. We are able to move from overall measures of bias, measured on a scientifically relevant probability scale, to evaluate theoretical mechanisms of bias. We find that bias is greater when the other differs from the subject and that beliefs lean toward subjects’ own actions.
Discussion
We have presented a new method to measure beliefs about the politics of others and applied this method to understand beliefs about the 2016 American presidential vote. Our results suggest that beliefs are (1) responsive to information about others, (2) biased to a small degree, and (3) made somewhat more accurate when the subject and the other share characteristics. We find magnitudes of misperception smaller than those found in existing studies on misperceptions about attitudes or group attachments. We find that bias decreased with knowledge of the characteristics of others and that subject perception of vote probability were within 3 points of true vote share, on average.
Our measurement strategy might be applied to address many questions of second-order political beliefs. For example, political discussion scholars have long been interested in the accuracy of beliefs about discussion partner views. Eveland et al. (Reference Eveland, Song, Hutchens and Levitan2019) suggest that the way in which we measure accuracy might conflate inaccuracy with uncertainty. Our approach could be extended to ask subjects to report beliefs about policy preferences, vote choices, or partisanship about those in their social network. This continuous measure would allow for more concrete estimates of uncertainty to help distinguish inaccuracy from uncertainty. Research on misperceptions might use our approach to allow for more nuanced measurement of beliefs and uncertainty than directly asking subjects to report the quantity of interest.
We believe that our design is flexible to meet researchers’ unique questions. In addition to the political discussion network example above, our approach could be used to answer questions about second-order political actions. Researchers interested in social influence on turning out to vote might consider measuring how individuals perceive the probability that another person will turn out to vote. Researchers could use voter file data to generate the observed turnout rates for characteristic combinations and ask survey respondents to guess the probability that an individual with given characteristics turned out to vote. Future research could also consider the ways in which electoral contexts shape the accuracy of second-order beliefs about vote choice. For example, we might expect accuracy to vary over time or political system as social sorting into political parties varies. If our study were replicated in an electoral context in which vote choice was less strongly related to partisan identity and there was more demographic heterogeneity within the parties, we might expect second-order perceptions of vote choice to be noisier and less accurate.
Despite the potential benefits of this design for several research questions, the design requires choices considering budget, respondent fatigue, and research ethics. We chose to provide four pieces of information – out of six total options – about each ANES other. While the informational characteristics we chose to present are theoretically important, investigating only six characteristics limits our ability to make global statements about bias or informativeness. Footnote 9 Moreover, our design assumes that participants have some intuitive understanding of probability. While our approach of making inferences about one person at a time might be less cognitively taxing than estimating population proportions, it could still be dependent on numeracy. Using a standard measure of numeracy, Footnote 10 we found that numeracy did not significantly alter our results. Figure A5 (in Appendix G) also shows that our respondents provided more guesses expressing uncertainty (probabilities around 50) than would otherwise be merited based on the observed rates of Trump voting given characteristics in the ANES data. However, the probabilities elicited in our study otherwise map onto the observed probabilities.
As with any experimental method, there are external validity concerns that researchers should consider. For example, offering incentives for accuracy might not necessarily map on to real-world inferences, especially if individuals are motivated by directional incentives rather than accuracy. One-third of our respondents were randomly assigned to receive a flat rate bonus at the end of the game, regardless of their performance in each round. We show in Table A1 (in Appendix G) that our results are substantively similar for respondents who did and did not receive incentives for accuracy, although those without payments learn with smaller magnitude.
We conclude by noting that political beliefs and perceptions are difficult to evaluate. Subjects in research studies are often asked to respond to questions phrased in ways they might or might not understand on topics they might have rarely – if ever – considered. Classifying magnitudes of accuracy or bias in responses to such queries is challenging because of responses proxy, rather than reveal, underlying beliefs. Whether these proxies allow for comparison to external benchmarks requires careful consideration. We hope our study motivates new efforts to measure political beliefs.
Supplementary material
To view supplementary material for this article, please visit https://doi.org/10.1017/XPS.2021.2.


