

It is hard to imagine any narrative of the development of western Europe—what Ralph Davis (Reference Davis1972) termed “The Rise of the Atlantic Economies”—where shipping is not central, from the Voyages of Discovery, through the trade in tobacco, sugar, and slaves, to the fact that every ounce of cotton spun in Manchester was imported, and much of its end product subsequently exported. In the 1780s, Britain had roughly 50,000 merchant seamen and one million tons of shipping, and by 1831, these had risen to 130,000 men and 2.5 million tons.Footnote 1 However, alongside its political and economic importance, sailing was a hazardous activity. During the 1780s, for example, about 5 percent of British ships leaving in summer for the United States never returned, and for longer voyages, casualties were even higher.
Going back to the work of North (Reference North1968) and Harley (Reference Harley1988), the consensus among economic historians has been that shipping technology was largely stagnant before the appearance of iron steamships in the mid-nineteenth century.Footnote 2 In this paper, we show, instead, that between the 1780s and 1820s, a revolution in safety took place at sea that saw a halving of losses on oceanic routes, with smaller safety improvements on European routes.
The paper is composed of two parts. First, we calculate the loss rates of shipping during peacetime periods on various routes at different times between the 1730s and 1830s, both directly from recorded casualties and indirectly from the premiums charged to insure voyages. We collect peacetime insurance rates for summer sailings for the 1730s, 1760s, 1780s, 1820s, and 1840s. For ship losses, we construct loss rates on each route for the mid-1780s and mid-1820s.Footnote 3 What we discover is that the insurance and loss series are, in most cases, both internally consistent and consistent with each other. On each sailing route, with a few easily explained exceptions, changes in insurance rates and loss rates track each other closely. The key result is that losses and premiums almost halve between the 1780s and the 1820s.
Driving this safety revolution were a broad range of gradual improvements both in the seaworthiness of ships and in their navigation, which we survey in the second part of the paper. Looking at seaworthiness, the central advance stemmed from the growing availability of cheap, high-quality metals. The diffusion of copper sheathing from the 1780s preserved the structural integrity of hulls by protecting them against shipworm. The increased supply of wrought iron allowed the flimsy wooden brackets used to hold ships together to be increasingly replaced by iron fastenings, making for sturdier ships less prone to leak or disintegrate in heavy seas.
As for navigation, the popular perception (shared even by Landes Reference Landes1983, pp. 145–57) that the decisive breakthrough came with the determination of longitude with chronometers is simply wrong. Chronometers remained too expensive and unreliable to be adopted on ordinary merchant ships before the 1840s. The important changes, instead, were greatly improved charts, the growing availability of affordable manuals teaching basic navigational techniques, and improved navigational aids such as lighthouses and channel markings.
The paradigmatic example of technological innovation is the East India Company (EIC), which had the incentives and financial resources to pioneer improvements in shipbuilding and navigation. In the 1780s, despite the far longer and more hazardous voyages it undertook, its loss rates were no higher than on the route to the United States, and by the 1820s, its losses were similar to those on vessels going to the Mediterranean.
In terms of the existing literature, the evolution of British insurance rates during the Industrial Revolution has received little attention outside the work of Leonard (Reference Leonard2012, Reference Leonard2013, Reference Leonard2014, Reference Leonard2016) and the recent study of the slave trade by Pearson and Richardson (2019). The revolution in maritime safety between 1780 and 1830 appears to have gone unnoticed.
The rest of the paper is organized as follows. First, we analyze the changes in insurance rates that occurred during the Industrial Revolution. Then, we take data from Lloyd’s List to show how their evolution tracks falls in loss rates on corresponding shipping routes. The following sections describe the advances in shipbuilding and navigation that underlie this safety revolution. The final section ties our findings of rapid technological advance in ocean shipping to the wider literature on the Industrial Revolution.
MARINE INSURANCE RATESS
The routine hazards of shipping prompted risk sharing mechanisms that by the mid-fourteenth century had evolved into more or less their modern form of brokers providing cover for a premium set at a percentage of the amount insured.Footnote 4 In London, a sophisticated marine insurance industry developed during the seventeenth and eighteenth centuries. From 1720, two large chartered companies, Royal Exchange Assurance and London Assurance, which between them accounted for about 10 percent of business, coexisted with the hundreds of individual underwriters working at Lloyd’s coffee house and other locations. In the eighteenth century, two publishing enterprises grew up to serve this industry. Lloyd’s Register met the need for reliable information on ship characteristics, masters, and owners by producing annual lists of vessels susceptible to be insured; and Lloyd’s List, a newspaper published twice weekly, disseminated information on ship movements and incidents at sea.
Besides the destination of the voyage, the time of year, the deductible charged, and whether peace or war prevailed, insurance rates reflected many other considerations such as the type of vessel, its cargo, and the reputation of the owner and master. It is, therefore, not surprising that surviving insurance rates for individual voyages to the same destination can vary substantially.
We have insurance rates for specific destinations that will represent the regions for which we subsequently present loss rates. There are different ways to show the importance of these regions in British foreign trade, shipping, and insurance. One would be to look at the number of arrivals in British ports annually from each region, and this would show large numbers of ships coming from the Netherlands and northern France and very few from India and China. Yet, ships on longer voyages were at risk for much longer periods, from four to six months in the Asian trade. Table 1 shows the results for the mid-1780s and mid-1820s of multiplying regional arrivals by rough estimates of the average nautical distance to each region in order to calculate total nautical miles at risk. This measure highlights the importance of the West Indies in British shipping, followed by the Baltic, Iberia and southwest France, and the United States. The most striking changes over the period are the rise of the Canadian timber trade and the expansion of shipping to Asia. As concerns insurance, voyage distance likely overstates the risks faced by ships since the greatest dangers lay when leaving and approaching land.
Table 1 UNITED KINGDOM SHIPPING BY REGION Million Nautical Miles

Notes: The entries are the average number of ships arriving annually in British ports from each region multiplied by the average distance to a representative destination in the region.
Sources: Arrivals: 1784–1786: Statements of Navigation and Trade, National Archives, CUST 17/8-9; 1824–1826: British Parliamentary Papers, Tables of the Revenue. Nautical distances: https://sea-distances.org; representative destinations: Kingston, Jamaica; Gdansk; Oporto; New York; Halifax; Groningen; Malta; and Calcutta.
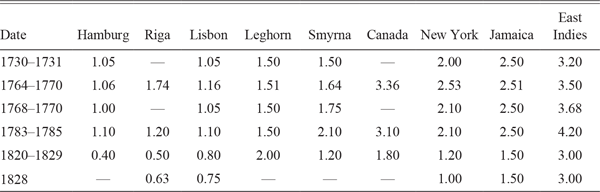
Our analysis of insurance rates for peacetime periods from the 1730s to the 1820s is based on a variety of sources.Footnote 5 For 1730–1731 and 1768–1770, our rates are taken from John (Reference John1958, Table 2), using the outward rate charged by the London Assurance Company. For the case of the East Indies, we use half the round-trip rate posted. In 1763–1770, the rates are based on 1,368 individual contracts from the risk book of merchant-insurer William Braund.Footnote 6 In later years, our rates are based mainly on quotations for premiums at Lloyd’s that were published in price currents and newspapers. For 1783–1785, we rely on Prince’s Price Current; and for 1820–1829, on the London New Price Current. The premiums are the median midmonth quotations for voyages from London between May and September, the period during which most journeys took place. Finally, for 1828–1830, we have the summer rates at Lloyd’s of London from Wright and Fayle (1928, pp. 319–20).Footnote 7
These insurance rates are shown in Table 2 and Figure 1. It can be seen immediately that the rates up to the 1780s on different routes are, with a few exceptions, fairly stable, as are those for the 1820s. In-between there occurred a notable fall, during which insurance rates were almost halved on most routes. The consistency of rates across routes suggests that the numbers are broadly reliable, something that we confirm below by comparing them with actual loss rates on these routes.

Table 2 INSURANCE PREMIUM BY ROUTE, 1730–1829 Percent of Value Insured

Sources: 1730–1731, 1768–1770: London Assurance Company (John Reference John1958, Table 3). 1764–1770: William Braund’s Journal of Risks (Essex County Record Office, D/DRu B7, courtesy of Adrian Leonard). 1783–1785: Prince’s Price Current. 1821–1829: London New Price Current. 1828: Wright and Fayle History of Lloyd’s (1928, pp. 319–20).
The most notable exceptions to the general pattern in Figure 1 concern the Mediterranean, but as Table 1 shows, this was a relatively thin market. We do not graph the East Asia rates because their stability is misleading. In the eighteenth century, they refer to the ships of the EIC, but by the 1820s, the vast majority of ships sailing to India were smaller, less-sturdy vessels belonging to individual shipowners (Solar Reference Solar2013). It is also worth noting that, although the Baltic is one of the most important routes (Table 1), in many cases, the premium is not reported in the sources, for reasons we do not understand.
We may further gauge the reliability of our insurance data by comparing them with rates quoted in other European markets. As for their levels in the eighteenth century, the London rates are very close to those quoted at Amsterdam from 1766 to 1780 (Spooner Reference Spooner1983): 1–1.5 percent on northern routes, 2 percent on Mediterranean ones, and 2.5–4 percent on the only oceanic routes listed, to Curacao and Surinam. As for the trends, the rates quoted by Hamburg insurers on European routes from the 1730s to the 1850s show similar movements to those in London (Denzel Reference Denzel and Nigro2017).Footnote 8 The Hamburg rates remain fairly constant, outside wartime, during the eighteenth century, though they are notably higher than London rates, possibly reflecting a thinner market with a shallower capital base and fewer opportunities for risk sharing.Footnote 9 The rate from Hamburg to London hovered around 1.5 percent, compared with the London rate of 1 percent. The average peacetime rate across various destinations varied between 2.5 and 3 percent. After the wars, Hamburg rates were lower and trending downward. The London rate had fallen to 1 percent by the early 1820s and dipped below that by the early 1830s. The average rate fell to about 2 percent in the 1820s and reached 1.5 percent by the early 1840s. The reductions in rates on European routes from the 1780s to the 1820s in the Hamburg insurance market are, thus, comparable to what we find for the London market.
Institutional Changes
Marine insurance rates may have fallen for several reasons other than improving maritime safety.Footnote 10 One possibility would be innovations in underwriting. Leonard (Reference Leonard2014, ch. 5) argues, however, that by the 1780s the institutions of the modern British marine insurance industry were already in place. Underwriters had left the coffee houses for purpose-built premises and had established rules for self-regulation of their activities. The Common Law had been adapted, in a process led by Lord Chief Justice Mansfield and relying on evidence of merchant and underwriter practice, to provide an effective vehicle for resolving disputes with outsiders.
Leonard sees very little change in this institutional environment over the French wars, although high wartime premiums did lure much new capital, some of it rather “naïve,” into the business. In 1824, Parliament enacted legislation authorizing the creation of additional joint stock insurance companies, but new entrants were too late to have influenced the earlier fall in marine insurance rates documented above (Palmer Reference Palmer and Oliver1984). Moreover, the entry of new firms does not seem to have had any immediate effects since insurance premiums in the late 1820s were not significantly lower than in the early 1820s. There was no sudden fall in Lloyd’s rates after the Alliance and the Indemnity companies opened in 1824, nor were rates in 1825–1829 generally lower than in 1820–1823. In any case, the size of any changes in rates during the 1820s was small relative to the change from the 1780s.
Even without significant institutional change, it is possible that marine insurance rates fell because the London insurance market became more competitive between the 1780s and the 1820s. When New Lloyd’s was launched in 1771, there were 71 subscribers, though many underwriters remained in other premises throughout the City. By 1810, the number of subscribers had risen to 1,400 or 1,500, of whom perhaps two-thirds were underwriters (United Kingdom 1810, p. 107) and to over 1,850 in 1815 (Wright and Fayle 1928, p. 320). One broker with long experience of the market testified to the 1810 committee inquiring into marine insurance that “competition with the common underwriters has lowered premiums so much, that the best underwriters have been obliged to discontinue the business they lower the premiums upon one another so much” (United Kingdom 1810, p. 110).
One source of intensified competition was from overseas exchanges, notably Hamburg. British insurance contracts faced extremely heavy stamp duty with European routes subject to a 2s 6d duty on the amount insured, and longer ones a 5s duty, adding an extra 20 percent to the cost of insuring a voyage to the Baltic or United States. In Hamburg, by contrast, stamp duties were one-sixth of British levels. Combined with a severe postwar depression in shipping, this caused the membership of Lloyd’s to fall by one-third by 1830 and stamp duty receipts to almost halve compared with the last wartime years (Wright and Fayle 1928, p. 320).
We can see in Figure1 that the rates for Hamburg and the Baltic in the 1820s fall more markedly from those for Lisbon, and they, as we shall see later, fall more than the changes in loss rates would lead us to expect. We suspect that increased competition accounts for some of this change. However, when it comes to oceanic routes, these are barely mentioned in Denzel’s (Reference Denzel and Nigro2017) account of the Hamburg market, suggesting that competition was less of a factor there, and we will see below that premiums to the United States change by the same proportion as loss rates.
LOSS RATES
Marine insurance could be taken out on the value of the ship or on the value of the cargo or on both. Our source for losses, Lloyd’s List, the current incarnation of which began publication in 1734, records many incidents in which cargo was damaged, waterlogged, washed away, or jettisoned to save the ship. However, since we suspect that Lloyd’s List was less complete on cargo losses than on ship losses and we have no information on either the values of the cargo lost or the total value of cargo insured, we focus on ship losses. For ships, we lack information on the tonnage of the vessel or its value, which could range from a few hundred pounds for small, old vessels to tens of thousands of pounds for East Indiamen. As a result, what we count is the numbers of ship losses recorded in the marine news columns of Lloyd’s List.Footnote 11
It might appear that the official ship registers kept in the ports of Britain and Ireland since 1786 could offer additional or even better information on losses. These registers recorded the owners, masters, and dimensions of ships, and in principle they recorded when and how a ship went out of registration, whether it was transferred to another port, sold abroad, broken up, or lost. However, besides the practical problems of using these numerous, physically massive registers, they are frequently uninformative about ship losses. Often no date is given, and only rarely do they provide detail on where and how the ship was lost, or in which trade it was being used at the time. In fact, as will be seen below, many ship losses in the foreign trade of Britain and Ireland are simply not reported in official registers.
Counting ship losses in Lloyd’s List is not without its own problems. A typical entry in its Marine List section is a snippet that includes the ship’s name, its master’s name, its ports of origin and destination, and the location and nature of the incident, though sometimes the port to which it belonged was given instead of or in addition to those for origin and destination. Yet, sometimes much of this information is missing, particularly when the report was based on another ship’s observation of wreckage. Ships were variously described as lost, abandoned, missing, wrecked, burnt, and on shore. Not all of these incidents turned out to be definitive losses. Ships that were missing later turned up in port, and some ships that were abandoned were subsequently towed in.
The most problematic reports concern ships described as on shore. Many are later reported to have been got off, sometimes pulled off by other vessels or boats, sometimes floated off at higher tides, aided in some cases by offloading cargo to lighten the ship. But it is clear that Lloyd’s List did not report all of these rescues. We successfully matched over half of the ships recorded as lost to entries in the annual lists of ships in Lloyd’s Register in the year before the ship was lost. We then searched for the same ships in Lloyd’s Register two years later, with the result that about a quarter of the matched ships turned out to be still in service, including a few initially reported as wrecked. These survivors were removed from the data set.
How complete was Lloyd’s List as a record of ship losses? Data collected for the 1836 Parliamentary Select Committee on Shipwrecks provide a way to approach this question. The report’s appendices contain two lists: one is described as a “return of all vessels belonging to the United Kingdom, reported on the books of Lloyd’s as missing or not heard of, during the years 1833, 1834 and 1835”; the other as a “return of all ships’ registers cancelled or given up on account of the loss or destruction of the ships to which they belonged,” also for 1833–1835. The first turns out to have been a quite accurate extraction of data from Lloyd’s Lists, with careful attention having been paid to excluding both foreign vessels and vessels that were not conclusively lost. The second list comes from the official ship registers mentioned above.
These two contemporary lists of ship losses can be compared with a modern compilation to be found on Wikipedia. The Wikipedia lists of wrecks are meticulously referenced, cover a long period, and refer, at least in early years, mainly to British vessels. Until the mid-1820s, they are based primarily on Lloyd’s Lists, and hence do not differ significantly from our principal source; thereafter, they draw on both Lloyd’s List and a wide range of other newspapers, picking up losses that may not appear in Lloyd’s Lists. The Wikipedia 1834 list, thus, constitutes an alternative, albeit not entirely independent, record of ship losses.
All three sources arrive at similar numbers of losses (Table 3), but they turn out not to be all the same losses. Across the three sources, there are over a thousand distinct losses, which is 77–103 percent more than the number in any individual source. The major discrepancy concerns losses that showed up only in the official ship registers, and these were predominantly small vessels involved in the coasting trade. To a lesser extent, coasting vessels also accounted for many of the losses reported only in the Wikipedia compilation or in both Wikipedia and the registers. By contrast, the losses reported in Lloyd’s Lists tend to be larger vessels involved in foreign trade, though coasting vessels were still fairly prominent in this source.
Table 3 SHIP LOSSES IN 1834 BY SOURCE

Sources: Official ship registers and Lloyd’s List: United Kingdom (1836), pp. 307–14, 322, and 348–77; Wikipedia: https://en.wikipedia.org/wiki/List_of_shipwrecks_in_1834.
A striking result of this exercise is the large number of losses reported in Lloyd’s Lists and Wikipedia that did not show up in the official ship registers. Perhaps some of these observations may refer to foreign rather than British vessels, and hence there would have been no record in the official ship registers. Others may have been vessels that were refloated but not reported as such in the press. But the number is so large that it would seem that the official registers must have missed many losses, in particular those of larger vessels on foreign routes. In such cases, news of the ship’s fate may not have come back to the local port authorities, or may not have come back in a timely or accurate way. Analysis of the official ship registers at the port of Whitby in Yorkshire from the late eighteenth to the mid-nineteenth century shows that very often ships were recorded as lost but the date at which the loss took place was not specified. At Whitby, ships that were eventually recorded as lost often remained on the official registers until there was a periodic cleanup.Footnote 12
We focus on loss rates in the foreign trade of Britain and Ireland, omitting the coastal trade for two reasons. First, as just shown, Lloyd’s Lists’ coverage of losses in the coasting trade is very incomplete. That of the foreign trade is also incomplete but not to the same extent. In 1834, 420 vessels that were lost could be identified as in the foreign trade, of which Lloyd’s List recorded two-thirds. This share may be understated because the Wikipedia list may be less than assiduous in picking up vessels that were refloated, and for want of information, some vessels may be double-counted because they have not been successfully matched across sources. Nonetheless, because Lloyd’s List certainly missed some losses in the foreign trade, our loss rates will be underestimates.
Second, in order to calculate loss rates, we need a measure of the number of voyages susceptible to loss. From the late eighteenth century, there are statistics of the number of ships entering and clearing British and Irish ports, but only from the early nineteenth century do these statistics include voyages in the coasting trade. Throughout the period, the entries and clearances are given by foreign country, so they can be matched reasonably well to the destinations for which marine insurance rates were quoted.
One can only speculate on how the extent to which Lloyd’s List coverage of losses in the foreign trade may have changed over time. If it fell from the 1780s to the 1820s, then any fall in the observed loss rates would overstate the true fall.Footnote 13 But there are good reasons to think that any bias would be in the other direction, toward understating any true fall. The thoroughness with which Lloyd’s List recorded ship losses is likely to have increased over time as its network of correspondents became denser. In 1785, departures and arrivals were reported for about 50 different British and Irish ports and about a hundred foreign ports; by 1825, both numbers had roughly doubled.Footnote 14 In addition, the number of column inches devoted to marine incidents more than doubled.
We have extracted ship losses from Lloyd’s Lists and calculated loss rates for peacetime periods in the mid-1780s and the mid-1820s (Table 4 and Figure 2). Since the insurance rates refer only to the outward voyage, the losses were divided by two because they refer to both outward and return voyages. The divisor is the larger of the numbers of entries or clearances for each foreign region. On some routes, these diverged significantly because ships either arrived or departed in ballast and, as such, were not counted in the statistics. The extreme was the Baltic, for which entries exceeded clearances by over threefold in the 1780s and by 75 percent in the 1820s. Even in ballast, ships would still need to be insured, so they should be counted in the denominator. The resulting loss rates are plausible in that, like the marine insurance rates, they increase with the length of the voyage.
This approach to counting losses is uninformative on the Asia route: with fewer than 100 arrivals recorded in 1783–1785, we cannot be confident of the true loss rate. We, therefore, prefer losses per voyage over longer intervals calculated directly from the records for EIC ships: these rates fell from 1.7 percent in 1765–1773 and 1.3 percent in 1783–1791 to 0.6 percent in 1820–1829 (Solar Reference Solar2013). In other words, the loss rates were smaller than those on the much shorter and more straightforward route to the United States, which did not entail rounding the Cape of Good Hope and, for ships going to China, passing through the various straits in the Indonesian archipelago. These relatively low losses suggest that the EIC was significantly ahead of ordinary merchant shipping in adopting advances in shipbuilding and navigation: In fact, as shown below, several of the most important advances were actually pioneered by the Company.
The loss rates match up reasonably well to the insurance rates. In most cases, the loss rate is less than the insurance premium, as one would expect if the insurers were to make a profit. However, given the sources, this did not necessarily have to be the case. Our loss rates are not always a perfect match to the insurance rates. For example, the rates quoted to the West Indies almost certainly referred to direct voyages, but our loss rates include the much riskier voyages that stopped in Africa to collect slaves. The rates that insurers actually quoted customers on a given route depended on the characteristics of particular ships and routes and could vary considerably, with a long tail corresponding to poor risks. The range of rates quoted by the Royal Assurance, by Lloyd’s, and in the newspapers probably referred to better risks, while the calculated loss rates include ships of all sorts and, thus, could be higher. Also, as in any contract prone to substantial moral hazard, marine insurance policies typically involved deductibles (“abatements”), which meant that the insurers paid out less than the full value insured: For the Royal Assurance, the deductible was 16 percent (John Reference John1958). Finally, as insurers could earn income by investing premiums, there was some scope to reduce insurance rates somewhat.
Loss rates to most destinations fell significantly from the 1780s to the 1820s, and the extent to which they fell matches reasonably well the fall in marine insurance rates. This suggests that falls in insurance rates were largely driven by improved safety, rather than intensified competition. The two glaring exceptions are the Baltic and Canada, where the loss rates rose by half, but each of these exceptions can be explained by changes in the nature of the trades. The Mediterranean and East Indies trades present lesser, though also explicable, anomalies.

Figure 2 PERCENTAGE LOSS RATES PER VOYAGE ON EUROPEAN AND OCEANIC ROUTES
Sources: Table 4, except the EIC for all voyages in 1783–1791 and in 1820–1829 from Solar (Reference Solar2013).
Table 4 LOSSES AND LOSS RATES IN PEACETIME

Notes: The denominator in each case is the larger of entries and clearances for each region. The regions are defined as follows: Baltic: Russia, Sweden, Prussia, East Country; North Sea: Denmark, Norway, Germany, Netherlands, Flanders; Biscay: France; Iberia: Spain, Portugal, Madeira, Canaries; Mediterranean: Gibraltar, Italy, Malta, Ionian Islands, Turkey, and the Levant, Tripoli; Canada: British North America, Greenland, Davis Straits; United States: United States; West Indies: Coast of Africa, British West Indies, Hayti, Cuba, Mexico; South America: Brazil, Columbia, Rio de la Plata, Chile, Peru, Whale Fisheries, Southern Fishery; Asia: Cape of Good Hope, St Helens, Mauritius, East Indies, China, Sumatra, and Java, New South Wales, Van Diemen’s Land, New Zealand.
Sources: Losses: Lloyd’s List, 1784–1786, 1824–1826. Voyages: 1784–1786: Statements of Navigation and Trade, National Archives, CUST 17/8–9; 1824–1826: British Parliamentary Papers, Tables of the Revenue.
The rise in the Baltic loss rate reflects a change in the seasonality of the trade. The great danger in this trade was winter ice, to such an extent that when insurance rates for December, January, and February were cited (and they often were not), they were sometimes ten times the summer rate; by November, they were already three times as high. What seems to have happened between the 1780s and the 1820s is that shippers stretched the sailing year. This can be seen in the dates at which losses in the Baltic were reported in Lloyd’s List. In the mid-1780s, 33 percent of losses were reported between December and April; in the mid-1820s, this had risen to 62 percent. It can also be seen in arrivals of ships in London from the Baltic: in 1789, only 3 percent arrived in the six months from December to May; in 1826, this had risen to over 20 percent (Lloyd’s List 1789, 1826). Since losses were still relatively higher in the winter months, this shift in seasonality would tend to produce increased loss rates.
The rise in the Canadian loss rate reflects the growth of the dangerous timber trade, which appeared when supplies of Baltic timber were first cut off during the Napoleonic wars, and afterward faced increased tariffs. The losses on the Canadian route—where old vessels carrying a low-density cargo, some of it loaded on deck, made them prone to capsize—drove one of the earliest pieces of industrial safety legislation, that banning deck cargoes in 1839 (Williams Reference Williams and Scholl2000). According to the parliamentary inquiry that preceded this law, in the period 1836–1838, 226 ships were lost coming from Canada, a rate of 4.2 percent (this is an average for all seasons of the year), and crews in vessels that became waterlogged but remained afloat suffered severe privations sometimes leading to cannibalism (United Kingdom 1839, pp. i–v). Of the roughly 2,000 ships coming from Canada each year in the 1820s, 87 percent were carrying timber. Crews on these vessels earned 10s per week compared with 7s on other ships, and insurance rates ran from 3–3.5 percent in spring to 10 percent in autumn. This suggests that the insurance rate of 1.8 percent for the 1820s in our Table 1 pertains to ordinary, rather than timber, vessels.
The loss rate on the Mediterranean trade fell by much more than did insurance rates to Leghorn and Smyrna; however, insurance rates in the mid-1820s may have been kept up by the fear of losses to shipping caused by the struggle for Greek independence and by the presence of South American privateers off the Spanish coast. More likely, however, is that the discrepancy reflects the fact that the Mediterranean was a relatively minor route plied by small vessels.
As noted above, loss rates on EIC ships fell from the 1780s to the 1820s along with other rates. However, the marine insurance rates for Asia-bound ships shown in Table 2 remained stable, a discrepancy that we believe arises from a change in the composition of ships in the India trade. In the 1780s, all ships were operated by the EIC; by the 1820s, the vast majority of ships were not Company vessels. The end of the India monopoly in 1814 had opened the trade to smaller, less heavily armed and manned vessels, which had much higher loss rates than did Company ships. In the 1820s, the loss rate on the large Company ships was only 0.6 percent, but the rate for all ships, as taken from Lloyd’s List, was 3.1 percent. We suspect that the loss rate for non-Company ships in the 1780s would have been much higher, but we have no evidence because there were no small non-Company ships at that time.
One notable feature of the evidence from Lloyd’s Lists is the rarity of losses of British ships to pirates both in the 1780s and the 1820s. The fact is that large scale piracy had disappeared considerably earlier: At their peak in the 1620s and 1630s, the Barbary corsairs were taking around 15 English ships a year, but subsequent treaties protected British ships from being taken. The later upsurge in Caribbean piracy after 1716 was eradicated within a decade with 400–600 pirates hanged (Earle Reference Earle1998, pp. 119–120; Rediker Reference Rediker1987, p. 256; Lubbock Reference Lubbock1922, pp. 84–95).
Wartime privateering was a different matter. Wright and Fayle (1928, pp. 187–90) estimate that the risk of capture from 1793 to 1801 averaged about 3.4 percent per voyage but varied substantially by year and route. They reproduce one broker’s rates for 1808, where some summer premiums to the Americas go as high as 12 percent and some to the West Indies up to 20 percent. For the Baltic and “Dutch Ports in Enemy’s Hands,” premiums ran up to 40 percent.Footnote 15 But our concern here has been with peacetime rates, which are more germane to detecting longer-term improvements in safety arising from technological or institutional changes. There is no denying that prolonged peace after 1815 allowed shipowners to derive greater benefit from peacetime insurance rates than they had been able to do in the bellicose eighteenth century. However, we have neither the insurance or loss rates to be able to calculate the magnitude of this peace dividend.
TECHNOLOGICAL INNOVATIONS IN SHIPBUILDING
A widespread view is that, by the late eighteenth century, the European sailing ship was a mature technology and that most subsequent innovations were incremental. In fact, several structural innovations occurred in shipbuilding that served to reduce losses, notably copper sheathing, iron reinforcing, and flush decks.
Copper sheathing was introduced in the 1780s and spread rapidly from the slave trade to the East India and West Indies trades (Solar Reference Solar2013; Solar and Rönnbäck 2014). By protecting hulls from the depredations of ship worm, coppering prolonged ship lives and reduced maintenance (Solar Reference Solar2013; Solar and Rönnbäck 2014). A sound hull, moreover, was less likely to disintegrate in a heavy sea than a worm-eaten one, and it is revealing that Lloyd’s Register systematically recorded whether and when ships were sheathed, either in wood or copper. Copper sheathing, by keeping the hull clean, also enhanced a ship’s maneuverability, helping it to avoid dangerous shores. The share of the British merchant fleet coppered rose from 3.3 percent in 1786 to 17.9 percent in 1816, and by recorded in Lloyd’s Registers as 1830–1831, this proportion had risen to 36 percent.Footnote 16
A second innovation in shipbuilding during our period of study was the increasing use of wrought iron joints, and later bracing, to strengthen the ships’ hulls. This was part of the increasing use of iron bracing in shipbuilding, prompted in part by shortages of wood during the wars and in part by technological progress in the making and shaping of iron (Albion Reference Albion1926). One indication of the latter is that the real price of nails fell significantly between the mid-eighteenth and mid-nineteenth centuries as iron became cheaper and nails were cut rather than forged (Clark Reference Clark2007, pp. 253–54). But our concern here is with safety.
A ship’s hull can be viewed as a hollow beam whose top is the deck. A weak deck insecurely attached to the hull results in a flimsy vessel that will flex markedly in heavy seas, causing the ship to leak dangerously and, in sufficiently bad conditions, to snap its masts and sometimes to break apart. Traditionally, ships’ decks were pegged to their hulls using expensive wooden brackets called knees, made from the forks of oak trees.
Heavy wartime building of naval vessels led to severe shortages, of knees big enough for large ships especially, at a time when puddling was increasing the supply of cheap, high-quality wrought iron (Goodwin Reference Goodwin1997). The replacement of wooden knees with iron ones secured by bolts was pioneered by the Surveyor (chief architect) of the EIC, Gabriel Snodgrass, who also began to introduce iron bracing between a ship’s ribs, which stiffened the hull like the diagonal bar on a wooden gate. These innovations were gradually adopted by the navy, and by 1801, naval dockyards were using 1,400 tons of iron annually even before the general adoption of iron knees in 1805 (Lambert Reference Lambert1991, pp. 60–64; Goodwin Reference Goodwin1997).
How rapidly did iron reinforcement spread to merchant shipping? The entry on “Shipbuilding” in Rees’s Cyclopaedia (1819) suggests fairly general adoption: “Wooden knees having become scarce for some years past, many substitutes have been attempted; and iron knees … are certainly best when properly applied.” By 1830, Hedderwick’s Treatise on Marine Architecture takes it for granted that all fastenings on the larger ships that are his concern are made of iron. But these works were concerned with best, rather than average, practice. We have some quantitative evidence on the diffusion of iron supports from newspaper advertisements and from Lloyd’s Register, which recorded whether vessels had iron supports from 1816 until 1833. In 1805, only 8 percent of ships of 200 or more tons that were offered for sale in London’s Public Register had iron knees; in 1820, this had risen to 10 percent. In Lloyd’s Register, the proportion of ships of two hundred tons or more that were recorded as having iron knees was only 1–2 percent in 1818. It subsequently rose to 16 percent in 1824 and about 35 percent in 1831–32.Footnote 17 A cautious reading of the evidence is that iron knees were already being adopted in merchant shipping from the 1800s and that they were common but by no means prevalent on bigger ships by the 1830s.
Besides iron bracing, Snodgrass’s other major innovation—possibly influenced by his contact with Indian vessels—was a ship with a single, convex flush deck that could be made watertight by battening down hatches and was far sturdier in heavy seas than traditional European designs with stepped decks (Snodgrass Reference Snodgrass1797; Parkinson Reference Parkinson1937, pp. 135–38).Footnote 18 Although the Royal Navy stuck entirely with deep-waisted ships until the 1830s (Leggett Reference Leggett2015, pp. 26–58), flush decks had begun to spread beyond the EIC much earlier.Footnote 19 As early as 1805, the Public Ledger contained advertisements for about a hundred merchant ships so equipped, with the earliest date of build being 1799. The share of ships of 200 tons or more advertised with flush decks rose from 14 percent in 1805 to 21 percent in 1820 (Public Ledger 1805, 1810, 1820). The advertisements indicate that many ships with flush decks were used in the West Indies trade.
An even simpler innovation pioneered by Snodgrass was to introduce partitions inside hulls to stop ballast shifting in storms and capsizing the vessel.Footnote 20 Although a biography of naval architect Sir Samuel Bentham, who introduced watertight bulkheads as a safety measure to the Navy in 1795, states that the innovation spread “at length” to private dockyards (Bentham Reference Bentham1862, p. 120), we have no way of tracing the diffusion of this technique in the age of sail.
Finally, the growing use of steam power may well have had an indirect effect on ship losses. By the mid-1820s, many ports had small steamers in use as ferries or tugs. Lloyd’s List reports many incidents in which these local steamers were used to refloat stranded ships.
By the mid-1820s, copper sheathing was widely diffused and a growing number of vessels, particularly in long-distance trades, had iron knees, flush decks, and watertight bulkheads. These innovations in shipbuilding should have contributed to the reduction in ship losses, though we cannot put a figure on their impact, individually or collectively.
TECHNOLOGICAL INNOVATIONS IN NAVIGATION
Safe navigation requires reliable charts, compasses, and the means to determine longitude and latitude, and all of these improved to varying degrees during the late eighteenth and early nineteenth centuries. Here, we review both the innovations and the extent to which they were put into practice and, thus, had the potential to explain falling loss rates. Diffusion of these tools was sometimes slowed by their cost or by the lack of officers and seamen with sufficient knowledge to apply them.
Latitude
It has been known since the middle ages that the latitude of a ship can be calculated approximately by the altitude of the Pole Star above the horizon or, as the Portuguese learned when sailing south toward the equator in the fifteenth century, the height of the noonday sun. Traditionally, sailors used astrolabes or staffs to measure the height of the sun or a star, a difficult exercise on a rolling deck. Systematic readings only became possible with John Hadley’s octant from 1730, which worked by moving the reflection of the sun or a star down until it lined up with the horizon, allowing the angle between them to be read accurately (Cotter Reference Cotter1968, pp. 57–91). Lighter and far more accurate instruments, capable of measuring wider angles, became practical through one of the most important innovations of the early Industrial Revolution, Ramsden’s 1775 dividing engine, which allowed compact and precisely cut graduated scales to be mass produced at low cost. It is reckoned that, by the time of his death in 1801, Ramsden had produced 1450 sextants, while his dividing engine was also availed of by other sextant manufacturers (Baker Reference Baker2012; Dunn and Higgett 2014, p. 175; McConnell Reference McConnell2007, ch. 3; Mörzer Bruyns and Dunn 2009).
Longitude
Longitude can be calculated using the difference between the time in some reference port and the ship’s local time. Local time can be calculated once latitude has been measured, and it has been known from the early sixteenth century that reference time can be measured in two ways: either mechanically by a clock that tells the time in the home port or astronomically by the position of the moon against the background of fixed stars.Footnote 21 The quest for an accurate measure of longitude and safety at sea were closely linked; in the words of the Longitude Act of 1714, “…nothing is so much wanted and desired at sea, as the discovery of the longitude, for the safety and quickness of voyages, the preservation of ships, and the lives of men…”
As noted earlier, it is still widely believed that Harrison’s 1759 H4 sea watch solved the longitude problem. Harrison’s design differed radically from what other watchmakers of the time would have produced, in particular in its use of a large, heavy balance wheel, which meant that the watch was not self-starting.Footnote 22 Further improvements by John Arnold (whose chronometers were bought in substantial numbers by the EIC) and Thomas Earnshaw led by around 1810 to a design that changed little until chronometers became obsolete in the second half of the twentieth century.
But for a half-century or more after their invention, H4 chronometers, among the most complicated artefacts of their time, were too expensive and, more importantly, too unreliable for widespread adoption (Dunn and Higgitt 2014, pp. 104–25). As late as the 1830s, of the 22 chronometers brought on the circumnavigation of HMS Beagle, only 11 still worked at the end of the voyage (another four were left with a surveying expedition) despite being kept in a special cabin and having a professional instrument maker on board to maintain them (FitzRoy Reference FitzRoy1839, pp. 325–31). The accuracy of a chronometer not only changed with variations in temperature, humidity, barometric pressure (making surviving chronometer logs a useful source for climatologists), metal fatigue, and quality of lubricating oils, but also with the way it was wound: the exquisite care needed in winding chronometers remained a constant anxiety, as shown by the standard manual of Shadwell (Reference Shadwell1855).Footnote 23
Although issued to the Royal Navy in limited numbers from the 1790s, only 7 percent of British warships had a chronometer in 1802 (Rodger Reference Rodger2004, pp. 382–83). Chronometers were rapidly adopted on the EIC fleet. For a captain expecting to earn £5,000–£10,000 from his personal cargo allowance, paying £65–£105 each for three chronometers was a minor consideration and most Company ships employed them by 1790 (Davidson Reference Davidson2019). Although the first Hudson Bay Company ship to carry a chronometer sailed in 1817, they were used to calculate longitude regularly only from 1834 (Glover Reference Glover2017). Few merchant ships used them before the mid-nineteenth century (Davidson Reference Davidson2019; Cotter Reference Cotter1968, p. 29; Glover Reference Glover2017).
The other approach to longitude estimation at sea, that of lunar distances, uses the fact that the relatively rapid movement of the moon across the sky allows it to function like a minute hand against the clock dial of fixed stars. This means that with appropriate tables, the angle between the edge of the moon and a known fixed star can be used to calculate the time in the reference port. So, for example, if on 27 July 1809 the adjusted angle between the edge of the Moon and Antares was 67°13'3”, after looking up the Nautical Almanac for that day, the navigator knew that the time at Greenwich was 18 minutes and 39 seconds after midnight.
The Paris Observatory was founded in 1667 for the explicit purpose of obtaining an accurate star map for lunar navigation, as in 1675 was the London Royal Observatory. However, because the moon is affected by the sun’s gravity as well as the earth’s, modeling its path accurately enough for reliable navigational tables led to a challenging three-body problem that defeated the geometrical approach of Newton (Wepster Reference Wepster2009, pp. 8–25) and whose eventual solution led to an unedifying priority dispute among Clairaut, d’Alembert, and Euler (Bodenmann Reference Bodenmann2010). It was only in 1755 that the German astronomer Tobias Mayer, developing equations devised by Euler to solve the interaction between the orbits of Jupiter and Saturn and effectively solving a least squares problem (Stigler Reference Stigler1986, pp. 11–61), computed tables accurate enough to predict longitude to one degree. In 1806, Johann Karl Burckhardt, using the refined lunar equations of Laplace, devised tables about 12 times more accurate. At the same time that the Board of Longitude finally awarded Harrison £10,000 for his chronometer, it also gave £3,000 to Mayer’s widow and £300 to Euler.
The practical difficulty in applying lunars lay in “clearing” the observed angle of the effects of refraction, parallax, and horizon dip in order to calculate the true angle: a nontrivial problem in spherical trigonometry whose most elegant solution was devised by Borda in 1778 (Gascoigne Reference Gascoigne, Higgitt, Dunn and Jones2015). Although navigation manuals provided worked examples of lunar estimates that take only about one-third of a page to calculate, these may have been beyond the capabilities of most captains, although the exception again is the EIC. In 1768, all new officers were required to be able to use lunar distances, and during the 1770s, these distances were in use on half of EIC voyages, although only in the vicinity of known danger points (Miller Reference Miller, Dunn and Higgitt2015; Davidson Reference Davidson2016, Reference Davidson2019).Footnote 24
In summary then, longitude estimation had little impact on the safety of ordinary merchant ships before the end of our period of study. Masters, instead, trusted the traditional way of “running down the latitude”: sailing directly north or south until they reached the latitude of their destination and then sailing due east or west until they reached it.
Charts
Although precise longitude estimation may have been beyond ordinary navigators, it was indispensable for making accurate charts. A fundamental problem for navigation was the crude state of hydrographical knowledge. The standard book of charts of the British coast through most of the eighteenth century was Grenville Collins’ rudimentary Great Britain’s Coasting Pilot (first published in 1693 and frequently republished, reaching its twenty-first edition in 1792; for an example, see Figure 3), along with somewhat better French and Dutch charts. Although the Royal Navy had supported the surveying work of James Cook and others in the 1760s and 1770s, it established a hydrographic department only in 1795 and did not sell its maps until 1821. Similarly, the EIC’s hydrographer, Alexander Dalrymple, produced large-scale maps based on novel surveying techniques, but for Company use only (Fisher Reference Fisher2011, p. 60). The captains of the Hudson Bay Company also developed effective charts for navigating the waters of the Arctic and the Bay (Glover Reference Glover2017).
However, in the late eighteenth century, privately produced and crowd-sourced charts began to appear; these were known as Bluebacks from the color of their heavy backing paper. The first and most important was the large chart of the English Channel by John Hamilton Moore, who estimated that it had sold “upwards of 5,000 copies” between its first appearance in 1786 and 1792 (Petto Reference Petto2015, pp. 79–122). Each chart was sold with a detailed pilotage manual (such as Dessiou Reference Dessiou1802) that for each port gave times of high water, depth soundings, and guides to beacons and channel-marking buoys (themselves indicative of direct government efforts to make approaches to ports safer).
Moore also produced charts of the Mediterranean, the Baltic (Figure4), the east coast of America, and the West Indies that hardly differ from their modern counterparts, giving longitude and latitude, precise outlines of the coast with insets for major harbors, depth soundings, and descriptions of the sea bottom. Although Admiralty charts were sold at considerably lower prices, Bluebacks, by then mostly printed by John Norie, remained the choice of most ships’ masters until well into the nineteenth century, coming as they did with detailed pilotage manuals and being designed to be legible in dim candlelit cabins at sea, with navigational hazards clearly highlighted (Fisher Reference Fisher2003, Reference Fisher2011). The quality of charts increased significantly with the introduction of the station pointer in the 1770s (Fisher Reference Fisher2001, p. 121). Because most ship losses took place in coastal waters, better charts are likely to have been a primary factor in reducing loss rates.Footnote 25


Figure 4 DETAIL FROM HAMILTON MOORE’S NEW AND CORRECT CHART OF THE BALTIC …, 1791.
Source: Moore Reference Moore1791.
Navigation Manuals
These navigational innovations mattered little if mariners lacked the skills to apply them. Although state-run navigational schools in continental Europe dated from the time of Prince Henry the Navigator, Britain characteristically relied on informal education. Private tutors were numerous from Elizabethan times, but the earliest systematic navigation textbook was John Robertson’s 1754 Elements of Navigation, though its uncompromising reliance on spherical trigonometry made it incomprehensible to most sea captains. The first useful manual, priced at ten shillings (roughly the weekly wage of a seaman in the 1770s; Smith (Reference Smith1776, p. 135)) and largely based on worked examples, was again due to John Hamilton Moore.
His New Practical Navigator of 1772 started with arithmetic and elementary trigonometry before taking the reader successively through use of compass and log line; plotting course on charts with plane, traverse, mid-latitude, and Mercator sailing; estimating tides; recording hourly course and speed on a traverse board; calculating local time and latitude; and finally calculating longitude using lunars. Several mathematical tables were appended. Moore’s structure was kept in successive editions of the two most widely used manuals: Norie’s New and Complete Epitome of Practical Navigation, which first appeared in 1805; and its American equivalent, Nathaniel Bowditch’s American Practical Navigator (which began as a pirated edition of Moore; see Cotter Reference Cotter1977), from 1802 onward.
However, despite covering advanced techniques, in Moore’s (Reference Moore1794, p. 186) view, “the most capital part of navigation” for the young mariner was the systematic working up of a daily journal of position. This started from the traverse board of hourly speed and heading, making corrections for compass deviation and leeway, and estimating position on a chart using mid-latitude sailing.
Successive editions of these manuals provide a useful way to track progress in navigational practice. The early editions of Norie are almost identical to Moore, although the exposition in general is more lucid and the algorithms for calculating lunars are considerably simpler. By 1835, however, Norie describes how to adjust for the compass deviation caused by the growing amount of iron on ships; and, instead of chronometers being placed as a short appendix after lunars, they are now discussed at length before lunars appear. Clearly, the mariners who read these manuals had to be both literate and numerate (Schotte Reference Schotte2019). Although it seems likely that educational standards of officers rose in response to the increased complexity of applied navigation, formal examinations to certify navigators and masters only became widespread in the 1850s (Vasey Reference Vasey1980).
Early navigation manuals were plagued by inaccurate tables of logarithms and trigonometric functions. The most ambitious effort to produce reliable tables, intended for a cadastral survey of postrevolutionary France, was undertaken by de Pronys in 1794 with algorithms designed by Legendre and others. Inspired by Adam Smith’s discussion of division of labor, he established a “computation factory” of unemployed hairdressers—accustomed to painstaking work but victims of the reaction against the elaborate coiffure of Bourbon times—to perform the routine calculations. However, the completed tables could not be printed because of the collapse in value of the assignat (Grattan-Guinness Reference Grattan-Guinness and Campbell-Kelly2003). Another ambitious but abortive project to develop mathematical tables for navigation was Charles Babbage’s 1822 idea of a Difference Engine (Swade Reference Swade2001).
Although longitude estimation contributed less to safety at sea in our period than usually thought, that does not mean that progress in navigation was lacking. Most ships still navigated by dead reckoning based on speed and compass heading until the 1830s, but thanks to Moore and his imitators, it was a far more sophisticated and reliable dead reckoning than the crude guesswork of the 1770s.
Compasses
In contrast to the progress in positional estimation and chart making, the improvement of the oldest and most important navigational instrument, the compass, was remarkably slow. Small compass errors translate into large, and potentially deadly, errors in estimated position: Heading ten miles due west on a compass bearing that is only six degrees in error will leave a ship one mile north of its estimated position. Three difficulties plagued compasses: low quality iron, magnetic deviation, and magnetic variation. In 1745, the English physicist and inventor Gowin Knight devised a process to magnetize steel bars, resulting in a compass needle that retained its magnetism longer than soft iron ones, and this technique became public after his death in 1776. Magnetic deviations were strongest in high latitudes with their strong magnetic fields. Despite considerable efforts to improve compasses, the Ross Arctic voyage of 1818, which was intended in part to assess the performance of novel designs, found all of them to be extremely unreliable, pointing in widely different directions (Dunn Reference Dunn, MacDonald and Charles2016).
Magnetic variation—the difference between magnetic and true north—had been familiar since Elizabethan times, but it was frequently ignored. The event that led directly to the establishment of the Board of Longitude was the wreck of Shovell’s fleet on the Scilly Isles in 1707 with the loss of 2,000 lives. Its navigators had not compensated for a ten-degree variation, as well as relying on charts that placed the islands nine miles north of their actual position. Such a disaster would have been prevented a century later, when charts were much more reliable and Norie and Bowditch, in their widely consulted manuals, showed that magnetic variation may be easily compensated for by comparing the compass position of the sun at dawn with the true position in published tables.
An untoward consequence of the increasing use of iron reinforcing and cables after 1800 was that it worsened the deviation of compasses from magnetic north. However, manuals described how to compensate by comparing the position of a compass needle when the ship was heading east–west with its position heading north–south. Placing the compasses high above deck was also found to help (Quinn Reference Quinn2001).Footnote 26
While compass design was largely stagnant, notable improvements occurred during our period of study in the two other traditional mainstays of navigation: mechanical log lines (for estimating speed), particularly Edward Massey’s design of 1802 (Turner Reference Turner1998, p. 35), and rapid depth sounding, although the latter was only needed when fast steamships appeared.
Handheld spy glasses, widely used from the seventeenth century to identify navigational hazards and safe places to land, considerably improved during the eighteenth century. In 1758, John Dollond patented a lens that corrected for chromatic aberration and joined a partnership formed by his son to sell spy glasses incorporating the new lens. With the termination of Dollond’s patent in 1782, cheaper achromatic telescopes became widely available (Dunn Reference Dunn2011, pp. 73–76).
State Involvement
The second half of the eighteenth century also saw increased state efforts to improve navigational aids around coasts. The number of lighthouses on the east coast of the United States rose from 3 (all in Massachusetts) before 1750, to about 24 by 1800, and 85 by 1830. In the United Kingdom, the numbers rose from about 15 in the mid-eighteenth century to 57 by 1800, 118 by 1830, and 264 by 1844.Footnote 27 Steady innovation occurred in lighthouses (Stevenson Reference Stevenson1959, pp. 61–85). Simple coal fires and candles were replaced by oil-fired Argand lamps illuminating parabolic reflectors. “Wave-swept” lighthouses were built off shore, pioneered by Smeaton’s 1759 Eddystone Lighthouse. Smeaton’s sturdy stone construction served as a model for many others, with innovations that included keeping the center of gravity low, using a type of concrete that solidified under water, and ensuring durability with a system of interlocking granite blocks.Footnote 28 Talented innovators, such as John Rennie and Robert Stevenson, surveyor to the Commissioners of Northern Lights, built on Smeaton’s achievements. Channel-marking buoys and beacons were increasingly installed by local harbor commissioners.
The first successful purpose-built lifeboat was designed by Henry Greathead, a boat builder at South Shields, in 1789. Built to carry 20 people, it could be rowed in either direction and rose at both ends to reduce the risk of foundering in heavy seas. Other hallmarks included a curved keel, short oars, cork casing for buoyancy, copper plates for rigidity, and the absence of a rudder. Versions of Greathead’s invention, manned by experienced oarsmen who were usually well rewarded for their efforts, were soon operated by lifeboat societies in several British ports, and these societies were organized into what became the Royal National Lifeboat Institution in 1824.Footnote 29
Manby’s mortar, a primitive form of zip line, was invented by Captain George Manby in 1808. This invention was a close cousin of the less costly and lighter “Rocket” apparatus invented by Henry Trengrouse, also in 1808. Trengrouse devised his apparatus, which included a chair to carry those rescued ashore, as a reaction to the loss of life caused by the wreck of the Anston in 1807 (Pollard Reference Pollard2004). All stations of the Preventative Water Guard (1809, reformed as the Coast Guard in 1822) were presented with a Manby mortar. Although the main remit of the Water Guard was to prevent smuggling, it was also intended to help in the event of shipwreck. The mortars were credited with saving over a thousand lives by mid-century (Prosser Reference Prosser2004).
Innovations, such those of Greathead, Manby, and Trengrouse, were part of a rising humanitarian concern at loss of life at sea that drove campaigns for state intervention, reflected in the foundation in London in 1774 of the Society for the Recovery of Persons Apparently Drowned (the Royal Humane Society from 1787) and the passage of the Burial of Drowned Persons Act in 1808.Footnote 30 Despite the evidence of falling insurance rates, a belief that the risk of shipwreck was increasing—blamed on “bad vessels, bad navigation and drunken officers … in more or less equal parts” (MacDonagh Reference MacDonagh1961, p. 48)—seemed to be confirmed by McCulloch’s (Reference McCulloch1835) influential article on shipwrecks in the Edinburgh Review and the detailed accounts of individual incidents published in Alexander Becher’s Nautical Magazine.Footnote 31
In conclusion, what we can see is a pattern of sustained innovation and the gradual adoption of improved technology and techniques both in navigation and shipbuilding. None of these technical changes is the “silver bullet” that, in itself, would explain the downward movement in loss and insurance rates that we observe in the data. Experience on the long and hazardous route to India provides a way of looking at their collective impact. As our discussion of technological change has shown, the EIC was a pioneer both in ship construction and navigation. By the 1820s, its loss rate had fallen to 0.6 percent, less than half the rates on the much shorter trans-Atlantic routes and far less than the 3.1 percent loss rate for non-Company ships on the Indian service. The fall in loss rates on other routes from the 1780s to the 1820s can be seen as movements toward the EIC standard.
CONCLUSION
The safety revolution in oceanic shipping that we have outlined here ties in closely with wider debates on the nature of the Industrial Revolution. For the last generation, following the work of Crafts and Harley (Reference Crafts and Harley1992), reiterated by Crafts (Reference Crafts2014), the Industrial Revolution has become almost synonymous with advances in cotton, iron, and steam. While it is unquestionable that in macroeconomic terms these sectors dominated growth, this focus on cotton, iron, and steam has tended to distract attention from the important advances taking place in other sectors, such as brewing, pottery, glass, paper, printing, hydraulics, mechanical engineering, and nonferrous metals, as emphasized by Mokyr (Reference Mokyr2009, pp. 131–44), Berg and Hudson (1992), and Allen (Reference Allen, Floud, Humphries and Johnson2014); see also the more recent studies of rapid progress in gas lighting by Tomory (Reference Tomory2012) and watchmaking by Kelly and Ó Gráda (2016).Footnote 32 Complementing our interest in transportation at sea, Bogart (2014) has demonstrated the large advances made on land at this time.
The improvements in shipping safety saved lives—we cannot say how many—but may not have constituted a huge reduction in shipping costs. Although ships were major capital expenditures, capital costs probably accounted for less than one-third of total shipping costs. For a ship financed at 5 percent and amortized over 15 years, savings of 1 percent on marine insurance for two voyages per year might amount to around 5 percent of total costs. If the reduction in losses prolonged average ship lives, the gains would have been somewhat greater. But the important point is that these improvements in safety are just one of several indicators of progress in sailing ship technology. Copper sheathing reduced capital costs and increased ship speeds, which in the case of the slave trade reduced mortality on the Middle Passage and brought slaves to the Americas in better condition (Solar Reference Solar2013; Solar and Rönnbäck 2014; Solar and Hens 2016; Solar and Duquette 2017; Kelly and Ó Gráda 2019). Sailing ships on many routes became larger and required fewer crew members per ton (Lucassen and Unger Reference Lucassen and Unger2000). Shipping during the early Industrial Revolution does not appear to have been the technologically stagnant sector suggested by the work of North (Reference North1968); indeed, the “substantial productivity advance” in shipping—0.6 percent annually in the first half of the century—identified by Harley (Reference Harley1988, p. 861) surely owes something to the improvements documented above. Moreover, this is an indicator of productivity change in the service sector, which is poorly measured in existing national output estimates.
Our results also bear directly on Mokyr’s (Reference Mokyr2016) concept of an Industrial Enlightenment in which European science, driven by an ideal of creating useful knowledge, made major contributions to the development of technology. The earliest and most direct example of this Industrial Enlightenment at work is the quest dating from the mid-seventeenth century to improve astronomical knowledge in order to advance navigation. The Paris and Greenwich Observatories were established for the stated purpose of providing astronomical data for reliable navigation tables, and many of the major figures of seventeenth- and eighteenth-century science—including Galileo, Newton, Hooke, Huygens, Euler, Rømer, and Laplace—were directly engaged in improving navigation. In fact, Wepster (Reference Wepster2009, p. 13) argues that the annual Académie des Sciences essay prize, which alternated between a topic in general astronomy and one in navigation, played just as important a role in advancing navigation as the rewards offered under the British Longitude Act.
The improvements in navigation also illustrate the important complementary input of artisan skills. In fact, most of the innovations that came to dominate navigational practice by the 1840s were due to ordinary watchmakers and seamen. The two most important early contributions to practical navigation—accurate charts and accessible navigational textbooks—were both pioneered by the retired mariner turned navigational instructor John Hamilton Moore. Even for longitude estimation, the complicated lunar distances of astronomers (disparaged by Harrison as “professors” and “priests;” Gould Reference Gould1923, p. 68) were eventually superseded by new methods (notably position line navigation) that combined artisanal chronometers, astronomical observation, and dead reckoning.
The production of affordable, accurate sextants was made possible by instrument maker Jesse Ramsden’s 1771 dividing engine, an invention which underlay the development of all subsequent measuring instruments. By 1789, Ramsden had produced a thousand sextants, and his London factory, which employed 60 workers, produced many more (Baker 2016; Dunn and Higgett 2014, p. 175). Just as Lancashire watchmakers and watch toolmakers provided the technical expertise to build the earliest textile machinery, accurate measurement, in turn, made possible the development in Manchester in the 1820s of heavy machine tools without which the tens and later hundreds of thousands of iron mules and power looms that lined Victorian cotton mills could not have been built (Musson Reference Musson, Mayr and Post1981).