

Extreme trade liberalizations are rare events. Therefore, judging the impact of trade liberalization is challenging. China’s integration into the World Trade Organization and the establishment of most-favored-nation status with the United States after 2001 is one such case. This event allegedly caused great dislocation in advanced countries’ labor markets (Autor, Dorn, and Hanson Reference Autor, David and Hanson2013; Feenstra and Sasahara Reference Feenstra2018).
What can we learn from history and the first wave of globalization to better understand adjustment to trade liberalization? In 1860, France and Great Britain surreptitiously negotiated the landmark “Cobden-Chevalier” trade treaty. Tariffs and non-tariff trade barriers in France fell on a large set of important products, especially manufactured goods. After this, France ratified over a half dozen other bilateral commercial treaties in the 1860s, all of them featuring unconditional Most Favored Nation (MFN) clauses.
Adolphe Thiers, a member of the French opposition, reportedly argued as early as 1862 that the Cobden-Chevalier treaty had “wantonly ruined our manufactures.” Footnote 1 In this paper, we provide some evidence at odds with this assertion. The detailed historical trade data we analyze demonstrate that that liberalization in France after 1860 was accompanied by a rise in intra-industry trade. If so, then this is evidence consistent with the idea that France’s manufacturing industry was not “ruined” by this dramatic episode of liberalization.
We augment this aggregate view with a more disaggregated approach. Product lines that faced greater declines in tariffs and which were no longer prohibited tended to have larger increases in measures of intraindustry trade. This result may seem anachronistic since intra-industry trade (IIT) was “discovered” in the 1960s (Verdoorn Reference Verdoorn1960). Footnote 2 However, a path-breaking study on Germany due to Brown (Reference Brown1995) highlighted that intra-industry trade was important in textile trade circa 1913. In contrast to Brown (Reference Brown1995), we study a broader range of products as well as focusing on the case of France rather than Germany. Our paper is also related to Lampe (Reference Lampe2009) who has convincingly demonstrated that trade treaties generally promoted trade in the targeted products (mainly manufactures) and in proportion to how liberalization unfolded. Footnote 3
Our research emphasizes how the trade treaties of the 1860s may have shaped trade and specialization in a world of trade in differentiated products. It also helps explain a seeming paradox. Gourevitch (Reference Gourevitch1977, p. 294) examined this period and argued that textiles, as well as highly capitalized sectors in industry, were “vulnerable” after liberalization. He also noted the long delay in tariff backlash in France. Rather than ascribing the delay to political economy factors as did Gourevitch, we believe that the impact on these sectors was not immediately as negative as previously thought and that these sectors were more resilient than supposed.
We proceed by analyzing two newly digitized datasets of disaggregated French exports and imports circa 1860. We begin with an analysis of the 104 “broad” products listed in the official French trade statistics. We decompose changes in imports and exports into intra-industry movements, increased specialization, and loss of previous specializations using a technique due to Bastos and Cabral (Reference Bastos and Manuel2007). This decomposition establishes that increased intra-industry trade was central in the 1860s. We also show that at this level of aggregation, products that saw greater policy liberalization had larger rises in intra-industry trade.
We then turn to an analysis of even more disaggregated trade data covering the top nine exports during the period. Footnote 4 For each of nine “broad” products, we have data for four to 48 highly disaggregated “sub-products” for a total of 180. Footnote 5 These top exports, including textiles (cotton, silk, and wool) were allegedly some of the most “vulnerable” due to British competition, and interest groups representing producers of these products historically had vociferously opposed international liberalization. At this highly disaggregated level, once again, we see a relatively large increase in intra-industry trade in the products that were more strongly liberalized. The elimination of prohibitions and the decline in tariffs due to liberalization likely led to larger rises in their indexes of intra-industry trade after 1860.
Our paper studies key products whose producers had strenuously resisted liberalization prior to 1860 such as cotton, wool cloth, tools, and leather goods. While representatives of these industries had argued in the early 1850s that French production would be eliminated by removing prohibitions, this is inconsistent with the actual outcome. Their pre-liberalization claims seem to have been greatly exaggerated. A better explanation for their pre-and post-liberalization protestations is simply rentseeking, in effect, an attempt to retain market power via targeted policy and privilege.
Our bottom line builds on the observation that France engaged heavily in international trade in differentiated goods. The impact of liberalization is theoretically predicted to be less disruptive than in a world of factor endowment-driven trade. Footnote 6 Liberalization then is unlikely to have massively disrupted the economy with inter-sectoral re-allocations of factors, as emphasized in factor endowment-driven trade theories with market and sectoral rigidities. Instead, France is likely to have managed its grand liberalization at a tolerable economic cost. While comprehensive employment and output data for France are not available in this period, our story is consistent with the idea that, at the very least, French producers and workers were able to compete through within-industry product differentiation in order to maintain market share. Footnote 7
Undoubtedly, the economic environment became more competitive post-liberalization. However, the competition is more consistent with trade models of differentiated goods rather than homogeneous goods. Footnote 8 We discuss later the process and reaction to liberalization about which much has been written. But, at this point, we believe it is no overstatement to say that 1860 was a watershed in the history of modern international trade. Our study also highlights that, during the first wave of globalization, France witnessed significant intra-industry trade and not simply increased specialization at the broad sectoral level.
Liberalization in the Second Empire
Theoretical Considerations
How might a country at the early stages of industrialization adapt to intensified international competition following a major trade liberalization involving a large reduction or elimination of tariffs and/or removal of other trade barriers? In the two-country, multi-product Ricardian setup of Dornbusch, Fischer, and Samuel son (Reference Dornbusch, Fischer and Samuelson1977), each country expands its range of exports after liberalization, while a number of goods previously domestically produced are now imported. Footnote 9 Products already being exported should not see increased import competition, and those being imported prior to liberalization should not see a significant rise in exports.
In trade models driven by factor-endowments, inter-industry trade and specialization also feature prominently. According to influential work by O’Rourke and Williamson (Reference O’Rourke and Williamson1999), falling international trade costs promoted long-term convergence in real wages consistent with greater sectoral specialization. Footnote 10 Trade liberalization would be associated with an increase in specialization in the products in which France had a comparative advantage. Products with positive net exports under a highly restrictive trade regime would be expected to see a rise in net exports postliberalization. Net imports would rise in sectors where net imports were positive under protection. In sectors where import prohibitions were used, net exports could rise or fall depending on comparative advantage. Intraindustry trade is not expected after adjustment to the new trade regime occurs. In the years immediately following liberalization, these models would also not predict “matched marginal trade,” defined as a rise in both exports and imports in the same product category. After liberalization, re-allocations of factors of production between sectors would be expected (Greenaway and Milner Reference Greenaway and Chris1986). These movements potentially entail large adjustment costs to liberalization.
“New” international trade theories feature intra-sectoral competition and predict intra-industry trade. Incorporating monopolistic competition and a love of variety, models based on Krugman (Reference Krugman1979) predict “two-way” or intra-industry trade. Industrialized countries produce and trade a wide range of imperfectly substitutable goods. Liberalization would lead to an increase in so-called intra-industry trade. Footnote 11 In the short run, some incumbent producers are likely to be eliminated by international competition leading to a rise in imports. Factors of production then move out of these failing firms to other firms in similar sectors where exports rise. Transition costs are expected to be relatively low. This type of adjustment is “smooth” in the sense that temporary wage disparities and unemployment of the expanding and contracting activities are contained within the same industry. Footnote 12
Historical Background on the Great Liberalization of the 1860s
Louis Napoléon Bonaparte (known later as Napoléon III) harbored aspirations for more liberal policies in France. Because of his exile in Great Britain, he was familiar with and became himself a proponent of free trade ideas. Deiss (Reference Deiss2018) suggests that Napoléon III viewed free trade as a means to national economic development and improved welfare. Napoléon III had a grand vision for liberalization and reform of the French economy, including adjustment loans to industry post-liberalization, improved infrastructure, further trade treaties, and a progressive reduction of tariffs, first those on inputs and then those on final goods.Footnote 13
Nevertheless, throughout the 1850s, his government was not strong enough to promote a comprehensive reform. Some progress was made, however, using executive power. Between 1853 to 1856, under the Act of 17 December 1814, tariffs on some raw materials (coal, iron, some types of steel, wool, and several other raw materials) were reduced by executive decree.Footnote 14 These reductions in tariffs might be seen as re-orienting France in the direction of liberalization, but they also represented a momentarily higher effective rate of protection for some manufactured products, given that these changes applied to key industrial inputs.Footnote 15
In 1856 the Government attempted to abolish existing prohibitions on manufactured goods and replace them with tariffs. Parliament resoundingly defeated these proposals, and the government committed to leaving prohibitions in place until at least 1861. France appeared overwhelmingly opposed to a unilateral reduction of the long-standing policies to protect its manufacturing sector.
Political allies of Napoléon III (e.g., Chevalier, Persigny, and others) concluded, however, that it might be possible to drive a customs reform through by executive power alone. It was suggested that by using the power conferred by the Senatus-Consulte of 25 December 1852 to the Emperor, the executive could achieve reform via treaty and without parliamentary consent. Throughout the 1850s, Chevalier, amongst other free trade sympathizers, worked political back channels at home and in Britain to lay the groundwork for such a treaty. In late 1859 the Emperor signaled his approval to commence secret negotiations for such a treaty.
In the fall of 1859, secret negotiations for a new, bilateral treaty of commerce were opened with Great Britain. Policymakers carefully aimed to be free of political lobbying from particular industries and instead aimed for wholesale liberalization. Negotiations for the French-British treaty were “conducted in the greatest secrecy” (Arnauné Reference Arnauné1911, p. 253). Every precaution was taken to prevent political adversaries from discovering the negotiations. In France, apart from the Emperor, only five people were privy to the negotiations (Ministers Rouher, Baroche and Fould, Chevalier, and the Ambassador to London Persigny). Under the patronage of Gladstone, Cobden negotiated first alone, then with Lord Cawley. This process culminated with the signing of a treaty of commerce on 23 January 1860, referred to as a “coup d’état douanier,” or a trade revolution, in the historiography (Cadier-Rey Reference Cadier-Rey1988).
The so-called Cobden-Chevalier treaty of 1860 was revolutionary in the realm of manufactured products. Article 1 of the treaty provided a list of 44 broadly defined British products, previously prohibited, which could be imported from late 1861 (five years after the 1856 compromise) with a tariff not exceeding 30 percent in ad valorem terms. This undoubtedly lowered effective protection on many products. By eliminating these prohibitions, the treaty of 1860 was nothing short of revolutionary. Although tariffs remained at the high-to-moderate level, they would certainly not be prohibitive in most categories. Dunham (Reference Dunham1930) noted, however, that the treaty tariffs for some products in iron and metal remained prohibitive into the 1860s.
Lower tariffs on manufactured goods were phased in. Article 16 stated that that French ad valorem equivalent tariffs would be progressively lowered after 1860 from 30 percent and limited to a maximum of 25 percent (ad valorem terms) from 1 October 1864. Article 5 declared that British tariffs on 41 products (silk fabrics, perfume, tools in metal, and, of course, French wines) would be either totally eliminated or drastically reduced. It should be remembered that Great Britain maintained significant levels of protection in the 1850s even after the repeal of the Corn Laws. In fact, reducing British tariffs on French-style wines and liquors, silk products, and French luxury goods were key components of the negotiation for the Cobden-Chevalier treaty. Success for French wine producers was achieved since Article 6 introduced special benefits by way of progressively lower tariffs on French wines and spirits. Footnote 16 Article 5 abolished British tariffs on silk cloth and more than 38 other manufactured and semi-manufactured products, including iron and steel, machinery, several types of woolen articles (blankets, gloves, and nonwool fabrics), and specialized clothing (gloves, stockings, etc.). Article 19 stipulated an unconditional MFN clause.
The spirit of the new policies echoed Napoléon III’s statement during his first meeting with Cobden (in October 1859): “We don’t do reforms in France, we make revolutions.” Footnote 17 The treaty was to last ten years until a renewal option could be exercised. The treaty reduced the average rate of all duties in France from 11 percent in 1859 to 5 percent in 1861. Footnote 18
According to Bairoch (Reference Bairoch, Mathias and Pollard1989), Irwin (Reference Irwin1993), O’Rourke and Williamson (Reference O’Rourke and Williamson1999), and Lampe (Reference Lampe2009), the Cobden-Chevalier treaty was decisive at a global level in reducing tariff protection by incentivizing bilateral agreements, including the unconditional MFN clause. Literature in political science seeks to analyze the determinants and domestic origins of these treaties. Reference PahrePahre (2008) emphasizes domestic compensation, while Lazer (Reference Lazer1999) emphasizes the interaction between domestic economic interests and international relations. Lampe (Reference Lampe2011) suggests a mix of determinants such as economic and political fundamentals as well as international dynamics were significant drivers of trade treaties. Most previous work is of the opinion that the treaty of 1860 and the ensuing development of the Cobden network was a significant breakpoint in international trade relations. We study the impact on intra-industry trade in France in the following sections.
Data
To study the impact of liberalization, we assemble three different datasets for French trade between 1848 and 1872. Footnote 19 Our main data source is the Tableau général du commerce de la France avec ses colonies et les puissances étrangères ( Tableau général du commerce et de la navigation after 1896). We use “commerce spécial” (i.e., specific trade) and not “commerce général” (general trade). Data from specific trade includes the value of goods imported for national consumption and the value of national production exported. “Specific trade” excludes goods in transit. Trade is based on calendar years. Our two main data sets and the samples used for the econometrics are summarized in Table 1.
Table 1 Summary of Data Sets

Notes: Table summarizes data used in Tables 2 through 5. Missing data can arise since intraindustry indicators can be undefined with zero exports and imports and due to sample balancing. For our regressions with “broad” products using removal of prohibitions as the measure of liberalization we have 63 products with balanced data, 10 of which were prohibited for import prior to 1860. For the sub-products we have respectively 178 and 36 previously prohibited products. “Broad” products include 104 products at the 2-3 SITC digit level. “Sub-products” are more detailed products within the top nine exports by value from the broad products.
Source: Tableau.
Our first data set contains the total value (current francs) of imports and exports of 104 “broad” products corresponding to the 2 or 3 digit level in the SITC classification. For several reasons, our usable samples for econometrics are smaller than the raw data. First, our main dependent variable is undefined when exports and imports are both zero. Second, we compute the ad valorem equivalent tariff within the product class as the ratio of tariff revenue to imports, but there are only 24 products with customs revenue and our main dependent variable in a balanced sample. The limited range of products in the broad dataset with customs revenue is because Tableau regularly reported only the top products by level of import revenue using broad classifications. These products, however, comprised between 90 and 95 percent of all tariff revenue collected. Footnote 20 Another reason for missing tariff data is that many products were prohibited prior to the treaty of 1860, so did not have any reported tariff revenue or imports.Footnote 21 To study the removal of prohibitions, we have 63 products in a balanced sample, ten of which were prohibited for import prior to 1860.
A second data set includes highly detailed “sub-products” within the top nine broad product exports. The top nine are with respect to total export values in the 1850s. These nine product categories are silk, woolen and cotton cloth, wine, leather products, clothing, tools, raw silk, and raw wool. The share of these top nine exports in total French exports is very significant: 53.1 percent in 1848, 56.1 percent in 1860, and 50.4 percent in 1870.
For the period 1848–1872, we digitized imports and exports for all 189 sub-products within the top nine exports. This is the most disaggregated data in the published historical French trade statistics and is equivalent to data at the 4 or 5 digit SITC level. For this period, the original French nomenclature is homogeneous and stable. We have the following subproduct counts: clothing (4), raw wool (5), tools (48), leather (24), raw silk (16), cotton cloth (24), wool cloth (20), silk cloth (44), and wine (4). After combining several sub-products from the 189, we have 180 sub-products.Footnote 22
For 156 of these sub-products, data on total customs duties collected and our key dependent variable are available. We, therefore, can calculate the ad valorem equivalent of tariffs by sub-product. Finally, we classify sub-products as prohibited prior to 1860 based on having zero imports in all years prior to 1860 and with reference to Lack (Reference Lack1861). When we study the removal of prohibitions, we have 178 products, with 36 of them prohibited prior to 1860.
Trade Policy and Intra-Industry Trade
Measuring Trade Liberalization in Mid-Nineteenth Century France
Figure 1 shows the share of trade in GDP. France became increasingly “open” to trade in the mid-nineteenth century in the wake of the generalized decline in trade costs associated with the first wave of globalization (Jacks, Meissner, and Novy Reference Jacks, Meissner and Dennis2010). In addition, the trade surplus showed a secular decline. This decline was noted by contemporaries, and as has been discussed elsewhere (Levy-Leboyer and Bourguignon Reference Levy-Leboyer and François1985, Reference Levy-Leboyer and François1990). Footnote 23

Figure 1 Evolution of the Ratio of Total Trade (Exports + Imports) to GDP and the Ratio of the Trade Balance to GDP, 1848–1872
Notes: Cubic polynominal trends are super-imposed with dashed lines.
Sources: Trade data are from the Tableau. We proxy current price GDP data with current price value added from Toutain (Reference Toutain1987) as reported in Smits, Woltjer, and Ma (Reference Smits, Woltjer and Ma2009).
Figure 2 studies the evolution of average ad valorem equivalent tariffs (customs revenue divided by total imports) for six manufactured products (silk, woolen, and cotton cloth, tools, clothing, leather products), three intermediates (cotton, wool, and linen threads), and two raw materials (raw silk and raw wool). Figure 2 shows there is a small decrease of 2 percentage points (roughly 13 percent) between 1848–1851 and 1856–1859 for the six manufactured goods. However, there is a much larger decrease evident between 1856–1859 and 1869–1872. This represented an economically significant 45 percent decline.

Figure 2 Average Tariff Rates for Six Final Manufactured Products, Three Intermediates, and Two Raw Materials, 1848–1851 to 1869–1872
Notes: Figure shows the average ad valorem equivalent tariff for three categories of products: (1) six broad product ranges of manufactured goods (clothing, leather, tools, wool cloth, cotton cloth, and silk cloth), (2) raw silk and raw wool, and (3) threads (cotton, wool, linen). Tariffs are the weighted average tariffs in ad valorem equivalent terms given by the ratio of total customs duties for all sub-products in the product groups to the total value of imports in the product group. Tariffs are calculated with annual data and then arithmetically averaged within each three year period.
Source: Tableau.
Figure 2 also plots the average tariffs for two raw materials (raw silk and wool) and three intermediates (cotton, wool, and linen thread). Lower ad valorem equivalent tariff rates for raw wool and silk are evident from the mid-1850s. After 1860, statutory tariffs fell for key manufactured goods and manufactured intermediates like cotton thread with the drop in manufactured goods tariffs being phased in by treaty between 1861 and 1864. Note that for some of these products, especially manufactures of cotton cloth, many products were prohibited from import prior to 1860. These figures surely understate the reduction in trade barriers over time. In our analysis later, we use both changes in tariffs, where available, and the removal of prohibitions as measures of liberalization. It is difficult to quantify the magnitude of liberalization using only changes in tariffs, so it is crucial to include the removal of prohibitions as well.
Tariff rates against Great Britain on elaborated manufactured goods were phased in between 1860 and 1864, as per the Cobden-Chevalier treaty. In the years after 1860, 11 new treaties with major European nations further lowered the average tariff rate for most major trading partners. The treaty system, combined with the unconditional MFN clause, implied France would be locked into a low tariff equilibrium for many years after 1860.
Measuring the Level of Intra-Industry Trade
In order to shed light on the transformation of international competition, we study the evolution and determinants of intra-industry trade measures in our different data sets. The basic Grubel Lloyd index (GL) of intra-industry trade at the aggregate level is defined as
 $$GL = 1 - {{\sum\nolimits_i^N {\left| {{X_i} - {M_i}} \right|} } \over {\sum\nolimits_i^N {({X_i} + {M_i})} }},$$
where X i and M i are exports and imports of (broad) product i (i = 1,…,104) and N is the number of products. This index ranges from 0 to 1 and measures the percentage share of trade that is “matched,” so that when exports equal imports, GL is equal to one. GL can also be measured at the product level as
 $$1 - {{\left| {{X_i} - {M_i}} \right|} \over {({X_i} + {M_i})}}.$$
Another alternative, the Aquino index (AI), is defined as
 $$AI = 1 - {1 \over 2}\sum\limits_i^N {\left| {{{{X_i}} \over {\sum\nolimits_1^N {{X_i}} }} - {{{M_i}} \over {\sum\nolimits_1^N {{M_i}} }}} \right|} .$$
The Grubel Lloyd index corrected for aggregate trade imbalances is defined as
 $${\rm{Corrected}}\,{\rm{Grubel}}\,{\rm{Lloyd Index}} = {{\sum\nolimits_i^N {({X_i} + {M_i}) - \sum\nolimits_i^N {\left| {{X_i} - {M_i}} \right|} } } \over {\sum\nolimits_i^N {({X_i} + {M_i}) - \left| {\sum\nolimits_i^N {{X_i} - \sum\nolimits_i^N {{M_i}} } } \right|} }}.$$
Figure 3 shows the evolution of these indicators. The GL, Aquino, and corrected Grubel-Lloyd indexes are highly correlated. Because of this high correlation, we will rely on the GL index in our reported results as a basis for our analysis. Intra-industry trade as a share of total trade rises from 12–14 percent in 1859–1860 to 38 percent in 1872. A notable acceleration is evident in the 1860s, coincident with liberalization.
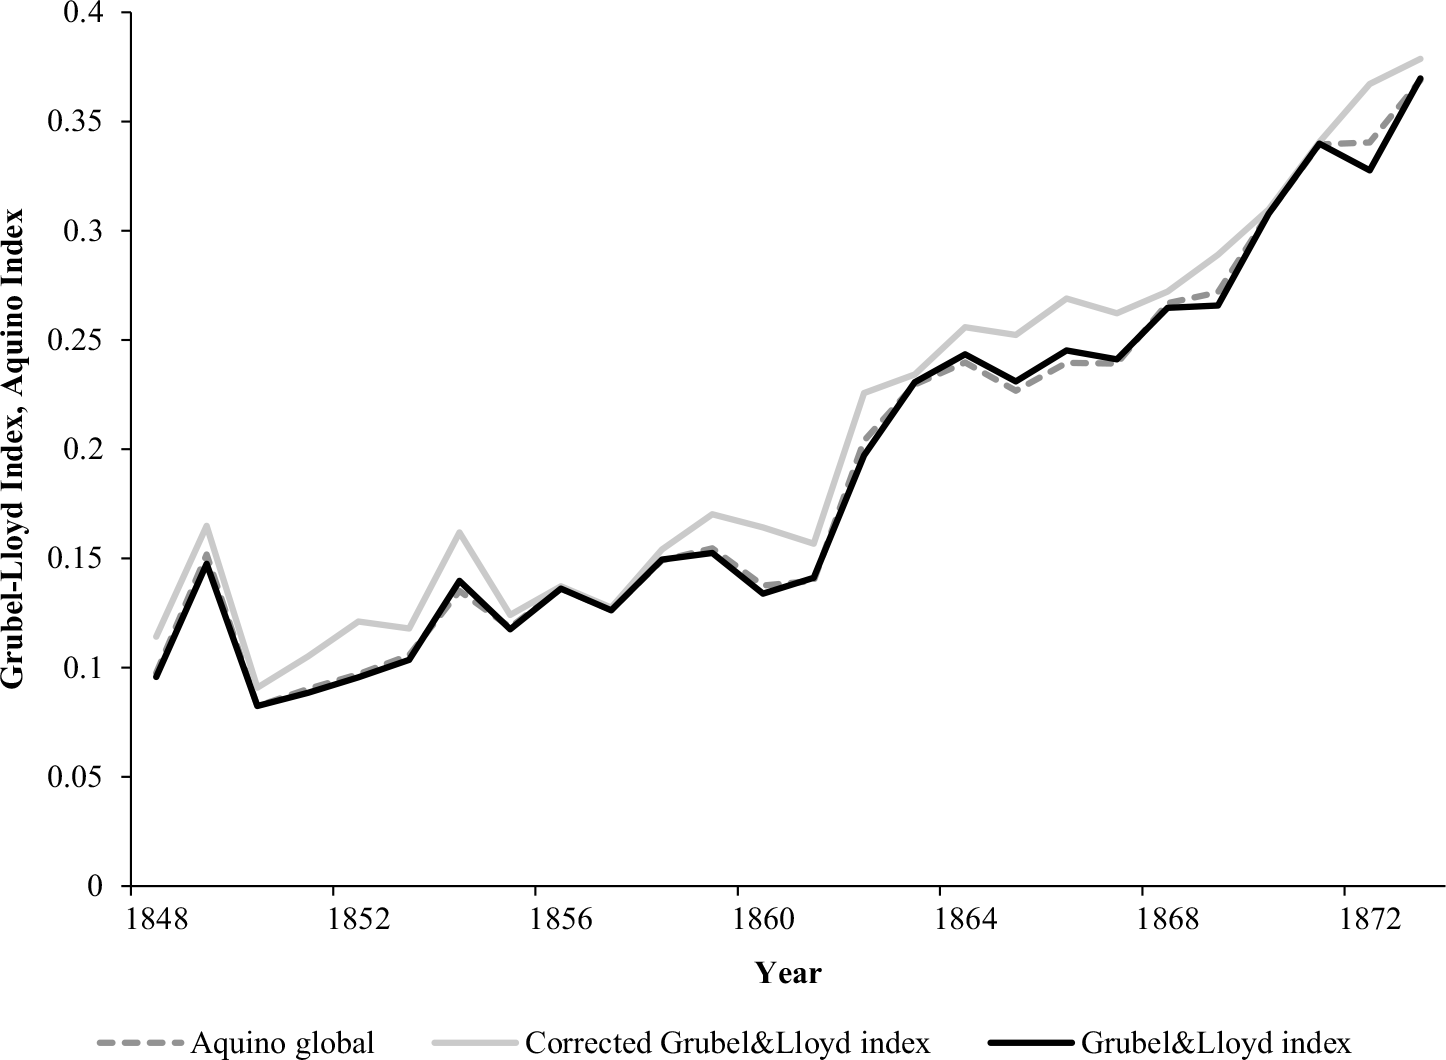
Figure 3 Grubel-Lloyd and Aquino Indexes, 1848–1872
Notes: Figure shows the Grubel Lloyd, Corrected Grubel-Lloyd, and Aquino indexes of intraindustry trade for 104 broad products.
Source: Tableau.
Measuring “Marginal” Intra-Industry Trade and Specialization Shifts
In looking at the dynamics of trade, the GL index has some drawbacks, as discussed in Greenaway et al. (Reference Greenaway, Hine, Milner and Elliott1994). The GL index can obviously rise when net exports fall, due to rising imports, with constant exports. It is of importance to study the overall share of trade that is “matched” in levels with the GL measure. However, it is also useful to investigate dynamics by looking only at changes in trade.
The methodology developed by Bastos and Cabral (2007) allows us to decompose changes in trade flows into the fraction of the change in trade accounted for by intra-industry trade. This “marginal” decomposition provides an index of the share of the change in total trade accounted for by “matched” intra-industry trade. We can also measure growth in trade flows due to increased specialization as a residual.
Bastos and Cabral (2007) “decompose the trade change into three different components: ‘marginal intra-industry trade’ (MIIT), interindustry trade growth that contributes to an increase in a country’s previous specialization (IPS), and inter-industry trade growth that contributes to a decrease in a country’s previous specialization (SS).” For the first, define MIIT from Brülhart (Reference Brülhart1994) as
 $$MII{T_{it}} = 1 - INTE{R_{it}} = 1 - {{\left| {\Delta {X_{it}} - \Delta {M_{it}}} \right|} \over {\left| {\Delta {X_{it}}} \right| + \left| {\Delta {M_{it}}} \right|}}.$$
Bastos and Cabral (2007) note that the portion of trade not allocated to marginal intra-industry trade can be classified in one of two ways as follows:
 $$INTE{R_{it}} = \matrix{
{IP{S_{it}}\,{\rm{if}}\,{\rm{sign}}\,\Delta {X_{it}} - \Delta {M_{it}} = {\rm{sign}}\,({X_{i0}} - {M_{i0}})} \hfill \cr
{S{S_{it}}\,{\rm{if}}\,{\rm{sign}}\,\Delta {X_{it}} - \Delta {M_{it}} \ne {\mathop{\rm sign}\nolimits} \,({X_{i0}} - {M_{i0}})} \hfill \cr
} $$
$$INTE{R_{it}} = \matrix{
{IP{S_{it}}\,{\rm{if}}\,{\rm{sign}}\,\Delta {X_{it}} - \Delta {M_{it}} = {\rm{sign}}\,({X_{i0}} - {M_{i0}})} \hfill \cr
{S{S_{it}}\,{\rm{if}}\,{\rm{sign}}\,\Delta {X_{it}} - \Delta {M_{it}} \ne {\mathop{\rm sign}\nolimits} \,({X_{i0}} - {M_{i0}})} \hfill \cr
} $$
In these expressions, ΔX it and ΔM it are respectively the change in exports and imports between period t and a base period for product i. MIIT measures the share of the growth in exports for product i matched by a rise in imports. Like the Grubel-Lloyd index, MIIT varies between 0 and 1. If MIIT equals 1, trade expansion is entirely “matched” and is wholly intra-industry. If MIIT = 0, the entirety of the growth in trade is of the inter-industry type. The MIIT index can be calculated at the aggregate level as well as within trade partner product combinations. It is useful to keep in mind that MIIT is strictly decreasing in the absolute value of the change in net exports while the GL index can increase when net exports decrease.
For inter-industry trade, X i0 and M i0 are, respectively, the exports and imports in a product in an initial period 0. IPS represents movements in trade that contribute to an increase in a previous specialization. For instance, a product in which France was a net exporter in the initial period and for which exports grew faster than imports would assign INTER to IPS. Similarly, if in a product France was initially a net importer and imports rose faster than exports, then we also assign INTER as IPS. Footnote 25
SS represents inter-industrial movements that involve shifts in specialization. Movements here contribute to a weakening of a previous specialization through lower net exports in industries where net exports were initially positive or through lower net imports when net exports were initially negative. To understand changes in SS, consider a particular product where imports are limited by the trade policy regime of the 1850s. Net exports are initially higher (or no lower) than under the low tariff policy of the 1860s (ceteris paribus) due to the negative impact of tariffs or prohibitions on imports. Liberalization, causing a rise in imports, not matched by exports, and hence a decrease in the net exports of such a product, would be associated with higher values of SS.
Coming back to the example of a rising GL index with falling net exports allows us to see the difference between the marginal measures (MIIT, SS, and IPS) and the levels measure (GL). If net exports were positive prior to liberalization and only imports rise post-liberalization, then GL would rise, MIIT is zero, and SS is positive. The difference IPS – SS, the variable we study in the empirics later, would be negative. In other words, on the margin, France shifted specialization by reducing net exports of this product. However, one might be interested in the overall level of intra-industry trade in the long run. For this, the GL measure in levels dominates. We study both types of variables.
For an aggregate value of MIIT, we calculate the weighted average of each product’s decomposition using initial trade values as weights. We also smooth the trade data over four-year periods to minimize the impact of short-run shocks. Our initial reference period for the first difference is 1848–1851. The evolution of MIIT, IPS, and SS are presented in Table 2 for all 104 broad products and the top nine specializations of France using the disaggregated sub-products found in the top nine specializations.
Table 2 Decomposition of Growth in Gross Trade (Percent X 100), 1848–1851 to 1869–1872

Notes: Table presents the shares of the growth in exports and imports accounted for by MIIT (marginal intra-industry trade), IPS (increases in previous specialization), and SS (shifts in specialization) in percentage terms (x 100). Underlying trade data are for 104 broad products and the top nine exports averaged within four year periods. The MIIT, IPS, and SS are weighted averages across all products with weights equal to a product’s share in the sum of the absolute change of total exports and the absolute change of total imports (|ΔX t | + |ΔM t |) in the base period. The base period for calculating changes is with reference to 1848–1851 except in the final four rows where it is 1856–1859.
Sources: Tableau and authors’ calculations.
Table 2 shows a sharp increase in the share of trade growth accounted for by intra-industry trade in the wake of the 1860 liberalization. At the same time, increased international competition is associated with a deceleration in the overall degree of specialization, as seen by the declining share of trade growth accounted for by IPS. The share and trends in SS are less pronounced. For all products, prior to liberalization, SS accounted for 15 percent (1852–1855) or 8 percent (1856–1859) of trade growth. In the 1870s, these values vary between 10 and 12 percent.
Figure 4 gives a rough indication of the connection between liberalization and intra-industry trade over time. We plot MIIT and GL for two four-year periods prior to 1860 and for three four-year periods after 1860 for disaggregated products from the top nine exports. We classify products into two groups based on the change in ad valorem equivalent tariffs after 1860. We define a group of products to have “high tariffs” if the deviation of the log of one plus the ad valorem equivalent of the tariff from its within product sample average is higher than the median of all products. “Low tariff’ products are below the median and correspond roughly to the products undergoing the most significant liberalization in terms of tariffs after 1860. Figure 4 shows the evolution of our intra-industry measures within these two rough categories. Presented this way, it is difficult to see any obvious connection between intra-industry trade and changes in tariffs. Results are qualitatively similar using the broad products data set. We now proceed to more formal regression tests, which control more carefully for liberalization at the product level. Our goal is to test the idea that liberalization mattered for intraindustry trade using product-level data and to measure the quantitative impact.

Figure 4 Intra-Industry Trade Measures before and after the Cobden-Chevalier Treaty by Tariff Category, Disaggregated Products
Notes: Figures show the evolution of MIIT or the GL indexes of intra-industry trade before and after France signed the Cobden-Chevalier treaty. High tariff products had deviations in the liberalization period from their within product sample average above the sample median. Products in the low tariffs category, the most liberalized products, had their within product deviation below the median.
Sources: Tableau and authors’ calculations.
Trade Liberalization and Intra-Industry Trade: Methods
We evaluate the impact of liberalization on intra-industry trade by assigning, whenever possible, each product in the broad product dataset a quantitative measure of liberalization. We use either the logarithm of one plus the ad valorem equivalent tariff or an indicator equal to one if a product was prohibited prior to 1860 but not after 1860. We then relate intra-industry trade measured by GL or MIIT to the tariff variable or the prohibitions indicator using a difference-in-differences approach.
Another dependent variable we use to check the robustness of our results is the level of intra-industry trade due to Greenaway et al. (Reference Greenaway, Hine, Milner and Elliott1994). This latter variable is calculated as
 $$II{T_{it}} = [({X_{it}} + {M_{it}}) - \left| {{X_{it}} - {M_{it}}} \right|]$$
and measures the value of gross trade not accounted for by inter-industry trade. This measure gives more importance to industries or products that have a larger share in trade and thus can give insight into the magnitude of the adjustment process. The correlation between changes in the GL index and IIT is low at 0.15. We also explore the logarithm of this variable as a fourth alternative dependent variable. Footnote 26
To study trade on the margin, we use MIIT as a dependent variable as well as the difference between IPS and SS (IPS – SS) following Bastos and Cabral (2007). IPS – SS is larger when specialization in revealed comparative advantage goods increases. It is smaller when shifts in specialization occur and net exports in a product decline. Our data are smoothed over four-year periods so that we have two pre-liberalization periods, 1852–1855 and 1856–1859, and three post-liberalization periods, 1861–1864, 1865–1868, and 1869–1872.
Our specifications using tariffs take the following form:
 $${y_{it}} = {\mu _i} + {\delta _t} + \beta [\ln (1 + {\rm{tariff}}{{\rm{s}}_{it}})] + {\varepsilon _{it}}$$
with y it being one of our five dependent variables (GL, IIT, ln(IIT), MIIT, or IPS – SS), i indexing a product, and t indexing a time period. Product fixed effects are included in μ i , period dummies are collected in δ t , and ε it is an error term. We cluster standard errors at the product level. Some products were prohibited prior to 1860, so we use the following alternative specification:
 $${y_{it}} = {\mu _i} + {\delta _t} + \gamma ({\rm{prohibitio}}{{\rm{n}}_i} \times {\rm{post}} - {1860_t}) + {\varepsilon _{it}}.$$
In the first model, we interpret β as the marginal impact on the dependent variable of a one log point increase in tariffs while γ is the relative percentage point rise in the dependent variable post-1860 for products that were prohibited prior to 1860 relative to products that were not prohibited. The comparison group in the latter could include products that had significant decreases in tariffs, but it may also include some products not experiencing significantly lower tariffs. We focus on the latter comparison group in a robustness check.
It is useful to pursue a specification using a measure of prohibitions as a complement to using changes in tariffs. First, it is impossible to assign a quantitative continuous tariff equivalent value of protection under a quantity restriction like a prohibition. Additionally, the removal of prohibitions plausibly represents a much larger and more significant move to liberalization than the tariff declines witnessed in the data. Tariffs fell by 45 percent for manufactured goods and 71 percent for threads (see Figure 2). These changes translate into 5 or 14 percent decline in prices facing consumers calculated as
 $${{(1 + {t_1})} \over {(1 + {t_0})}}$$
. Strictly prohibited items would generally have very high shadow prices assuming diminishing marginal utility and a love of variety. Even accounting for smuggling and evasion of border controls, the price of prohibited goods (and domestic near substitutes) would likely be more than 15 percent above “world” prices.
Footnote 27
$${{(1 + {t_1})} \over {(1 + {t_0})}}$$
. Strictly prohibited items would generally have very high shadow prices assuming diminishing marginal utility and a love of variety. Even accounting for smuggling and evasion of border controls, the price of prohibited goods (and domestic near substitutes) would likely be more than 15 percent above “world” prices.
Footnote 27
In terms of identifying assumptions, we note that the Anglo-French treaty of 1860 was largely unexpected. Earlier discussions and debates did take place, and there were also unsuccessful attempts to pass new lower tariffs, notably in 1856. Still, Napoléon III and the free traders failed to garner consensus throughout the 1840s and 1850s. The Cobden-Chevalier negotiations were free from direct lobbying by industrial interest groups since they were conducted in secret with no open debate. Moreover, the precise timing came as a shock given the secrecy surrounding negotiations. Due to the MFN clause, the trade policy changes negotiated with Great Britain, like the removal of prohibitions, would then be extended to the subsequent trade treaties signed in the 1860s. All in all, variation in trade policy was not due to direct lobbying, given the way Cobden-Chevalier was negotiated and subsequently extended. This alleviates concerns that the change in tariffs might be related to unobservables at the industry level that could also influence the level of intra-industry trade. Therefore we rely on this “exogenous” variation to measure the marginal impact of trade policy on intra-industry trade.
Trade Liberalization and Intra-Industry Trade: Evidence from Broad Products
Results for these regressions for the broad products sample are presented in Table 3. In general, lower tariffs are associated with higher measures of intra-industry trade. A one standard deviation decline in the tariff variable (= −0.14) is associated with a rise in intra-industry trade equal to 0.34 standard deviations of the GL variable (std. dev. = 0.34).Footnote 28 Similarly, MIIT is also significantly higher for products that had larger declines in tariffs during this period. Column (3) shows that, on the margin, France also may have increased its specializations in products that had relatively large declines in tariffs. That is, IPS − SS is predicted to rise more in products that had large declines in tariffs.
Table 3 The Grubel-Lloyd and Other Intra-Industry Trade Indexes Versus Liberalization, 1852–1855 to 1869–1872, Broad Products

Notes: Dependent variable is stated at the top of each column and defined in the text. Data are smoothed within four year periods with simple arithmetic averaging. Data comprise all broad products in official trade data in the Tableau with balanced data available through time. Estimation is by OLS. Robust standard errors in brackets are clustered at the product level.
Sources: Tableau and authors’ calculations.
Columns (4) through (6) report evidence that products that had previously been prohibited experienced larger increases in intra-industry trade than those not previously prohibited. Column (4) shows that after 1860, products previously prohibited had an average GL index that was 0.18 points or 0.62 standard deviations higher than those which were not previously prohibited. Column (5) finds that products prohibited prior to 1860 had an average MIIT that was 0.20 points higher after 1860. This is equivalent to 0.68 standard deviations of the dependent variable. The coefficient (reported in Table A2) on pre-1860 prohibitions is not statistically significant for IIT or ln(IIT). The coefficient is negative and significant for IPS – SS. The latter suggests that some portion of the adjustment to the removal of prohibitions was also due to lost specialization. This is the opposite of the finding to the result in Column (3), suggesting that this finding is sensitive to the sample of products involved. Overall at the aggregate level, however, as Table 2 shows, MIIT and IPS account for a large share of changes in trade, and the IPS – SS is on average positive.
We also explore “event study” regression models using GL as the dependent variable. We use the period 1856–1859 as the reference period and report results from the following regression:
 $$G{L_{it}} = {\mu _i} + {\delta _t} + \sum\limits_{t = 1851/54}^{1869/72} {{\gamma _t}({\rm{prohibitio}}{{\rm{n}}_i} \times {\delta _t}) + {\omega _{it}}} $$
where we allow for separate marginal effects by period. The coefficients γ t estimate the impact of the removal of prohibitions on GL relative to products never prohibited. The omitted period is 1856–1859. The top panel of Figure 5 shows that the point estimate is small and statistically insignificant in the period 1852–1855, while it becomes larger and more significant post-1860. In the last two periods, 1865–1868 and 1869–1872, the coefficients are statistically significant and in the range of the constrained DiD coefficient from Table 3. These results suggest that the GL indexes for prohibited products were not changing differentially prior to Cobden-Chevalier, and so “pre-trend” problems are not evident.

Figure 5 Event Study of the Impact on the Grubel-Lloyd Index of the Removal of Pre-1860 Prohibitions, Broad Products (Top Panel), and Sub-Products from the Top Nine Exports (Bottom Panel) 1852–1855 to 1869–1872
Notes: Figures show OLS estimates of the coefficient on the interaction of whether a product was prohibited prior to 1860 and a period dummy (points) and 95 percent confidence intervals based on clustered standard errors (bars). These averages are estimated in a panel fixed effects model with product fixed effects. The omitted period is 1856–1859. The vertical line divides the periods before and after the signing of the Cobden-Chevalier treaty.
Sources: Tableau and authors’ calculations.
In terms of robustness, we also interacted the tariff variable and the prohibition x post-1860 variable with a manufactures indicator to check for heterogeneity in the impact of liberalization. By and large, the total effect, as well as the interaction terms alone, are statistically insignificant, suggesting that two-way trade became equally predominant across the product space post-1860. Given that the dependent variables GL and MIIT range between 0 and 1, we tried running Poisson regressions for Columns (1), (2), (4), and (5) in Tables 3 and 4. Results are qualitatively similar to the reported results and often show higher levels of statistical significance. Results using the OLS and the alternative dependent variables IIT and its logarithmic form are reported in Appendix Table A2.
Table 4 The Grubel-Lloyd and Other Intra-Industry Trade Indexes Versus Liberalization, 1852–55 to 1869–72, Sub-Products from the Top Nine Exports

Notes: Dependent variable is stated at the top of each column and defined in the text. Data are smoothed within four year periods with simple averaging. Data comprise all sub-products from the top nine exports in the official trade data and with balanced data available through time. Estimation is by OLS. Robust standard errors in brackets are clustered at the sub-product level.
Sources: Tableau and authors’ calculations.
Another robustness check recognizes that the control group in Columns (4) through (6) is broad and includes products that also had substantial declines in tariffs. We used instead a circumscribed range of products that did not experience significant liberalization post-1860. We limit this “non-liberalized” control group to products with changes for all postperiods relative to 1856–1859 in the ad valorem equivalent of tariffs above −2.5 percentage points. There are 11 such products, including silk cloths, iron and steel, cheese and butter, and raw animal skins. Using this alternative control group and GL as the dependent variable, we still find a largely positive and statistically significant coefficient on the prohibition/ post-1860 interaction of 0.22 (p-value = 0.018).
Liberalization and Intra-Industry Trade: Evidence from Sub-Products within the Top 9 Exports
In a similar spirit to Table 3, Table 4 uses value data for sub-products in the top nine broad product categories for which we have data and a balanced sample. We use the same dependent variables (GL, MIIT, and IPS – SS) as in Table 3, and specifications are similar to those from Table 3 as well. We use fixed effects at the sub-product level in this case and cluster standard errors at the sub-product level.
Table 4 is largely consistent with Table 3, although the standard errors of our point estimates are somewhat noisier. This is possibly due to heterogeneity in the association between liberalization and the dependent variables in this particular sample. We explore this later. In terms of the point estimates, products that had greater declines in tariffs or which were no longer prohibited had larger increases in the measures of intra-industry trade. The coefficient on the log of one plus the (ad valorem equivalent) tariff is −0.43 and is statistically significant when GL is the dependent variable in Column (1) of Table 4. The coefficient on the pre-1860 prohibitions indicator is significant for GL, IIT, and MIIT at better than the 10 percent level. The coefficients on IPS – SS are not statistically significant, implying that at this level of disaggregation, intra-industry trade is dominant. Results using IIT and ln(IIT) are reported in Table A3.
Results from an event study of the removal of pre-1860 prohibitions are in the bottom panel of Figure 5. We again use GL as the dependent variable. Here the pre-event coefficient is estimated to be near zero and is not statistically significant. The post-1860 coefficients are positive and are roughly equal to the difference-in-differences coefficient of 0.09 from Column (4) of Table 4. The only post-1860 coefficient significant at better than the 5 percent level is the 1861–1864 period, however, the coefficient for 1865–1869 has a p-value of 0.143 while the coefficient for 1869–1872 has a p-value of 0.086. For an event study using MIIT as the dependent variable, the coefficients for 1861–1864, 1865–1868, and 1869–1872 are 0.05 (p-value = 0.22), 0.06 (p-value = 0.22), and 0.1 (p-value = 0.06), respectively. Evidently, with fewer observations and degrees of freedom in each period, the results are slightly noisier than in the pooled model of Table 4 Column (4).
We also investigated other specifications as in Table 3. The first test re-runs regressions using products with pre-1860 prohibitions as a treatment group and the control group of sub-products with rises in tariffs or only small declines (defined as changes in the ad valorem equivalent of > −0.025). Here we find results highly consistent with Columns (4) and (5) of Table 4. For instance, the coefficient on the GL indicator is 0.1 instead of 0.09 and has a p-value of 0.055.
We also interacted the tariff variable and the pre-1860 prohibition and post-1860 interaction term with an indicator for manufactured goods. Results are reported in Columns (7) through (10). The manufactured goods comprise all the sub-products in the broad categories of wool cloth, silk cloth, cotton cloth, clothing, leather, and tools. The comparison group of non-manufactured goods includes raw wool and raw silk as well as wine. Because of the special nature of wine, and its heavy reliance on climate, geography, soil quality, and the agricultural commodity of wine grapes, we leave wine out of the manufactured category for now. Tariff changes between 1856–1859 and 1865–1868 are highly concentrated among the manufactured goods with much greater variation in this class of products. The average change for non-manufactured goods is −0.02 (s.d. = 0.03) while for manufactured goods it is −0.12 (s.d. = 0.13). Removal of prohibitions is concentrated on manufactures too. For non-manufactures in the sample, only 1/5 of the products had pre-1860 prohibitions, while for manufactures, 60 percent of them had pre-1860 prohibitions.
We find that the interaction term (tariffs x manufacturing) is insignificant for all five dependent variables while the main effect has the sign and statistical significance of the coefficients in Table 4. This result is not surprising given the high correlation between changes in tariffs and manufactured products. On the other hand, the interaction term is highly significant when the treatment variable is the pre-1860 prohibition x post-1860 indicator. This suggests the removal of prohibitions after 1860 may have stimulated intra-industry trade to a greater degree for manufactured sub-products among the top nine exports for France. This seems reasonable given that manufactured goods, the focus of new trade theory models, are typically more differentiated.
Results using GL and MIIT as the dependent variables are in Columns (9) and (10) in Table 4. The coefficient on the triple interaction of the pre-1860 prohibition, manufactured product indicator, and the post-1860 indicator is 0.10 with a p-value of 0.000. Evidently, the result from the standard difference-in-differences model in Column (4) of Table 4 is being driven by the manufactured sub-products. The coefficient on the triple interaction term when MIIT is the dependent variable is 0.06 (p-value = 0.000), while the main effect is 0.01 with a p-value of 0.834.
Table 5 attempts to disentangle whether variation in the GL index is being driven by changes in exports, imports, or both. “New” trade theory suggests that liberalization will promote imports but may also raise exports, especially if foreign markets also liberalize, ultimately leading to higher levels of intra-industry trade. In the standard new trade theory models, the trade balance (at the product level) is likely to be unaffected by liberalization. Factor endowment and Ricardian theories of trade assert clearly that trade liberalization leads unambiguously to higher or lower net exports depending on comparative advantage.
Table 5 Exports, Imports, and Net Exports Versus Liberalization, 1852–1855 to 1868–1872

Notes: Dependent variable is given at the top of each column. X stands for exports, M for imports. Time dummies and sub-product or product dummies are included but not reported. See text for formulae. Data are smoothed within four year periods with simple averaging. Estimation is by OLS. Robust standard errors in brackets are clustered at the product or sub-product level.
Sources: Tableau and authors’ calculations.
We investigate the relationship between our measures of liberalization and three related dependent variables: the log of exports, the log of imports, and the log ratio of exports to imports. When trade values are zero, we add 0.000001 to the value and then take the log. The left-hand portion of Table 5 uses the sample of 104 broad products. The right-hand portion uses the sub-products from the top nine exports.
In both samples, we find that imports grew more strongly the larger the fall in tariffs. The elasticity of imports to a 1 percent decline in the ad valorem equivalent tariff is 4.7 percent for the broad product sample and 2 percent for the sub-products sample. The elasticity for exports is smaller than for imports in both samples and statistically insignificant. When we use net exports as the dependent variable in Columns (3) and (9), the coefficients on tariffs are not statistically significant. This result indicates that tariff liberalization did not produce a result consistent with factor endowment-driven trade models, which predict either a rise in net exports or net imports depending on comparative advantage.
We also analyze the removal of prohibitions. After the removal of prohibitions, imports of such products grew between 1 percent (broad products) and 1.8 percent (sub-products) faster after 1860 than imports of products that were not previously prohibited. Exports of previously prohibited products grew about 0.5 percent more slowly compared to products not previously prohibited. Columns (6) and (12) show that net exports tended to decline after 1860 for products that were previously prohibited. This result contrasts with Columns (3) and (9) and demonstrates the possibility that the removal of prohibitions allowed imports to grow more quickly than exports. This is still consistent with “new” trade theory since we already found that GL rose more quickly for such products and remained elevated even years after liberalization. Old trade theory may predict faster import growth than exports after liberalization (assuming comparative disadvantage), but it would not predict intra-industry trade. Moreover, the French removal of prohibitions likely favored foreign (i.e., British) manufactured imports but did less to promote French exports. Great Britain, for instance, already had a less restrictive trade policy (i.e., no prohibitions and moderate tariffs) on most manufactured imports from France even prior to 1860.
The message from Table 5 is that liberalization undoubtedly intensified import competition. The impact on exports relative to imports was contingent on the policy approach chosen (lower tariffs or removal of prohibitions). Changes in tariffs are not statistically associated with changes in net exports. The removal of prohibitions is associated with lower net exports of such products.
Nevertheless, as discussed previously, the GL index can rise even if only imports rise and exports are constant or are growing more slowly. Therefore, these results are also consistent with the observed association between the GL indexes and liberalization found in Tables 3 and 4. Greater intra-industry competition is associated with liberalization at the product level. This is in line with what “new” trade models developed since the 1970s driven by a “love-of-variety,” would predict. Trade liberalization promotes greater imports, but at the same time, exports in similar products are also stimulated, or at least they are not strongly diminished. The result of liberalization in such models and ostensibly in 1860s France, is greater intra-industry trade.
Discussion and Implications for the Economic History of International Trade
The treaty of commerce signed between France and Great Britain on 23 January 1860 was one of the most significant events for international trade up to that point. The treaty led to a number of follow-on treaties that locked major European nations into a self-enforcing low-tariff equilibrium (Coutain Reference Coutain2009). The new MFN tariff rates established with the Cobden-Chevalier treaty were generally applied to the later treaties.
The post-1860 liberalization can be considered largely exogenous to the demands of specific industries in France. Being unexpected and motivated by broader ideas and concerns about economic development allows us to use the 1860s as a natural experiment to directly study the impact of liberalization on intra-industry trade. This also provides indirect and suggestive evidence of how the process of adjustment to trade liberalization in France played out.
We show evidence consistent with the idea that France may have had a relatively smooth adjustment. This is in line with new international trade theories and inconsistent with factor endowment-driven trade models. Products that had larger declines in tariffs or which were no longer prohibited witnessed larger increases in standard measures of intra-industry trade.
Following conclusions from the modern empirical trade literature, which has made similar findings since the 1960s (e.g., Balassa Reference Balassa1966), the liberalization of the 1860s would therefore not be expected to impose significant inter-sectoral changes in French specialization. After 1860, France continued exporting unique brands or “varieties” in specific product lines that were liberalized only now with more import competition. Intra-industry trade is often considered to be a twentieth-century feature of the data, but it appears to constitute the basis of a large share of trade in late-nineteenth-century France.
We also contribute to a recent debate in economic history about the size of the shock in trade liberalization in the 1860s. This issue, driven by results in Accominotti and Flandreau (Reference Accominotti and Marc2008), Sharp (Reference Sharp2010), and Tena-Junguito, Lampe, and Tâmega Fernandes (Reference Tena-Junguito, Lampe and Tâmega-Fernandes2012), shows that the status of prohibitions appears crucial to our interpretation of trade policy in this period. The vast majority of woolen and cotton fabric imports were prohibited in France prior to 1860. The shock of the Cobden-Chevalier treaty was, therefore, potentially quite large for these product classes. We find evidence consistent that the range of products traded in France was affected by the trade treaties of the 1860s.
International competition undoubtedly stiffened in the 1860s. In terms of adjustment to this competition, less is known, despite many important contributions on the “grain invasions” and the subsequent “tariff backlash” (Gourevitch Reference Gourevitch1977; O’Rourke Reference O’Rourke1997). In light of this, we hypothesized that adjustment costs for the most liberalized sectors may not have been that high. The data are consistent with this view. Ostensibly, the benefits of free(er) trade were greater than those under alternative, more autarkic policies. Footnote 29
Dunham (Reference Dunham1930) details the fortunes of several key industries in France (iron and steel, cotton spinning and weaving, silk, woolens, wine, etc.) in the 1860s. While systematic census data is unavailable, he suggests that heightened competition incentivized upgrades to machinery, techniques, processes, and products and that liberalization generally promoted economic growth. He also argued advanced mechanization in cotton spinning and weaving, one of the French industries expected to be hit hardest by liberalization because of British competition, proceeded more quickly after 1860 than prior to 1860.
In addition, particular industries faced various exogenous shocks in the 1860s unrelated to trade policy. Notably, the cotton industry (in France and abroad) suffered from the cotton famine induced by the American Civil War. Hearings by the French government in 1870 suggested that the cotton industry suffered from the decline in tariffs, but Dunham attributes their difficulties to these other shocks that were global in nature and not specific to French trade policy. Moreover, there is not any quantitative evidence that greater imports of British cotton manufactures due to the removal of prohibitions had eliminated or reduced French exports and production.
The iron and steel industry benefitted from a demand shock associated with the construction boom in railway buildings in the 1850s and 1860s. In the 1860s, woolens benefitted from a large increase in the supply of high-quality raw wool from Australia and Argentina. It is important to note that these shocks would have also affected France’s major trading partners to a similar degree and that they were largely determined by forces unrelated to internal economic dynamics in the French economy. These could not have been foreseeable in the late 1850s when tariff policy was being made.
In the 1990s, economists studying the acceleration of globalization emphasized the idea that increases in intra-industry trade involve a very different (and less costly) adjustment process than those associated with increased inter-industry trade and shifts in specialization (Greenaway et al. Reference Greenaway, Hine, Milner and Elliott1994; Hamilton and Kneist Reference Hamilton and Paul1991). Brülhart and Elliott (Reference Brülhart and Elliott2002) discuss the “smooth adjustment hypothesis,” which states that liberalization might be less disruptive and adjustment dynamics less costly when trade expansion is intra-industry. Inter-industry trade would imply that large sectoral re-allocations would have to take place, implying short-run unemployment of specific factors. Our results situate the mid-nineteenth century into this debate.
Conclusion
Intra-industry trade was characteristic of the first wave of globalization. Such “two-way” trade rose significantly in France after 1860. At the micro-level, we find that products experiencing greater liberalization after 1860 in France experienced faster growth in standard measures of intra-industry trade.
Our data are consistent with the idea that intra-industry trade was one way that industries in France were able to avoid a massive and costly re-allocation of factors of production in response to the intensified competition of the first wave of globalization. Our evidence shows significant empirical evidence of “smooth adjustment” in France in the 1860s. Products that were more strongly liberalized seem to have relatively higher rises in intra-industry trade.
There are many potential ramifications for understanding the ongoing diffusion of the industrial revolution in this period and the nature of the gains from trade in this period. We believe that these issues deserve more study in France and elsewhere.


