


In the nineteenth century, European countries considerably extended their direct political control of large regions of Africa and Asia. The independent countries born from decolonization in the middle of the twentieth century inherited the administrative structure of colonial states. But what exactly did they inherit, weak or strong state capacity?
A government’s ability to provide public goods and implement efficient policies is a major ingredient of economic development, if only for “late-starters” (e.g., Gerschenkron Reference Gerschenkron1962; Adelman and Morris 1997; Amsden Reference Amsden2001). Yet, the history of state-building is still under-studied (Hoffman Reference Hoffman2015), and, until recently, the available evidence has disproportionately represented the experience of Western Europe and Western offshoots (Tilly Reference Tilly1990; Lindert Reference Lindert2004), or non-colonized countries in Asia (Yun-Casalilla, O’Brien, and Comín Comín 2012; He Reference He2013). The theoretical literature on state capacity has focused on decisions made within formally independent countries (Besley and Persson 2011), while the majority of today’s states are direct successors of colonial administrations.
Influential work in the historical and political science literature views colonial states, at the same time, as very powerful and very weak. Young (Reference Young1995) describes the African colonial state as a Leviathan, displaying “the purest modern form of autonomous bureaucratic authority” (p. 160). In contrast, Herbst (Reference Herbst2000) characterizes the African colonial state as “administration on the cheap” (p. 73) with “limited ambition” (p. 77) and an unwillingness and inability to extend its control. For Cooper (Reference Cooper2002), African colonial states were “gate-keeper states” (p. 5), able to control the trade flows in and out but unable to extend power inwards. Outside of Africa, Booth (Reference Booth2007) credits the colonial states of South-East Asia for some effective developmental action, though she underlines that most of the historiography before her describes them as minimalist “night watchmen.”
In recent years, the literature on colonial states has received many additions. Earlier work has focused on the British empire in sub-Saharan Africa (Frankema Reference Frankema2010, Reference Frankema2011; Gardner Reference Gardner2012), but other colonial empires have received increased attention, like the Portuguese empire (Havik, Keese, and Santos 2015; Alexopoulou and Juif 2017), or the Belgian Congo (Gardner Reference Gardner, Frankema and Buelens2013). The French empire is relatively understudied, with most works focusing on French West Africa. Huillery (Reference Huillery2014) estimates the cost of colonizing West Africa for the French taxpayer. Andersson (Reference Andersson2017) studies the determinants of tax revenue in four French West African colonies. Van Waijenburg (2018) estimates the contribution of forced labor to colonial state revenue from 1913 to 1937 in French sub-Saharan Africa. López Jerez (Reference López Jerez, Frankema and Booth2019) studies fiscal development in French Indochina. As for comparative work, Frankema and van Waijenburg (2014) analyze fiscal capacity in British and French sub-Saharan Africa, while Frankema and Booth (2019) recently published an edited volume on the comparison of colonial fiscal capacity in Asia and Africa.
Three important questions on colonial states are not completely settled in the existing literature: (1) How fiscally extractive were colonial states? (2) What was the colonial states’ capacity to provide public goods and services? (3) As the intentions of colonialism appeared to change in the last 15 years of colonization, the era of “developmentalist colonialism” (Cooper Reference Cooper2002), did the capacity of colonial states change? The reason why these questions are not settled is that they come with specific methodological challenges, in particular, in terms of data availability. In this article, we contribute to answering these questions, taking the French empire as a case study. We produce a new database on French colonial states from the beginning of colonization to independence. This corresponds to 21 present-day countries in North Africa, sub-Saharan Africa, and Southeast Asia.
The first question we address is: How fiscally extractive were colonial states? The limited fiscal capacity of colonial states is a point that emerges quite consistently from the existing literature. Frankema and Booth (2019, p. 8) summarize the recent literature on fiscal capacity in sub-Saharan Africa as arguing “that colonial state budgets were small and, if anything, led to understaffed bureaucracies and underinvestment in public services rather than high tax burdens.” According to the same authors, “the opportunities to engage in international or imperial trade were the single most important determinant of the cross-colony variation in budget size” (p. 15).
The main challenge that emerges when studying the fiscal capacity of colonial states is the difficulty of producing comparable estimates of fiscal extraction. The vast majority of works on colonial fiscal capacity present estimates of real revenue per capita: this conflates the tax base and the tax rate since it is a measure of both “the prosperity of colonial subjects” and “the ability of the colonial state to raise revenue” (Gardner Reference Gardner, Frankema and Buelens2013, p. 136). Two methods have been used to produce estimates of fiscal revenue taking into account differences in the tax base: the first is to deflate the tax revenue by wages and express the revenue per capita in terms of days of work (Frankema Reference Frankema2010, Reference Frankema2011; Frankema and van Waijenburg 2014). The second is to rely on historical estimates of GDP per capita (Booth Reference Booth2007; Roy Reference Roy, Frankema and Booth2019; Andersson Reference Andersson2017): this is the approach we favor in this article. Its main advantage is to allow comparison with estimates of fiscal capacity in other areas of the world, as these estimates are typically expressed in GDP shares.
Another methodological aspect in producing comparable estimates of fiscal capacity is the necessity to consider all levels of public revenue, and not only the central government, to avoid conflating low fiscal capacity with decentralized administrative structure. Moreover, to ensure comparability, when estimating the revenue mix, it is always preferable to rely directly on detailed budget accounts rather than the classification of statistical abstracts that can vary over time.
We collected revenue data from approximately 1,700 primary sources, mainly detailed definitive budget accounts, considering all public authorities responsible for revenue and expenditure in the French colonies and all sources of public revenue. We produced estimates of GDP per capita in the French empire to express fiscal extraction in GDP shares.
We find that colonial states of the French empire had high extractive capacity. For instance, they extracted 9 percent of colonial GDP on average in 1925, and 16 percent in 1955. We show that these figures were above the average for independent countries in the same range of income per capita. Our tentative comparative analysis suggests that this high fiscal extraction was not a French specificity, but rather a general characteristic of colonial states in the twentieth century, whether French, British, or Japanese, and despite significant exceptions like British India or Nigeria, characterized by relatively low fiscal extraction. Within the French empire, local conditions mattered a lot for the type of fiscal instruments used but fiscal extraction was high everywhere, and the tax burden weighed heavily on autochthonous populations.Footnote 1
The second question we address is: What was the colonial states’ capacity to provide public goods and services? High fiscal extraction can be accompanied by a low capacity to provide public goods and services. Effective states have, in the terms of Besley and Persson (2011), both the extractive capacity to collect revenue and the productive capacity to deliver public goods and services (Dincecco Reference Dincecco2015). In a context where local populations had almost no control over colonial governments before WWII, there is no reason to believe that extractive and productive capacity went hand in hand. In the terminology used by Booth (Reference Booth2007) and Frankema (Reference Frankema2011), a colonial state taxing little could be minimalist if it spent little, or benign if it used overseas redistribution to invest in public goods. Indeed, in a colonial context, transfers between the colonizer and its colonies (in the form of grants and loans) are key to understand spending capacity. A colonial state taxing a lot could be developmental if it invested in public goods and services for the whole population or extractive if it served the interests of the colonizer, either using colonial revenue to finance metropolitan expenditure or targeting colonial expenditure to European settlers and firms. The literature on economic dualism has underlined the role played by colonial governments in creating and supporting high-wage formal enclaves dedicated to the development of exports in otherwise poor and agricultural economies (Boeke Reference Boeke1953; Lewis Reference Lewis1954; Fei and Ranis 1969).
One aspect of colonial dualism could represent an important constraint in transforming fiscal capacity into productive capacity: colonial states faced high wage costs, in particular, because of the high wages paid to European civil servants. The existing literature provides a few telling examples of the weight a single high-ranking administrator could have in colonial revenue (e.g., Huillery Reference Huillery2014, p. 30; Frankema Reference Frankema2011, p. 143). However, we lack systematic series on average public wages and numbers of government employees in European colonies.Footnote 2 As a result, we do not know to what extent these high wages constrained the spending capacity of colonial governments.
To understand what shaped the French colonial states’ capacity to provide public goods and services, we complemented data on fiscal extraction with data on public expenditure and its sectoral allocation and on transfers from France, extending the work of Huillery (Reference Huillery2014) on West Africa to the whole empire. These data were collected in regular definitive budget accounts, but also in special loan or development accounts, to capture all aspects of public expenditure. We also collected series of public employment and public wages in provisional budget accounts. Finally, we collected, in various statistical abstracts, development outcomes like road and railway length and school enrollment for Europeans and autochthons.
We find that the capacity of French colonial states to provide public goods and services was low. High wage costs meant that, despite substantial fiscal capacity, the colonies were under-administered. In 1925, the average government employee in the French empire was paid about nine times the colonial GDP per worker, and the number of government employees per inhabitant was six times lower than in metropolitan France. We also provide evidence that public expenditure was biased towards the needs of European settlers and firms. In Algeria, for example, European settlers, representing about 10 percent of the population, received about 80 percent of total education expenditure.
The third question we address is: Did colonial state capacity change in the developmental era? The second wave of French colonialism lasted from 1830 to the beginning of the 1960s, and the features of colonial states (level of fiscal extraction, public wages, targeting of expenditure) were not fixed through time. If the goal is to understand how colonial legacies shaped economic development after independence, the period of “developmentalist colonialism” after WWII is crucial (Cooper Reference Cooper1996, Reference Cooper2002, Reference Cooper2014b). It is a period when, in a global climate of mounting criticisms of colonization, the intentions of colonialism appeared to change. Political rights were conceded to autochthonous populations, and overseas transfers increased. However, most quantitative studies of colonial states focus on the period before WWII.Footnote 3 How much did overseas transfers and fiscal capacity increase during the developmental phase of colonialism? Did high wage costs continue to be a constraint? Did “developmentalist colonialism” achieve some development?
We find that colonial fiscal capacity increased dramatically during the developmental era. While colonial states of the French empire were collecting 9 percent of colonial GDP on average in 1925, they were collecting 16 percent in 1955. This increase in fiscal capacity was accompanied by large overseas redistribution. While the colonies were self-financed during most of the colonial period (at least for their non-military expenditure), net civilian subsidies from France represented 2.7 percent of their GDP in the 1950s.
The analysis of public expenditure reveals a developmental turn. The share of education and health in expenditure increased, and average autochthonous primary enrollment rates were multiplied by four between 1925 and 1955. However, the capacity of French colonial states to provide public goods and services remained low, and the achievements of the developmental era were disappointing. In 1955, the gross primary enrollment rate of autochthonous children was only 14.5 percent, and road meters per capita were three times as high in France as in the colonies. Our analysis of public wages reveals that high wage costs remained a strong constraint on public spending during the developmental era: the ratio of average public wage to GDP per worker increased everywhere.
There are two main limitations to our work. The first is that, although we are always careful to compare our findings to the existing literature on colonial states, the primary objective of this article is not a comparison of the French empire to other colonial empires. One reason is that a lot of the indicators we built (like total fiscal extraction as a share of GDP, average public wages, or public employment) do not yet exist systematically for other colonial empires. A comparison of French and British colonialism in West Africa is the object of another article (Cogneau, Dupraz, and Mesplé-Somps Reference Cogneau, Dupraz and Mesplé-Somps2018). The second limitation is that, although we collected public finance data until the 1970s, we are not able to fully tackle the question of the persistence of colonial features in independent states. This is the object of ongoing work.
In the rest of the article, we start by briefly presenting the colonies studied and the data construction methodology. The second section focuses on tax extraction and distribution across space and time, the third section on external financing, and the fourth section on public expenditure and its cost.
SCOPE AND DATA CONSTRUCTION
We study France’s second colonial empire located in Africa and East Asia (Figure 1).Footnote 4 The colonization of Algeria started in 1830. Tunisia and Morocco were added as protectorates in 1881 and 1912, respectively. Indochina and Africa south of the Sahara were colonized during the second half of the nineteenth century. The last additions to the empire were the former German colonies of Togo and Cameroon, ruled from 1919 as mandates of the League of Nations. In total, the former French colonies that are part of our database correspond to 21 contemporary countries: Algeria, Morocco, and Tunisia in North Africa, Benin, Burkina Faso, Cameroon, Chad, Central African Republic, Congo-Brazzaville, Côte d’Ivoire, Gabon, Guinea, Madagascar, Mali, Mauritania, Niger, Senegal, and Togo in sub-Saharan Africa, and Vietnam, Laos, and Cambodia in South-East Asia.
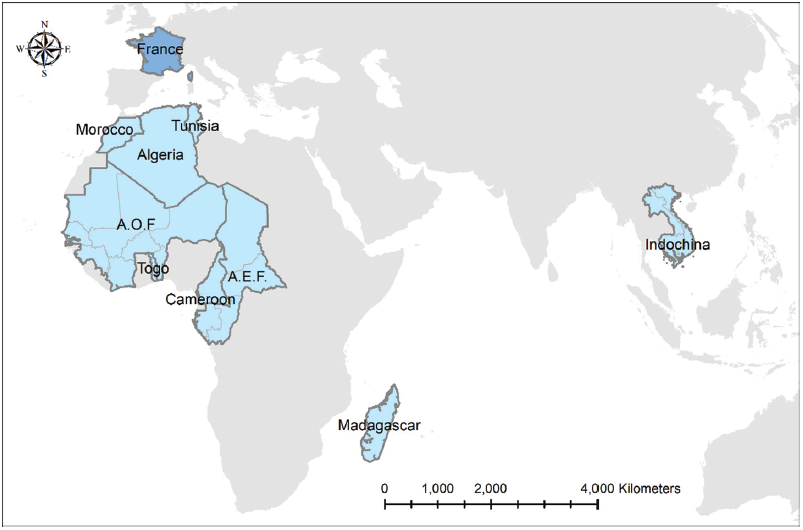
Figure 1 COLONIAL TERRITORIES PRESENT IN OUR DATA
Source: Authors’ illustration.
Our analysis relies on the collection of firsthand data in French archives. This section highlights the most important points; the Online Appendix 1 describes in detail the sources and the methodology used to clean, compile, and homogenize the data, which are publicly available (Cogneau, Dupraz, and Mesplé-Somps Reference Cogneau, Dupraz and Mesplé-Somps2021).
We designed the collection methodology to obtain homogenously defined spending and tax headings. Our estimates do not depend on the level of decentralization in each region because we consider all public authorities responsible for revenue and expenditure in the colonies. These include the French government, federal governments, central colonial governments, provincial governments, municipalities (in some years), and auxiliary budget authorities that handled loans, health care, posts, and telegraphs. We collected data yearly, except in federations (Afrique Occidentale Française or AOF, Afrique Equatoriale Française or AEF, and Indochina), where we collected data yearly for the federal government (Gouvernement général), but every three years only for governments of individual colonies (Gouvernements locaux).
Our main variables are Net Public Revenue (NPR), which is public revenue net of loans and subsidies from outside the colonial territory, and Net Public Expenditure (NPE), public expenditure net of loans and subsidies outside the colonial territory. These variables are consolidated to avoid double counts arising from transfers between different administrative layers. Military expenditure was, with a few exceptions, undertaken by the French Ministry of War and Ministry of the Colonies. We exclude this expenditure from NPE and analyze it separately. Public revenue is broken down into different types of fiscal instruments, and public expenditure into its sectoral allocations. The net deficit (the difference between NPR and NPE) is broken down into different financing instruments (loans, subsidies, transfers from reserve funds). We also collected data on public wages and employment in 1913, 1925, 1937, 1949, 1955, and 1960.
In the federations of Indochina, AOF, and AEF, we produced systematic data at the level of the federation but not at the level of each colony. The reason is that federal budgets were responsible for a large share of revenue and expenditure and that allocating federal revenue and expenditure to each colony throughout the period would require making strong assumptions. This is a limitation of our data as they do not allow us to systematically explore the intra-federation variation in fiscal capacity and expenditure.
For some variables, notably NPR and NPE, we extended the database past independence until 1970, using various sources. We also collected from statistical yearbooks development outcomes and policy variables such as school enrollment, health personnel, electricity output, road or railway length, and international trade.
To produce comparable figures of revenue and expenditure, we collected population data from various primary and secondary sources, as well as colonial price indices and prices for the year 1937. This allows us to express variables in 1937 Purchasing Power Parity (PPP)-adjusted francs. To put fiscal figures in an economic context and express colonial public revenue as a share of colonial GDP—a standard measure of fiscal capacity—we constructed GDP estimates for France and each colonial territory. Estimating historical GDP is a challenging task, especially for poor countries for which economic statistics are scarce. Our estimates combine the first national accounting exercises carried out by the colonies’ statistical agencies in the post-WWII period, the nominal GDP series of the World Bank (2017) starting in 1960, and the estimates of GDP growth in volume before WWII produced by Amin (Reference Amin1966) for North Africa, Reference Bassino, Konosuke, Kyokawa and KuboniwaBassino (2000) for Indochina, and Amin (Reference Amin1971) and Maddison (Reference Maddison2003) for sub-Saharan Africa. These inputs are then combined with our price deflator, PPP adjustor, and population series to obtain series of GDP in nominal terms and 1937 francs per capita. We rely on the assumption that these primary and secondary sources (laid out in detail in the “Gross domestic product” section of the Online Appendix 1) are of sufficient quality. For most colonies before WWII, this estimation procedure gives us GDP estimates for a couple of key years only. We then use variations in imports and exports to infer the variation in GDP between these key years.
As the reliability of our estimates of colonial fiscal capacity depends on the reliability of the GDP figures we take as inputs, we test the robustness of our main results to credible different values of GDP. To do so, we produce alternative estimates of per capita GDP using wage and urbanization data for four years (1925, 1939, 1947, and 1955). The detailed methodology for our main and alternative GDP estimates is given in the Online Appendix 1, along with figures displaying GDP per capita in 1937 francs.
Although we produced data for (almost) all years of the colonial period, our presentation relies on the detailed analysis of two benchmark years, 1925 and 1955. In 1925, France’s second colonial empire had reached its greatest extent. The French civilian administration had fully replaced the military and could draw stable fiscal revenue from the colonial economies. The second benchmark year, 1955, corresponds to the late colonial period, the era of “developmentalist colonialism.” After WWII, colonized populations obtained more political rights and France started running large development plans in the colonies, in a context of increasing anti-colonial pressure from the international community and independence movements. The Indochinese liberation war lasted from 1945 to independence in 1954 (our last figures for Indochina are from 1953/54). In 1955, Tunisia and Morocco were about to obtain their independence, and Algeria’s liberation war had just started.
FISCAL EXTRACTION: HIGH AND RISING
A Sizeable Colonial State
In 1925, we estimate that the share of NPR to GDP averaged 8.9 percent in the French empire (Table 1, Line 1). We argue this was far from small. We will refer below to a comparison with countries in the same range of income, but for now, a simple comparison with metropolitan France is informative. While the public revenue of France then represented 16.5 percent of French GDP, it was only 13 percent 25 years before, in 1900. Under the doctrine of self-financing that applied from 1900 to WWII, French colonies received practically no subsidies from France. They did not pay for military expenditure, and their debt service was limited. France spent some 3 percent of GDP in debt service and 4 percent on the army. As a result, when we consider net civilian public expenditure as a percentage of GDP, we find the same figure of 8 percent for France and its colonies (Table 1, Line 3). Of course, because France was about ten times richer than its colonial empire in 1925, the size of the state is about ten times larger in France when we express expenditures in 1937 francs per capita.
Table 1 FISCAL EXTRACTION AND STATE SIZE ACROSS THE FRENCH EMPIRE IN 1925 AND 1955

Notes: NAfr: North Africa; WCA: West and Central Africa; NPE: Net Public Expenditure. North Africa 1925: data for Morocco is from 1926. Indochina 1955: data from 1953. Madagascar 1955: data from 1956. WCA 1955: data for AEF is from 1954, data for Togo from 1956. Before WWII, social security transfers were very small in France and non-existent in the colonies.
Source: See Online Appendix 1.
The regions composing the French colonial empire were vastly different in terms of their geography, pre-colonial history, and economic development. One might therefore expect important variation in colonial fiscal capacity. Appendix Table A1 gives estimates of population, urbanization, and GDP in the empire in 1850, 1925, and 1955. In 1850, North Africa was already much more urbanized than the rest of the empire, with an urbanization rate of 6.6 percent against 1.4 percent in Indochina, 2.2 percent in Madagascar, and 0.7 percent in West and Central Africa.Footnote 5 These differences in initial urbanization are in line with what we know of the economic history of these regions and their history of political centralization. North Africa benefitted from its very ancient integration into the Mediterranean economy and its connections with the Islamic world and the Ottoman Empire. In Indochina, Laos and Cambodia were centralized, though weakened kingdoms, and Vietnam had been unified under the imperial rule of the Nguyen dynasty. In the nineteenth century, Madagascar had been almost entirely united by the kings of Imerina. French West and Central Africa, in contrast, did not have a strong history of political centralization. The different regions of the empire also differed in their European settlements: while the French established settlement colonies in North Africa, where Europeans represented 8.1 percent of the population in 1925, settlers never represented more than 1.5 percent of the population in the rest of the empire (Appendix Table A1). While before 1946, autochthons in the French colonies had, with a few exceptions, no political representation, French settlers had more political rights, especially in Algeria, officially annexed by France in 1848. Algerian settlers were represented in the French Parliament and Senate, and even obtained some autonomy in public finance in 1898 (Bouveresse Reference Bouveresse2008). If European settlers were able to successfully lobby for lower taxes, one might expect settlement colonies to have lower levels of fiscal extraction on average (as well as an unequal distribution of the tax burden). On the other hand, the formal economy in which European settlers took part was more easily observable to the government; provided public expenditure could be targeted to the settler enclave, settlers might have had a preference for high taxation and high public expenditure.
Despite these differences, we find that the variations in the ratio of NPR to GDP were relatively limited: 12.5 percent of GDP in Indochina, 9 percent in Madagascar, and 8.3 percent in North Africa (Table 1, Line 1). Of course, even though fiscal extraction as a share of GDP was comparable everywhere, richer regions ended up with higher levels of revenue (and expenditure) expressed in constant francs per capita. If public expenditure in 1937 francs per capita was twice as high in the settler colonies of North Africa than in Indochina or Madagascar, it was because they were richer and not because of higher taxation.
Our calculations show that NPR as a share of GDP was lower in West and Central Africa (5.4 percent) and particularly low in AEF (4.0 percent) and Cameroon (2.6 percent). However, the difference between these colonies and the rest of the empire is reduced when we consider forced labor. In West and Central Africa and Madagascar, a labor tax, the prestation, required Africans to work a fixed number of days per year in local public works. In addition, some military conscripts worked on infrastructure projects (Fall Reference Fall1993). Because labor payments are difficult to value, we do not consider them in Table 1 figures (except when they were rebought in cash). Marlous van Waijenburg (Reference van Waijenburg2018) computed the corvée revenue by multiplying the number of days of forced labor by her estimates of unskilled laborers’ average wages. Using her valuations increases the share of public revenue in GDP in West and Central Africa from 5.4 to 6.8 percent. Including conscripted labor could bring the figure even closer to the rest of the empire. In Madagascar, including corvée labor increases the share of public revenue in GDP from 9 to 9.9 percent, bringing it closer to the high level of fiscal extraction of Indochina.Footnote 6
How did fiscal extraction change in the developmental era? WWII weakened the international position of France and its image in the colonies while strengthening the international position of the United States and the Union of Soviet Socialist Republics, two powers opposed to European colonialism in Africa and Asia. The year 1946 saw the replacement of the French empire by the French Union (Union Française) and the abolition of the status of “indigenous subject,” which had drastically limited the political rights of colonized populations and permitted forced labor. Autochthonous populations obtained some representation in local assemblies—in the assembly of the French Union and the French Parliament—although suffrage remained restricted.Footnote 7 Were these changes accompanied by a decrease or an increase in fiscal extraction?
We estimate that colonial public revenue almost doubled between 1925 and 1955, going from 8.9 to 15.9 percent of colonial GDP, or 17.1 percent if we include social security funds established after 1944 in North Africa (second panel of Table 1). This increase mirrors a similar expansion of the state in France, where public revenue rose from 16.5 percent of GDP in 1925 to 26.3 percent in 1955, 33.4 percent if we include social security transfers. Because the colonies started receiving large net transfers from France after WWII (see below), the increase in colonial state size is even more striking if we consider public expenditure, which boomed from 8.0 percent of GDP in 1925 to 19.3 percent in 1955. The only place where fiscal extraction decreased is Indochina, then at the end of the decade-long independence war that immediately followed WWII.Footnote 8
To give a more detailed view of historical trends, Figure 2 shows the estimates of the year-to-year evolution of NPR as a share of GDP from 1890 to 1970 in each colony or federation. Contrary to Table 1, these series do not include the revenue of second-level administrative divisions (municipalities) because our series for them is patchy. This mainly affects Algeria, where municipalities represented 20–25 percent of public revenue (see Online Appendix 1). Overall, public revenue decreased during WWII as it had during WWI. Public revenue then peaked dramatically in the 1950s, both in North Africa and in West and Central Africa. Madagascar stands as an exception with a stationary profile. At the end of the decade, as colonies gradually cut ties with France, no marked change in public revenue occurred. In West and Central Africa, NPR fell in the years leading to independence in 1960, possibly because of administrative disorganization as the French prepared to leave and dismantled the federations. Nevertheless, public revenue quickly recovered, and, at the end of the 1960s, it was back to the level reached around 1955.

Figure 2 NET PUBLIC REVENUE AS SHARE OF GDP FROM 1890 TO 1970
Notes: The revenue of first-level administrative divisions (provinces, départements, régions) is included and consolidated, but not the revenue of second-level administrative divisions (municipalities). Like in Table 1, estimates of corvée labor revenue are not included in the figures for West and Central Africa and Madagascar.
Source: See Online Appendix 1.
In order to gauge the level of fiscal extraction in the French empire, we compared revenue to GDP ratios of French colonies to those of independent countries and other colonies, in particular British ones. We acknowledge the uncertainty affecting such a comparison: while our revenue series for French colonies are built using primary sources and a harmonized definition of public revenue, our revenue series for comparator countries come from secondary sources. This tentative analysis is detailed in Online Appendix 2. We make use of the historical dataset of Mauro et al. (Reference Mauro, Romeu, Binder and Zaman2013) at the International Monetary Fund (IMF), covering mainly independent countries, and complement it with estimates for 16 additional independent countries or colonies (British and Japanese), drawing in particular from the compilation of Mitchell (Reference Mitchell1998). Because state size tends to increase with GDP, an empirical regularity often called “Wagner’s law” (Wagner Reference Wagner1893; Lindert Reference Lindert2004), we restricted the comparison to countries close enough in terms of GDP per capita, and we compared French and other colonies to a “Wagner’s law” prediction of revenue to GDP ratios from GDP per capita estimated on the sample of independent countries. We implemented these comparisons for three decades, 1920–29, 1930–39, and 1950–59.
Whatever the decade considered, French colonies lie near or above the “Wagner prediction,” the only two exceptions (Algeria in the 1920s and Madagascar in the 1950s) being explained by a high level of decentralization in revenue collection.Footnote 9 British and Japanese (Korea and Taiwan before 1945) colonies also exhibit relatively high revenue to GDP ratios, even if British India and British Nigeria make two salient exceptions to this rule. Most colonial states outperform many independent states in the same income range, as different as Thailand, South Korea, Philippines, Honduras, or Bolivia.
The estimation of revenue to GDP ratios takes estimated GDP as an input. It is therefore important to pause to consider how errors in GDP would affect our conclusions. Because we find that French colonial states extracted a relatively high share of GDP, we are mainly worried about underestimating GDP in the colonies. As a robustness exercise, we use alternative GDP per capita figures computed using wage and urbanization data. The 1925 alternative GDP per capita estimates are lower than our main estimates, which would reinforce our conclusion of high fiscal extraction (Online Appendix 1, p. 36). We are more confident in our GDP per capita estimates for the 1950s because they are based on contemporary national accounting exercises rather than historical estimations and because they are anchored on GDP figures in the 1960s. The alternative estimates for 1955 point to a potential underestimation of GDP per capita in the cases of Algeria, Tunisia, and French West Africa, but not large enough to modify our conclusion of high fiscal extraction, for it is also in these colonies that fiscal revenue to GDP ratio was the highest.
We conclude that colonial states, and in particular the French ones, were not at all underperforming in terms of fiscal extraction compared to independent countries. Even if they were on average relatively poorer than independent states, it was not the lack of fiscal capacity that limited their possibilities to produce public goods and promote economic development.
Fiscal Adaptation
If there was variation in colonial fiscal capacity, it was not so much in fiscal extraction, which was high everywhere, but in the revenue mix: to extract a high and increasing share of GDP, the French colonizers adapted the fiscal structure to different contexts and historical periods. Instead of a coarse distinction between direct and indirect taxes, often used in the literature as a measure of fiscal capacity but not really suited to the colonial case, we categorized fiscal instruments according to their implied degree of administrative capacity. This encompasses a broad range: from tools involving only light administrative management (such as the head tax or capitation) or monopolies on the sale of certain goods (such as alcohol or salt) or services (revenue of posts and telegraphs); to taxes on external trade that did not require government presence outside the port of entry; to intermediate taxes requiring larger administrative capacity; to modern taxation (such as income and turnover taxes) requiring the frequent collection or self-declaration of detailed economic information on individuals and firms. (For a more detailed classification, see the Online Appendix 1).Footnote 10
Table 2 displays the share of different tax instruments in GDP in France and the four regions of the empire.Footnote 11 In 1925 France, modern and intermediate taxes represented 11.3 percent of GDP (80 percent of NPR), trade taxes represented only 0.8 percent of GDP, and there was no capitation. In the empire, the fiscal structure of North African colonies and protectorates was the closest to France. Only in North Africa was modern taxation already important in 1925, representing 1.2 percent of GDP and 16 percent of NPR. Algeria, first, and Tunisia, second, had gradually replaced Ottoman taxes by copying French taxes, such as direct taxes on wages, benefits, and other types of incomes. A general income tax was introduced in 1919 in Algeria and 1928 in Tunisia. In Morocco, the bulk of modern taxation before the 1940s was a tax on agricultural income called tertib. While modern taxation was inexistent in sub-Saharan Africa, it represented a very small percentage of GDP (0.2 percent) in Indochina. From 1920 onwards, European settlers in Indochina paid a wage tax and a minimal lump-sum tax on 12 income brackets. Between 1938 and 1941, a general income tax was introduced and extended to the autochthonous population. Though European settlers in Indochina were richer than European settlers in North Africa, they were too few to generate large fiscal revenue.Footnote 12
Table 2 SHARE OF DIFFERENT TAX INSTRUMENTS IN GDP (%)—1925 AND 1955

Notes: NAfr: North Africa; WCA: West and Central Africa. See Online Appendix 1 for the precise definition of each tax instrument. North Africa 1925: data for Morocco is from 1926. Indochina 1955: data is from 1953. Madagascar 1955: data is from 1956. WCA 1955: data for AEF is from 1954, data for Togo is from 1956. The sum of all tax instruments does not sum to NPR/GDP as presented in Table 1 because Table 1 takes revenue of municipalities into account, while this table considers only the revenue of the central government and first level administrative divisions.
Source: See Online Appendix 1.
To what extent were trade taxes used to finance colonial states? It first needs to be said that trade taxes were mainly weighing on imports. The tax revenue from exports was limited (22 percent of trade taxes in 1925), and before WWII was only significant in Indochina (rice mainly) and Madagascar (vanilla, hides, and other commodities). The opportunity of using trade taxes to finance colonial states was not only determined by the intensity of international trade but also by the existence of customs unions. Algeria, Indochina, and Madagascar formed a customs union with France, which limited the taxation of bilateral exports and imports. Madagascar, however, managed to collect 2.3 percent of GDP through taxes on the consumption of a few imported goods (that we classify in import taxes) and taxes on exports. In West and Central Africa, import tariffs could be fixed according to domestic conditions (Cornevin Reference Cornevin and Sauvy1972, pp. 294–95), although preferential treatment was granted to imports from France when not forbidden by international treaties (Congo Basin). Yet, trade flows were still limited before WWII. Within that region, we find that access to international trade explained differences in public revenue. Trade taxes explain most of the difference in public revenue between Central Africa (AEF and Cameroon) and West Africa (AOF and Togo); the latter was more outward-oriented since at least the times of “legitimate commerce” in the first half of the nineteenth century (Law Reference Law1995).
Monopoly revenue represented a larger share of GDP in the empire than in France, but this was mainly due to the staggering weight of monopoly revenues in Indochina—4.2 percent of GDP in 1925. Revenue of the government monopoly on opium alone represented 1.4 percent of GDP. Based mostly on the consumption of non-basic goods, monopolies were, like trade taxes, less regressive than the head tax (capitation).
Outside of North Africa, colonies relied heavily on this head tax for public revenue. The capitation was a lump-sum tax levied on every individual except children, soldiers and their families, and the physically impaired. It represented 1.6 percent of GDP in Indochina, 2.9 percent in Madagascar, and 1.5 percent in West and Central Africa. The use of the capitation was certainly a sign of low administrative capacity because its collection required very few European administrators but was not necessarily a sign of low extractive capacity. It brought in a substantial amount of revenue, about as much as trade taxes. The capitation was not costly in terms of administrative management: village-level colonial administrators were not needed because local chiefs levied the tax (Zucarelli Reference Zucarelli1973). The chiefs received a wage payment and a share of the amount collected, but we show that, at least in the case of French West Africa, these costs never represented more than 7.4 percent of total capitation revenue (Online Appendix 3). At the same time, compliance rates were surprisingly high: using data collected by Huillery (Reference Huillery2009), we compute, for each district in AOF, the theoretical tax bill (the district level tax rate multiplied by the eligible population) and compare it to the actual capitation revenue. We find that compliance rates (the actual revenue divided by the theoretical tax bill) were high, except in the two colonies with a large nomadic population that was instead taxed on cattle like Mauritania or Niger. Excluding these two colonies, the compliance rates average around 90 percent from the 1910s to the 1950s. One can hypothesize that this mix of low administrative capacity and relatively high extractive capacity was only possible in the kind of coercive military regime that was colonization, like for forced labor and conscription.Footnote 13
On top of the capitation, inhabitants of sub-Saharan African colonies also paid a tax in labor, the prestation, requiring them to work a fixed number of days per year in local public works. Like the capitation, the prestation was relatively light in terms of administrative management and involved the cooperation of chiefs (Fall Reference Fall1993). If we use van Waijenburg’s (Reference van Waijenburg2018) monetary valuation of forced labor, we find that it represented 1.4 percent of GDP in 1925 West and Central Africa. It means that 2.9 percent of GDP (53 percent of revenue) was collected using the capitation and the labor tax, two regressive taxes weighing practically exclusively on autochthons. In Madagascar, we estimate that capitation represented 3 percent of GDP and forced labor 1 percent.
The French adapted the fiscal structure to local economic and social conditions: in the settler colonies of North Africa, they used more modern taxes like the income tax; in Indochina, monopolies, especially the monopoly on opium, provided large revenues; in sub-Saharan Africa, they relied on capitation and forced labor. In each local context, the colonizer sometimes built on existing pre-colonial taxes, which were gradually modernized. In Algeria and Tunisia, Ottoman taxes were gradually replaced by copies of French taxes, such as direct taxes on wages and benefits, before the introduction of a general income tax. In Tunisia, pre-colonial taxes on agricultural inputs such as trees, land, and cattle were gradually replaced by taxes on income drawn from agricultural exports (Nicolaï Reference Nicolaï1962, p. 443). In Morocco from 1915, the French administration revived the tertib, a tax on agricultural income originally introduced by the sultan Moulay Abdelaziz in 1901 and then withdrawn. The tertib represented the bulk of modern taxation before the 1940s. In sub-Saharan Africa, corvée labor built upon pre-colonial forms of coerced labor in a context of labor scarcity (Reference HopkinsHopkins 1973). But the French colonizer was also happy to revive taxes from the French Ancien Régime toolkit: the capitation was a colonial invention in sub-Saharan Africa, and the opium monopoly in Indochina was also introduced by the colonizer (Kim Reference Kim2020, pp. 157–61).
The high fiscal performance also meant that the tax burden weighed heavily on autochthons, especially in the early years. In Algeria and Tunisia, French settlers were numerous enough to make a high share of total income and a high share of total tax revenue, yet simulations presented in Online Appendix 4 suggest that in proportion of their income they were not taxed more than autochthons in 1925. We reach the same conclusion in West Africa where, in any case, the tax revenue extracted from the few French colonists was limited (below 10 percent of total tax revenue).
NPR increased everywhere between 1925 and 1955, and especially in the 15 years following WWII. In France, new revenue mostly came from an increase in direct and indirect modern taxation, which climbed from 4.4 to 12.1 percent of GDP (bottom panel of Table 2). In the colonies, the modernization of the tax structure was very apparent in North Africa. Modern taxes were responsible for almost half of the increase in fiscal extraction over the period, increasing from 1.2 to 5.1 percent of GDP. The capitation almost disappeared, while monopolies and intermediate resources also increased substantially. These evolutions also contributed to making the tax system a bit more progressive (the tax burden on Europeans increased more than on autochthons, see Online Appendix 4). In sub-Saharan Africa, income and turnover taxes were introduced, raising the contribution of modern taxes from 0 percent of GDP in 1925 to 1.8 and 1.5 percent in Madagascar and West and Central Africa. At the same time, while forced labor was abolished in 1946, the share of capitation in GDP remained similar. In Indochina, capitation was abolished by the autonomous government of Vietnam, and modern taxation had also increased, but Indochina is a particular case: our figures are for the year 1953, at the end of the decade-long independence war.
Where the modernization of the tax system remained limited, the colonizer primarily used trade taxes to increase public revenue. The share of trade taxes in GDP more than doubled everywhere except in North Africa, where it increased only modestly. In 1955, trade taxes represented about 6 percent of GDP and about 40 percent of total revenue in sub-Saharan Africa. The increase in trade tax revenue was mostly the result of a rise in tax rates, in particular on imports, and not a mechanical effect of the postwar boom in African trade. In West and Central Africa, the share of imports and exports in GDP increased from 31 percent of GDP to 40 percent between 1925 and 1955, but the effective rate of taxation increased from 2.1 percent on exports to 9.3 percent and 9.6 percent on imports to 18 percent.Footnote 14
EXTERNAL FINANCING: FROM SELF-FINANCING TO AID DEPENDENCY
Figure 3 displays net grants from France as a proportion of a colonial territory’s GDP. At the beginning of the twentieth century, for some colonies like Madagascar or AEF, grants could represent 15 to 25 percent of expenditure at a time when the fiscal apparatus was still under construction. Yet, as expenditure was also low, this temporary contribution never went above 3 percent of local GDP, and the cost to France was very limited. In Indochina, net grants from France were systematically negative from 1904 onward, which means that surpluses from Indochinese budgets were financing the French state.

Figure 3 NET GRANTS FROM FRANCE AS A SHARE OF GDP, 1890–1970
Notes: These are net grants from France, negative numbers mean the grants from the colony to France are larger than the grants from France to the colony (for instance, Indochina 1905–1937). French military expenditure is not counted, except expenditure in infrastructure and health. The implicit grant associated to public loans at subsidized rates is not counted either (North Africa after WWII).
Source: See Online Appendix 1.
Between 1920 and 1944, the colonial empire was almost self-financed. The first exception was Morocco, in the 1920s when the colonial state was still new. The second exception was Central Africa (AEF), where grants represented up to 0.8 percent of GDP over the period. Transfers to AEF peaked between 1920 and 1924, the period of Minister Sarraut’s plan, taken by some as the first developmental attempt in the empire (Cornevin Reference Cornevin and Sauvy1972, pp. 281–90). In the 1930s, as the Great Depression was unfolding, state-guaranteed long-term loans financed large infrastructure projects. Colonial governments used these loans mainly for the completion of railway lines like the “Congo-Océan” in AEF or the “Fianarantsoa–Côte Est” in Madagascar. These loans were still being reimbursed in the late 1950s, but the large inflation of the 1940s considerably softened the debt burden.
In 1946, the Economic and Social Development Investment Fund (FIDES) was created to finance large-scale infrastructure projects in sub-Saharan Africa. Though the colonies also contributed to this fund, the contribution of France was 70 percent of the total. As a result, as can be seen in Figure 3, after 1946, net grants from France as a share of GDP took off in Madagascar (2.4 percent of GDP on average for 1946–1960) and even more impressively in West and Central Africa (3.5 percent). In North African colonies, development projects were financed by another Fund, the Economic Modernization Fund (FME), with loans at a highly subsidized rate of 1.5 percent (Saul Reference Saul2016). As we only report direct grants, we do not consider this indirect subsidy, or the fact that these loans were not fully reimbursed after decolonization. It is why Figure 3 shows that Morocco and Tunisia received no French aid before independence in 1956. In contrast, Algeria started receiving large grants from France in 1956, two years into the liberation war. This culminated in 1959–1962 under the “Constantine Plan,” aimed at industrializing the country, with a peak at 16.4 percent of Algerian GDP in 1961 (5.8 percent of GDP on average between 1946 and 1962).
The colonial empire turned more costly for France in the last 15 years of colonization. Yet, even during this period, France’s total financial contribution to colonial civilian expenditure reached only 0.39 percent of its cumulated GDP, below the aid target fixed today by the OECD for its members (0.7 percent). Contrary to Marseille’s (Reference Marseille1984) claim, the empire was still not a financial burden for France. After decolonization, France continued to give international aid to its former colonies, but the amounts were reduced. Therefore, it is true that decolonization allowed France to save money, as argued by Marseille (Reference Marseille1984) and Cooper (Reference Cooper2014a,b). The amount of French aid directed to Algeria decreased quickly after 1963 to represent only 2 percent of Algerian GDP in 1969. Madagascar also experienced a large downfall below 1 percent, while in West and Central Africa, the share of French aid in GDP stabilized around 3 percent.
Figure 4 provides a synthetic view of all sources of public finance in the French empire, expressed as a percentage of the total empire’s GDP.Footnote 15 Between 1900 and 1950, total civilian public expenditure in the empire was overwhelmingly financed by local public revenue. Financial transfers from France were large but almost completely in the form of military expenditure, far larger than civilian subsidies. From 1833 to 1962, military expenditure in the empire represented on average 57.7 percent of civilian expenditure, 6.1 percent of the empire’s GDP, and 0.8 percent of France’s GDP; the corresponding figures for civilian transfers were 10.7, 1.1, and 0.14 percent, respectively. Military spending was high during the conquest of Algeria, peaked in the 1880s with the conquest of Tunisia and Indochina, and boomed again with the liberation wars of Indochina and Algeria, while the French military presence was also increasing in other colonies of sub-Saharan Africa after 1946. Although France kept a few permanent military bases in its former empire, decolonization decreased France’s military expenditure. Except for some expenditure on infrastructure and health, we never consider the military expenditure of France as an item of public expenditure for the colonies (see Online Appendix 1). Yet, once they became independent, the former colonies started developing a national defense budget so that we could consider part of France’s colonial military spending as subsidizing their defense expenditure. Military expenditure in the domestic budget of independent Morocco (after 1957) was 13 percent of total expenditure or 1.5 percent of local GDP.Footnote 16 If we adopt this 1.5 percent ratio of GDP to define counterfactual military spending absent colonialism, then we find that the subsidization of defense expenditure by France represented a 0.18 percent transfer in terms of French GDP, bringing total subsidies to colonies to 0.14+0.18=0.32 percent over 1833–1962. Overall, French “aid” to its colonies was definitely modest. Even from this perspective, French colonies did not receive large public transfers from France, contrary to Marseille’s (Reference Marseille1984) view.

Figure 4 PUBLIC REVENUE, LOANS, GRANTS, AND MILITARY EXPENDITURE AS PERCENTAGE OF THE EMPIRE’S GDP
Notes: Civilian net grants include military expenditure in infrastructure and health. Military expenditure includes personnel and operating expenses of troops, and expenditure other than in infrastructure and health. French military expenditure in the colonies during WWII is missing. The military costs of the Indochinese and Algerian wars are rough estimates, likely to be underestimated in the case of Algeria. In federations, loans and grants were mostly managed by the federal budget, for which we have annual series; for NPR, our series are less frequent (see Online Appendix 1); missing years were extrapolated linearly. The boundaries of the colonial Empire change, for example, the last two years correspond to Algeria only. Years 1961 and 1962 are out of range, and should be regarded with caution due to many data uncertainties linked to the Algerian crisis.
Source: See Online Appendix 1.
Although French aid to its colonies was limited if we consider the entire colonial period, it increased in the last two decades of colonization, in particular in sub-Saharan Africa. In the same period, fiscal extraction, which was already substantial, increased to unprecedented levels. As a result, in 1955, net civilian public expenditure represented almost 20 percent of GDP in the French colonial empire. As the next section shows, the high and rising extractive capacity of the colonial state, accompanied in the late colonial period by large external financing, did not translate into a high capacity to provide public goods and services.
HIGH WAGE COST AND BIASED EXPENDITURE
The true limitation of the colonial state was not its fiscal capacity but its colonial nature. Its expenditure was plagued with high unit costs, in particular, because of high wages, firstly explained by the presence of highly paid French government employees. It was also biased, serving first the needs of French settlers and companies. High wage costs and biased expenditure were manifestations of a dualistic economic system where a traditional, mostly agricultural sector coexisted with high-wage enclaves inhabited by Europeans and autochthonous elites and benefitting disproportionately from colonial public expenditure (Boeke Reference Boeke1953; Lewis Reference Lewis1954; Fei and Ranis 1969). We are by no means the first to note this, but we have developed new data series to substantiate this vision in the case of the French empire. In particular, we think the role of high public wages in constraining development efforts in the late colonial and early independence periods (Dumont 1962; Amin Reference Amin1966) is a point that deserves more attention.
High Wage Costs
Table 3 displays estimates of civilian expenditure per capita, public employment per 1,000 inhabitants, and the annual average public wage in France and the colonial empire in 1925 and 1955. We express monetary figures in 1937 francs adjusted for purchasing power parity, using a basket of consumption goods for deflation (see Online Appendix 1). Because of vast differences in GDP per capita and wages, this way of expressing public expenditure overstates differences in the volume of public goods and services provided. In the absence of detailed information on the price of various government goods and services, building a specific public spending deflator is impossible, but we show the number of government employees per 1,000 inhabitants. This indicator might understate differences in public service provision, as it does not consider the skill content of various occupations.
Table 3 PUBLIC EMPLOYMENT AND WAGES IN 1925 AND 1955

Notes: NAfr: North Africa; WCA: West and Central Africa; NPE: Net Public Expenditure. NPR: net public revenue. France 1925: employment from 1922 and wage bill from 1923. NAfr 1925: Tunisian employment and wages from 1924. Indochina 1955: data from 1953. Madagascar 1955: employment and wages from 1956. WCA 1925: Togolese employment and wages from 1926. WCA 1955: Togolese employment and wages from 1956. Public employment, public wage, and wage bill to public revenue ratio exclude the military and are for the central government only, except in 1956 Madagascar. There, following the 1946 decentralization reform, provinces represented a large share of total public employment; hence, we extrapolated it from personnel expenditure, assuming that provincial employment was paid the same average wage as central government employment.
Source: See Online Appendix 1.
In 1925, non-military expenditure represented the same share of GDP in France and the colonial empire (8 percent). But the difference in public employment per capita was striking. France had 11.9 government employees for 1,000 inhabitants, about six times the average for the empire (2.0).
If public wages were proportional to GDP per capita, differences in public employment between France and the colonies would reflect differences in revenue as a percentage of GDP. This was not the case because differences in public wages were much smaller than differences in GDP per capita. In 1925, while GDP per capita was ten times lower in the colonies than in France, the average annual public wage was only 25 percent lower (Table 3, Line 3). Although Indochina was 14 times poorer than France, the average public wage was the same as in France (see Online Appendix 5 for a discussion of the high wages prevailing in Indochina in the 1920s).
We measure the public sector wage premium as the ratio of the average public wage to GDP per working-age population (15–64 years old). In 1925, it was 1.2 in France versus 8.2 in the colonies (Table 3, Line 4). This ratio was particularly high in Indochina (14.8) and West and Central Africa (7.4), lower in North Africa (4.3) and Madagascar (4.5). On average, public wages in the colonies were seven times higher than in France when expressed in terms of GDP per worker, and the number of government employees per capita was six times lower than in France. Under the doctrine of colonial self-financing, the level of wages severely restricted the volume of public service. As a result, while the non-military wage bill absorbed only 13 percent of NPR in France, it weighted for almost one-third in the empire and even more in Indochina (Table 3, Line 5).
Average public wages were high firstly because of the presence of well-paid French government employees. On top of a base wage that was the same as in mainland France at the same rank, they received bonuses meant to compensate for expatriation (“supplément colonial”). These could be very high, from 25 to 70 percent of the gross wage, depending on the territory and the period. To these bonuses were added a variety of allowances for remoteness, riskiness, housing, family charges, and cost of living. In North Africa, French settlers hired locally also received a 30 percent wage bonus (“tiers colonial”), even when they were born in the colony and did not suffer from homesickness. From a detailed analysis of public employment and wages by citizenship in Indochina and Madagascar (presented in Online Appendix 5), it appears that bonuses were set to keep French public wages in line with the earnings of settlers in the private sector, to attract sufficiently skilled candidates.
To what extent were the high wages paid to French civil servants a burden on the budgets of the colonies? This depended on how high French wages were and on the share of French citizens in public employment. For example, in the settlement colonies of North Africa, wage bonuses paid to French citizens were lower, but their share in public employment was higher than in other colonies—autochthons made no more than 50 percent of civil servants, concentrated in low-skill and low-rank positions.Footnote 17 Elsewhere in the empire, the share of French citizens in public employment was lower, but their wages were higher, especially compared to local standards of living. In Indochina and Madagascar, whose budgets allow breaking down public employment by citizenship, the French represented about 10 percent of public employment and about half of the wage bill in 1925 and 1943/45 (see Online Appendix 5). Available evidence suggests that the same proportion applied to West and Central Africa, at least for the share of public employment.Footnote 18
Were these high wages paid to Europeans offset by the low pay of autochthons? Even when they were skilled, autochthons were not paid on the same scale as Europeans. Degrees obtained in the colonies were not valued the same as those acquired in metropolitan France. For a given nominal position (e.g., “teacher 2nd class”), the base wage paid to an autochthon could be 20 to 50 percent lower in the so-called “local” wage schedule.Footnote 19 Yet, it also seems that the high wages paid to French civil servants were pulling the autochthonous wage schedule upwards because too much inequality in pay was politically difficult (see Online Appendix 5). In skilled occupations like teachers, some allowances were extended to autochthons in some cases, even if they never received the expatriation bonuses. During the interwar period, the racial differentiation of wage schedules was gradually removed or at least euphemized. In non-settler colonies, aside from the “general” “cadre” applying to French civil servants sent abroad, each colony could recruit locally in a “common” or “superior” “cadre,” whose racial composition was mixed, and in a low-rank “local” “cadre,” where only autochthons were found. For middle-rank positions, the mixing of French and autochthonous employees within the same “cadre” contributed to narrowing the pay gap.
Between 1925 and 1955, public expenditure measured in 1937 francs boomed, and public employment per 1,000 inhabitants roughly doubled everywhere. It increased from 11.9 to 21.6 in France and from 2.0 to 4.5 on average in the empire. The public sector wage premium, however, remained high.
There are two reasons why we might have expected a fall in the public sector wage premium in the developmental era: the significant decrease in wage bonuses and the fall in the share of French government employees. In Madagascar and West and Central Africa after 1950, French executives saw their 70 percent bonus reduce to 40 percent.Footnote 20 At the same time, it is likely that, at least in non-settler colonies, the new government employees were mostly autochthons. However, data on the composition of employment by citizenship is much more difficult to reconstruct in the late colonial era, as explicit references to race or origin in wage schedules became forbidden by law. We could gather some figures for North Africa, and there, it appears that government employment barely Africanized.Footnote 21 However, in the rest of Africa, it is hard to see how government employment could have doubled without a significant increase in the share of African employees.
One might expect that the reduction in bonuses and the hiring of more autochthons decreased the public sector wage premium, but this was not the case. Everywhere, public wages increased faster than GDP per working-age population, and the ratio of public wages to GDP per worker increased.Footnote 22 While average real public wages were multiplied by 1.8 in France, they were multiplied by 2.0 in North Africa, 2.2 in Madagascar, and tripled in West and Central Africa. There, the increase in the ratio of public wages to GDP per worker was particularly striking, from 7.4 to 10.7. As a result, the weight of the wage bill on public finances increased. Whereas it was limited to 18 percent of public revenue in France, it went as high as 40 percent of revenue in the empire (Table 3). The latter figure illustrates well that “developmentalist colonialism” was severely constrained by its wage costs. Development, especially social policies, required more public employment. Raising public employment required more revenue or even larger transfers. But fiscal extraction was already high, and colonialism was not “developmentalist” enough to bring itself to massive transfers.
What explains the increase in the colonial public sector wage premium? A first explanation could be a change in the skill composition of employment. But only in sub-Saharan Africa can part of the increase, a small part only, be accounted for by the change in the sectoral composition of employment from low-skill, low-pay jobs in security toward higher-skill, higher-pay jobs in education or health.Footnote 23
Pressing demands from trade unions for equality of pay also led to wage increases in favor of autochthonous civil servants. In 1950, a law proposed by Lamine Guèye, the representative of the four communes of Senegal in the French Parliament and the mayor of Dakar, granted equality in pay and allowances to all colonial government employees belonging to the same wage schedule (“cadre”) (Cooper Reference Cooper1996, pp. 277–322 and pp. 407–31).Footnote 24 This law compressed the wage distribution at the top, as it mainly impacted skilled autochthons who belonged to the same wage schedule as Europeans, and it also contributed to increasing wage costs. But its exact contribution is hard to measure in the absence of detailed data.Footnote 25
Apart from this, the appreciation of the African franc after WWII largely accounts for the higher increase in real wages in West and Central Africa. For most of the colonial period, the franc of sub-Saharan African colonies was pegged to the French franc at parity. During WWII, inflation had been lower in West and Central Africa than in France (see the “Prices” section in the Online Appendix 1). In order to boost the competitiveness of French exports, the franc in sub-Saharan Africa was appreciated and renamed CFA franc. One CFA franc was worth 1.7 French francs in 1946–47, then two French francs starting in 1948. Nominal wages did not change in the colonies, which meant that real wages increased because French imports were now cheaper. On top of this, in the following years, nominal wages in African colonies were subjected to the same large increases as in France, where real wages had been eroded by WWII inflation (Piketty Reference Piketty2018, pp. 191–94). The appreciation of the franc and the decision to apply the same nominal wage increases in France and the African colonies generated large gains in real public wages in sub-Saharan Africa.
The high colonial public sector wage premium was a crucial legacy for independent countries. Authors including Amin (Reference Amin1966) on North Africa and Dumont (1962) on sub-Saharan Africa underlined, in the early 1960s, the high level of public wages. Both criticized the one-to-one replacement of French civil servants at the same wage.Footnote 26 This wage premium determined the features of socioeconomic and political inequalities in the young independent countries. In their first two decades of existence, an administrative bourgeoisie emerged, a “bourgeoisie of the civil service” in the words of Fanon (Reference Fanon1961)—see also Simson (Reference Simson2019). The combined economic affluence and political influence of this group led to the entrenchment of patron-client relationships with the rest of society. Just after independence, the legitimacy of this new social class was high. However, its initial political capital depreciated, and its authority was undermined because socioeconomic and political dualism persisted and because development was not shared.
Were high wage costs a general feature of European colonialism or a specific feature of French colonialism? Frankema (Reference Frankema2011) gives telling examples of high-ranking British colonial administrators paid several orders of magnitude more than African workers (Frankema Reference Frankema2011, p. 143). In the absence of systematic historical public wage series, putting our wage cost estimates in a comparative perspective is challenging. However, as part of ongoing research, we produced comparative figures between West African British and French colonies, in particular between French Côte d’Ivoire and its British neighbor the Gold Coast (Cogneau, Dupraz, and Mesplé-Somps Reference Cogneau, Dupraz and Mesplé-Somps2018). Before WWII, the average public wage was always much higher in the Gold Coast. However, the difference inverted in the developmental era, as real average public wages fell in the Gold Coast and increased in Côte d’Ivoire. Similar patterns emerge from comparing other pairs of neighbors. Although these conclusions need to be strengthened, it appears that the specificity of French colonialism did not lie in the existence of high public wage costs in the first place but in its persistence in the developmental era.
Biased Expenditure
The colonial state first served the interest of French settlers and capitalists by favoring costly investments in railways and harbors to connect mines and plantations and by providing settlers, mainly agglomerated in cities, with public services (health, education, electricity) at the standards prevailing in France. Table 4 shows the sectoral allocation of public expenditure as well as a few development outcomes in France and the colonial empire in 1925 and 1955. We organized data collection, homogenization, and aggregation to make expenditure headings comparable across space and time.
Table 4 PUBLIC EXPENDITURE AND DEVELOPMENT OUTCOMES IN 1925 AND 1955

Notes: NAfr: North Africa; WCA: West and Central Africa. Expenditure shares: excluding the military, central government only in metropolitan France, central government and first level administrative divisions in the colonies; NAfr 1925: Moroccan data from 1926; Indoch. 1955: data from 1953; Madag. 1955: data from 1956; WCA 1955: AEF data from 1954. Expenditure shares do not always add up to 100 percent because the destination of expenditure is not systematically recorded in the original public accounts (mainly for first-level administrative divisions). Employment shares: excluding the military, for the central government only everywhere; NAfr 1925: Tunisian data from 1924; WCA 1925: Togolese data from 1926; WCA 1955: Togolese data from 1956. Gross primary enrollment rates = number of primary school pupils divided by the 6–13 year old population. They count only public and government-authorized private schools, not unofficial Koranic schools (which gathered 36,000 pupils in 1932 Algeria and 100,000 pupils in 1950 Algeria; Kateb (Reference Kateb2004)), nor municipal schools in Indochina. In Tunisia and Morocco, Jewish children, who already enjoyed universal primary schooling like Europeans in 1925, are counted apart.
a Algeria and Morocco only.
b AOF only.
c AOF, Togo, and Cameroon only.
d Tunisia only.
Source: See Online Appendix 1.
In all colonies, a large share, between 33 and 50 percent, of public expenditure went to infrastructure and what we call “production support”—subsidies to private and public companies and expenditure on public services that benefitted firms like posts, mining, or agricultural research. In North Africa, colonial governments also directed public subsidies to the settlement of French farmers. A large fraction of production support expenditure went to railways, in the form of subsidies to private companies, indirect investments financed by a loan or buying back the capital of private companies, or in subsidies to the operating national company. The share of infrastructure and production support in expenditure was overall higher in the colonies than in France, but the years 1925 and 1955 are not representative of longer-term patterns, as the reconstruction effort after WWI and WWII were then absorbing a large part of French public spending. Before 1914 and between 1926 and 1939, the share of production and infrastructure expenditure was 10 to 20 percentage points higher in the colonies than in France. Yet, despite some catch-up between 1925 and 1955, the gap between France and its colonies in electricity output, roads, and railways remained wide (Table 4). In 1955, kWh per capita was 30 times as high in France as in the colonies, road meters per capita three times as high, and railroad meters per capita 4.5 times as high.
North African colonies received more electricity than the rest of the empire. However, electrification was limited to urban centers, where European settlers lived. If we consider instead public investments that could not easily be targeted only at cities, like road meters per capita, North Africa was not particularly better endowed in 1955. Agricultural investments remained concentrated in regions with high potential and/or a significant presence of European farmers or traders, like the groundnut basin in Senegal, the inner Niger delta for cotton and rice in Soudan, or the rice-producing Mekong delta in Cochinchina.
Social spending was not a priority of colonial governments. In 1925, education represented 7.3 percent of public expenditure and 13 percent of public employment in the colonies, versus 20.3 percent and 32 percent in France. Among autochthons, primary school gross enrollment rates were extremely low: 3.5 percent on average. Education was a more important item of expenditure in North Africa than in other colonies. Yet, this educational effort was dramatically biased towards European settlers. In Algeria, where the local government of settlers explicitly rationed the provision of education to autochthons (Ageron Reference Ageron1979, pp. 152–67 and 532–36), budget accounts report a specific credit line for the European sub-sector: it received 78 percent of total education expenditure in 1925 (and 82 percent in 1955). In 1925 Morocco, the corresponding figure was 79 percent. In terms of expenditure per pupil, our calculations (not reported) show that European children in Algeria enjoyed the same level as children in France, while Algerian pupils received no more than in other parts of the empire. Health represented the same percentage of expenditure in the colonies as in France (5.9 percent), but in France, until the 1960s, the provision of medical services relied mainly on lower administrative levels and the private sector. Still, France had ten times more public health personnel per capita than the empire in 1925. When we consider the total number of health professionals per capita in the public and private sectors (physicians, pharmacists, dentists, and midwives), France was 30 times above the empire in 1925.
Social spending increased in the developmental era, but its expansion was still limited. In 1955, education had increased to 11.2 percent of expenditure and 19.5 percent of employment in the colonies. Primary school gross enrollment rates had increased, yet only to 14.5 percent. Tunisia, Madagascar, and Cameroon displayed the highest rates, around 30 percent. In Tunisia, after modernization attempts in the nineteenth century, the bilingual “Franco-Arab” and “modernized” koranic schools likely encouraged enrollment (Sraieb Reference Sraieb1993). In Madagascar, the early action of Protestant missions and the precolonial Imerina kingdom mattered (Campbell Reference Campbell2005, pp. 86–89). Cameroon experienced a big push in school construction in the 1950s (Dupraz Reference Dupraz2019). In secondary education, the same three countries lay above the average, although at very low levels (respectively, 3.4, 1.8, and 0.8 percent of 11–18 year-old autochthonous children, while at the same time this gross rate reached 19.2 percent in France). In 1955, health had increased to 8 percent of expenditure, and the number of health professionals per capita had been multiplied by 7.5 since 1925 but was still seven times lower than in France.
Expenditure in general administration, financial services, justice, and security, named “order” spending by Frankema (Reference Frankema2011), represented a third of colonial public expenditure and half of colonial public employment in 1925. The share in employment lies far above the share in expenditure because security involved many low-pay autochthonous policemen. In 1955, “order” spending had lost its weight in Madagascar and West and Central Africa, both in the budget and in the labor force. Overall, the ratio of education and health investments to “order” spending (Frankema Reference Frankema2011, p. 144) had increased everywhere after 1945, signaling a more developmental orientation, and non-settler colonies had caught up with North Africa in this respect. Public expenditure remained biased towards the needs of Europeans, but autochthonous populations benefitted from more public services after WWII. However, the gaps in public service accessibility between French people living in France and colonized people remained, for electrification, transportation infrastructure, health, or education. Even the most peripheral regions of mainland France, like Limousin or Corsica, received significantly more public goods and services.
CONCLUSION
The two opposite views on colonial states present in the literature (Leviathan, on the one hand, administration on the cheap on the other) can be reconciled, at least in the case of the French empire: French colonial states had a strong capacity for coercion, in particular for raising taxes; but due to high operation costs, their capacity to provide public goods and services was limited. Largely self-financed before 1945, they taxed at a relatively high level, adapting their fiscal tools to different socioeconomic contexts and varying historical conditions, but they were nonetheless under-administered, notably because of the very high wage costs coming with the employment of expatriated French civil servants. Their public expenditure was also biased toward the interests of a small enclave of French settlers and firms.
After WWII, as the legitimacy of French rule was increasingly questioned, colonial governments did not tax and spend less; on the contrary, they taxed and spent more. In the hope of preserving their imperial dominance, they became more developmental. They increased their social spending, notably in education. They gave some political rights to local populations, adopted somewhat more progressive taxes, and conceded some wage equality claims. The self-financing doctrine was relaxed, and net grants from metropolitan France started representing a larger share of the colonies’ GDP. Wage costs, however, remained high. The public sector wage premium, measured as the ratio of average public wage to GDP per working-age population, increased between 1925 and 1955. Given these high unit costs, accelerating development would have required an even bigger push in French grants.
Independent states inherited the structures of colonial states. In 1970, new postcolonial states taxed the same share of their GDP as colonial states did in the 1950s, and they were still dependent on French aid for a significant share of their expenditure. Not all countries followed the same paths or had the same speed or characteristics in terms of reforms that veered between radical breaks and neo-colonial continuities. Some preserved high wages and elitist infrastructure. Others opted instead to extend public employment and decentralize at lower costs. Further research is warranted to analyze these postcolonial evolutions.
Table A1 POPULATION, URBANIZATION, AND GDP IN FRANCE AND ITS EMPIRE—1850, 1925, AND 1955

Notes: NAfr: North Africa; WCA: West and Central Africa.
Sources: See Online Appendix 1 and also Online Appendix 4 on urbanization.


