Introduction
The link between low birth weight and increased disease risk has long been established in the developmental origins of health and disease field.Reference Barker 1 Insults occurring during critical periods of development in utero program adult disease such as cardiovascular disease, type II diabetes and obesity.Reference Barker 2 , Reference Barker, Winter, Osmond, Margetts and Simmonds 3 Low birth weight is also associated with adverse bone health in humans and animal models.Reference Cooper, Fall and Egger 4 – Reference Romano, Wark and Wlodek 6 More importantly, evidence is emerging that these diseases are not limited to the first directly exposed generation but also subsequent generations. If the disease is present in the first unexposed generation, this is termed transgenerational transmission.Reference Hanson and Skinner 7 Examination of the third generation (F3) of the in utero-exposed maternal lineReference Skinner 8 , Reference Skinner 9 or paternal line is required to determine whether disease transmission has occurred as this is the first unexposed generation to an insult.Reference Hanson and Skinner 7 , Reference Skinner 9 , Reference Dickinson, Moss and Gatford 10
The Dutch Hunger Winter period has provided evidence detailing the effects of malnutrition across generations in humans. Famine exposure in the F1 generation did not affect the birth weight of F2 offspring but did decrease birth length and increase neonatal adiposity with increased risk of poor health and obesity later in life.Reference Painter, Osmond and Gluckman 11 Interestingly, F1 individuals exposed to the Dutch famine during mid and late gestation had higher mortality rates (11.2 and 14.6%, respectively) compared with individuals conceived after the famine (7.2%).Reference Roseboom, Van Der Meulen and Ravelli 12
Human studies indicate that low maternal and paternal birth weight is associated with a 4.7 times and 3.5 times greater risk of low offspring birth weight, respectively,Reference Jaquet, Swaminathan and Alexander 13 with maternal contribution higher than paternal.Reference Alberman, Emanuel, Filakti and Evans 14 , Reference Emanuel, Filakti, Alberman and Evans 15 If both parents were born small the risk of a low birth weight baby was 16 times greater.Reference Jaquet, Swaminathan and Alexander 13 There is a large focus on maternal contribution to birth weight and disease transmission, however studies have recently emerged detailing paternal contributions.Reference Magnus, Gjessing, Skrondal and Skjaerven 16 , Reference Klebanoff, Mednick, Schulsinger, Secher and Shiono 17 One study reports that fathers who weighed <3 kg at birth had babies that were lighter by 176 g, in contrast to fathers weighing between 3 and 4 kg at birth having babies who were lighter by 109 g.Reference Klebanoff, Mednick, Schulsinger, Secher and Shiono 17 This demonstrates that paternal birth weight can affect offspring birth weight regardless of maternal characteristics.
Animal models are ideal to study transgenerational transmission as large cohorts and generations are produced more efficiently than studies in human populations. Maternal protein or calorie restriction in animal models mimics human famine and undernutrition. However, there is a lack of evidence investigating the possible effect of transgenerational transmission of bone deficits.
Furthermore, to date there are limited studies examining transgenerational transmission in a model of uteroplacental insufficiency, the major cause of growth restriction in Western societies. We have characterized F2 fetal, postnatal and adult offspring metabolic,Reference Tran, Gallo and Hanvey 18 , Reference Tran, Gallo, Jefferies, Moritz and Wlodek 19 cardiorenalReference Gallo, Tran, Cullen-McEwen, Denton, Jefferies, Moritz and Wlodek 20 and bone health.Reference Anevska, Gallo and Tran 21 Our previous studies investigating the effects of growth restriction on bone health have reported that uteroplacental insufficiency has adverse consequences to both male and female F1 offspring bone health, with males having poorer bone health which persisted to 12 months of age.Reference Romano, Wark, Owens and Wlodek 5 , Reference Romano, Wark and Wlodek 6 , Reference Romano, Wark and Wlodek 22 To rescue bone deficits in F1 offspring, offspring born growth restricted were cross-fostered to improve postnatal nutrition which uncovered sex-specific differences where growth restricted females had restored bone parameters; however, males remained worse off as bone bending strength remained low compared to control groups.Reference Romano, Wark, Owens and Wlodek 5 Supplementing F1 growth restricted offspring with high calcium diets did not rescue bone deficits.Reference Romano, Wark and Wlodek 6 Despite our previous findings, there is little evidence of transgenerational effects on bone health.
Based on our previous findings of prominent bone deficits in growth restricted F1 male and female offspring, we aimed to determine whether there was transmission of adverse bone health to subsequent generations. Further to this, we have previously only focused on the maternal contribution; however, with emerging evidence of paternal line influence we investigated the contribution of both parental lines. Therefore, the current study explored whether uteroplacental insufficiency in the F0 generation was associated with transgenerational transmission of low birth weight and bone deficits to the second (F2) and third (F3) generations via both parental lines, paternal and maternal.
Materials and methods
Animals
Before commencement, all animal experimental work received approval from The University of Melbourne Animal Ethics Committee ensuring compliance with the accepted standard of animal care (AEEC number 1011865 and 1112130). Wistar–Kyoto rats (~8–10 weeks of age) were housed in an environmentally controlled room maintained at 22°C; with a 12 h light–dark cycle and access to standard rat chow (0.46% calcium; consumed by all generations) and tap water ad libitum. F0 females (initial generation) were mated with breeder males between 18 and 24 weeks of age. On embryonic day 18 (E18) of gestation surgery was performed; pregnant F0 females were randomly allocated to either uteroplacental insufficiency (offspring termed Restricted, n=16) or sham (offspring termed Control, n=13), as previously described.Reference Wlodek, Westcott and O’Dowd 23 – Reference O’Dowd, Kent, Moseley and Wlodek 25 Post-surgery, F0 females were housed alone to allow for nesting and delivered pups naturally at term on gestational day 22. F1 offspring birth weights were recorded and pups remained with their mother until weaning at postnatal day 35 (PN35).
Generation of maternal and paternal lineage
At 17–23 weeks of age, male and female F1 Control and Restricted offspring (1 of each sex, per litter) were mated with breeder females and males, respectively. This generated a paternal and maternal lineage of low birth weight. During F1 pregnancy, there were no further interventions. F2 offspring were born and remained with their F1 mother until weaning at PN35. F2 Control and Restricted females (from maternal line) and males (from paternal line) were randomly allocated (1 of each sex, per litter) for breeding to generate the F3 generation as described for F2. All F2 and F3 offspring were termed Control and Restricted to differentiate between F1 parent birth weights.
The experimental procedure, postmortem blood and tissue collection
F2 and F3 male and female offspring from both parental lineages were randomly allocated to different age groups. Offspring (one male and female per litter) had postmortems at 6 and 12 months of age, with only males aged to 16 months. Before commencement of postmortem animals were anesthetized with an intraperitoneal injection of Ketamine (100 mg/kg body weight) and Ilium Xylazil-20 (30 mg/kg body weight). Major organs and tissues were collected and weighed, the right femur was dissected with all muscles removed.
Peripheral quantitative computed tomography (pQCT)
The right femur was dissected from each animal and measured using pQCT (Stratec XCT-Research SA+; Stratec Research Pty. Ltd., Pforzheim, Germany) and accompanying software. Trabecular and cortical mineral content and density, cortical bone geometry measures and bone bending strength were quantified. In order to maintain consistency, the right femur was selected for pQCT analysis as we have previously published changes to bone measurements at this site.Reference Romano, Wark, Owens and Wlodek 5 , Reference Romano, Wark and Wlodek 6 , Reference Anevska, Gallo and Tran 21 , Reference Romano, Wark and Wlodek 22 , Reference Romano, Hryciw, Westcott and Wlodek 26 , Reference Romano, Wark and Wlodek 27 Each femur was scanned individually by being placed into a plastic test tube (7.5 cm×1.2 cm) allowing for accurate specimen alignment. Low-resolution scout scans were performed where a reference line was placed at the upper border of the distal condyle of the femur. From the reference line of 5 and 50% of the total femur length, two slices of 1 mm thickness with a voxel size 0.1000 mm3 (peel mode 20, contour mode 1) were taken. To eliminate the effect of any remaining soft tissue, automatic density thresholding (400 mg/cm3) was set. Trabecular bone was quantified as 280 mg/cm3 or less and cortical bone was quantified at 710 mg/cm3 or greater.
Statistical analyses
Data are presented as mean±standard error of the mean (s.e.m.), where n denotes the number of animals within each group; from maternal line, n=5–10; from paternal line, n=8–10. F2 and F3 data were analyzed using a two-way ANOVA (SPSS-X; SPSS, Armonk, NY, USA) to determine main effects of uteroplacental insufficiency (Control and Restricted) and generation (F2 and F3). Student’s unpaired t-test was performed, if appropriate, where significant interactions were apparent. All statistical analyses were performed within a sex; males and females were not compared statistically. Statistical significance was set a P<0.05.
Results
Birth weights
Uteroplacental insufficiency surgery reduced birth weight of F1 Restricted females (3.6±0.07 v. 4.3±0.06, P=0.0001) and males (3.6±0.1 v. 4.6±0.07, P=0.0001), by –16 and –11%, respectively, compared with F1 Control counterparts. Regardless of low birth weight in F1 females and males, F2 and F3 offspring birth weights were not different (P>0.05, data not shown).
Adult body weight and femur length
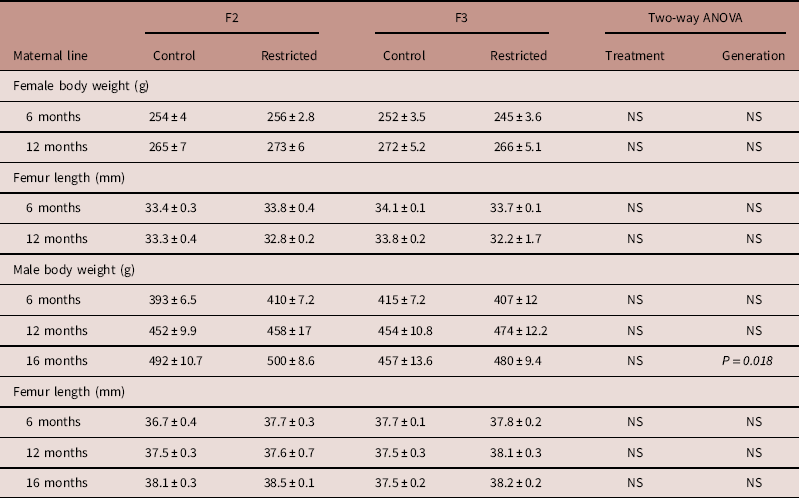
Maternal line
Body weight and femur length of male and female offspring were not different between Control and Restricted groups and F2 and F3 generations at 6 and 12 months of age (Table 1). F3 generation males had decreased body weight (−6%) compared with F2 generation males at 16 months, femur length was not different (Table 1).
Table 1 Maternal line F2 and F3 offspring body weight and femur length

Data are presented as mean±s.e.m. (n=5–10/group).
P-values in italics indicates statistical significance (P<0.05) determined by two-way ANOVA for differences between treatment (control and restricted) and generation (F2 and F3).
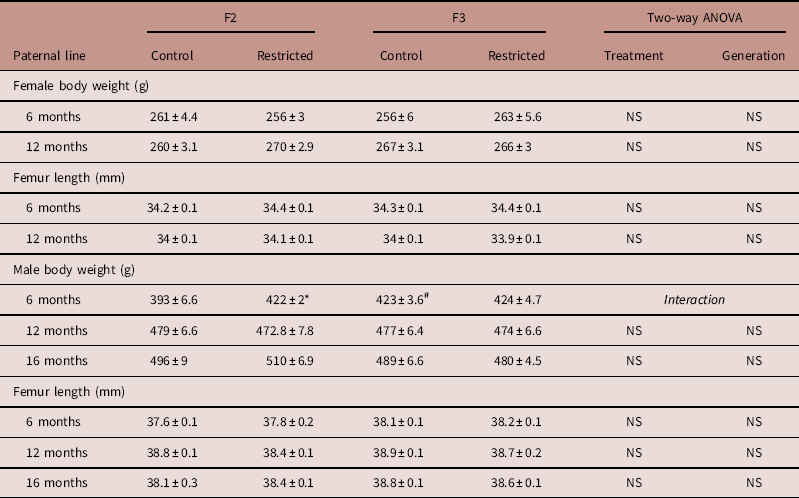
Paternal line
At 6 and 12 months of age, female body weight and femur length were not different between Control and Restricted groups and F2 and F3 generations (Table 2). F2 Restricted and F3 Control males at 6 months of age, had increased body weights (+7.4 and +7.7%, respectively) compared with F2 Control males (P<0.05, Table 2); there were no differences in femur length. Male body weights and femur lengths were not different across groups and generations at 12 and 16 months of age (Table 2).
Table 2 Paternal line F2 and F3 offspring femur length and body weight

Data are presented as mean±s.e.m. (n=8–10/group).
Student’s unpaired t-test performed following interaction, *P<0.05 v. control; # P<0.05 v. F2.
Bone outcomes
Maternal line females
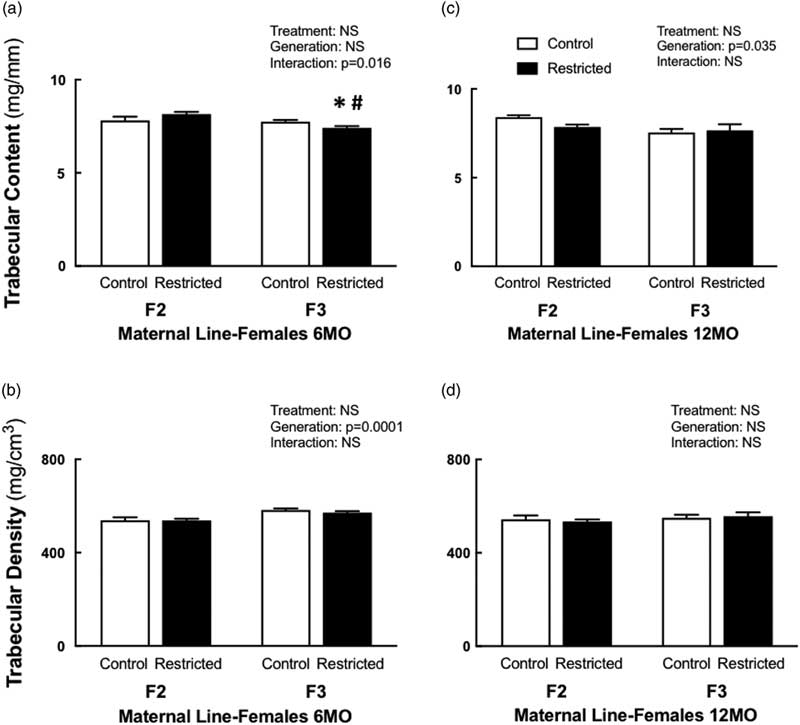
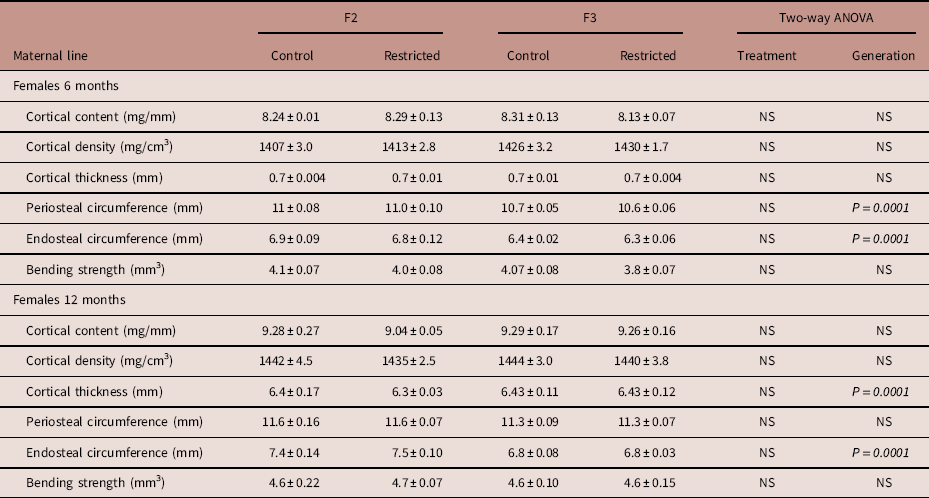
Following a significant interaction between treatment and generation, 6-month-old F3 Restricted females had reduced trabecular content (−4%) compared with F3 Control females, this reduction was even lower (−9%) when compared with F2 Restricted females (Fig. 1a). Interestingly, at 12 months of age, both Control and Restricted F3 had reduced trabecular content (−5.5%) compared with F2 generation females (Fig. 1c). Trabecular bone density increased (+7%) in F3 females at 6 months of age compared with F2 females (Fig. 1b); however, this increase was not sustained at 12 months of age; there were no differences among the groups (Fig. 1d). Both cortical content and density were not different at 6 and 12 months of age (Table 3). Both periosteal (−3.4%) and endosteal (−7.4%) circumferences were reduced at 6 months of age in F3 generation females (Table 3). Despite these changes to bone geometry at 6 months, bone bending strength was not different (Table 3). Decreased endosteal circumference (−9%) was sustained in 12-month-old F3 females (Table 3), followed by an increased cortical thickness (+7%) (Table 3), bone bending strength was not influenced by these changes at 12 months of age (Table 3).
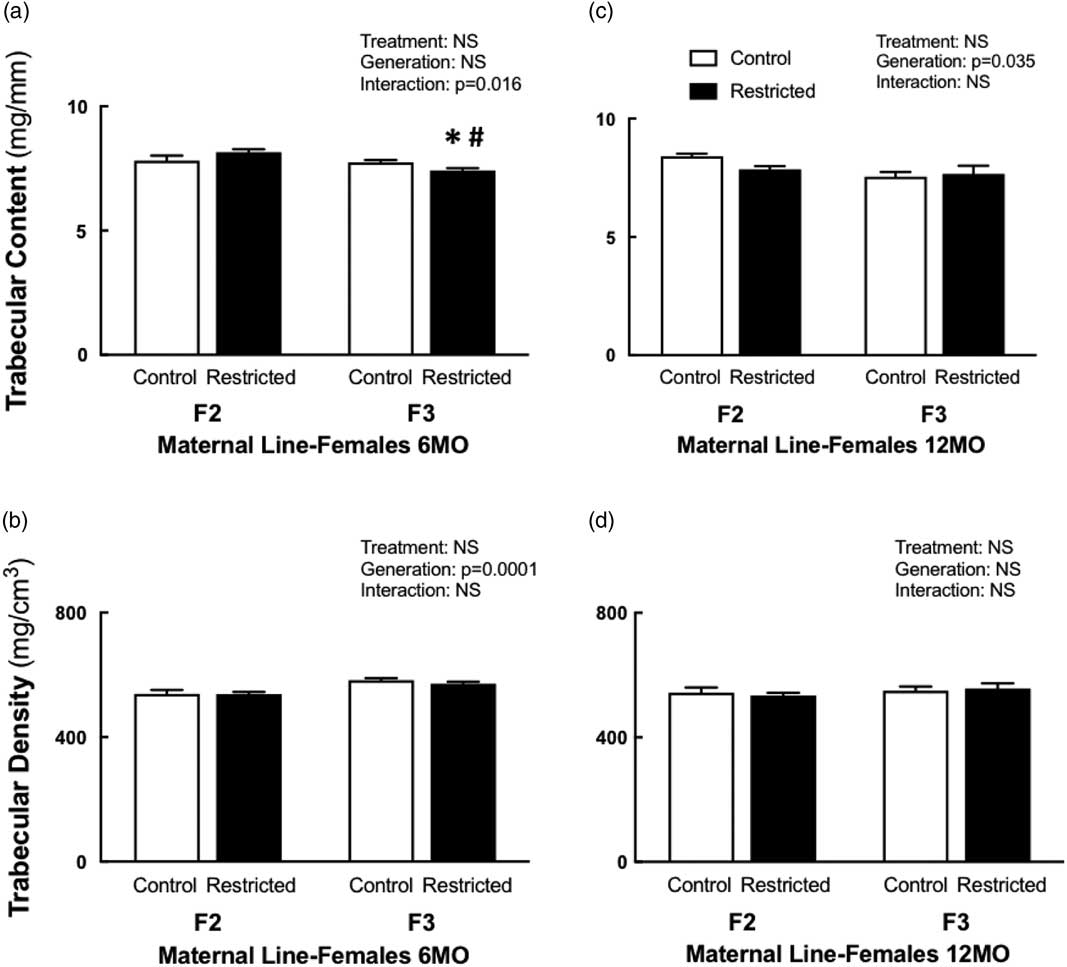
Fig. 1 Maternal line female trabecular content and density at 6 and 12 months. Maternal line F2 and F3 female trabecular content at 6 months (a) and 12 months (c); trabecular density at 6 months (b) and 12 months (d). Data are presented as mean±s.e.m. (6 months n=9–10/group; 12 months n=5–10/group). *P<0.05 v. control; # P<0.05 v. F2 (Student’s unpaired t-test following interaction).
Table 3 Maternal line F2 and F3 female cortical bone measures at 6 and 12 months

Data are presented as mean±s.e.m. (6 months n=9–10/group; 12 months n=5–10/per group).
P-values in italics indicates statistical significance (P<0.05) determined by two-way ANOVA for differences between treatment (control and restricted) and generation (F2 and F3).
Maternal line males
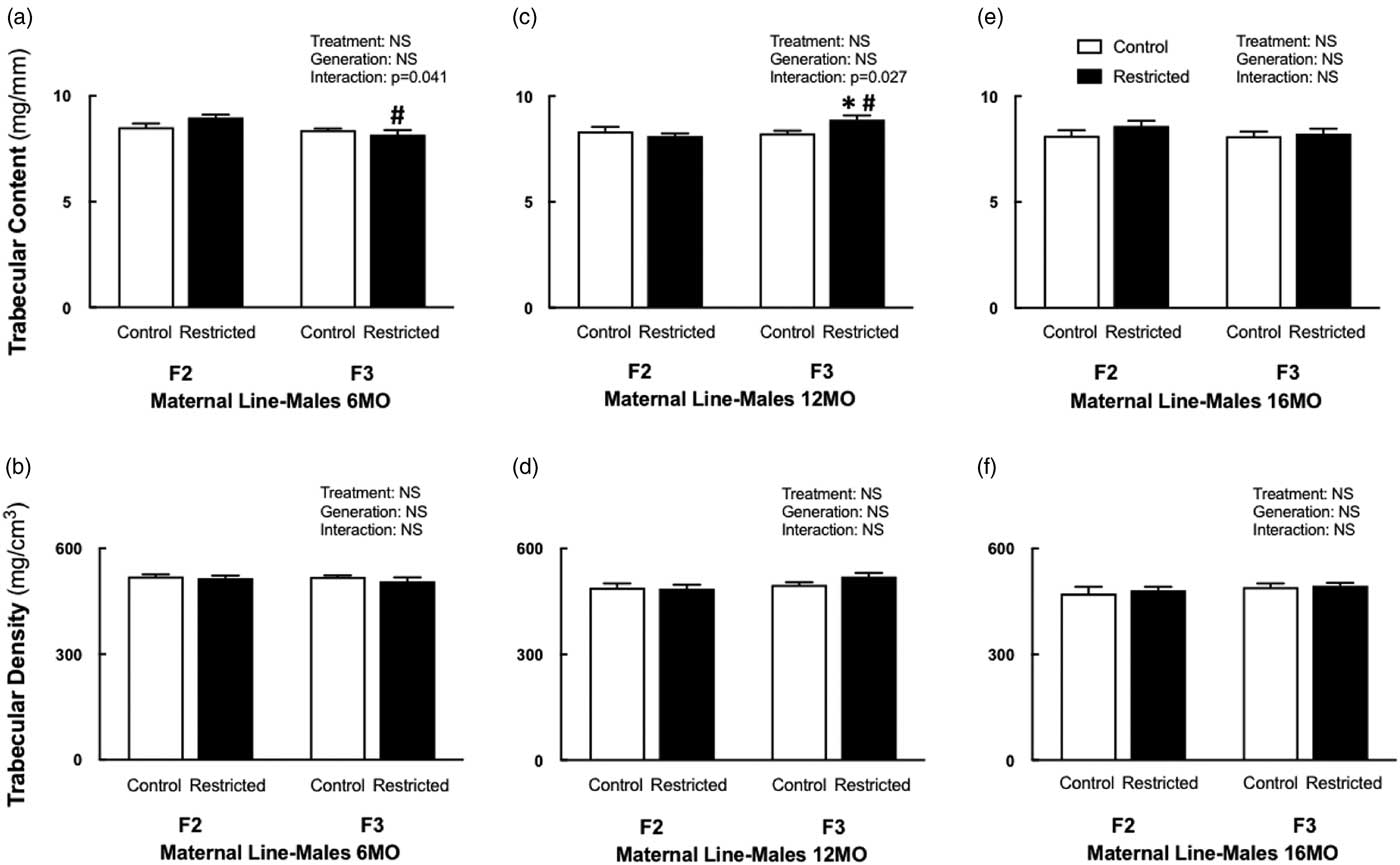
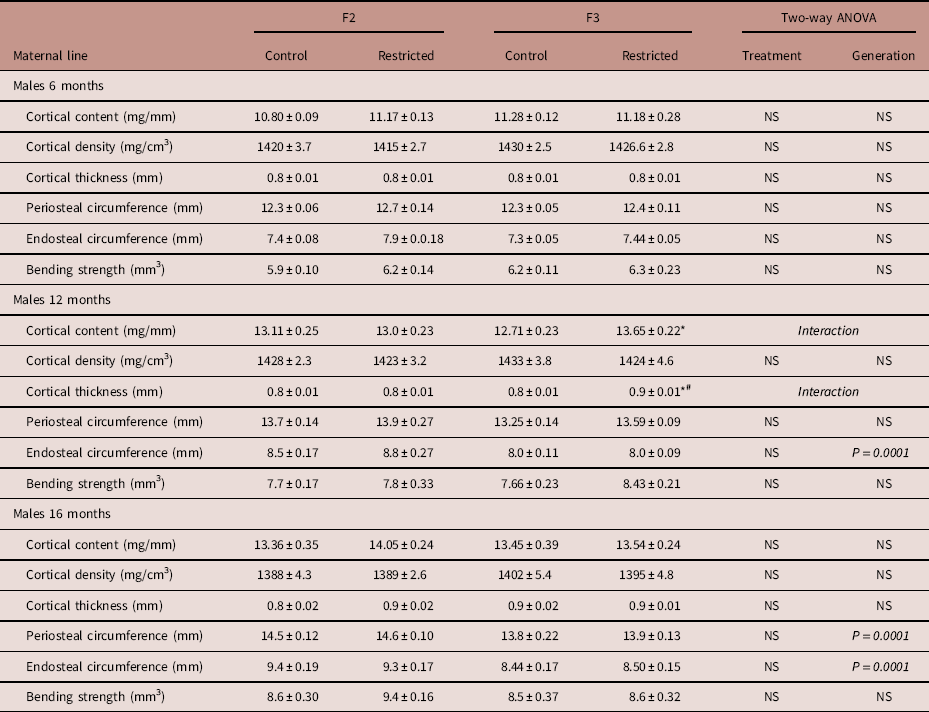
F3 Restricted males had reduced trabecular content (−9%) at 6 months of age compared with F2 Restricted males (Fig. 2a), no other bone parameters were different at this age. The deficit in trabecular content was no longer present at 12 months of age, F3 Restricted males had increased trabecular content compared with F3 Control (+7.8%) and F2 Restricted (+9.5%) males (Fig. 2c). Cortical content increased in 12-month-old F3 Restricted males compared with F3 Controls (+7.4%) (Table 4). Trabecular and cortical density remained unaffected at all ages. F3 Restricted males at 12 months had increased cortical thickness compared with F3 Controls (+6.5%) and F2 Restricted males (+10.6%) (Table 4). The endosteal circumference was decreased (−7.2%) in F3 males compared with F2 counterparts at 12 months of age (Table 4). Despite these changes, periosteal circumference and bending strength were not different at 12 months of age. There were no deficits to trabecular and cortical content and density at 16 months of age. Bone geometry measures endosteal (−9.6%) and periosteal (−4.6%) circumference were both decreased in 16-month-old F3 males compared with F2 males (Table 4); despite these changes, cortical thickness and bending strength did not change.

Fig. 2 Maternal line male trabecular content and density at 6, 12 and 16 months. Maternal line F2 and F3 male trabecular content and density at 6 months (a, b), 12 months (c, d) and 16 months (e, f), respectively. Data are presented as mean±s.e.m.; (6 months n=6–9/group; 12 months; n=7–10/group; 16 months n=6–8/group). *P<0.05 v. control; # P<0.05 v. F2 (Student’s unpaired t-test following interaction).
Table 4 Maternal line F2 and F3 male cortical bone measures at 6, 12 and 16

Data are presented as mean±s.e.m. (6 months n=6–9/group; 12 months n=7–10/group; 16 months n=6–8/group).
P-values in italics indicates statistical significance (P<0.05) determined by two-way ANOVA for differences between treatment (control and restricted) and generation (F2 and F3). Student’s unpaired t-test performed following interaction, *P<0.05 v. control; # P<0.05 v. F2.
Paternal line females
Trabecular and cortical content and density were not different in F2 and F3 Control and Restricted females at 6 and 12 months of age (Supplementary Table S1). There were no changes to bone geometry measures cortical thickness, periosteal and endosteal circumferences and bone bending strength for all paternal line females (Supplementary Table S1).
Paternal line males
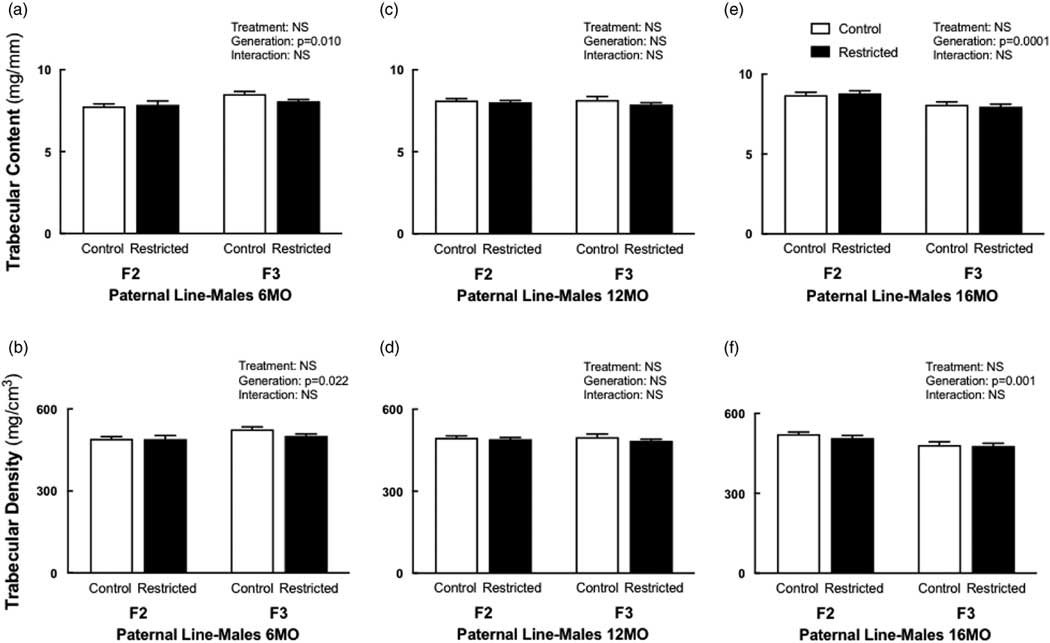
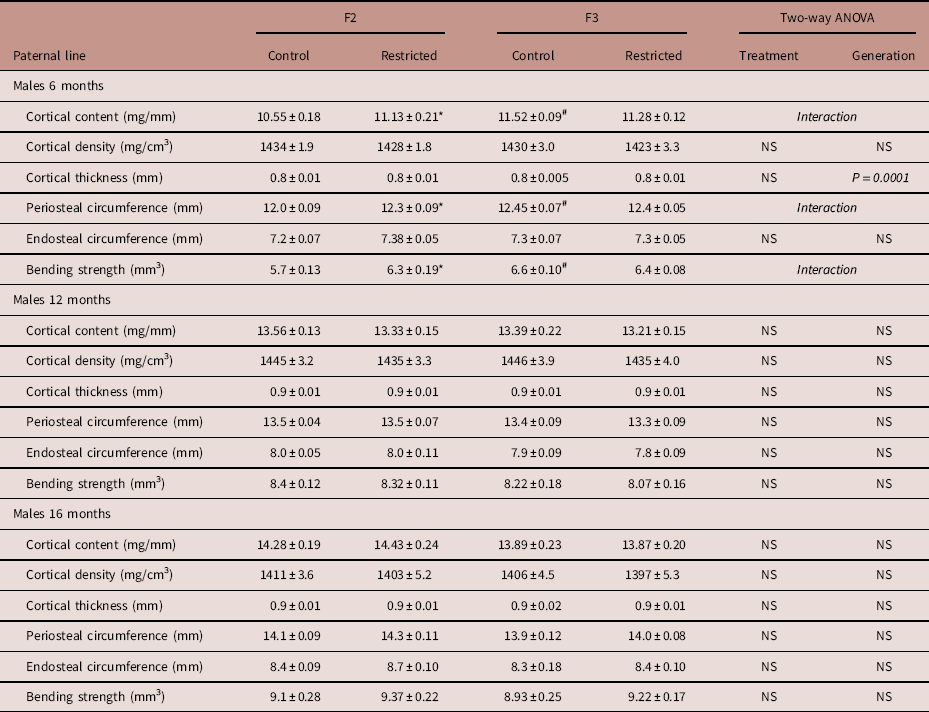
Trabecular content and density both increased (+5–6%) in F3 males at 6 months of age compared to F2 males (Fig. 3a and 3b). The cortical content was increased in both F2 Restricted (+6%) and F3 Control (+9%) males compared with F2 Control males, following a significant interaction (Table 5); with no differences in cortical density (Table 5). Cortical thickness increased (+4.4%) at 6 months, in F3 males (Table 5). The endosteal circumference was not different (Table 5); periosteal circumference increased in both F2 Restricted (+3%) and F3 Control (+4%) males compared with F2 Control (Table 5). Similarly, at 6 months of age, bending strength increased in F2 Restricted (+10.8%) and F3 Control (+6.5%) males compared with F2 Control (Table 5). Interestingly, at 12 months, there were no differences in bone parameters. F3 males aged to 16 months had decreased trabecular content (−8.3%) and density (−7%) compared with F2 counterparts (Fig. 3c and 3d), no other parameters were different at 16 months.

Fig. 3 Paternal line male trabecular content and density at 6, 12 and 16 months. Paternal line F2 and F3 male trabecular content and density at 6 months (a, b), 12 months (c, d) and 16 months (e, f), respectively. Data are presented as mean±s.e.m. (6 months n=8–10/group; 12 months n=8–10/group; 16 months n=9–10/group).
Table 5 Paternal line F2 and F3 male cortical bone measures at 6, 12 and 16 months

Data are presented as mean±s.e.m. (6 months n=8–10/group; 12 months n=8–10/group; 16 months n=9–10/group).
P-values in italics indicates statistical significance (P<0.05) determined by two-way ANOVA for differences between treatment (control and restricted) and generation (F2 and F3). Student’s unpaired t-test performed following interaction, *P<0.05 v. control; # P<0.05 v. F2.
Discussion
Both human and animal studies have reported disease transmission to F2 and F3 generations, however findings are not consistent. This is likely attributed to the timing and duration of the initial insult that occurs. Studies that investigate transgenerational outcomes focus largely on cardiovascular and metabolic health. To date there are no studies that investigate bone health across multiple generations in the presence of an intrauterine insult such as uteroplacental insufficiency. The present study demonstrates that there is no transgenerational transmission of low birth weight and bone deficits, as F2 and F3 male and female offspring of both maternal and paternal lines are born of normal birth weight. The changes to bone do not indicate that F2 and F3 male and female offspring have adverse bone health unlike F1 generation growth restricted males and females.
To determine whether transgenerational transmission occurred, we performed uteroplacental insufficiency in F0 females on embryonic day 18 to induce growth restriction.Reference Wlodek, Westcott and O’Dowd 23 Not surprisingly, F1 offspring were born growth restricted, however birth weights of males and females in F2 and F3 generations were not affected by the initial insult of uteroplacental insufficiency surgery in the F0. This suggests that low birth is not transmitted across generations, in both maternalReference Anevska, Gallo and Tran 21 and paternal lines in the absence of further insults.
Maternal line bone outcomes
Within the maternal line cohort, there were reductions to bone observed for F2 and F3 females. However, these changes in bone were not further exacerbated with aging females to 12 months old. Importantly, these changes to bone health were largely due to generation comparisons rather than the low birth weight of the F1 females that gave rise to the maternal line. This is indicating that the initial insult of uteroplacental insufficiency, resulting in growth restriction in the F1, only appears to program severe bone deficits in the F1 generation due to the depleted blood supply carrying oxygen and nutrients.Reference Romano, Wark, Owens and Wlodek 5 , Reference Romano, Wark and Wlodek 6 , Reference Romano, Wark and Wlodek 22 More recently, when stress was introduced during pregnancy, no adverse bone phenotypes were observed in F1 growth restricted females and their F2 female offspring.Reference Anevska, Cheong, Wark, Wlodek and Romano 28 Together with the findings of our current study, it appears that F2 and F3 females do not inherit poor bone health from F1 growth restricted females. Recently, we investigated the metabolic health of F2 females that were subjected to stressors while in utero.Reference Cheong, Cuffe and Jefferies 29 Regardless of F1 maternal birth weight and stress exposure during pregnancy, these F2 females did not have adverse metabolic health or organ deficits and dysfunction.Reference Cheong, Cuffe and Jefferies 29 Overall, it is clear that there is no transgenerational transmission of bone deficits in F2 and F3 females via the maternal line in our model of growth restriction.
Male offspring of the maternal line, similar to their female counterparts, did not have adverse bone health. Despite F3 Restricted males having increased trabecular and cortical content and cortical thickness, this is likely driven by the increased body weight of these males; however, body weight differences did not reach statistical significance. Previously, when we have corrected for body weight in F1 offspring, bone parameters were no longer significant.Reference Romano, Wark, Owens and Wlodek 5 , Reference Romano, Wark and Wlodek 6 , Reference Romano, Wark and Wlodek 22 The decrease in endosteal circumference in F3 Restricted males can be explained by the increased cortical thickness. If the diameter of the cortex is increased, by an increased cortical thickness, this is followed by endosteal apposition, thereby maintaining bone strength.Reference Davison, Siminoski and Adachi 30 Despite the changes to bone geometry measures at 12 and 16 months of age, bending strength was not adversely affected, suggesting that these changes in bone geometry are maintaining bone strength.
It is evident in the maternal line that there are no adverse bone phenotypes in F2 and F3 generations. We believe that the timing of uteroplacental insufficiency surgery, performed on embryonic day 18, is too late to induce changes to the F2 gametes within the F1 fetuses to cause an adverse effect to bone health. In support of this notion we previously identified that pregnant growth restricted females on (embryonic day 20) appear to have gains in bone such that they are no longer different to pregnant controls.Reference Anevska, Gallo and Tran 21 It is likely that these gains in maternal bone late in pregnancy ensures that there are adequate minerals needed for fetal skeletal mineralization as F2 male and female offspring do not suffer from adverse bone health at 6 months of age.Reference Anevska, Gallo and Tran 21 Despite the lack of adverse bone health, a key finding of this study was that bending strength was not affected in F2 and F3 females and males. This is of major importance as decreased bone bending strength is related to increased risk of fracture.Reference Davison, Siminoski and Adachi 30
Paternal line bone outcomes
From our previous studies, F1 growth restricted males have shorter, weaker and narrower bones.Reference Romano, Wark, Owens and Wlodek 5 , Reference Romano, Wark and Wlodek 6 , Reference Romano, Wark and Wlodek 22 We therefore wanted to determine, whether in the absence of maternal influence, if a growth restricted father contributed to bone deficits in subsequent generations. To date, we are the first to examine paternal line transmission and bone health in a model of uteroplacental insufficiency across multiple generations. Bone health did not change in F2 and F3 females, regardless of paternal birth weight, indicating that bone deficits are not transmitted. In order for disease transmission to occur in offspring, sperm must be altered, or exposed to an insult, during the process of spermatogenesis.Reference Dickinson, Moss and Gatford 10 Due to the differences between oocytes and sperm, it is likely that paternal line programming occurs at the time of conception.Reference Dickinson, Moss and Gatford 10 As F1 growth restricted males had no further interventions, apart from mating, the likelihood of altered sperm is unlikely. Others have reported disease transmission in female offspring via the paternal line. Male Sprague–Dawley rats fed a high-fat diet programmed metabolic dysfunction in their female offspring.Reference Ng, Lin and Laybutt 31 Similarly, F0 male mice fed a high-fat diet fathered obese F1 offspring, and F1 males fathering F2 females with insulin resistance.Reference Fullston, Ohlsson Teague and Palmer 32 F1 female mice, born to diet-induced obese fathers, had disrupted fertility with altered ovarian genes and delayed embryo development.Reference Fullston, Shehadeh and Sandeman 33 These studies confirm the transmission of disease across generations and in a specific manner of mode of transmission. It is clear in the present study there is no transmission of poor bone health to female offspring via the paternal line.
Similarly, paternally generated males did not have adverse bone health. It is interesting to note of all the ages in the study, bending strength was found to be increased at 6 months in F2 Restricted and F3 Controls males. This increase in strength is likely due to the increased cortical thickness, and periosteal circumference as this parameter is strongly associated with bone strength.Reference Davison, Siminoski and Adachi 30 , Reference Orwoll 34 Likewise, these males were heavier compared with F2 Control males, which is a likely contributor to these changes in bone. Importantly, the above changes were no longer present at 12 and 16 months. The increased trabecular content and density in F2 males are a result of generation differences rather than paternal weight, and considering no other parameters were affected these results should be interpreted carefully. Trabecular bone was not different at 6 and 12 months of age, and the increase at 16 months could be due to natural variation between the cohorts. Previously, we did not observe any changes to trabecular bone in maternal males aged to 16 months.Reference Anevska, Cheong, Wark, Wlodek and Romano 28 Despite the lack of studies in paternal line transmission and bone health, others have provided evidence of paternal influence. When pregnant F0 females were administered with an endocrine disruptor, spermatogenic capacity was disrupted in four generations, causing organ, and tissue abnormalities.Reference Anway, Cupp, Uzumcu and Skinner 35 , Reference Anway, Leathers and Skinner 36 Overall, it is important to note that while F1 growth restricted males have poor bone health this does not impact future generations.
To date there is no evidence of transgenerational transmission of bone deficits. In our model of uteroplacental insufficiency, low birth weight programs poor bone health in the F1 generation.Reference Romano, Wark and Wlodek 22 However, in the present study, second and third generation offspring are spared from adverse bone health. Whilst there were minimal effects, our study is quite novel as there is no previous evidence examining bone health over subsequent generations and via both parental lines. Overall, we have demonstrated there is no transgenerational effect on F2 and F3 offspring bone health, via both maternal and paternal lines in our model of uteroplacental insufficiency.
Acknowledgments
None.
Financial Support
M.E.W. received funding from the National Health and Medical Research Council of Australia (APP1025426; APP1045602). K.A. is supported by an Australian Government Research Training Program Scholarship.
Conflicts of Interest
None.
Ethical Standards
The authors assert that all procedures contributing to this work comply with the ethical standards following the code for the care and use of animals for scientific purposes from the National Health and Medical Research Council (NHMRC) of Australia, and were approved by the University of Melbourne Animal Ethics Committee.
Supplementary material
To view supplementary material for this article, please visit https://doi.org/10.1017/S204017441800020X