


Introduction
As the world has seen large reductions in child mortality over the last decades, there has been increasing focus on improving child development. An estimated 200 million children worldwide fail to meet their development potential due to poverty, poor health, and unstimulating environments. The 2007 and 2011 Lancet series on child development identified major risks for poor child development.Reference Walker, Wachs and Gardner 1 , Reference Walker, Wachs and Grantham-McGregor 2 These risks include intrauterine growth restriction (IUGR), stunting, iodine deficiency, iron-deficiency anemia, malaria, lead exposure, HIV, maternal depression and inadequate cognitive stimulation. Additionally, maternal education and breastfeeding were identified as protective factors.
Africa has a high burden of risk factors for poor child development. Fifteen of the top 24 countries with the highest burden of stunting worldwide are in sub-Saharan Africa. 3 An estimated 40% of the population, including 58 million school-aged children, have inadequate iodine intakes.Reference Andersson, Karumbunathan and Zimmermann 4 In 2010, Tanzania, Uganda, Mozambique and Côte d’Ivoire accounted for an estimated 47% of malaria cases worldwide. 5 Many of these risk factors are inter-related, and the accumulation of risk can lead to long term and enduring impacts on child development. Early life is critical because perturbations during this period of rapid brain development can lead to enduring changes to the brain’s structural and functional capacity.Reference Grantham-McGregor, Cheung and Cueto 6 Failure to meet developmental milestones during this critical window has lasting effects throughout the life course, including school achievement, adult earnings and intergenerational transmission of poverty.Reference Engle, Black and Behrman 7 , Reference Engle, Fernald and Alderman 8
The objective of this paper is to identify scope for improvement by classifying countries across levels of risk factors for poor child development and coverage of interventions addressing these risk factors. Identifying high-performing countries allows us to estimate the potential impact of health interventions in sub-Saharan Africa if all countries were to achieve the level of the high performing countries. High performers also serve as a model of positive deviance for the region.
Methods
Domains of interest
We focus on the risk factors identified in the Walker et al. Lancet series on child development which are modifiable through maternal, child, or household-level interventions and for which there are nationally representative indicators.Reference Walker, Wachs and Gardner 1 , Reference Walker, Wachs and Grantham-McGregor 2 The risk factors and interventions influencing cognitive development in children can be divided into three domains: nutrition, environment, and mother–child interactions.
Nutrition
Major nutritional risk factors for poor child development include IUGR, stunting, iodine deficiency and iron-deficiency anemia. Low birthweight, a proxy for IUGR, is associated with poor cognitive development.Reference Lee and Houk 9 – Reference Liu, Sun, Neiderhiser, Uchiyama and Okawa 13 Stunting at age two or three has been associated with school attainment, dropout and later life cognitive deficits.Reference Walker, Wachs and Gardner 1 Iodine deficiency is the main cause of preventable mental impairment in childhood.Reference Zimmermann 14 Severe iodine deficiency during pregnancy can lead to cretinism; however, even sub-clinical deficiencies are associated with intellectual impairment and neurological abnormalities.Reference Haddow, Palomaki and Allan 15 Iron is essential for both mental and physical development. Iron-deficiency anemia may result in impaired motor development, coordination and scholastic achievement in young children.
Balanced energy and protein supplementation to underweight women, micronutrient supplementation, and intermittent preventive treatment in malaria endemic areas have been shown to increase birthweight, reduce incidence of low birthweight, and/or reduce risk of a small-for-gestational-age baby.Reference Bhutta, Ahmed and Black 16 A wide range of interventions have demonstrated efficacy in reducing stunting, including complementary feeding education, food supplementation in food insecure populations, preventive zinc supplementation, hygiene interventions that reduce incidence of diarrhea, and deworming in populations with a high burden of intestinal helminthiasis.Reference Bhutta, Ahmed and Black 16 , Reference Bhutta, Das and Rizvi 17 Estimates suggest that existing interventions designed to improve nutrition and related disease could reduce stunting at age 36 months by 36%.Reference Bhutta, Ahmed and Black 16
Mass fortification of foodstuffs can address iodine and iron deficiencies. The Iodine Global Network and WHO recommend universal salt iodization to prevent and treat iodine deficiency disorders. 18 Salt iodization decreases the risk of iodine deficiency in children by 41%, improves cognitive function, reduces risk of low intelligence, and improves IQ.Reference Wu, Liu, Li and Clar 19 , Reference Aburto, Abudou, Candeias and Wu 20 While iron supplementation can treat and prevent iron deficiency, due to the potential for increased risk of death with malaria infection, it is recommended only for non-malarial areas.Reference Bhutta, Ahmed and Black 16 Because iron levels in fortified grains are far lower than those of iron supplements, grain fortification is considered an alternative intervention to address iron deficiency. Mass fortification of foodstuffs with iron is estimated to reduce the odds of iron-deficiency anemia in children by 28%.Reference Bhutta, Ahmed and Black 16
Breastfeeding is a protective factor for child development. Breastfeeding could benefit child development through improved nutrition, reduced infant morbidity, or mother–child interactions.Reference Walker, Wachs and Gardner 1 Studies have shown a small but detectable effect of breastfeeding on child cognition, with larger effects among babies with low birthweight and with longer duration of exclusive breastfeeding.Reference Horwood and Fergusson 21 – Reference Daniels and Adair 23 Antenatal breastfeeding education and support improve breastfeeding outcomes, including exclusive breastfeeding.Reference Imdad, Yakoob and Bhutta 24 Universal implementation of educational and promotional strategies for breastfeeding are estimated to increase exclusive breastfeeding until 1 month by 30% and from 1 to 5 months by 90%.Reference Bhutta, Das and Rizvi 17
Environment
Malaria, lead exposure, and HIV are major environmental risk factors for poor child development. In severe or cerebral malaria, organisms can directly damage the brain and central nervous system, causing neurological impairment.Reference Idro, Carter, Fegan, Neville and Newton 25 – Reference Boivin 27 Malaria infection can indirectly lead to poor child development outcomes through poor nutrition, decreased exploration of the environment and decreased physical activity.Reference Walker, Wachs and Gardner 1 To address the burden of malaria, the Global Malaria Action Plan recommends preventive and therapeutic interventions such as long-lasting insecticide-treated nets (ITN), indoor residual spraying (IRS) with insecticide and artemisinin-based combination therapies. 5
Lead is a neurotoxin which has been associated with decreased intelligence and impaired neurobehavioral development.Reference Boivin 27 No safe blood lead threshold has been identified with respect to infant and child neurodevelopment.Reference Sherr, Mueller and Varrall 28 Even at levels below those considered toxic, lead exposure is associated with 2–5 point decreases in IQ.Reference Sherr, Croome, Parra Castaneda, Bradshaw and Herrero Romero 29 Because leaded fuel has been a major source of lead exposure worldwide, shifting to unleaded fuel is primary intervention to address toxic lead exposure.
HIV-affected children are at increased risk for poor health and development outcomes. 30 Two systematic reviews found delays in all domains of cognitive development in both children infected with HIV and those affected by HIV.Reference Sherr, Mueller and Varrall 28 , Reference Sherr, Croome, Parra Castaneda, Bradshaw and Herrero Romero 29 The WHO recommends antiretroviral (ARV) for pregnant women with HIV to reduce mother-to-child transmission (MTCT). 30 Without treatment, approximately a third of infants born to HIV-infected mothers will be infected during pregnancy, birth or breastfeeding.Reference De Cock, Fowler and Mercier 31
Mother–child interactions
Poor maternal mental health is associated with poor child growth and development.Reference Wachs, Black and Engle 32 It is thought that depressed women interact differently with their children than mothers without depression, leading to poorer cognitive, social-emotional and behavioral outcomes.Reference Halbreich and Karkun 33 A 2006 systematic review of studies from 41 countries worldwide found the reported prevalence of postpartum depression (PPD) ranged from 0% to more than 73%.Reference Halbreich and Karkun 33 , Reference Leahy-Warren and McCarthy 34 Interventions to address PPD include antidepressants, psychotherapy, support or a combination of these treatments.Reference Leahy-Warren and McCarthy 34
Environments with inadequate stimulation and few opportunities for learning are associated with poor cognitive development outcomes.Reference Walker, Wachs and Gardner 1 Studies report higher cognitive function when children are given stimulating environments, with positive effects that are evident for years after the intervention.Reference Magwaza and Edwards 35 – Reference Eickmann, Lima and Guerra 37 Additionally, maternal education is associated with higher child development. Better-educated women are more likely to delay pregnancy until after adolescence, leading to better birth and early life outcomes in their offspring; conversely, children of young mothers are more likely to suffer from low birthweight, under nutrition and poor physical and cognitive development. 38 Interventions to address low maternal education include universal primary/secondary schooling and delaying marriage, as girls who marry early often abandon formal education and become pregnant. 38
Data sources and analyses
To examine the prevalence of risk factors affecting child cognitive development and the prevalence of development-sensitive interventions, we used national-level data from 51 countries in sub-Saharan Africa from large-scale national surveys including Demographic and Health Surveys, Multiple Indicator Cluster Surveys, Malaria Indicator Surveys, and AIDS Indicator Surveys. We also used data repositories including the WHO’s Vitamin and Mineral Nutrition Information System, the Iodine Global Network, and the Food Fortification Initiative. Country reports from UNAIDS, UNICEF, World Bank and the WHO provided supplementary data. For interventions without data on national coverage, we have used estimates from the literature to determine the expected reductions in the level of the risk factor(s) if the interventions were widely available. Indicator definitions and sources can be found in Table 1. Only estimates from 2000 or later were included.
Table 1 Risk indicators, definitions and sources, by domain

AIS, AIDS Indicator Survey; CDC, Centers for Disease Control; DHS, Demographic Health Survey; EMIP, Education Measurement Information and Practice; FFI, Food Fortification Initiative; IGN, Iodine Global Network; MICS, Multiple Indicator Cluster Survey; MIS, Malaria Indicator Survey; ORS, oral rehydration salts; VMNIS, Vitamin and Mineral Nutrition Information System.
For each risk factor/intervention, we ranked countries by prevalence, divided them into quintiles, and assigned point values based on quintile. For risk factors, we assigned 1 point if in the highest quintile and 5 points if in the lowest quintile. For interventions, we assigned 5 points if in the highest quintile and 1 point if in the lowest quintile. For iron fortification legislation, we assigned points as follows: 1 for ‘no legislation’, 2 for ‘planning legislation’, 3 for ‘voluntary fortification’ and 4 for ‘mandatory fortification’. Countries for which data were not available were assigned the mean score of available indicators within the same domain. We then summed risk factor/intervention scores within the nutrition and environment domains, excluding countries who were missing >75% of indicators within a domain. Because all countries in sub-Saharan Africa have converted to unleaded fuel, lead exposure was not included in the calculation of environment domain scores. As 67% of countries were missing more than half of the mother–child interaction indicators, we did not calculate a domain score and instead discuss country performance qualitatively by risk factor/intervention.
Results
Nutrition
IUGR/low birthweight
Nutrition domain indicators are presented in Table 2. Of the 45 countries with data, prevalence of low birthweight (<2,500 g) ranged from 5.6% in Kenya to 34.7% in Mauritania. Eighteen countries had low birthweight prevalence <10%. Among the countries with high burden of low birthweight, Mali, Senegal, Comoros and Chad had low birthweight prevalence of 15–20%. We identified no data on national-level coverage of interventions specifically to address birthweight.
Table 2 Nutrition domain – prevalence of low birthweight, stunting, iodine deficiency, iron-deficiency anemia, and exclusive breastfeeding indicators, by country

aSalt iodized above minimum recommendation (>15 ppm)
Stunting
Of 44 countries with data on stunting (HAZ⩽--2 SD) among children under 5 years, prevalence ranged from 16.5% in Gabon to 57.7% in Burundi. Only Senegal and Gabon had stunting prevalence <20%. 39 We identified no data on national-level coverage of interventions to address stunting.
Exclusive breastfeeding
Of 45 countries with data on exclusive breastfeeding among children under 6 months, prevalence ranged from 1% in Djibouti to 84.9% in Rwanda. Only 12 countries had exclusive breastfeeding prevalence ⩾50%. We identified no data on national-level coverage of interventions to address exclusive breastfeeding.
Iodine deficiency
Among the 39 countries with data, the prevalence of iodine deficiency (urinary iodine excretion [UIE] <100 µg/l) ranged from 0% in Rwanda to 92% in Angola. Of the 40 countries with data on median population urinary iodine excretion, eight countries were considered iodine insufficient (data not presented). Of the 46 countries with data, the proportion of households with iodized salt ranged from 0.4% in Djibouti to >99% in DR Congo, Uganda and Rwanda. In sixteen countries, ⩾90% of households had iodized salt. In fourteen countries, ⩽50% of households had iodized salt.
Iron-deficiency anemia
Of the 33 countries with data on anemia (hemoglobin [Hb] <11 g/dl) among children aged 6–59 months, prevalence ranged from 26.5% in Kenya to 87.9% in Burkina Faso. Twenty-five countries had anemia prevalence ⩾50%. The highest levels of anemia were clustered in West Africa. Even among the countries with the lowest burden of anemia, none had prevalence <25%. Of the 31 countries with data on severe anemia (Hb <7 g/dl) among children aged 6–59 months, prevalence ranged from 0.5% in Rwanda to 11.3% in Burkina Faso.
Twenty-one countries had mandatory fortification of grains with at least iron. Three countries had voluntary iron fortification of grains, and six countries were planning fortification. Most countries fortified wheat; however, eight countries fortified both wheat and maize. Burundi was planning rice fortification. Sixteen countries had no fortification legislation.
Nutrition domain
The nutrition domain score is presented in Fig. 1. Réunion, South Sudan, Western Sahara and Seychelles were missing more than 75% of the nutrition domain indicators and were excluded from the domain score. Of 39 possible points in the domain, scores ranged from 8 in Sudan to 35 in Rwanda.
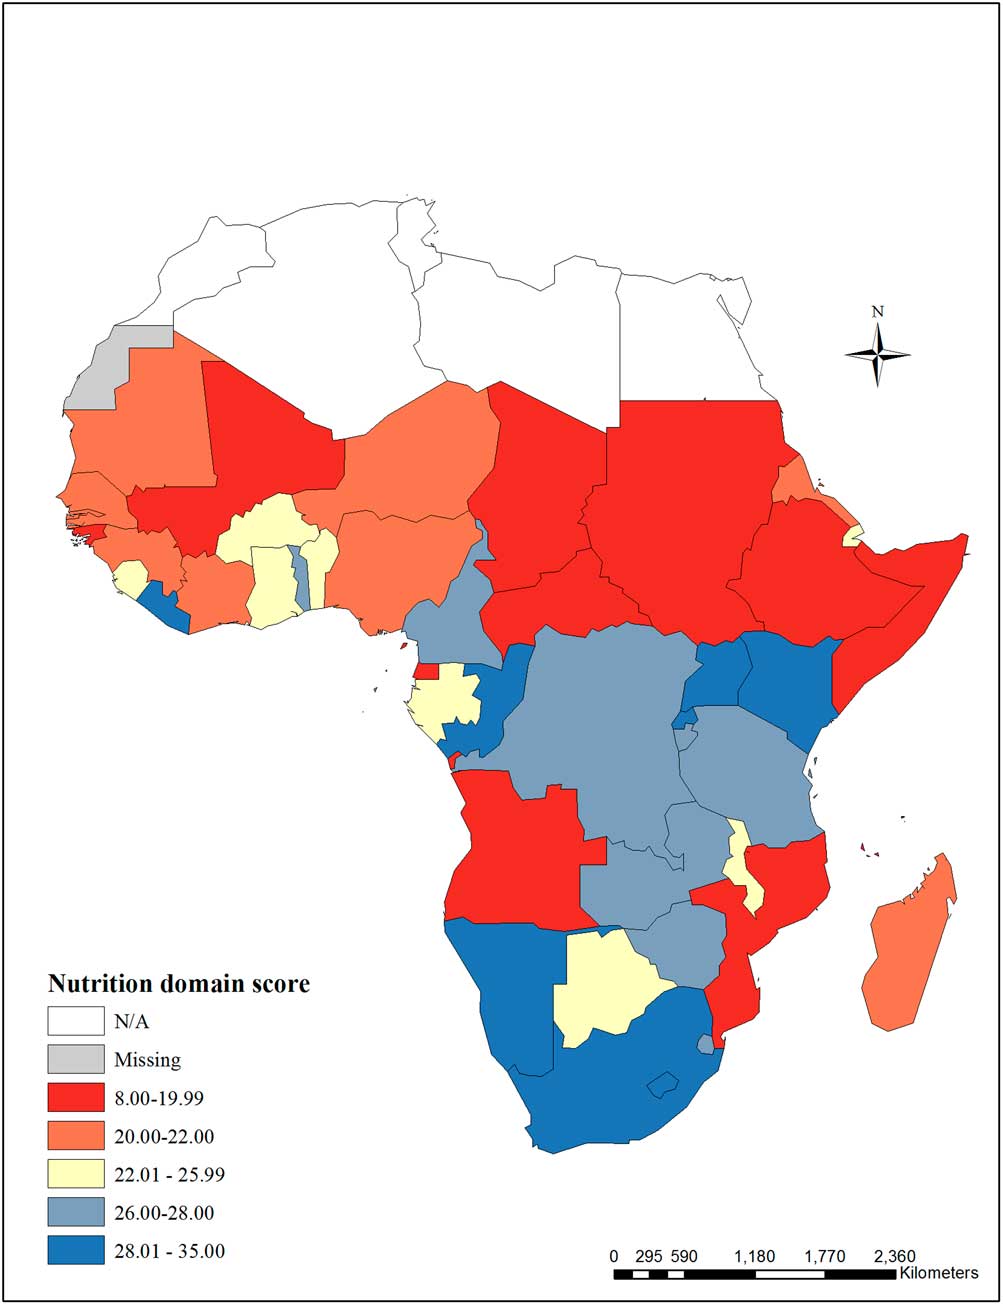
Fig. 1 Nutrition domain score – The nutrition domain score includes the following indicators: low birthweight, stunting among children under 5 years, population-level iodine deficiency, household coverage of iodized salt, children aged 6–59 months with any anemia, children aged 6–59 months with severe anemia, legislation on iron fortification of grains, and exclusive breastfeeding. Réunion, South Sudan, Western Sahara and Seychelles were missing >75% of the nutrition domain indicators and were excluded from the score.
Environment
Malaria
Environment domain indicators are presented in Table 3. Of 17 countries with data on malaria prevalence among children aged 6–59 months, prevalence ranged from 2.3% in The Gambia to 65.9% in Burkina Faso. In Kenya, 12.3% of children aged 3–59 months tested positive for malaria. 40 Of 38 countries with data on children under 5 years sleeping under an ITN, prevalence ranged from 0.6% in Swaziland to 74.1% in Rwanda. In seven countries, <50% of children slept under an ITN. Of 28 countries with data on household IRS, prevalence ranged from 0.3% in Burundi to 39.2% in Equatorial Guinea. Of 43 countries with data on children under 5 years with fever who received anti-malarial drugs, prevalence ranged from 0.6% in Swaziland to 65% in Sudan.
Table 3 Environment domain – prevalence of indicators for malaria and HIV-affected children, by country

aITN with long acting insecticide. bITN treated <6 months before the survey.
Lead exposure
To our knowledge, there are no nationally representative estimates of blood lead levels in sub-Saharan Africa. Available studies are not representative of sub-Saharan Africa as a whole, but they provide some information about lead exposure in the sub-continent before the shift to unleaded fuel. One study from South Africa found that 15–30% of children in urban areas had blood lead levels >25 µg/dl.Reference Nriagu 41 A study of school children in Ghana found average blood lead levels of 28–32 µg/dl.Reference Golow and Kwaansa-Ansah 42 Blood lead levels >10 µg/dl are generally considered toxic. 43 Over the last 15 years, governments in Africa have implemented strategies to shift to alternate fuel additives such as ethanol or MTBE. As of April 2014, all countries in sub-Saharan Africa had shifted to unleaded fuel. 44
HIV-affected children
Of 48 countries with data, prevalence of HIV among adults aged 15–49 years ranged from 0.2% in Sudan and Cape Verde to 27.4% in Swaziland. Countries with the highest adult prevalence of HIV were clustered in southern Africa where nine countries had prevalence >10%. Among the 22 countries with data, the prevalence of HIV among pregnant women ranged from 0.2% in Niger to 37.7% in Swaziland. In Botswana, UNAIDS estimated that 10.2% of women seroconvert during pregnancy. 45 The proportion of pregnant women with HIV receiving ARVs ranged from 0.5% in Comoros and Eritrea to ⩾95% in South Africa and Swaziland.
Environment domain
The environment domain score category is presented in Fig. 2. Cape Verde, Mauritius, Réunion, Seychelles and Western Sahara were missing more than 75% of the environment domain indicators and were excluded from the domain score. Of 35 possible points in the environment domain, scores ranged from 14 in Eritrea, Lesotho, and Nigeria to 30 in Madagascar.
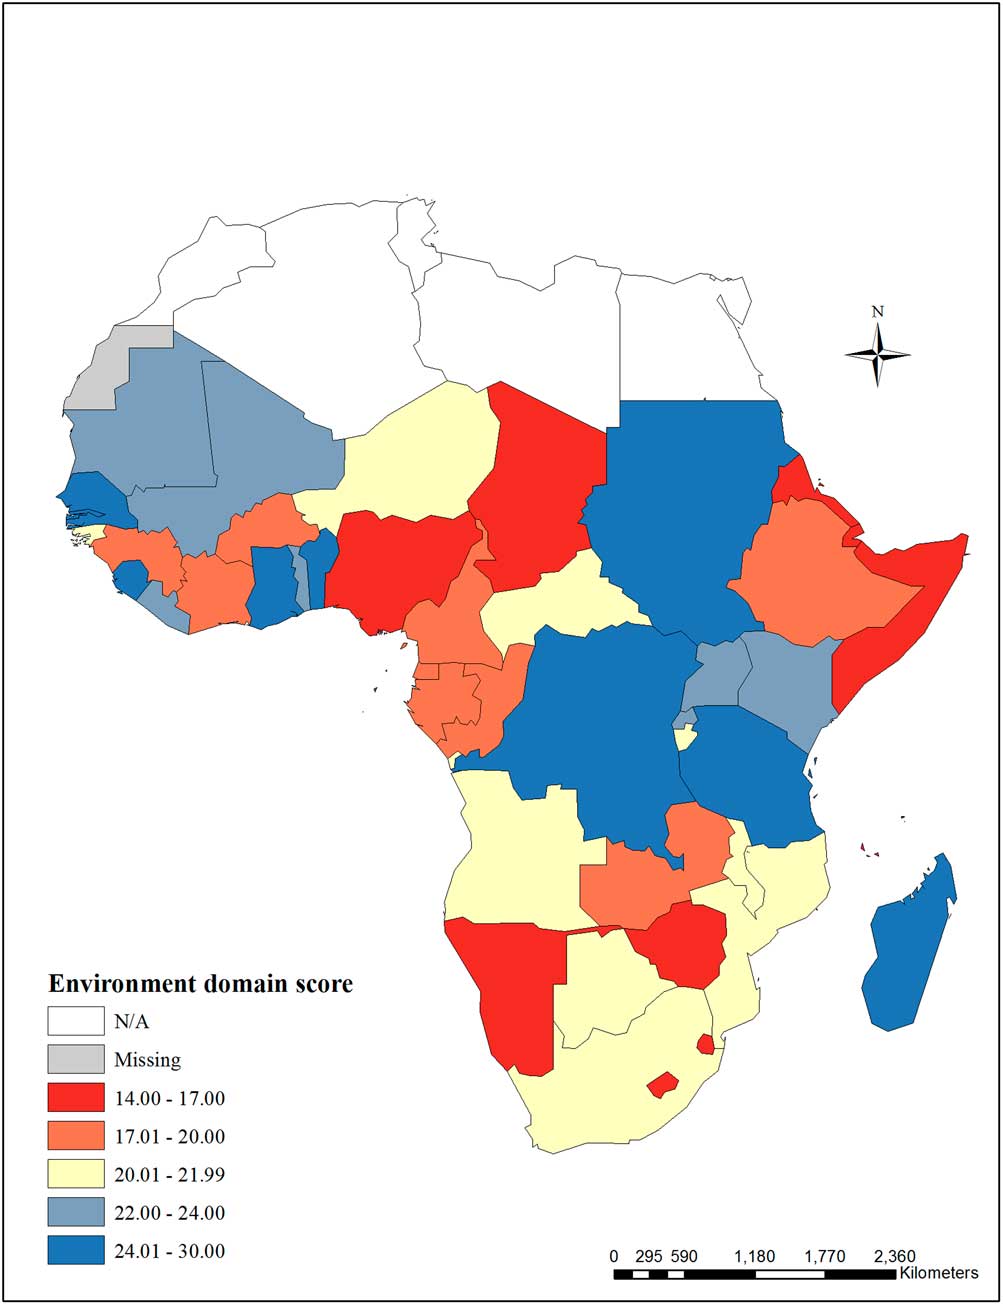
Fig. 2 Environment domain score – The environment domain score includes the following indicators: children aged 6–59 months testing positive for malaria, household indoor residual spraying, children under 5 years sleeping under a treated bed net, children under 5 years with fever receiving anti-malarial drugs, prevalence of HIV among adults aged 15–49 years, prevalence of HIV among pregnant women, pregnant women with HIV receiving antiretrovirals (ARVs) to prevent mother-to-child transmission (MTCT). Cape Verde, Mauritius, Réunion, Seychelles and Western Sahara were missing >75% of the environment domain indicators and were excluded from the domain score.
Mother–child interaction
Maternal depression
Maternal depression indicators are presented in Table 4. To our knowledge, no nationally representative estimates of PPD are available for any sub-Saharan African countries; however, a national survey in Namibia found that 12.7% of women aged 15–49 years reported having general depression. 46 Studies of non-nationally representative samples provide some evidence of the PPD burden. A systematic review of maternal well-being in Africa found 11.3% prevalence of depression during pregnancy and 18.3% prevalence in the postpartum period.Reference Sawyer, Ayers and Smith 47 Studies from Nigeria found PPD prevalence ranging from 4% to 30%.Reference Fatoye, Oladimeji and Adeyemi 48 – Reference Ukpong and Owolabi 51 In South Africa, studies found a PPD prevalence of 8–37%.Reference Lawrie, Hofmeyr, de Jager and Berk 52 , Reference Cooper, Tomlinson and Swartz 53 Studies in Ethiopia, the Gambia, and Uganda reported PPD prevalence ranging from 3% to 17%.Reference Hanlon, Medhin and Alem 54 – Reference Cox 56 With limited health resources in many sub-Saharan African countries, psychological support and treatment for pregnant women and new mothers with depression is likely to be rare; however, we identified no data on national-level coverage of interventions to address maternal depression.
Table 4 Mother–child interaction domain – prevalence of maternal depression, by country

BDI, Beck’s Depression Inventory; CPRS, Comprehensive Psychopathological Rating Scale; EPDS, Edinburgh Postnatal Depression Scale; PSE, Present State Examination; SCID, Structured Clinical Interview for DSM-III-R; SPI, Standardized Psychiatric Interview; SRDS, Self Rating Depression Scale.
Inadequate cognitive stimulation
Indicators for inadequate cognitive stimulation are presented in Table 5. Among the 12 countries with data on households with children under 5 years with ⩾3 children’s books, prevalence ranged from 0.4% in Mali to 14.7% in Djibouti. In four countries, <1% of households had ⩾3 children’s books. Of 13 countries with data, the proportion of households with ⩾2 playthings ranged from 23.7% in Djibouti to 68.6% in Swaziland. Among the 12 countries with data on children left in inadequate care, prevalence ranged from 11.8% in Djibouti to 60.7% in CAR. Of 20 countries with data, the prevalence of children under 5 years attending early childhood education ranged from 2.2% in Burkina Faso to 68.2% in Ghana. Prevalence of attendance varied greatly by household wealth with children from the richest 20% of households having substantially higher attendance relative to children from the poorest 20% of households (data not presented).
Table 5 Mother–child interaction domain – prevalence of cognitive stimulation and maternal education indicators, by country

Maternal education
Indicators for maternal education are presented in Table 5. Of 40 countries with data, the proportion of women aged 15–49 years with no schooling ranged from 1.2% in Lesotho to 80% in Niger. Among the 32 countries with data on secondary school completion among women aged 15–49 years, prevalence ranged from 0.3% in Tanzania and Niger to 18.3% in Nigeria. Categories for female school completion are presented in Fig. 3. Of 41 countries with data, the proportion of women aged 15–49 years who were married by age 15 ranged from 0.7% in Swaziland to 36.1% in Niger. Categories for early marriage are presented in Fig. 4.

Fig. 3 Maternal education (maternal–child interaction domain) – Women aged 15–49 years with no schooling (%), and women aged 15–49 years with secondary school completion (%).
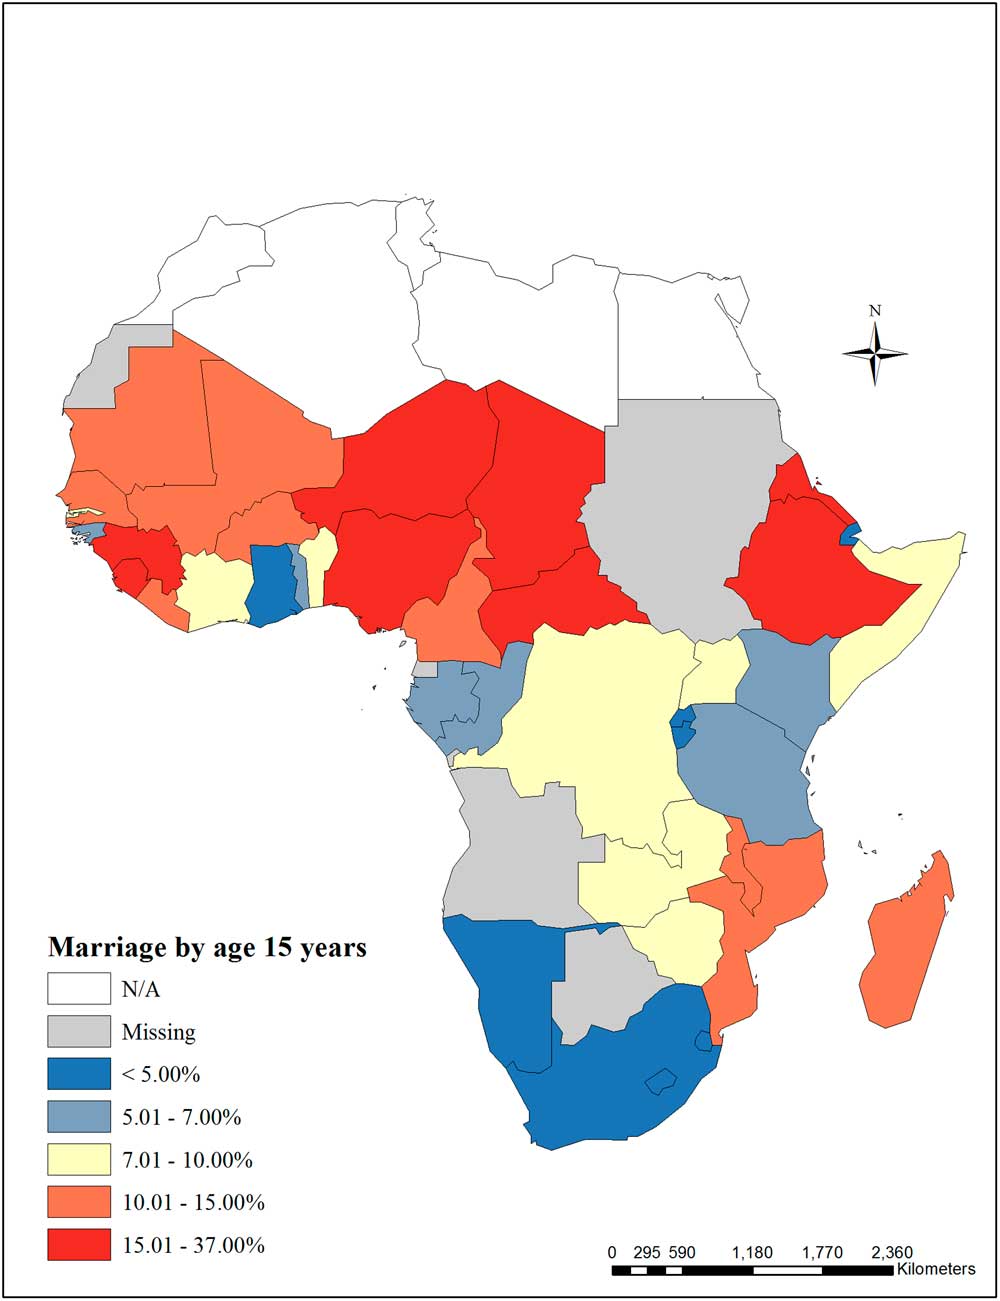
Fig. 4 Early marriage (maternal–child interaction domain) – Marriage by age 15 years among women aged 15–49 years (%).
Maternal–child domain
Because 67% of countries were missing more than half of the mother–child interaction indicators and eight countries were missing more than 75% of the indicators, we did not calculate a maternal–child interaction domain score.
Discussion
There is a clear need to improve routine collection of highquality, country-level indicators relevant to child development. Data were lacking for many indicators, especially in the mother–child interaction domain where two-thirds of countries were missing more than half of the indicators. In addition to making risk estimation difficult, the lack of data can hamper efforts to monitor progress. For example, monitoring low birthweight has been challenging due to poor coverage of weighing at birth. 3 Less than 30% of births in Ethiopia, Liberia, Mali, Niger, Nigeria and Sierra Leone had recorded birthweight, so the reported prevalence of low birthweight in these countries may not be representative of the true burden. If governments are committed to improving child development outcomes, greater effort should be made to design new or improve existing data collection systems.
Nutrition
Given adequate health care and nutrition, low and middle income countries can substantially reduce the burden of low birthweight. Tanzania, Rwanda, Cape Verde and Kenya had low birthweight prevalence similar to the European average of 6.9%. 57 These levels could be due to policy interventions, including improved antenatal care and food security for pregnant women in Kenya; however, the findings could also be related to other factors including the proportion of babies with recorded birthweights or changes in the prevalence of attended births. 58 Despite successes in minimizing low birthweight in parts of sub-Saharan Africa, the continent still faces a high burden of stunting. Even the best performing countries had under-five stunting prevalence of 16–28%, far exceeding the expected 2.5% observed in cohorts of children growing in accordance with WHO growth standards. Economic development, improved water and sanitation, and sustained inputs into early child growth are likely drivers of the lower levels of stunting in the best performing countries, but it is not clear why some countries with growth-sensitive programming fail to meet growth benchmarks. If the countries with the highest burdens of stunting (48–58% prevalence) could reduce prevalence to levels seen in the best performing countries, the effect on child development could be far reaching.
Since the 1990s, many countries have made substantial improvements in iodization. Governments of major salt producing countries, in partnership with salt producers and organizations like UNICEF and the Micronutrient Initiative, have launched iodization initiatives. 59 There have been major successes; DR Congo had been severely iodine deficient and has achieved sufficiency for 98.5% of the population. 60 In the last decade, however, progress on salt iodization has slowed, due to technical challenges of reaching small salt producers, poor quality control of salt iodization, difficulties in enforcing iodized salt legislation, and waning interest by governments.Reference Pearce, Andersson and Zimmermann 61 Despite sufficiency at the national level, sub-groups such as women of reproductive age and children may be at high risk for deficiency – especially those with increased iodine requirements, in whom salt iodization alone may not be adequate.Reference Wu, Liu, Li and Clar 19 In these sub-groups, additional supplementation might be needed to ensure improved cognitive outcomes.Reference Cao, Jiang and Dou 62 , Reference Qian, Wang and Watkins 63 Routine monitoring of iodine levels in these high risk groups could help ensure adequacy.
Many countries have a substantial burden of anemia. Addressing iron deficiency in sub-Saharan Africa is complicated by endemic malaria. Mass fortification of grains with iron is presumed to have lower risk relative to iron supplementation, but the effect of fortification initiatives on iron deficiency burden at the population level is unclear. The countries with the highest burden of both severe and total anemia are those with mandatory fortification legislation. While fortified staple foods can reach broad parts of the population, the effectiveness of fortification in reducing iron-deficiency could be limited by choice of fortification vehicle, the type and concentration of fortificant, and other factors. Studies have shown that in the absence of enforcement and quality assurance mechanisms, fortification legislation does not necessarily lead to the desired health outcomes.Reference van den Wijngaart, Begin, Codling, Randall and Johnson 64 Worldwide, about half of anemia is due to iron deficiency, so persistence of anemia despite fortification could also be due to factors other than iron such as infection, parasites, or other nutrient deficiencies. 65
Overall, there was a wide range of performance in nutrition indicators. No countries were consistently high or low performing, suggesting that each country faces its own unique challenges. For example, Rwanda had one of the lowest burdens of low birthweight (6.2%) but one of the highest burdens of stunting (44.2%). The major protective nutrition factor examined, exclusive breastfeeding, had very variable coverage with prevalence ranging from 1% in Djibouti to 84.9% in Rwanda, with 12 countries having prevalence ⩾50%. We were unable to identify data on interventions to specifically address IUGR, stunting, and exclusive breastfeeding, so it is unclear how programs designed to affect these risks, if present, might be affecting child development. Again, this underlines the need to improve routine collection of high quality, country-level indicators relevant to child development.
Environment
The shift from leaded to unleaded fuel represents a major success and highlights the important role of government and public policy in leading public health initiatives. In the 1990s, the lead content of gasoline in Africa was the highest in the world.Reference Nriagu, Blankson and Ocran 66 Sudan became the first country in sub-Saharan Africa to switch to unleaded gas in 2000.Reference Lacey 67 Regional fuel exporters helped accelerate the shift away from leaded fuel. Cameroon, which exports to CAR, Chad and Equatorial Guinea, stopped distributing leaded gas in November 2005. South Africa stopped leaded fuel by 2006, affecting smaller importing countries nearby.Reference Lacey 67 While fuel is no longer a source of lead exposure in sub-Saharan Africa, children are still exposed through house paint, home-based lead works, burning refuse, polluted waters, and contaminated foods.Reference Nriagu 41 , Reference Nriagu, Blankson and Ocran 66 , Reference Nriagu, Oleru, Cudjoe and Chine 68 , Reference Nriagu, Jinabhai, Naidoo and Coutsoudis 69 Studies in Nigeria and South Africa have documented the effects of mining on blood lead levels in both adults and children.Reference Nriagu, Oleru, Cudjoe and Chine 68 , Reference Nriagu, Jinabhai, Naidoo and Coutsoudis 69 These sources of lead exposure remain potential threats to child development and should be addressed.
Despite endemicity of malaria and the threat it poses to child development, only 16 countries had estimates of malaria prevalence. Countries with high coverage of malaria prevention interventions tended to also have low prevalence of malaria. Tanzania had the second highest prevalence of children under 5 years sleeping under ITN and the second lowest burden of malaria among children aged 6–59 months. Madagascar and The Gambia had among the highest proportion of households with IRS and among the lowest malaria burdens. For malaria treatment, however, only one high burden country, Equatorial Guinea, also had a high proportion of children under 5 years with fever receiving anti-malarial drugs. Overall, the reach of malaria interventions was low. The best performing countries had 50–75% of children under 5 years sleeping under ITN, 40–65% of children under five years with fever receiving anti-malarial drugs, and only 16–40% of households with IRS. Countries will have to maintain prevention and treatment efforts to achieve lasting reductions in malaria and influence cognitive development outcomes in children.
More than any other risk factor we analyzed, HIV was the most highly clustered by region. Countries with the highest adult prevalence of HIV were all located in southern Africa. Countries with the highest adult prevalence of HIV also had the highest prevalence of HIV among pregnant women. Generally, ARV receipt tracks with the HIV burden of pregnant women. Five of the six countries with the lowest proportion of pregnant women with HIV receiving ARVs do not have data on prevalence of HIV among pregnant women; however, prevalence of HIV among adults aged 15–49 years in these countries was <3%, suggesting prevalence of HIV burden among pregnant women might be low and therefore not a health priority given resource constraints.
Despite the health resources devoted to HIV in sub-Saharan Africa, we were not able to directly identify the number of HIV-affected children and instead relied on proxy measures. Countries, especially those with high burdens of HIV, should invest in improved data collection of indicators relevant to HIV-affected children. With the exception of Botswana, South Africa, Swaziland and Zimbabwe, population-based surveys have typically excluded children and adolescents for measures of HIV prevalence, so the burden of HIV is not clear in this age group. Evidence from acute care settings suggest that children and adolescents are presenting for care for HIV-related illness; however, planning for testing and treatment have not tended to focus on this age group.Reference Ferrand, Corbett and Wood 70 – Reference Walker, Mulenga and Sinyinza 72 Interventions targeted to adults might not address the unique needs of HIV-affected children such as school disruption or psychological distress from loss of a caregiver. Many long-term cohort studies on the effects of HIV and child outcomes have been focused on North American or European populations and might not be applicable to children in the context of Africa.Reference Rice, Zeldow and Siberry 73 , Reference Gadow, Angelidou and Chernoff 74 Understanding key factors associated with resilience in this population is imperative to developing interventions to mitigate risks of HIV exposure in children.
There was a wide range of performance in the environment indicators. Indicators in the environment domain provide the most evidence for effective interventions by governments and other supporting agencies. All countries in sub-Saharan Africa have phased out leaded fuel. This is an example of evidence-driven policy change with wide reaching population health benefits. Countries with high coverage of interventions to prevent malaria also had low malaria prevalence, and countries with the highest burden of HIV among pregnant women also had the highest ARV receipt.
Mother–child interactions
Despite the high global prevalence of PPD, relatively little is known about maternal depression in sub-Saharan Africa. We were unable to identify nationally representative estimates for either maternal depression or treatment. Studies from non-nationally representative samples suggest the burden is high but variable across and within countries. With limited health resources, psychological support for pregnant women and new mothers is likely rare. Early identification of maternal depression both during pregnancy and in the postpartum period coupled with effective treatment could greatly reduce the effects of depression on child development.Reference Cooper, Tomlinson and Swartz 53 More research is needed on both the burden of maternal depression in sub-Saharan Africa and the role of poverty, violence, and societal stress on maternal depression and child development after which the best methods of screening for and treating maternal depression can be identified.
Very little data were available to assess the burden of inadequate cognitive stimulation. Fewer than 14 countries reported data on learning materials in the home or children left in inadequate care. Only 20 countries reported data on early childhood education. The proportion of households with ⩾3 children’s books was low (0.4–14.7%) while the proportion of households with ⩾2 playthings was substantially higher (23.7–68.6%). Even where available, these are imperfect measures of home environment because they do not account for parental or familial involvement despite lack of material learning objects. Attendance in early childhood education was highly variable across countries and by household wealth. Instituting universal early childhood education could help address low attendance as well as the wealth gap in attendance.
Maternal education is associated with higher child development. Closing gender gaps in education has been slow in West and Central Africa – especially for completion of secondary schooling. 38 In all countries with data, the proportion of women completing secondary school was low. Completion rates in the best performing countries were only 7–18%. Generally, the countries with the lowest levels of maternal education also had the highest prevalence of child marriage. Parenting by age 15 might also be an important proxy for a mother’s ability to complete secondary school; however, no national-level data were available for this indicator. Strengthening universal primary and secondary education and delaying marriage and first pregnancy until after adolescence could lead to reduced prevalence of low birthweight and better early life growth and child development.
Consistency across domains
Most countries had mixed performance on indicators. For example, Namibia was in the best category for nutrition but the worst category for environment. Sao Tome and Principe was the only country to score in the best category in both the nutrition and environment domains. Only Chad performed poorly across indicators with the worst category in the nutrition and environment domains and the worst categories for maternal education and child marriage. This finding suggests that each country faces distinct challenges in addressing risk factors for poor child development. Variation could be due to differing country-level priorities as reflected in policies and funding.
Strengths and limitations
In this paper, we focus on modifiable risk factors that can be addressed through household, mother and/or child-level interventions and for which nationally representative indicators were available. Additionally, we have included three initiatives for which national policy-level intervention have been or would be required: shifting to unleaded fuels, salt iodization and iron fortification of grains. While potentially important contributors, we did not review interventions addressing the underlying causes of poor child development including poverty or macro-system risk such as societal violence. Similarly, we have not focused on potential or suspected risks to child development, such as diarrhea, low essential fatty acid intake, or maternal pre-conceptual nutrition, due to limited and/or inconsistent findings.
A main limitation in this study was the lack of data on risks and interventions. In an attempt to include as many risk factors as possible in our analyses, we used proxy measures for some indicators, such as low birthweight for IUGR and anemia for iron deficiency. Additionally, we chose to weight all indicators within each domain equally. While it is unlikely that all elements are of equal importance to child development, there was insufficient evidence to support differential weighting. We excluded countries missing more than 75% of indicators from domain scores. The cut point is arbitrary; however, we wanted to include as many countries as possible while maintaining meaningful score values. Despite these limitations, the domain scores allow for general understanding of performance within and across domains. Due to an overall lack of national-level data on many of the mother–child interaction indicators, we were unable to calculate a domain score. Subsequently, we were unable to calculate total scores over the three domains making it more difficult to assess overall performance.
Estimates for impact of interventions were largely based on the findings of the Lancet maternal and child under-nutrition series. Their models were based on 36 countries most affected by the burden of under-nutrition – not all of which were in sub-Saharan Africa. Conflict, population displacement, and other factors could influence impact of interventions on child development outcomes in the region. Thus, the interventions could be more or less effective within the sub-Saharan African context. Additionally, synergy among interventions could improve outcomes disproportionately relative to single interventions.
As the world has seen large reductions in child mortality over the last decades, there has been increasing focus on improving child development. Africa has a high burden of risk factors for poor child development with high rates of stunting, malaria, and HIV. Most countries had mixed performance across domains, and only Chad had overall poor performance. This finding suggests that each country faces its own unique challenges in addressing risk factors for child development. A major issue in the development agenda is a lack of data on many indicators, especially those related to mother–child interaction. There is a clear need to improve routine collection of high-quality, country-level indicators relevant to child development to assess risk and track progress. Thus, greater effort should be placed to design new or improve existing data collection systems.
Acknowledgments
None.
Author Contributions
N.D.F. and A.D.S. conceived the original study idea, formulated the research question, and designed the study. N.D.F. conducted all analyses and wrote the initial manuscript draft. Both authors interpreted findings, contributed to the intellectual content of the work and edited subsequent drafts.
Financial Support
This research was supported in part by Laney Graduate School, Emory University.
Conflicts of Interest
None.
Ethical Standards
This study does not constitute human subjects research.


