


Introduction
Gestational diabetes mellitus (GDM) is a disorder of glucose metabolism that complicates 4–7% of pregnancies in the United States.Reference Catalano, Huston, Amini and Kalhan1 The maternal metabolic alterations associated with GDM modify the in utero environment, predisposing to abnormal fetal growth.Reference Catalano, Huston, Amini and Kalhan1 Newborns of women with GDM have an increased risk of macrosomiaReference Crowther, Hiller, Moss, McPhee, Jeffries and Robinson2 and newborn hypoglycemiaReference Kjos and Buchanan3 as well as the potential for the development of adult metabolic syndrome.Reference Reece, Leguizamon and Wiznitzer4, Reference Barker5 The placentas of GDM pregnancies are larger than that of control patients, perhaps contributing to the enhanced fetal growth.Reference Higgins and Mc Auliffe6, Reference Ashfaq, Janjua and Channa7
Simplistically, accelerated fetal growth patterns seen in women with diabetes is, in part, explained by fetal exposure to elevated maternal plasma glucose concentrations, a product of maternal insulin resistance. Placental glucose transfer occurs via facilitated diffusion, and is thus dependent upon concentration gradients. However, not all infants of GDM pregnancies, with similar glucose ‘control’, develop macrosomia. Thus, prevention of macrosomia by regulation of maternal glucose levels has been proposed to be based upon fetal growth rates rather than levels of maternal hyperglycemia.Reference Schafer-Graf, Dupak and Vogel8 This may be a consequence of nutrient factors other than glucose contributing to fetal growth.Reference Freinkel9 Alternatively, factors other than maternal glucose levels (e.g., placental mass, expression of glucose transporters) may alter placental glucose transport rates.
The mechanism accounting for increased placental mass in GDM pregnancies is unknown. We hypothesized that reduced placental apoptosis (physiological cell death) contributes to increased placental mass associated with GDM. Apoptosis is characterized by a distinct series of biochemical events that trigger distinctive morphological and biological changes in cells during its progression without any inflammatory response. We further hypothesized that increased glucose transporter expression may predispose to elevated placental glucose transport and fetal growth. As the placenta expresses glucose transporter 1 (SLC2A1, previously called GLUT1) and glucose transporter 3 (SLC2A3, previously called GLUT3), we measured their levels of expression using Western blotting.
Materials and methods
Patients and sample collection
Studies were approved by the Institutional Review Board (IRB) (IRB#00543-40-12) of the Los Angeles BioMedical Research Institute at Harbor-UCLA, and were in accordance with the Declaration of Helsinki and National Institutes of Health guidelines. Informed consent for use of patient demographics and placental tissue was at the time of delivery. All women were term gestations, non-smokers, did not abuse alcohol and did not have concurrent medical conditions, except for GDM. GDM was defined as an abnormal glucose tolerance during the third trimester, according to the criteria defined by the American Diabetes Association.10 The GDM patients were treated with either diet or metformin. To assure the lack of placental inflammatory changes associated with vaginal delivery, only patients with planned Cesarean section were enrolled in the study. Maternal age and pre-pregnancy body weights were recorded and gestational age was confirmed by ultrasonography. Newborn weights were recorded after delivery.
Placentas from control patients (no pregnancy complications; n = 5), or with GDM (n = 5), were collected within 10 min of delivery and weighed without membranes or umbilical cords. All the placentas were close to being circular. Basal and chorionic plates were removed from placental cotyledons. Five random villous tissue (∼4 mm diameter each) were taken from within 2 cm of the insertion of the umbilical cord of each placenta collected from either GDM or non-diabetic women. The areas selected were proximal to maximal blood flow, and thus were expected to exhibit the least amount of background histopathology. The villous samples were divided into two groups, one group was fixed in 4% paraformaldehyde for 24 h prior to embedding in paraffin for sectioning, while the other group was snap frozen in liquid nitrogen and stored at −80°C for gene and protein expression analysis.
Terminal deoxynucleotidyl transferase dUTP-mediated nick-end labeling (TUNEL) assay
We used an ApopTag in situ apoptosis detection kit (Millipore Corporation, CA) as previously described by Belkacemi et al.Reference Belkacemi, Chen, Ross and Desai11 Apoptotic cells in non-diabetic (n = 5) and GDM (n = 5) placentas were detected by the brown precipitate overlying nuclei after incubation in 3,3′-diaminobenzidine (DAB) chromogen (Vector laboratories, CA) and counterstained with methyl green (Sigma, MO). Terminal deoxynucleotidyl transferase was replaced with phosphate buffer saline (PBS), in the negative control. All samples were run in duplicate to ensure validity and reliability of the experiments.
Activated caspase-3 and Ki-97 immunohistochemistry
We immunostained for activated caspase-3 as a marker of apoptosis, and detected Ki-67 antigen as a proliferation marker. Five-μm sections of placental tissues were deparaffinized, rehydrated, subjected to antigen retrieval and endogenous peroxidase activity quenching. Non-specific binding was blocked by incubating the sections in 5% normal goat serum for activated caspase-3, or 10% bovine serum for Ki-67 for 1 h. The sections were reacted with a rabbit polyclonal anti-activated caspase-3, or rabbit polyclonal anti-Ki-67 (dilution in Table 1) overnight at 4°C, followed by three washes of 10 min in PBS-Tween20, and the addition of biotinylated anti-rabbit secondary antibody (dilution in Table 1) for 1 h. Further processing used the Vectastain Elite ABC kit (Vector Laboratories) according to the manufacturer's instructions. Colorimetric detection was achieved using DAB as chromogen and hydrogen peroxide as substrate for horseradish peroxidase (Vector Laboratories). The sections were counterstained with methyl green (Sigma, MI). To control for specificity of immunogen reactions, adjacent control sections were subjected to the same immunoperoxidase method, except that primary antibodies were replaced with a matching concentration of non-immune serum at the same dilutions as the specific primary antibody. All samples were run in duplicate to ensure validity and reliability of the experiments.
Table 1 Antibodies used in immunohistochemistry and Western blot analysis
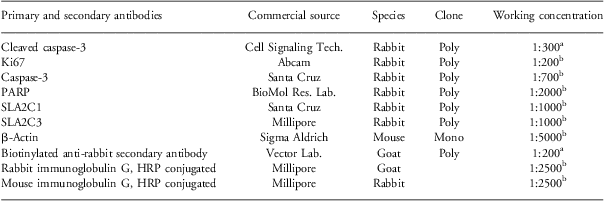
aImmunohistochemistry.
bWestern blot analysis.
Quantitative analysis of TUNEL, Ki-67 and activated caspase-3 immunohistochemical staining
The results are presented as an average of placentas from non-diabetic controls (n = 5), or women with GDM (n = 5). All slides were examined using an AxioCam HRC light microscope (Carl Zeiss MicroImaging, NY). Five separate specimens from each placenta of GDM and non-diabetic women were evaluated. Ten random fields from each section of the five placentas from each group were digitalized at ×200 final magnification by an observer blinded to clinical history. The digitized images were stored in uncompressed tiff format (tagged image file format) with 24-bit RGB class and 640 × 480 pixel resolution. The level of apoptotic positive nuclei, and activated caspase-3, and Ki-67-positive immunostaning within the GDM and the non-diabetic placentas were quantified using the Image Pro, version 4.5, analysis software system (MediaCybernetic Inc., USA). For each of the digitalized image, villi were drawn manually using a marker crayon tool and selected areas of interest (AOI) were highlighted by an editable colored outline then analyzed automatically with Image Pro software. The tissue sections were processed simultaneously to ensure uniformity of immunostaining.
For TUNEL and Ki-67 immunolabeling, the nuclei were considered positive if their immunostains were equal or larger than 50% of the nuclear area. Notably, cells were classified as immunopositive or -negative based on pre-determined thresholds that evaluated color, intensity of staining, cell size, axis length, roundness and compactness. The filtering used thresholds as follows: mean density (minimum = 115; maximum = 164–169, proportionally for labeling mean density per image), area (minimum = labeled nuclear mean area per image/2.3), axis (minimum = 2 um), roundness (0.6–1.0), and perimeter ratio (0.5–1.0). Mean density and area thresholds were automatically defined based, respectively, on mean density and mean area of TUNEL or Ki-67-labeled nuclei in the assessed image. This profile is similar to the nuclear immunostaining image analysis performed by Konstantinidou et al.Reference Konstantinidou, Patsouris, Kavantzas, Pavlopoulos, Bouropoulou and Davaris12 In our profile methyl green staining of nuclei were clearly distinguished from the brown peroxidase-DAB reaction product. As recent studies identify cytotrophoblast processes are deeply invaginated into the overlying syncytiotrophoblast making assignment of phenotype unreliableReference Longtine, Chen, Odibo, Zhong and Nelson13, Reference Longtine, Chen, Odibo, Zhong and Nelson14, we recorded TUNEL-positive nuclei in the trophoblast bi-layer as ‘trophoblast’. The results were expressed as the number of TUNEL-positive nuclei divided by the total number of trophoblast nuclei (AI), and the number of Ki-67-positive nuclei divided by the total number cytotrophoblast nuclei, as only cytotrophoblast proliferate (PI).
For activated caspase-3, integrated optical density (IOD) of the uncompressed tiff format of activated caspase-3 images was quantified using the Image-Pro Plus 4.5 software (Media Cybernetics) as described previously.Reference Ivarsson, Myllymaki, Jansner, Bruun, Stenram and Tranberg15 Three parameters were evaluated: density mean, area and IOD. The immunostained areas containing activated caspase-3 were measured in square microns by drawing all the area to be measured using the ‘AOI’ option of the software. Image-pro Plus software calculate stained area (μm2) and IOD and reported activated caspase-3 immunostaining as IOD = Area × Average density (average of all pixels density).
Protein extraction, SDS-PAGE and Western blot analysis
Villi were sonicated on ice in the T-PER tissue protein extraction reagent buffer (Thermo Scientific, IL) that contained protease inhibitors (HALT cocktail, Thermo Scientific). Protein concentration was determined by bicinchoninic acid (BCA) solution (Thermo Scientific). All protein fractions were frozen at −80°C until use.
Placental expression of caspase-3, cleaved poly(ADP-ribose) polymerase (PARP), SLC2A1, and SLC2A3 was evaluated by Western analysis of 50 μg of protein from villous homogenate total lysates, as previously described by Belkacemi et al.Reference Belkacemi, Chen, Ross and Desai11, Reference Belkacemi, Jelks, Chen, Ross and Desai16 Anti-caspase-3, cleaved PARP, SLC2A1, and SLC2A3 primary and HRP-conjugated secondary antibody dilutions are included in Table 1. The optical density (OD) of the bands (OD/mm2)Reference Liang, Ekblad, Gustafsson and Nilsson17 was performed on all blots using Quantity One computer program (BioRad Laboratories), normalized to β-actin expression. H4 cell lysate (Santa Cruz, CA) and SLAC2A3 peptide (Millipore, CA) were used as positive controls for SLC2A1 and SLC2A3, respectively.
Statistical analysis
Data are reported as mean ± s.d., with significance defined as P < 0.05. Differences between GDM and non-diabetic patient demographics, newborn weights and placental studies were each compared by two-tailed, Student's t-test using NCSS97 software (NCSS, UT).
Results
Patient demographics
Maternal age and pre-pregnancy body weights were significantly higher in the GDM group, compared with those from the non-diabetic control group (Table 2, P = 0.02 and 0.004; respectively). Furthermore, gestational age at delivery was comparable (Table 2, P = 0.81), but the mean neonatal birth weight was significantly higher in the GDM group compared with that from controls (Table 2, P = 0.05).
Table 2 Clinical characteristics of patients and newborns (n = 5)
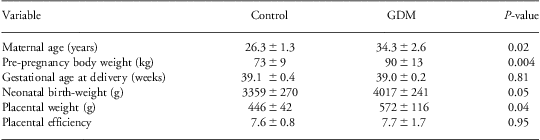
Placental weight was significantly higher in the GDM group, compared with controls (Table 2; Fig. 1, P = 0.04). However, there was no significant difference between birth weight to placenta ratio (measure of placental efficiency) of the GDM group, compared with controls (Table 1, P = 0.95).

Fig. 1 Weights of placentas from women with GDM (black bar) and non-diabetic control (white bar). P-value indicates a significant difference between GDM (black bars) v. non-diabetic control (open bars). GDM, gestational diabetes mellitus.
Level of apoptotic cells, activated caspase-3 immunostaining and cell proliferation in trophoblast
Compared to trophoblast from non-diabetic control placentas, placentas of women with GDM had lower levels of apoptosis by TUNEL staining (Fig. 2a, 2b and 2e). Quantification of TUNEL-positive nuclei showed a significant 71% decrease in apoptosis as compared with controls (IA: 0.05 ± 0.01 v. 0.17 ± 0.04, P < 0.04). Negative controls appropriately demonstrated no staining (Figs 2c and 2d).
Fig. 2 Representative TUNEL-positive nuclei in trophoblast from women with GDM (a) and non-diabetic controls (b). TUNEL-positive nuclei in the trophoblast (red arrows). Negative controls (c–d) with no immunostaining. Quantitative analysis of TUNEL-positive nuclei in trophoblast from women with GDM and non-diabetic controls (e). P-value indicates significant difference between % TUNEL-positive nuclei from trophoblast of women with GDM (black bars) v. non-diabetic controls (white bars). Scale bars 50 μm and 20 μm. GDM, gestational diabetes mellitus; TUNEL, terminal deoxynucleotidyl transferase dUTP-mediated nick-end labeling.
Activated caspase-3 immunostaining was also significantly decreased by 79% in trophoblast from placentas of women with GDM, as compared with controls (Fig. 3a, 3b and 3g, P = 0.03). There was no detectable reaction product after immunostaining for activated caspase-3 in specimens treated with non-immune serum lacking the primary antibody (Fig. 3c and 3d). Jurkat cells (an immortalized line of T lymphocyte cells) stained for activated caspase-3 were used as a negative (Fig. 3e), and a positive (Fig. 3f) control with and without the primary antibody, respectively.
Fig. 3 Representative activated caspase-3 immunostaining in trophoblast from women with GDM (a) and non-diabetic controls (b). Positive immunostaining in the trophoblast (red arrows). Negative controls (c–d) with no immunostaining. Jurkat cells immunostained for activated caspase-3 were used as a negative (e), and a positive (f) control with and without the primary antibody, respectively. Quantitative analysis of activated caspase-3 in trophoblast from women with gestational diabetes mellitus (GDM) and non-diabetic controls (e). P-value indicates significant difference between activated caspase-3 from trophoblast of women with GDM (black bars) and non-diabetic controls (white bars). Scale bars = 50 μm. IOD, integrated optical density.
As a measure of cell proliferation, we observed comparable Ki-67-immunoreactive nuclei in trophoblast from placentas of women with GDM and non-diabetic women (PI: 19 ×10−5 ± 1.3 × 10⁻³v. 21 × 10−5 ± 1.0 × 10⁻³, P = 0.46). There was no detectable reaction product after immunostaining for Ki-67 in specimens treated with non-immune serum without the primary antibody (results not shown).
Caspase-3 and PARP protein expression
Expression of cleaved caspase-3 in the total cell lysate from non-diabetic placentas revealed three polypeptides of 20, 15 and 11 KD (Fig. 4a) by Western blot analysis, though the 15 KD band was almost absent in lysates from GDM placentas (Fig. 4a). Densitometric analysis revealed that combined levels of these active caspase-3 polypeptide fragments was significantly decreased in placentas of women with GDM compared with placentas from non-diabetic control women (Fig. 4c, P < 0.05).
Fig. 4 Effects of GDM on the level of caspase-3 and PARP protein expression in human placentas. Representative immunoblots of caspase-3 (a) and PARP (b) protein expression. Densitometric analysis of caspase-3 and PARP (c) protein expression. P-value indicates a significant difference between GDM (black bars) v. non-diabetic control (open bars). GDM, gestational diabetes mellitus; PARP, poly(ADP-ribose) polymerase.
Expression of PARP in the total cell lysate from non-diabetic and GDM placentas revealed a primary fragment of 85 kDa (Fig. 4b) by Western analysis. This fragment is known to result from caspase-3 cleavage during apoptosis. Consistent with the downregulation of activated caspase-3 in placentas of women with GDM, densitometric analysis of the 85 kDa fragment of PARP was significantly reduced in GDM placentas v. non-diabetic control placentas (Fig. 4c, P < 0.05).
Differential expression of SLC2A1 and SLC2A3 proteins
We determined the expression levels of SLC2A1 and SLC2A3, two major glucose transporters during pregnancy. For each of these proteins, we detected a single immunoreactive band of the expected molecular weight in protein lysate fractions from both GDM and non-diabetic control placentas (Fig. 5a and 5b). When analyzed by densitometry, the level of placental SLC2A1 protein expression was ∼three-fold higher in the placentas from GDM participants than from the non-diabetic control participants (Fig. 5c, P < 0.05). Conversely, SLC2A3 protein expression showed no significant change between the two groups (Fig. 5c, P = 0.97).
Fig. 5 Effects of GDM on the level of SLC2A1 and SLC2A3 protein expression in human placentas. Representative immunoblots of SLC2A1 (a) and SLC2A3 (b) protein expression. Densitometric analysis of SLC2A1 and SLC2A3 (c) protein expression. P-value indicates a significant difference between GDM (black bars) v. non-diabetic control (open bars). GDM, gestational diabetes mellitus.
Discussion
We propose that a disorder of placental growth is, in part, responsible for fetal overgrowth commonly associated with GDM.Reference Taricco, Radaelli and Rossi18 Apoptosis is vital for normal placental growth and development.Reference Smith, Baker and Symonds19, Reference Axt, Meyberg, Mink, Wasemann, Reitnauer and Schmidt20 Importantly, the equipoise of apoptosis with cell proliferation regulates both cell turnover and removal of effete cells.Reference Baker, Mooney, Hughes, Lombardi, Johnson and Savill21 These physiological processes regulate trophoblast mass and thereby trophoblast function. The villous trophoblast bi-layer includes both the cytotrophoblast and the syncytiotrophoblast, with syncytiotrophoblast resulting from fusion of cytotrophoblasts to form the exchange interface between fetal and maternal circulations. Proliferation of cytotrophoblast provides precursors to replenish syncytiotrophoblast, whereas activation of or both pathways for apoptosis modifies the numbers of stem cells available to fuse into syncytiotrophoblast. We evaluated the contribution of apoptosis to trophoblast numbers and assayed the expression of two glucose transporters as surrogates for key trophoblast functions that may influence fetal growth.Reference Jansson, Cowley and Illsley22, Reference Ericsson, Hamark, Powell and Jansson23
The weights of placentas from pregnancies of women with GDM were significantly higher than placentas of non-diabetic women. Our results are consistent with several studies showing significantly higher placental weights in GDM pregnancies, as compared with non-diabetic pregnancies.Reference Taricco, Radaelli, Nobile de Santis and Cetin24–Reference Mayhew, Sorensen, Klebe and Jackson26 Perhaps early pregnancy transient hyperglycemia before glucose challenge test (normally performed between 24 and 28 weeks’ gestation) may have contributed to the increased placental growthReference Ericsson, Saljo and Sjostrand27 in our GDM participants. Conversely, Mayhew et al.Reference Mayhew, Sorensen, Klebe and Jackson28 found similar mean placental weights in diabetic and non-diabetic control groups. This discrepancy may be due to sampling methods.
The increased placental weight in the GDM group was paralleled by markedly reduced levels of apoptotic cells in the trophoblast bi-layer by TUNEL assay. Using TUNEL, we detected a significant 71% reduction in apoptosis in trophoblast from placentas of women with GDM compared with those of non-diabetic women. We speculate that the reduction in apoptosis may account for the increased mass in placentas from women with GDM.
Despite the apparent simplicity of TUNEL, this widely used technique has some limitations in sensitivity and specificity.Reference Grasl-Kraupp, Ruttkay-Nedecky, Koudelka, Bukowska, Bursch and Schulte-Hermann29, Reference Mundle and Raza30, Reference Cervos-Navarro and Schubert31 Although the time from initiation of apoptosis to completion can be as quickly as 2–3 h, false negatives may occur if the TUNEL assay is done too early or too late in the cell cycle.Reference Elmore32 Moreover, the existence of false positives from necrotic cells, and cells in the process of DNA repair that are not indicative of cell deathReference de Boer, van Veldhuisen and van der Wijk33 cannot be ruled out. Notably, Sgarbosa et al.Reference Sgarbosa, Barbisan and Brasil34 observed a predominance of apoptosis in placentas from diabetic patients by TUNEL assay, which may suggest that these investigators were selecting for DNA damage that is independent of internucleosomal cleavage associated with apoptosis.
To confirm that cell death was occurring via apoptosis, we paired the TUNEL assay with the proteolytic processing of activated caspase-3, which plays a crucial role as a final execution enzyme in both extrinsic and intrinsic apoptotic pathways. Caspase-3 is synthesized as a proenzyme that contains an N-terminal prodomain followed by a larger 17 kDa subunit and a smaller 12 kDa subunit.Reference Nicholson, Ali and Thornberry35 During activation, cleavage between the large and the small subunits occurs and all forms of caspase-3 containing different versions of the large subunit are active.Reference Stennicke and Salvesen36 In our study, decreased activated caspase-3 immunolabeling corroborated by weak expression of 15 and 11 kDa active protein fragments of caspase-3 in trophoblast from placentas of women with GDM substantiate the TUNEL findings. We postulate that the 15 kDa active fragment of cleaved caspase-3, which was almost absent from the GDM specimens, may represent an essential component of cells death. As caspase-3 is responsible for the cleavage of PARP,Reference Nicholson, Ali and Thornberry35, Reference Tewari, Quan and O'Rourke37, Reference Le Rhun, Kirkland and Shah38 the reduced levels of cleaved PARP were expected.
Ki-67 is an established marker of cell proliferation, which we used to quantify placental cell proliferation levels in GDM and non-diabetic pregnancies. We found comparable proliferative indices in trophoblasts from placentas of women with GDM and non-diabetic women suggesting that there was no evidence of enhanced placental growth in GDM placentas in the period immediate before delivery. Although it is possible that GDM placenta would express increased proliferation rates earlier in gestation, the results of the present study suggest that reduced apoptosis, rather than increased proliferation, accounts for the larger placental mass.
Placental glucose transport is a saturable, and carrier-mediated process of facilitated diffusionReference Wheeler and Yudilevich39 along a predominantly maternal to fetal concentration gradient.Reference Desoye, Gauster and Wadsack40 Glucose transport involves a family of membrane-spanning glycoproteins, the glucose transporters (SLC2)Reference Joost and Thorens41, that render substrate entry about 10,000 times faster than that calculated for diffusion across the lipid membrane layer.Reference Korgun, Demir and Hammer42 In human placenta SLC2A1 and SLC2A3 are the two major glucose transporters. SLCA1 regulates glucose transport from the maternal to the fetal compartment under physiological conditions, and its expression is maximal at delivery. In our study the higher expression of SLC2A1 in trophoblast from placentas of women with GDM, suggested that in addition to placental mass, enhanced glucose transporter expression may contribute to increased fetal growth. In support of our finding, Gaither et al.Reference Gaither, Quraishi and Illsley43 postulated that elevated SLC2A1 expression in basal membrane from GDM placentas potentiates increased feto-placental growth. However, hyperglycemic suppression of trophoblast SLC2A1 expression and activity in vitro Reference Hauguel-de Mouzon, Leturque, Alsat, Loizeau, Evain-Brion and Girard44 would predict that maternal diabetes would produce a suppressive growth effect as a result of maternal (and fetal) hyperglycemia. Whether placental SLC2A1 increase is solely because of GDM, or includes other parameters such as excess of fibroblast growth factor 2 (FGF-2)Reference Grissa, Yessoufou and Mrisak45 which is increased in the placentaReference Burleigh, Stewart, Grindle, Kay and Golos46, Reference Hill, Tevaarwerk, Caddell, Arany, Kilkenny and Gregory47 warrants further investigations. Notably, in diabetic rat placenta SLC2A3 levels are increased four- to five-fold compared with non-diabetic rats.Reference Boileau, Mrejen, Girard and Hauguel-de Mouzon48 Surprisingly, SLC2A3 protein, which is important for glucose transport from the placenta to the fetus,Reference Hauguel-de Mouzon, Challier, Kacemi, Cauzac, Malek and Girard49 was unchanged by maternal GDM, suggesting that SLC2A3 may not play a major role in the feto-placental response to GDM at human term pregnancy.Reference Gaither, Quraishi and Illsley43
Despite maternal glycemic control with either diet or metformin, increased placental weight was paralleled by significantly elevated newborn weight in GDM patients compared with non-diabetic controls. Although the increased fetal growth may be a result of modest elevations in maternal glucose levels, the present results suggest that intrinsic placental properties (mass, glucose transport expression) may foster increased growth as observed in diabetic rats.Reference Thomas, Eriksson and Eriksson50 We recognize the small number of specimens in the present study. However, the magnitude of the differences and the statistical significance strongly support the validity of the results. Further studies with larger sample size would be of value in confirming the present findings. Although a prospective analysis of 28,358 mother–infant pairs who enrolled in the National Collaborative Perinatal Project between 1959 and 1965 by Baptiste-Roberts et al.Reference Baptiste-Roberts, Nicholson, Wang and Brancati51 has already shown that mothers with GDM gave birth to offsprings with higher weights at birth, compared with their non-diabetic counterparts.
Importantly, we did not observe any difference between mean placental efficiency from women with GDM, compared with mean ratio from non-diabetic women, indicating that placental and neonatal weights may have increased simultaneously in both groups regardless of the weights. Makhseed et al.Reference Makhseed, Musini, Ahmed and Al-Harmi52 also observed a parallel increase in placental and neonatal weights provided the diabetes was not complicated by vascular disease. This finding may explain our results as all the women we enrolled were non-smokers, did not abuse alcohol and did not have concurrent medical conditions, except for GDM. Although, the lack of vascular disease is unlikely to account exclusively for the unchanged placental efficiency. We speculate that altered placental morphology as a result of decrease apoptosis in the trophoblast area may account for functional adaptations in the GDM placentas, to optimize fetal growth in the prevailing conditions in utero. The changes in the absolute and relative amount of nutrients supplied to the fetus as a result of altered placental phenotype are expected to have long-term impact on adult health and morbidity.Reference Fowden, Forhead, Coan and Burton53
In summary, our results indicate that GDM-associated increased newborn and placental weight, may be a consequence in part of reduced trophoblast apoptosis, and enhanced glucose transport expression, although more participants are needed to confirm these conclusions. An understanding of the mechanisms that regulate placental growth and transport function may aid in the development of therapeutic strategies, which normalize fetal growth in GDM pregnancies.
Acknowledgments
The authors acknowledge Dr Lynn Smith, the Director of the Level II Nursery and the Perinatal Clinical Research Center at Harbor-UCLA Medical Center, Mrs Evelyn Lopez and Mr Javier Valerio, Clinical Research Associates at Harbor UCLA Medical Center, for their assistance in participant recruitment and placenta collection. They also thank Miss Lauren Wedekind for assistance with the quantitative analysis of the immunohistochemical staining. The project described was supported by the General Clinical Research Center Grant M01RR000425, National Institute of Health Grants R01HD054751, R01DK081756, R01HD29190 and The Barnes-Jewish Hospital Foundation.
Financial support
None.
Conflicts of interest
None.
Ethical Standards
The authors assert that all procedures contributing to this work comply with the ethical standards of the National Institutes of Health guidelines on human experimentation, and with the Helsinki Declaration of 1975, as revised in 2008, and has been approved by the Institutional Review Board (IRB) (IRB#00543-40-12) of the Los Angeles BioMedical Research Institute at Harbor-UCLA Medical Center, CA.


