Introduction
The increased incidence of immune-mediated non-communicable diseases (NCDs), such as allergic disease and diabetes, in developed nations has paralleled changes in our environment. The highly urbanised industrialised, “Western” environments reduce environmental bacterial diversityReference Flandroy, Poutahidis and Berg1 and opportunities for human-microbial interaction throughout the life course.Reference Parajuli, Gronroos and Siter2 The effects of environmental changes may be mediated by our commensal microbiota. The human gut microbiome contains the largest number of bacteria in the body, acting in a symbiotic relationship with the host to mediate barrier function of the gut, modulate immune responses, synthesise cofactors and ferment dietary fibre to create accessible carbohydrates for host gut enterocytes.Reference Fujimura, Slusher, Cabana and Lynch3 Increasing evidence exists that the maternal gut microbiome influences offspring immune development, establishing the immune profile of infants at birth.Reference Gray, O’Hely, Ranganathan, Sly and Vuillermin4
Studies of human gut microbiota by 16S rRNA gene amplicon sequencing have identified enterotypes associated with a predominance of three key bacterial genera: Prevotella, Bacteroides and Ruminococcus.Reference Arumugam, Raes and Pelletier5, Reference Costea, Hildebrand and Arumugam6 These enterotypes have been associated with specific dietary patternsReference Wu, Chen and Hoffmann7 and geographically distinct populations.Reference Yatsunenko, Rey and Manary8 From infancy, the Prevotella enterotype is most abundant in the faeces of non-industrialised, high-fibre eating societiesReference De Filippo, Cavalieri and Di Paola9–Reference Martinez, Stegen and Maldonado-Gomez11 and in lower abundance in the faeces of people living in industrialised, developed Western populations.Reference Arumugam, Raes and Pelletier5, Reference Wu, Chen and Hoffmann7 Within these Western populations, the Prevotella enterotype exhibits a bimodal distribution, with either high or low abundance, but rarely intermediate abundance.Reference Lahti, Salojarvi, Salonen, Scheffer and de Vos12 High abundance of the Prevotella enterotype is associated with high-faecal microbial diversity.Reference Lahti, Salojarvi, Salonen, Scheffer and de Vos12
Prevotella copri (P. copri) is the predominant Prevotella species within the human gut microbiomeReference Ley13, Reference Zhu, Sunagawa, Mende and Bork14 and is associated with both host benefitsReference De Vadder, Kovatcheva-Datchary, Zitoun, Duchampt, Backhed and Mithieux15, Reference Mahdavinia, Rasmussen and Botha16 and a number of NCDs that have their origins in early life.Reference Scher, Sczesnak and Longman17–Reference Kristensen, Bryrup, Allin, Nielsen, Hansen and Pedersen19 Beneficially, lesser abundance of faecal P. copri has been observed in childhood atopic dermatitis.Reference Mahdavinia, Rasmussen and Botha16 While in contrast, greater abundance has been associated with early stage rheumatoid arthritis.Reference Scher, Sczesnak and Longman17 Conflictingly, greater abundance of faecal P. copri has been associated not only with both increased insulin sensitivity and glycaemic controlReference De Vadder, Kovatcheva-Datchary, Zitoun, Duchampt, Backhed and Mithieux15 but also with increased insulin resistance and impaired glucose tolerance.Reference Pedersen, Gudmundsdottir and Nielsen20 In this context, P. copri is a potentially useful biomarker and the ability to rapidly and accurately detect the presence of faecal P. copri and level of carriage without perfoming 16S rRNA gene or metagenomic sequencing would improve the cost implications and feasibility of large-scale studies of the relationships between gut bacteria and NCDs.
The aim of this study was to develop a rapid method for identification and determination of relative abundance of P. copri and investigate the distribution of abundance. This was performed in a cohort of pregnant women from the Barwon Infant Study (BIS), a large Australian birth cohort.Reference Vuillermin, Saffery and Allen21 Primers and probes for a real-time Taqman polymerase chain reaction (PCR) were designed, and the abundance of P. copri was determined relative to amplification of pan bacterial 16S rRNA genes.
Methods
Faecal collection and processing
Samples were selected from women in the BIS, a pre-birth cohort study in the southeast of Australia (n = 1064 mothers and 1074 infants) assembled using an unselected antenatal sampling frame. The eligibility criteria and cohort profile are described elsewhere.Reference Vuillermin, Saffery and Allen21 Faecal samples were collected from pregnant women in the BIS at 36 weeks gestation and stored at −80 °C prior to DNA extraction. DNA was extracted using the Qiagen PowerSoil® DNA Isolation Kit (Cat#12888-100) (QIAGEN Pty Ltd., Victoria, Australia). The quality of the DNA was assessed by NanoDrop and samples diluted to concentrations of 10 ng/μl and 20 ng/μl, for 16S rRNA gene diversity profiling (n = 410) and PCR (n = 605), respectively. Within these, the total number with both 16S rRNA gene MiSeq diversity profiling and P. copri PCR was 351 samples.
Relative abundance of P. copri by 16S rRNA gene MiSeq diversity profiling
A sample of the BIS cohort (n = 410) was selected for 16S rRNA gene bacterial diversity profiling sequencing, which was performed as described in Appendix Sample collection and processing. Briefly, the V4 region of the 16S rRNA gene was sequenced on the Illumina MiSeq platform. Operational taxonomic units (OTUs) were formed based on 97% identity, and taxonomic identification was based on the SILVA v123Nr99 database. Candidate OTUs representing P. copri were selected on the basis of (i) assignment to the SILVA genus-level taxon “Prevotella 9” consistent with P. copri and (ii) examining the alignment of their representative sequences with the Microbial Nucleotide BLAST tool.22 The OTU best-matching P. copri JCM 13464 16S rRNA gene (Accession No: AB649279) was taken to represent P. copri. For each sample, the relative abundance of P. copri was determined by dividing the number of sequences assigned to this OTU by the total number of sequences assigned to any OTU.
Relative abundance of P. copri by PCR
P. copri PCR
Primers specific to the V4 region of Prevotella 16S rRNA gene and a 20-mer Taqman 6-carboxyfluorescein (FAM)-labelled probe were designed using Primer Express (Thermo Fisher Scientific). The primer sequences and the PCR conditions are described in Table 1. In brief, the PCR reaction comprised 10 μl of Taqman Universal Master Mix II (Cat Nos 4440040, Thermo Fisher Scientific Australia), 1 µl of forward primer (1 μM), 1 μl of reverse primer (1 μM), 0.2 μl of Taqman P. copri probe, 2 µl of template DNA (20 ng/μl) and 5.8 μl of PCR grade sterile water. The PCR cycling conditions were 50 °C hold for 2 min, 95 °C hold for 10 min to activate the hot start DNA polymerase, followed by 42 cycles of 95 °C for 15 s and 60 °C for 1 min.
Table 1. Details of primers and probe

Universal 16S rRNA gene PCR
16S rRNA gene universal primers (341F-533R) were utilised to amplify the V4 region of pan bacterial species (Table 1). Cycle threshold (Ct) values for each sample were used for the calculation of P. copri expression (details below). The 16S rRNA gene PCR reaction comprised of 10 μl of PowerUp SyBR Green Master Mix (catalogue #A25742, Thermo Fisher Scientific Australia), 1 μl of forward primer (1 μM), 1 μl of reverse primer (1 μM), 2 μl of template DNA (20 ng/μl) and 6 μl of PCR grade sterile water. The PCR cycling condition was set as 50 °C hold for 2 min, 95 °C hold for 10 min, 95 °C hold for 15 s, 60 °C hold for 30 s, 72 °C hold for 45 s, 95 °C hold for 15 s, 59 °C hold for 30 s, 72 °C hold for 45 s, 95 °C hold for 15 s, 58 °C hold for 30 s, 72 °C hold for 45 s, followed by 42 cycles of 95 °C hold for 15 s, 57 °C hold for 30 s and 72 °C hold for 45 s. A melting curve was performed after 42 cycles at 95 °C hold for 15 s, 60 °C hold for 1 min, 95 °C hold for 30 s and 60 °C hold for 15 s.
PCR controls
DNA isolated from (i) a pure colony of P. copri (DSMZ 18205, www.dsmz.de) and (ii) a BIS maternal faecal sample that had a very high abundance of P. copri by 16S rRNA gene MiSeq diversity profiling was used as positive controls (Positive Control-1 and Positive Control-2, respectively). Two samples that were negative for P. copri but had exhibited 16S rRNA gene sequence for a related species, Prevotella jejuni, were selected as sensitivity controls. The positive controls were run on each PCR plate.
Linearity of P. copri and universal 16S rRNA gene PCR reactions
DNA from both the P. copri positive controls was serially diluted (four-fold dilutions from 20 ng/μl to 4.8 × 10⁻⁶ ng/μl), and samples were amplified for P. copri and universal 16S rRNA gene. The curves generated were assessed for linearity and provided an estimated threshold of reliable detection for both P. copri and universal 16S rRNA gene.
Calculation of relative abundance of P. copri by PCR
The relative abundance of P. copri by PCR was calculated (when there was reliable detection for both P. copri and universal 16S rRNA gene) by the 2−ΔCt method,Reference Livak and Schmittgen23 where ΔCt was the differences in Ct values for P. copri and universal 16S rRNA gene, and relative abundance of P. copri was described in arbitrary units (a.u.). Comparison of the relative abundance of P. copri by PCR with the relative abundance by 16S rRNA gene sequencing was performed by linear regression after log transforming both measures.
Abundance of P. copri by whole genome NGS
Bacterial DNA from seven women’s samples was sheared, adapter ligation and nick repair performed using the Ion Plus Fragment Library kit, cleaned and quantitated, and metagenomic sequencing performed on the Ion Torrent S5xl System (Thermo Fisher Scientific). The total reads for the samples were between 3,824,400 and 9,384,897. The assembled contigs were mapped to the NCBI Reference Sequence: NZ_ACBX00000000.2, Prevotella copri DSM 18205, whole genome shotgun sequencing project, and the proportion of mapped reads/total reads assessed for each of the seven samples.
Results
16S rRNA gene MiSeq profile
Six OTUs were assigned to the “Prevotella 9” taxon. The most frequent, which we refer to by the non-canonical name OTU41, represented 97.0% of all “Prevotella 9” OTU counts and its representative sequence was an exact match with P. copri JCM 13464 16S rRNA gene (Accession No: AB649279). Thus, we used the relative abundance of OTU41 as a marker for the relative abundance of P. copri, concluding that it was present in 79/410 samples at relative abundances between 0.0037% and 66% (mean 7.5% when present, 1.4% overall; median 0.37% when present).
P. copri PCR
The Taqman primer/probe PCR reaction worked efficiently, with positive controls giving Ct values <15 and sensitivity controls undetermined up to 34 cycles (Fig. 1). This indicates high specificity for the PCR. Stocks of the positive control DNA were used in all PCR assays that followed, with Ct values set to the same level throughout all semi-quantitative PCR assays.

Fig. 1. Real-time PCR amplification of P. copri in faecal DNA. A Taqman reaction with primers and FAM conjugated probe was used to detect the presence of P. copri. The samples selected as positive controls were amplified (pure bacterial P. copri DNA and high abundance P. copri faecal DNA with starting DNA concentration of 20 ng/µl) and had Ct values of 11.7 and 12.4, respectively. Samples selected as negative controls (high abundance P. jejuni faecal DNA with starting DNA concentration of 20 ng/µl) had a Ct value >37.0.
Universal 16S rRNA gene PCR
The same set of samples was run using the universal 16S rRNA gene primers. A Sybr Green reaction was used with a number of touchdown steps for the primer annealing. The positive control DNA was also used in all the PCR assays, with Ct values set to the same level throughout all PCR assays.
Assessment of linearity of PCR reactions
The P. copri PCR was linear for serially diluted samples (one in four dilutions, 20 ng/μl to 3.8 × 10⁻⁶ ng/μl). This indicated high sensitivity for the detection of P. copri. The universal 16S rRNA gene PCR reaction, however, was only linear from 20 ng/μl to 1.25 ng/μl (1/16 dilution). An estimated threshold for reliable detection of P. copri was ≤34 Ct corresponding to the detection of negative controls (Fig. 1) and the linearity threshold (Fig. 2a). For reliable calculation of relative expression, the threshold for universal 16S rRNA gene was ≤15 Ct for each sample (Fig. 2b, 2c).

Fig. 2. Determination of linearity of the real-time PCR reactions for P. copri and 16SrRNA gene sequencing. The linearity of P. copri and universal 16S rRNA gene PCR reactions was determined by amplification of serially dilutions (¼ sequentially) of the positive control DNA (from 20 ng/µl). The Ct thresholds (………) for calculation of P. copri expression was estimated to be 34 Ct for the (a) P. copri reaction and 15 Ct for universal 16S rRNA PCR reaction in both (b) positive controls and (c) pure P. copri.
Relative abundance of P. copri by PCR
In this group of pregnant Australia women, detectable levels of P. copri were observed in 165/605 (27.3%) women. The relative abundance of P. copri by PCR ranged from 1.5 × 10⁻⁵ to 141.6 arbitrary units (a.u.) and after log-transformation showed a distinct bimodal pattern (Fig. 3). Based on this distribution, we assigned those mothers with relative abundance by PCR less than 10−2a.u. as having “very low” carriage of P. copri (n = 50), equivalent to a Ct >32.9 ± 2.0 (mean ± SD), while mothers with relative abundance by PCR greater than 10−2a.u. were defined as having “substantial” carriage of P. copri (n = 115).

Fig. 3. Bimodal distribution of P. copri expression. P. copri expression (arbitrary units, a.u.) in faecal samples from pregnant mothers was determined by real-time PCR. 165/605 samples were classified as P. copri positive, and the distribution of expression was bimodal, with 50 samples <10−2 a.u. classified as “very low”, and 115 samples >10−2 a.u. classified as “substantial”.
Correlation between the relative abundance of P. copri by PCR with other methods
16S rRNA gene MiSeq sequencing
The relative abundance of P. copri by PCR was strongly correlated with the relative abundance determined by Illumina MiSeq 16S rRNA gene sequencing (r 2 = 0.67, P < 0.0001, n = 61) (Fig. 4), and the correlation was strongest when the relative abundance by both methods was greater than 10−1. There were 39 samples deemed positive for P. copri by PCR (relative abundance of P. copri by PCR, 1.5 × 10⁻⁵ to 0.8 a.u.) but not detected by 16S rRNA gene sequencing. Of these 39, 30 expressed P. copri in the very low carriage range and 29 had <5000 total sequence read counts in the MiSeq 16S rRNA gene profiling.

Fig. 4. Scatter plot of relative abundance of P. copri measured by real-time PCR and 16S rRNA gene sequencing. The relative abundance of P. copri by PCR was strongly correlated with the relative abundance determined by 16S rRNA gene sequencing using Illumina MiSeq (r 2 = 0.67, P < 0.0001, n = 61).
Whole genome NGS
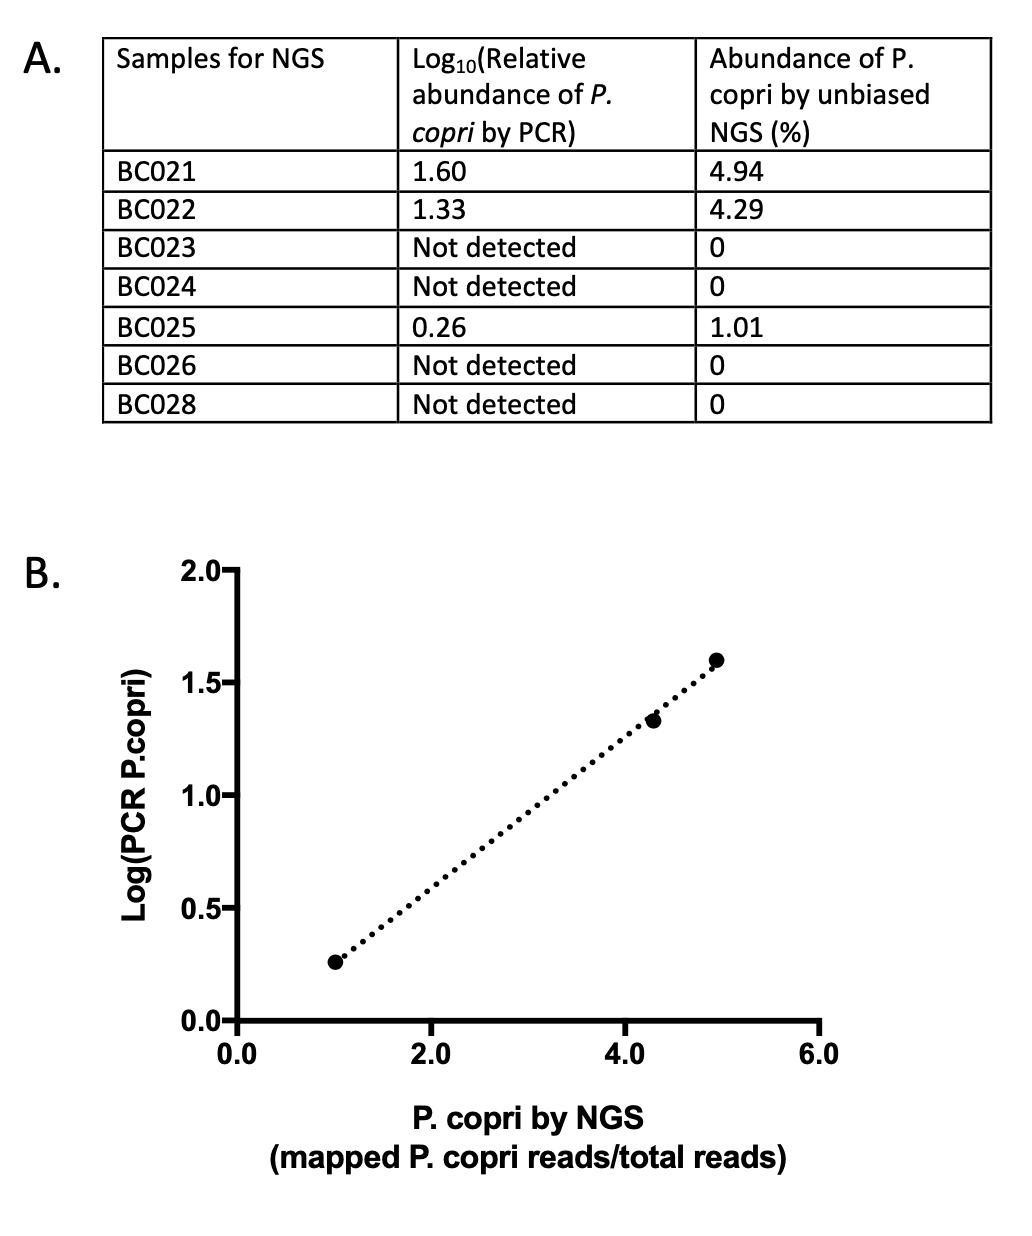
There was absolute agreement between the P. copri PCR and the unbiased next generation sequencing (NGS) with 4/7 of the samples not detecting P. copri (Supplementary Fig. 1). Of the three samples with detectable P. copri, the methods correlated almost perfectly (r 2 = 0.99, P = 0.001) (Supplementary Fig. 1).
Discussion
Our study utilised a semi-quantitative real-time PCR method to determine the relative abundance of P. copri and demonstrate a bimodal distribution of P. copri in faecal microbiota of pregnant Australian women. To our knowledge, this is the first time that the carriage pattern of this key bacterial species, which is implicated in the development of NCDs, has been reported by direct identification. The probe developed was specific for the detection of P. copri, and the derived relative abundance showed a high level of agreement with the relative abundance determined by 16S rRNA gene sequencing data. The assay will assist in rapid and inexpensive semi-quantification of this important bacterium in future studies.
Targeted PCR has been used extensively in clinical microbiology laboratories for routine diagnosis of infectious diseases,Reference Maurin24 and primers that are able to amplify the pan bacterial 16S rRNA genes have been employed to enable semi-quantitation of the target.Reference Sontakke, Cadenas, Maggi, Diniz and Breitschwerdt25 Here, we used specific primers and probe to identify a particular gut bacterial species. Although the amplicon is not large, the amplified sequence is 100% matched in coverage and identity to P. copri only. A related Prevotella species, P. jejuni, also found in faeces, had 98% coverage and 91% identity for the amplicon, but reassuringly was not detected in the accepted Ct range for the assay. The approach used here for identification and quantification of a bacterial species against bacterial content could be applied to the determination of specific strains of bacteria. Strain differences may be key to understanding the apparently contradictory association of bacteria with both health and disease.Reference Nicol and Wilkinson26 As an example of this, a recent study showed that non-Western individuals harboured P. copri strains with a higher number of genes encoding carbohydrate catabolism and starch binding mechanisms, while Western individuals had strains with increased genetic capacity for protein and vitamin utilisation.Reference De Filippis, Pasolli and Tett27 PCR potentially provides an efficient and cost-effective method of strain detection and quantification in large studies.
Reported associations between P. copri and human health outcomes may be contingent on abundance state. In previous studies, based on 16S rRNA gene sequencing, a bimodal abundance distribution of the genus Prevotella has been reported;Reference Lahti, Salojarvi, Salonen, Scheffer and de Vos12 however, this is the first time to our knowledege that a bimodal distribution of carriage of P. copri has been observed in a large population cohort. We defined the relative abundance of P. copri by PCR as either substantial (>10−2a.u.) or very low (<10−2a.u.). It is important to recognise that <10−2a.u means that carriage was only detected after 33 PCR cycles, and the meaningfulness of detection at such exceptionally low levels is uncertain. It is however possible that low abundance carriage represents a reservoir to maintain microbial diversity. In murine models, Sonnenburg et al. demonstrated that long-term dietary change may alter faecal bacterial composition irreversibly.Reference Sonnenburg, Smits, Tikhonov, Higginbottom, Wingreen and Sonnenburg28 Importantly, bacterial diversity loss was only partly reversible with a return to a broader diet. These findings parallel changes in faecal bacterial composition identified in modern industrialised societies. Highly Westernised gut microbiomes lack diversity,Reference Yatsunenko, Rey and Manary8, Reference Schnorr, Candela and Rampelli10, Reference Martinez, Stegen and Maldonado-Gomez11 thought to be related to accumulated species loss as a result of narrow dietReference Sonnenburg, Smits, Tikhonov, Higginbottom, Wingreen and Sonnenburg28 and exposure to antibacterial agents.Reference Yassour, Vatanen and Siljander29 A lower abundance state may be important in maintaining gut microbiome diversity by allowing repopulation with bacterial species in response to environmental perturbations.
Greater abundance of P. copri, defined by 16S rRNA gene sequencing, has been associated with both benefits to the host,Reference De Vadder, Kovatcheva-Datchary, Zitoun, Duchampt, Backhed and Mithieux15, Reference Mahdavinia, Rasmussen and Botha16 as well as inflammatory disease states.Reference Scher, Sczesnak and Longman17, Reference Dillon, Lee and Kotter18 Although less evidence exists to date, lower abundance carriage of P. copri may also influence health outcomes. Recently, it has been reported that a lower relative abundance of P. copri, defined by 16S rRNA gene sequencing, was associated with atopic dermatitis.Reference Mahdavinia, Rasmussen and Botha16 Further research in larger cohorts using PCR is required to examine whether P. copri expression state, and in particular very low carriage, is associated with health outcomes.
Strategies for reducing the complexity of microbiome data are crucial to assessing associations within an epidemiological framework, as they enable meaningful approaches to important issues such as the selection of covariates to include in adjusted analysesReference VanderWeele30 and assessment of causal inference features.Reference Ponsonby and Dwyer31 In general, data dimension reduction steps are applied during the analysis of data derived via DNA sequencing platforms (16S rRNA gene or metagenomic) and include the calculation of summary measurements such as alpha diversity, phylum level abundance or principal co-ordinates, and classification into enterotypes or according to presence/absence of selected taxa. A limitation of this approach is that the sequencing techniques and subsequent bioinformatic analyses remain time-consuming and expensive. The microbiome is highly dynamic and identifying associations that are likely to be causal represents a crucial challenge for the field.Reference Schmidt, Raes and Bork32 In addition to the improved biologic insights provided by advances in sequencing technology and bioinformatic techniques, we need studies involving large numbers of participants, with frequent longitudinal measures, and adequate consideration of covariates; and of course replication. In this context, simple, inexpensive measures of microbiome biomarkers, such as P. copri carriage, may compliment in-depth, resource-intensive, sequencing studies.
The strengths of this study include the use of a large population cohort, as well the use of negative controls, a bacterial DNA with a high expression of an alternate Prevotella species. The PCR for P. copri appears to be both specific and sensitive to very low levels of the bacteria. The expression quantitation also shows good correlation with 16S rRNA gene sequencing P. copri abundance but may be even more sensitive for the very low carriage state. The main limitation of this study is that participants were all pregnant women from a defined geographical area. Pregnancy, sex and environment may all have an effect on the composition of the gut microbiome, and this may limit the generalisability of the findings. However, the cohort demographics reflect the Australian population more broadly,Reference Vuillermin, Saffery and Allen21 and thus these findings may be relevant to other Westernised populations.
Conclusion
We developed a rapid and cost-effective technique for identifying the faecal bacteria P. copri using quantitative real-time PCR. The expression of P. copri in our cohort was distributed bimodally, with both substantial and very low faecal expression. Further investigation of the very low carriage state may be important in understanding the role of P. copri in health and disease or maintaining a microbiome community structure in Westernised environments. The use of real-time PCR measures may facilitate large, longitudinal studies across multiple populations and settings, which will compliment smaller, resource-intensive sequencing-based studies.
Supplementary Material
To view supplementary material for this article, please visit https://doi.org/10.1017/S2040174419000849
Acknowledgements
We would like to thank the study participants, as well as the entire BIS team which includes interviewers, nurses, computer and laboratory technicians, clerical workers, research scientists, volunteers, managers and receptionists. We also thank the obstetric and midwifery teams at Barwon Health and Saint John of God Hospital Geelong for their assistance in recruitment and collection of biological specimens.
Financial Support
This study was funded by the National Health and Medical Research Council of Australia (1082307, 1147980 and 11511322), The Murdoch Children’s Research Institute, Barwon Health and Deakin University.
Disclosures
Prevatex Pty. Ltd. PV is Chief Scientific Officer. MOH has a financial interest.
Conflict of Interest
None.
Ethical Standards
Ethics approval (10/24) for this study was obtained from the Barwon Health Human Research Ethics committee.
Appendix
Sample collection and sequencing
Faecal samples were collected from pregnant women at 36 weeks gestation. Prior to arriving at the laboratory, samples were either stored temporarily at 4 °C or frozen at −20 °C. Samples were thawed and aliquoted to approximately 200 mg and stored for 1–3 years at −80 °C. In a subset of 410 mothers, DNA was extracted using the Qiagen PowerSoil® DNA Isolation Kit, Cat#12888-100 and transported to the J. Craig Venter Institute, Rockville, MD, USA. The V4 variable region of the 16S rRNA gene was amplified using adaptor and barcode-ligated V4 primers (forward: 5′-GTGCCAGCMGCCGCGGTAA-3′, reverse 5′-GGACTACHVGGGTWTCTAAT-3′). PCR amplicons were generated from approximately 100 ng of extracted DNA using Platinum Taq polymerase (ThermoFisher Inc.) and cycling conditions: 94 °C followed by 35 cycles of 94 °C for 30 s, 57 °C for 30 s and 72 °C for 30 s, followed by a final extension cycle of 72 °C for 5 min. Amplicons were purified using the Qiaquick PCR purification kit (QIAGEN Inc.) following manufacturer’s specifications. Purified amplicons were quantified using SybrGold, normalised and pooled in preparation for Illumina MiSeq sequencing. Libraries were sequenced using the dual index V2 chemistry kit 2x250bp on an Illumina MiSeq according to manufacturer’s specifications.Reference Kozich, Westcott, Baxter, Highlander and Schloss33 USEARCH softwareReference Edgar34 merged corresponding paired-end reads, filtered (to remove merged reads with mismatches, too many or too few base pairs), clustered into 97% identity OTUs, identified OTU representative sequences and removed chimeras. The mothur software suiteReference Schloss, Westcott and Ryabin35 assigned representative sequences to taxa described in the SILVA v123Nr99 taxonomic database. The final descriptions of OTUs present in each sample were composed in USEARCH. Samples with fewer than 2500 read pairs were excluded from further analysis. Microbiome data were managed using the phyloseq package in R.Reference McMurdie and Holmes36, 37