Introduction
The earliest and strongest evidence in support of the fetal programming of health and disease is from retrospective studies on birth outcomes. These pioneering studies indicated that increased risk for numerous diseases were associated with being born small for gestational age (GA) or being born early.Reference Barker1–Reference Richards, Hardy, Kuh and Wadsworth5 Birth phenotype, itself, was not considered the only source of risk but instead reflected adverse in utero exposures that influenced fetal development and contributed to poor birth outcomes. Growing evidence from prospective longitudinal studies indicates that there is a link between prenatal adverse conditions and birth outcomes including reductions in birth weight.Reference Sandman and Davis6–Reference Wadhwa, Sandman, Porto, Dunkel-Schetter and Garite9 However, no studies have directly tested an association between measures of fetal well-being or maturation and birth weight.
Studies reporting continuity between fetal heart rate (FHR) and movement patterns and infant mental and motor development,Reference Vlastos, Tomlinson and Bildirici10–Reference Werner, Myers and Fifer15 infant temperamentReference Werner, Myers and Fifer15–Reference DiPietro, Costigan and Pressman18 and infant autonomic functionReference DiPietro, Costigan, Pressman and Doussard-Roosevelt19, Reference Kisilevsky and Muir20 suggest that fetal behavioral patterns may be useful predictors of developmental outcomes. There is compelling evidence that fetal responses to stimulation follow a developmental progression and recent evidence from our studiesReference DeCasper and Fifer31 indicate that heart rate patterns in response to a simple startling stimulus reflect fetal neurological maturation.
Because of these developmental trends, a metric of central nervous system maturation is reflected in human fetal responses to external stimulation. This metric may reflect fetal health and may predict birth and developmental outcomes. Fetal maturation can be assessed by evoking FHR changeReference Kisilevsky and Muir20–Reference Pietrantoni, Angel and Parsons26 in response to external stimulation. A variety of ex utero stimuli have been used to stimulate the human fetus including buzzers,Reference Leader, Baillie, Martin and Vermeulen27–Reference Zimmer, Chao, Guy, Marks and Fifer29 clicks, tonesReference Grimwade, Walker, Bartlett, Gordon and Wood30 and the human voiceReference Lecanuet, Granier-Deferre and Busnel25, Reference DeCasper and Fifer31, Reference Fifer and Moon32, but the combined tactile and auditory stimulation of a vibroacoustic stimulus (VAS) elicits a more reliable response, earlier in gestation, than an auditory stimulus alone.Reference Kisilevsky and Muir20
We have shown that the fetal response to the VAS at ∼30 weeks of GA represents a transitional period in fetal maturation. By ∼30 weeks of GA most fetuses exhibit a response to the VAS but the patterns vary widely in terms of the magnitude of response and the rate of recovery.Reference DeCasper and Fifer31 The specific purpose of the present study was to determine whether FHR patterns in response to the VAS at ∼30 weeks of GA predicted birth phenotype (GA at birth and birth weight). We will determine whether fetal responses to stimulation at a transitional period in fetal development are early indicators of birth outcomes that have long-term developmental consequences.
Methods
Study overview
All maternal–fetal dyads were recruited before the 16th week of gestation as part of longitudinal study. Each dyad was assessed with measures of FHR following a VAS (startling) between 29 and 33 weeks of gestation (mean = 31.19, s.d. = 0.83). All participants were followed up to delivery for assessment of GA and infant's birth weight.
Participants
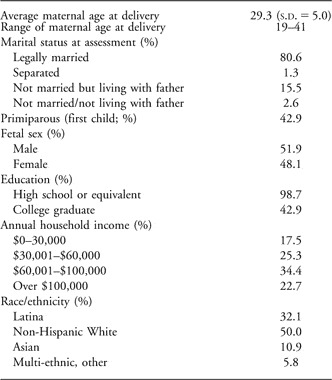
The sample comprised 174 maternal–fetal pairs who had complete FHR data at ∼30 weeks of gestation. Women gave informed consent for all aspects of the protocol, which was approved by the Institutional Review Board for protection of human subjects. All pregnancies were singleton intrauterine pregnancies in English-speaking women of at least 18 years of age. Women were excluded if they had medical conditions potentially associated with risk for poor birth outcomes including uterine or cervical abnormalities, endocrine, hepatic or renal disorders, or if they used corticosteroid medications or recreational drugs during pregnancy. Maternal demographic information is summarized in Table 1. Four maternal–fetal dyads were excluded because women reported recreational drug use during their pregnancy.
Table 1 Demographic information for the 156 participants

Fetal assessment
The assessment of the human fetus followed procedures reported previously by our group.Reference Sandman, Wadhwa, Hetrick, Porto and Peeke33–Reference Class, Buss and Davis35 The vibroacoustic stimulator was placed on the mother's abdomen above the fetal head, as determined by ultrasonography. During the assessment, mothers reclined in a semi-Fowler's position (5–10° tilt) on a standard, padded examination table. Mothers listened to pure-tone music through headphones to mask extraneous noise and the auditory component of the VAS. Fetal assessment began with a 15-min baseline (resting) period, where FHR was recorded before 1-s administration of the VAS (72 dB, 75 Hz + 10% harmonics ranging from 20 to 9000 Hz; EAL Model 146, Corometric Medical System, CT, USA) on the mother's abdomen. The fetal assessment concluded with 60 s of FHR recording to assess the fetal response to VAS.
Transabdominal transducers were attached to measure FHR. Transducers were positioned until a robust FHR signal was reliably detected. All fetal information and uterine contractions were quantified by a Toitu MT-430 ultrasound fetal monitor. The Toitu monitor measured Doppler frequency shifts in a weak ultrasound beam projected onto the fetus by an ultrasonic head and extrapolated the FHR from fetal movement and uterine contractions. Data from the fetal monitor were digitized at 2 kHz sampling rate with Active II (BioSemi Instrumentation, Amsterdam, The Netherlands) and automatically transferred to an off-line server for analysis. No uterine contractions occurred during the assessment period. Integrity of the FHR data was assured using customized software that included a viewer for examination of each tracing to scan for artifacts. An interpolation routine was applied for gaps or artifacts in the FHR record of no greater than 10 s. Each tracing was examined by a trained observer and a judgment was made about the validity of the interpolation. If a segment of the data resulted in unacceptable interpolations (the interval was >10 s or the estimate did not match the valid data points), that section of the data was omitted from the analyses. The change in FHR responses after stimulation (difference from baseline) was computed with a 10-s moving average filter. The first value after the VAS was the average change from baseline in FHR during the first 10 s, the second value was the average change of FHR from 2 to 11 s after the VAS, and this continued so that the FHR value at 30 s was the average FHR change from baseline for the interval between 30 and 40 s after stimulation.
Assessment of fetal growth and birth outcome
Maternal and infant medical records were reviewed by a research nurse to assess prenatal medical history and birth outcome. Birth weight percentiles (BWPs), stratified by infant's sex and GA at birth were assigned for each infant using published US norms.Reference Oken, Kleinman, Rich-Edwards and Gillman36 Pregnancies were dated according to current American College of Obstetricians and Gynecologists guidelines37 by comparison of last menstrual period to estimates based on early ultrasound measurements by the research nurse taken at 15 weeks of gestation. The mean GA at birth for the sample was 39.3 weeks. Ultrasound assessments were performed at each visit to collect biometric data and measures of fetal development (e.g. head circumference, biparietal diameter, abdominal circumference, length of femur). Estimated fetal weight at the time of assessment (∼30 weeks of GA) was calculated using a regression equation proposed by Hadlock et al.Reference Hadlock, Harrist, Sharman, Deter and Park38 with the fetal parameters of head circumference (HC), abdominal circumference (AC) and femur length (FL): Log10 weight = 1.326−0.00326−0.00326 AC × FL + 0.0107 HC + 0.0438 AC + 0.158 FL.
Plan of analyses
All analyses were performed using FHR data at 1 s resolution. To rule out any impact of VAS preparation on resting FHR levels, the interval of seconds 180–60 (120 s total) preceding the VAS was applied as the baseline comparison. FHR data from the first 30 s after VAS were used for analyses because we have shown that this interval captures the FHR response and recovery at 30 gestational weeks. As described above, post-stimulus data were analyzed with a 10 s moving average of the change from baseline (delta averages).
Group-based trajectory modeling (GBTM)Reference Nagin39 was used to categorize fetuses into groups based on unique patterns of FHR response to the VAS. Trajectory analysis, a semi-parametric group-based method, relies on finite mixture modeling to empirically identify groups of individuals displaying distinctive longitudinal trajectories of FHR response. GBTM was computed using the TRAJ procedure run under SAS. Equations were specified as cubic. The Bayesian information criterion was used to select the optimal number of trajectory groups among our sample (n = 7). Groups were added until the Bayes factor for the additional group was <10, at which point the last group was removed. The following criteria were used to determine the adequacy of the model: (i) The average posterior probability for each group was >0.70 (see Table 2); (ii) the odds of correct classification (model scheme v. random assignment) was at least 5.0 for each group; and (iii) there was close correspondence between the probability of assignment and the proportion actually assigned to each group. Each mother–fetal pair was assigned to the GBTM FHR group for which they had the highest posterior probability of membership. Two subjects were excluded because their FHR profiles were not adequately fit for any of the group patterns (all posterior probabilities for each group <0.70 for each pair). In contrast with growth curve modeling, which assumes population homogeneity over time, GBTM empirically tests for heterogeneity in population change patterns and identifies both normative and atypical patterns.
Table 2 Fetal heart groups determined by GBTM

GBTM, group-based trajectory modeling; FHR, fetal heart rate; GA, gestational age; BWP, birth weight percentile.
Average probability of group membership, GA and BWP for each group.
All values are given as (mean ± s.d.).
aFHR groups 2 and 4 significantly differ in BWP; Bonferroni post hoc comparisons with parity and estimated fetal weight at time of assessment as covariates, P = 0.01
Seven FHR groups were identified using GBTM. Two of the FHR groups were not included in analyses because they had fewer than 10 subjects in a group (12 subjects total – six per group). Thus, all analyses focused on the remaining five groups (156 subjects), which comprised 23–39 participants each (see Table 2). After group assignment, a between-subject analysis of variance assessed whether the empirically generated FHR groups significantly differed in BWP and length of gestation, with Bonferroni post hoc tests as needed. The possibility was assessed that race/ethnicity, socio-economic status, maternal age, obstetric risk factors, fetal sex, GA at assessment or parity might account for the observed links between FHR patterns and birth outcomes. Of these variables, only parity (primiparous v. multiparous) was associated significantly (P < 0.05) with BWP and was therefore included as a covariate.
Results
FHR patterns
The FHR patterns that determined group membership are presented in Figure 1. Group 1 (n = 28) exhibits a small acceleration (1.62 bpm at 4 s to the VAS) and then a return to baseline indicating recovery (maximum deceleration of −1.43 bpm at 14 s). Group 2 (n = 23), exhibits an immediate FHR deceleration of −8.55 bpm and then an immediate acceleration with a peak of 7.63 bpm at 16 s after VAS. Group 3 (n = 38) exhibits an immediate acceleration reaching a peak of 9.08 bpm above baseline at 7 s after stimulation with a recovery to baseline at 17 s continuing to decelerate below baseline to −3.81 bpm at 26 s. Group 4 (n = 39) immediately accelerates and reaches the peak FHR of 10.83 bpm above baseline at 10 s with a slow recovery to baseline (1.19 bpm by 30 s after the stimulus). Group 5 (n = 28) has a pattern of early FHR acceleration that does not recover throughout the 30 s after VAS period. The pattern for group 5 reaches a peak of 13.57 bpm above baseline at 12 s after the VAS and remains elevated at 10.18 bpm above the baseline at 30 s after the stimulus.

Fig. 1 Change in fetal heart rate (FHR) from baseline after stimulation with a vibroacoustic stimulus. A moving average of 10 s was applied to the FHR response. The groups were determined by the group-based trajectory modeling. The significant group difference in birth weight percentile (BWP) was accounted for by the effects of groups 2 (lowest BWP) and 4 (highest BWP).
FHR and BWP
The FHR group trajectories at ∼30 weeks GA were significantly associated with BWP [F(4, 150) = 3.35, P = 0.01]. The overall difference between FHR groups remained significant [F(4, 149) = 3.37, P = 0.01] when estimated fetal weight at the time of assessment was added to the model as a second covariate (with parity). Post hoc analyses with the Bonferroni adjustment indicated that groups 2 and 4 accounted for the significant differences in BWP. Group 2 included the infants with the lowest mean BWP (mean = 33.7, s.e. = 4.4), whereas and group 4 included infants with the highest mean BWP (mean = 59.2, s.e. = 4.0; see Fig. 1 and Table 2). The difference between groups 2 and 4 remained significant (post hoc comparisons; P = 0.01) when estimated fetal weight at the time of assessment was added to the model as a second covariate (with parity).
There were seven maternal/fetal dyads who participated in the study twice with two pregnancies separated by an average of 24.4 months. There were eight women who reported smoking cigarettes sometime during pregnancy, but smoking among our sample was not significantly associated with BWP (t 154 = 0.27, P = 0.79). The findings did not change when these women were excluded from the analyses.
FHR and length of gestation
There was no difference between the FHR groups in GA at birth, F(4, 151) = 0.699, P = 0.594.
Discussion
Recent prospective studies, including the current study, support the proposal that fetal exposures, experience and perhaps behavior, contribute to birth phenotypeReference Wadhwa, Sandman, Porto, Dunkel-Schetter and Garite9, Reference Glynn, Schetter, Hobel and Sandman40–Reference Dunkel Schetter and Glynn42 in addition to developmental outcomes independent of birth outcome.Reference DiPietro, Hodgson, Costigan and Johnson16–Reference DiPietro, Costigan and Pressman18, Reference Van den Bergh43–Reference Ellman, Dunkel Schetter and Hobel46 This is the first direct evidence that fetal neurological maturation predicts birth outcome among healthy, normal subjects.
There are two primary findings from this large study of FHR response patterns to a startling stimulus. First, using a GBTM analysis, complex patterns of fetal heart responses to stimulation were identified. Each fetus has a probability of belonging to any of the groups; however, group assignment is based on the highest probability of membership. As presented in Figure 1, distinctive FHR patterns of response to the VAS were discovered at ∼30 weeks of GA, a period of fetal maturational transition.Reference Buss, Davis and Class34 This is the first use of this powerful analytic tool with FHR data and it provided a unique opportunity to group individual differences in FHR response to stimulation, perhaps reflecting neurological maturation.
Second, we found that FHR patterns at ∼30 weeks of GA predicted birth outcomes nearly 2 months later. Fetuses exhibiting an immediate heart rate acceleration with a peak at 10 s after VAS and then a recovery to baseline (group 4) had the highest BWP, after accounting for sex, estimated fetal weight at ∼30 weeks of GA and GA at birth. Fetuses with the lowest BWP (group 2) were the only group with an immediate deceleration in response to the VAS, followed by acceleration that did not recover. Previously we reported that these two patterns of FHR response to a VAS at ∼30 weeks of GA were associated with a mature neurological pattern (group 4) and a delayed neurological pattern (group 2).Reference DeCasper and Fifer31 The current findings suggest that prenatal markers of fetal neurological maturity are significantly associated with physical development at birth.
Assessment of fetal behavior, including FHR and movement in response to stimulation, has been associated with nervous system development,Reference Sandman, Wadhwa, Hetrick, Porto and Peeke33, Reference Dipietro, Irizarry, Hawkins, Costigan and Pressman47–Reference Nijhuis50 infant mental and motor development,Reference Vlastos, Tomlinson and Bildirici10–Reference Werner, Myers and Fifer15 infant temperamentReference Werner, Myers and Fifer15–Reference DiPietro, Costigan and Pressman18 and infant autonomic function.Reference DiPietro, Costigan, Pressman and Doussard-Roosevelt19, Reference Kisilevsky and Muir20 The association reported here is the first of its kind between an elicited FHR and birth phenotype. The findings that fetal response to a startling stimulus was significantly associated with birth weight after controlling for two established factors associated with size at birth, parity and estimated fetal weight provide support for the independent influences of fetal neurological maturation on birth outcome. It is not clear whether fetal neurological maturation itself exerts programming influences on development to influence size at birth or whether this association reflects a systemic or syndromic relationship between birth phenotype and fetal neurological maturation. For instance, other factors or a network of factors might influence both fetal and birth outcomes and account for this association. There are well-established neurological consequences associated with low birth weightReference Lundgren and Tuvemo51 and the current findings suggest that these consequences may have their origins in early fetal development.
Acknowledgements
The present study was supported by the National Institutes of Health awards NS-41298 and HD-51852 to CAS, and HD-40967 to LMG. The assistance of Cheryl Crippen, Megan Blair, Christina Canino, Natalie Hernandez and Kendra Leak is gratefully acknowledged.