Introduction
There is increasing evidence of a relationship between extremely premature birth (less than 28 weeks of pregnancy) and lower weight and height in adolescence Reference Raaijmakers, Jacobs and Rayyan1 , higher blood pressure Reference Sipola-Leppänen, Vääräsmäki and Tikanmäki2,Reference South, Nixon and Chappell3 , change in glucose Reference Sipola-Leppänen, Vääräsmäki and Tikanmäki2,Reference Kopec, Shekhawat and Mhanna4 and lipid metabolism Reference Kerkhof, Willemsen, Leunissen, Breukhoven and Hokken-Koelega5 associated with a higher prevalence of diabetes and obesity in adulthood, compared to their counterparts full-term infants. The causative agent of this metabolic reprogramming is not well defined. Due to their pulmonary and gastrointestinal immaturity, premature infants are exposed to increased oxidative stress caused by their clinical needs for supplemental oxygen and parenteral nutrition (PN), which is inherently contaminated with peroxides Reference Bassiouny, Almarsafawy, Abdel-Hady, Nasef, Hammad and Aly6–Reference Silvers, Darlow and Winterbourn8 . Oxidative stress has also been shown to be an active factor contributing to pathological complications of prematurity such as bronchopulmonary dysplasia Reference Mohamed, Elremaly, Rouleau and Lavoie9,Reference Lavoie, Rouleau, Tsopmo, Friel and Chessex10 . Supplemental oxygen and peroxides from PN are two independent factors leading to the development of bronchopulmonary dysplasia Reference Saugstad11,Reference Saugstad12 . Thus, oxidative stress, caused by oxygen supplement or by peroxides, is suspected to cause the metabolic reprogramming because of its impact on epigenetic metabolism Reference Yara, Levy, Elremaly, Rouleau and Lavoie13–Reference Lorente-Pozo, Parra-Llorca and Núñez-Ramiro15 and its direct implication in causing diseases of the premature newborns Reference Mohamed, Elremaly, Rouleau and Lavoie9,Reference Lorente-Pozo, Parra-Llorca and Núñez-Ramiro15,Reference Ozsurekci and Aykac16 . In addition, a disruption of the hepatic lipid metabolism is reported in an animal model, Reference Chessex, Lavoie and Rouleau17–Reference Hyde, Amusquivar and Laws19 where a modification of the activities of key enzymes Reference Maghdessian, Côté, Rouleau, Ouadda, Levy and Lavoie18 as well as the deposition of fat Reference Chessex, Lavoie and Rouleau17 was associated with the presence of these peroxides. In this context, we hypothesized that peroxides generated in PN and received by the newborns are a major factor leading to the long-term metabolic disturbance associated with extreme prematurity.
Recently, we have reported that oxidative stress associated with PN is prevented by the addition of glutathione to PN Reference Elremaly, Mohamed, Rouleau and Lavoie20,Reference Morin, Guiraut, Perez Marcogliese, Mohamed and Lavoie21 . This supplement enhances the animal’s ability to detoxify peroxides Reference Elremaly, Mohamed, Rouleau and Lavoie20 . Therefore, this is an opportunity to separate the impacts of peroxide-related oxidative stress from the impact of PN by itself.
Glucose is the main source of energy for the body and the main source of carbon for nucleotides, amino acids, lipids, and others. An appropriate metabolic flow is essential for glucose to support the development of the being and its health. Thus, a living organism can be considered as a thermodynamically open system in which the molecules evolve to become a substrate for the next enzymatic reaction. The metabolic flow through an open system exists by the irreversibility of certain enzymatic actions. The orientation of the flow towards different metabolic pathways is conditioned by the activity of key enzymes such as glucokinase (GCK), phosphofructokinase (PFK), and acetyl-CoA carboxylase (ACC) which are well known to be the control points of energy metabolism.
Unlike other hexokinases, the activity of GCK is not limited by its enzymatic product glucose-6-phosphate; GCK plays the role of a glucose sensor. Glucose-6-phosphate is the substrate for three main pathways: glycolysis, glycogen storage, and the pentose phosphate pathway. The activity of PFK regulates the entry of glucose-6-phosphate into glycolysis, generating ATP and ultimately producing acetyl-CoA. ACC is a well-known limiting step of de novo lipogenesis by converting acetyl-CoA to malonyl-CoA, an intermediate in this pathway. In addition, malonyl-CoA inhibits carnitine palmitoyl transferases that transfer fatty acids to mitochondria for their oxidation, thereby promoting lipid accumulation.
The objective was to study separately the effects of PN received early in life and the oxidative stress induced by peroxides contaminating this PN on long-term energy metabolism. Therefore, the oxidative stress and hepatic activity profiles of three key enzymes of the energy metabolism (GCK, PFK, and ACC) were measured immediately and 15 weeks after the glutathione-enriched or non-enriched PN infusions received during the first week of life.
Materials and methods
All chemical products were purchased from Sigma-Aldrich, Fischer Scientific, Roche Diagnostics, Bio-Rad laboratories, or MP Biomedicals, unless otherwise stated.
Experimental procedures
The study aims to describe the long-term impact of neonatal PN on hepatic metabolism involved in energy substrates (glucose and lipids). Therefore, the reference group consisted of animals of the same age but without manipulation (no catheter) and fed with regular guinea pig food; this group was named Oral Nutrition (ON). We recognize that the oxidative stress associated with PN not only comes from the peroxides that contaminate the intravenous solution but also from the stress intrinsically induced by the fixation of a jugular vein catheter. We have previously reported a lack of difference between the ON group and the sham group (animals with a knotted catheter, and nourished orally) on hepatic oxidative stress Reference Morrison, Botting and Darby22 . This practice is in accordance with the principle of refinement of animal use in research. The purpose of adding glutathione to PN is to reduce the oxidative stress induced by peroxides.
Guinea pigs were previously proposed as a model to study the developmental origins of health and disease Reference Morrison, Botting and Darby22 . Each week, four Hartley male guinea pigs born at term and 3 days old were received from Charles River Laboratories (St-Constant, QC, Canada). The animals, housed under standard conditions in a 12/12 h light/dark cycle, were randomly assigned to the following four groups (13–15 animals per group):
-
PN: parenterally infused by a catheter inserted into the jugular vein on the third day of life. As previously described Reference Chessex, Lavoie and Rouleau17,Reference Elremaly, Mohamed, Rouleau and Lavoie20,Reference Elremaly, Mohamed, Rouleau and Lavoie23 , the PN solutions were administered via two syringes connected by a Y-tube and delivered at a flow rate of 0.4 ml/h each (total flow rate of 0.8 ml/h). One solution consisted of 2% (w/v) amino acids (Primene 10%; Baxter, Mississauga, ON, Canada), 8.7% (w/v) dextrose, 2% (v/v) multivitamin preparation (Multi-12 pediatric; Sandoz, Montreal, QC, Canada), and 1 U/ml heparin. The other solution contained amino acids and dextrose at the same amounts and the lipid emulsion at 3.1% (w/v) (Intralipid 20%; Pharmacia Upjohn, Baie d’Urfé, QC, Canada).
-
PN + 6 µM and PN+12 µM: PN was enriched with GSSG at 6 or 12 µM. It was demonstrated previously that intravenous GSSG reduced the oxidative stress caused by PN peroxides Reference Elremaly, Mohamed, Rouleau and Lavoie20 . Indeed, in plasma, both forms of glutathione (GSH and GSSG) have a similar affinity for γ-glutamyltranspeptidase Reference McIntyre and Curthoys24 , the first enzyme in the cascade leading to tissue enrichment in GSH Reference Elremaly, Mohamed, Rouleau and Lavoie20 . GSSG has a better stability (15% lost in 24 h) than GSH (half-life of 3 h) in PN.
-
ON: with ad libitum standard guinea pig food at all times (2041-Teklad Global High Fiber Guinea Pig Diet (2.4 kcal/g; 50% energy from carbohydrates; 18% from fat; and 32% from protein), Harlan, Montréal, QC, Canada).
Four days later, at the age of 1 week, half of the animals in each group were sacrificed, while the catheters of the other animals were knotted, and from then on, they were fed orally with standard guinea pig food until the age of 16 weeks. At these ages, 1 and 16 weeks, the animals were sacrificed by exsanguination under isoflurane anesthesia, after a 16 h night fast. The liver was flushed with NaCl 0.9%, removed, prepared, and stored at −80°C until biochemical determinations.
All procedures were in accordance with the Canadian Council on Animal Care guidelines, and the study protocol was approved by the Institutional Animal Care Committee of the CHU Sainte-Justine Research Centre (protocol #672).
Biochemical assessments
GSH and GSSG
Five hundred mg of freshly collected liver were homogenized in five volumes of 5% (w/v) metaphosphoric acid and centrifuged at 7200 g/3 min; the supernatant and the pellet were stored at −80°C. The GSH and GSSG species in supernatants were separated in a P/ACE MDQ Capillary Electrophoresis System (Beckman Coulter, Mississauga, ON, Canada) and quantified by absorbance at 200 nm, as previously described Reference Maghdessian, Côté, Rouleau, Ouadda, Levy and Lavoie18,Reference Turcot, Rouleau and Tsopmo25 . Total proteins were measured in pellets by the Bradford method using albumin for the standard curve, as previously described Reference Bradford26 . Data are expressed in nmol/mg protein but also in proportion of oxidized glutathione on total glutathione, GSSG being counted as 2 GSH (2 x GSSG/[2 x GSSG + GSH]).
GCK activity
Five hundred mg of liver were thawed on ice and homogenized at 4°C with tissue tearor (Biospec Products, Bartlesville, OK, USA) in two volumes of buffer (100 mM Tris-HCl pH 7.5, 5 mM EDTA-Na2, 5 mM MgCl2, 150 mM KCl, and 10 mM 2-mercaptoethanol) and centrifuged at 1400 g/20 min/4°C. The assay was performed on the supernatant as previously described Reference Xu, Zhang, Li, Xu and Shen27 in the presence of 0.5 mM ATP, 0.4 mM oxidized form of nicotinamide adenine dinucleotide phosphate, 0.2U G6PDH/200 µg protein, and 0.5 mM or 100 mM of glucose added to the buffer 100 mM Tris-HCl pH 7.5 +, 5 mM MgCl2 during 1 h at 30°C. The generated reduced form of nicotinamide adenine dinucleotide phosphate (NADPH) was measured in a spectrophotometer at 340 nm. The activity at 0.5 mM glucose (hexokinase) was subtracted from that at 100 mM (hexokinase + GCK). Data are expressed as U (nmol of NADPH ·min−1·mg of protein−1).
PFK activity
Tissues were thawed on ice and homogenized by the method proposed by Hamer and Dickson Reference Hamer and Dickson28 and assayed as described by Karadsheh Reference Karadsheh, Uyeda and Oliver29 without dithiothreitol in reaction buffer. Briefly, the enzyme reaction was coupled with that of aldolase, triose phosphate isomerase, and GAPDH, and the consumption of reduced form of nicotinamide adenine dinucleotide was measured in a spectrophotometer at 340 nm during 12 min at ambient temperature. Data are expressed as U (nmol of oxidized form of nicotinamide adenine dinucleotide · min−1 · of protein −1).
ACC activity
After thawing, ACC was extracted by precipitation with increasing concentrations of polyethylene-glycol-8000, as described by Kudo Reference Kudo, Barr, Barr, Desai and Lopaschuk30 . Twenty-five µg of protein from the suspension were pre-incubated in reaction buffer (60 mM Tris-Acetate pH 7.5, 1 mg/ml BSA, 1.3 µM 2-mercaptoethanol, 2 mM ATP, 1 mM acetyl-CoA, 5 mM Mg(CH3COO)2) for 20 min at 37°C. The reaction was started by the addition of 1.64 mM NaH[14C]O3 (1.35 µCi of 5 mCi/mmol) and 16.6 mM of NaHCO3 and was stopped by the addition of perchloric acid and samples centrifugation at 1100 g/20 min. The incorporation of 14C into malonyl-CoA in the supernatant was measured using a scintillation counter (HIDEX, Turku, Finland). Data are expressed as U (nmol of malonyl-CoA · min−1 · mg of protein−1).
GCK and PFK western blot
GCK and PFK were blotted as previously described. The primary antibodies were GCK (mouse anti-human GCK polyclonal antibody, Abnova Corporation, Taipei, Taiwan) or PFK (mouse anti-human PFK-1 monoclonal antibody, Santa Cruz Biotechnology, Santa Cruz, CA, USA) at 1:1000 dilution. Membranes were subsequently incubated with anti-mouse IgG-HRP antibody (1:2500 dilution) (R&D Systems, Minneapolis, MN, USA). Blots were revealed by chemiluminescence (Supersignal West Pico, Thermo Fisher Scientific, Waltham, MA, USA) in an imaging system (G: BOX, Synoptics, Cambridge, UK), and densitometry was analyzed using ImageJ (National Institutes of Health, Bethesda, MD, USA). Vinculin was used as a control protein (mouse anti-human VCL monoclonal antibody, Abnova Corporation, Taipei, Taiwan). Data are expressed as the ratio of density of the target protein to vinculin density. All gels contained samples from all groups. However, the bands from the ON group on the images presented were cut and transferred to the left of the same image to match the graphical representation. There was no statistical difference between groups for vinculin density.
Western Blot of ACC and ACC-P [Ser79]
Tissue was homogenized as previously described Reference Maghdessian, Côté, Rouleau, Ouadda, Levy and Lavoie18 . The supernatant (30 µg of protein) in Laemmli’s buffer Reference Laemmli31 was resolved in sodium dodecyl sulphate-polyacrylamide gel electrophoresis (4%/6%) 170 V/70 min/4°C and transferred to a polyvinylidene fluoride membrane 100V/70 min. Membranes were blocked with skim milk in phosphate-buffered saline-Tween-20 and subsequently incubated with primary antibodies: ACC (rabbit anti-human ACC-1 polyclonal antibody, Cell Signaling Technology, Danvers, MA, USA) or ACC-P (rabbit anti-human phospho-ACC-P-Ser79 polyclonal antibody, Millipore, Burlington, MA, USA) at 1:1000 dilution. Then, membranes were incubated with a secondary antibody (anti-rabbit IgG-HRP conjugate, Promega, Madison, WI, USA) at 1:2500 dilution. Vinculin was used as a loading control and images were taken and analyzed as described above. Because of the limited amount of tissue for 1-week-old animals, ACC-P blotting was only performed in 16-week-old animals. ACC-P levels are reported as the ratio between ACC-P and ACC.
Plasma triacylglycerols
Plasma was obtained by centrifugation of whole blood on K3-EDTA (7200 g/4 min). Triacylglycerol (TAG) levels were measured by a Triglyceride Colorimetric Assay Kit (Cayman Chemical Company, Ann Arbor, MI, USA). Data are expressed as millimolar concentrations.
NADPH
Ten milligrams of liver were homogenized in a glass potter tube with 20 µl of KOH 50 mM. Next, 120 µl of methanol, 30 µl of chloroform, and 90 µl of water were added, interspersed with vigorous agitation. Samples were then centrifuged (7200 g/5 min), the upper layer was used for NADPH determination, and protein was measured in the middle protein disk by the Bradford method Reference Bradford26 . NADPH was then measured in a buffer (Tris-HCl 50 mM, pH 7.6, EDTA-Na2 0.1 mM, L-Serine 10 mM, sodium borate 20 mM) with the addition of GSSG 5 mM and DTNB 6 mM in a 96-well plate. Twenty microliters were added to 160 µl of buffer and absorbance at 412 nm was measured. The addition of 4 µL of GSSG-reductase (final concentration of 13 µg protein/µl) initiated the reaction of NADPH consumption. The absorbance at 412 nm after 10 min of reaction was subtracted from the one before the addition and extrapolated through a standard curve of NADPH. The increase in density is directly proportional to the concentration of NADPH in the medium. Data are expressed as nmol of NADPH/mg of protein.
Oil red stain
Livers were sectioned into five slides of 5 µm, each separated by at least 150 µm into the liver block, in order to obtain sections at different depths. Slides were stained with Oil Red and Hematoxylin from Oil Red O Stain Kit (ab150678) (Abcam Plc, ON, Canada) as described previously Reference Morin, Guiraut, Perez Marcogliese, Mohamed and Lavoie21 . Briefly, liver sections were placed in 10% formalin, rinsed with distilled water, 100% propylene glycol, oil red, 85% propylene glycol, rinsed in distilled water, placed in hematoxylin, and rinsed in running water then distilled water. Slides were photographed under a 20× magnification in the microscope. Images were split into CMYK channels, and cyan images (nuclei) were subtracted from magenta images (lipid droplets and nuclei), in order to detect lipids in the images. The subtracted images were then transformed into grayscale, and an intensity threshold of black (22–255 for 1-week animals and 28–255 to 16-week animals) was applied to separate nonspecific detection of lipid droplets. Thresholds were adjusted according to age in order to avoid nonspecific detection caused by the high staining intensity in livers of 16-week-old animals. Particles with size between 0 and 600 µm2 and with any circularity were detected. Results are shown in squared micrometers per field (field total area = 275 702 µm2). No within-subject statistical differences were observed among the five liver sections analyzed following Friedman’s Analysis of Varance (ANOVA) (p = 0.74).
Glucose Tolerance Test
One week before sacrifice, adult animals were submitted to a glucose tolerance test after 16 h of fasting. Animals had their ear capillaries punctured for fasting glucose concentrations. Then, an intraperitoneal injection of 2 ml/kg of a 50% w/v solution of glucose was performed, and blood was collected every 30 min, until 2 h 30 min after injection. The blood was analyzed with a glucometer (Contour next glucometer; Bayer, Mississauga, Canada), and data are reported in mM.
Insulin
Plasma was obtained by centrifugation of whole blood on K3-EDTA (7200 g/4 min). Insulin concentrations were measured by a competitive ELISA kit (Guinea Pig Insulin ELISA kit; LSBio LifeSpan BioSciences, Inc.; Seattle, USA). Data are reported in ng of insulin/µl of plasma. Homeostatic model assessment for insulin resistance (HOMA-IR) was calculated with insulin and fasting glucose concentrations.
Statistics
All data are presented as mean ± S.E.M. Data from the four groups in both ages were orthogonally compared by ANOVA or factorial ANOVA. These comparisons are represented in the figures by bars uniting the concerned groups. In case of significant interaction with the age of animals, the comparisons were made according to age. To respect homoscedasticity, tested by Bartlett’s Chi2, mathematical transformation (square root) was used for the GSH, GSSG, GCK activity, NADPH, plasma TAG, and liver lipids values. Pearson’s linear correlation was used to quantify the relationship between the logarithmic value of ACC activity or the ratio of the protein level of ACC-P to ACC and the level of GSSG. The significance threshold was set at p≤ 0.05.
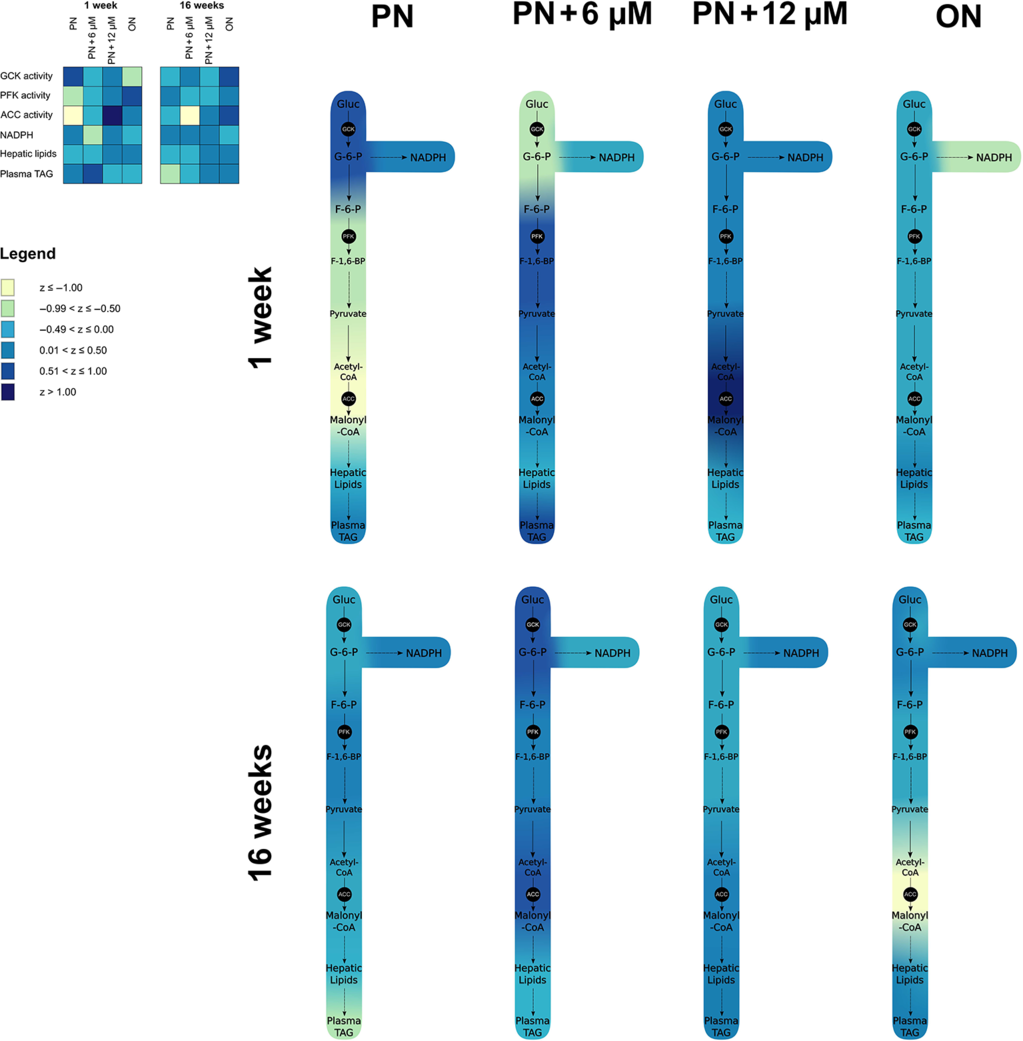
For global appreciation of glucose flow and how it is affected by PN and glutathione supplementation, values from enzyme activity (GCK, PFK, and ACC), NADPH, liver lipids, and plasma triglycerides were transformed into a Z-score. The pooled mean and standard deviation of all animals (both ages and groups) were used. This resulted in a range of Z-scores from −1.16 to +1.09. Mean Z-scores were calculated for each group of each age and then categorized into six intervals of 0.5 SD each. A color ranging from yellow to blue was assigned to each interval. When put together, each color generated a heat map that was used to create a colored metabolic pathway.
Results
Initially, 66 animals were used for the study, 18 as controls and 48 as PN groups. Five animals in PN groups deceased from complications of the catheter insertion surgery (2 in PN, 2 in PN + 6 µM, and 1 in PN + 12 µM). At 3 d of life, animals had mean body weight of 108 ± 2 g (n = 61). At 1 week of life, after PN infusion, the percentage change of body weight from day 3 was significant for the control group (+18 ± 3%, p < 0.01) and the PN group (−4 ± 1%, p < 0.01), but was not significant in the PN + 6 µM (−0.2 ± 2%) and PN + 12 µM (+3 ± 2%) groups, meaning glutathione supplementation was able to reduce the usual weight loss observed even in clinical situation in the first week of infusion. This weight loss has already been observed in animal models of PN. Between weeks 2 and 9 (Fig. 1), body weight was lighter in the PN groups compared to the ON group (F(1,24) > 6.97, p < 0.05). However, the mean growth rate (62 ± 2 g/week) was not statistically different between the groups during this period (F(1,24) < 0.94). Although the difference in body weight disappeared between the 10th and 16th weeks, the mean growth rate was higher in the PN groups than in the ON group (36 ± 2 vs. 30 ± 3 g/week; F(1,24) = 4.13; p = 0.05). At 1 week, liver weight, relative to body weight, did not differ among groups (3.4 ± 0.1%). Body weight and relative liver weight were not statistically different among 16-week-old groups (784 ± 12 g and 2.8 ± 0.04%, respectively).

Fig. 1. Body weight evolution of Hartley guinea pigs during 16 weeks of study. There was no difference between the PN and PN + GSSG groups. From week 2 to week 9, body weight was lighter in the PN groups compared to the ON group. This difference was not significant from the 10th week. Data are reported as mean ± S.E.M. per week. PN: parenteral nutrition received during the first week of life (dark blue line); PN + 6 µM: PN enriched with 6 µM glutathione (green line); PN + 12 µM: PN enriched with 12 µM glutathione (light blue line); Oral Nutrition (ON): animals fed with regular food for guinea pigs (red line). *: p < 0.05; **: p < 0.01; ***: p < 0.001.
Glutathione
Fig. 2a shows results for GSH. There was no interaction between groups and ages (F(3,50) = 1.95) or between groups (F(1,50) < 0.84). The levels were higher in animals aged 16 weeks compared to those of 1 week (F(1,50) = 40.1, p < 0.0001). However, the interaction between groups and ages was significant (F(3,53) = 8.56, p < 0.001) for GSSG (Fig. 2b), meaning that the pattern observed at 1 week is not maintained at 16 weeks. In fact, for 1-week animals, there was no difference in GSSG levels between ON animals and those receiving PN + glutathione (6 or 12 µM) (F(1,53) < 0.1), while they were lower than those of the PN group (F(1,53) = 11.79, p < 0.001). In 16-week-old animals, there was no difference in GSSG levels between the three PN groups (with or without glutathione) (F(1,51) < 1.30), they were lower than the value measured in the ON group (F(1,51) = 20.52, p < 0.0001). The proportion of oxidized glutathione (Fig. 2c) followed the same changes that for GSSG values. Indeed, there was a significant interaction (F(3,51) = 5.95, p < 0.001) between groups and ages. At 1 week, there was no difference in proportions of oxidized glutathione between ON animals and those receiving PN + glutathione (F(1,51) < 0.23), while they were lower than those of the PN group (F(1,51) = 9.96, p < 0.01). In 16-week-old animals, there was no difference between the three PN groups (F(1,51) < 0.87), the proportions of oxidized glutathione were lower than the value measured in the ON group (F(1,51) = 4.3, p < 0.001).

Fig. 2. Hepatic levels of GSH, GSSG, and proportion of oxidized glutathione measured at 1 and 16 weeks of life of animals. Panel A: There was no significant interaction between age and modes of nutrition on GSH nor between modes of nutrition. However, GSH was higher (p < 0.0001) at 16 weeks (blue bars). Panel B: There was a significant (p < 0.001) interaction between age and modes of nutrition on GSSG. At 1 week (green bars), the highest GSSG level was in the PN group (p < 0.01) while it was in ON group at 16 weeks (p < 0.0001). Panel C: There was a significant (p < 0.001) interaction between age and modes of nutrition for the proportion of oxidized glutathione. At 1 week (green bars), the highest proportion of oxidized glutathione was in the PN group (p < 0.01) while it was in ON group at 16 weeks (p < 0.001). Data are reported as mean ± S.E.M. PN: parenteral nutrition received during the first week of life; PN + 6 µM: PN enriched with 6 µM glutathione; PN + 12 µM: PN enriched with 12 µM glutathione; Oral Nutrition (ON): animals fed with regular food for guinea pigs. Green bars: 1-week animals; blue bars: 16 weeks animals; **: p < 0.01; ***: p < 0.001; NS: statistically non-significant.
Glucokinase
An interaction was significant between ages and groups (F(3,49) = .04, p < 0.001) on GCK activity (Fig. 3a). Immediately after PN infusion, at 1 week of age, a statistically significant difference between the PN + 6 µM GSSG and PN + 12 µM GSSG groups (F(1,49) = 10.3, p < 0.002) was found. However, they did not differ from the ON group (F(1,49) = 0.33). The overall activity of these three groups was lower than that observed in the PN group (F(1,49) = 6.14, p < 0.02). At 16 weeks, early life PN decreased GCK activity in PN group (F(1,49) = 4.95, p < 0.03). Overall, adding glutathione to PN was able to restore GCK activity because the two PN + GSSG groups were not different from the ON group (F(1,49) = 0.08).

Fig. 3. Hepatic activity and protein levels of glucokinase (GCK) measured at 1 and 16 weeks of life of animals. Panel A: There was a significant (p < 0.001) interaction between age and modes of nutrition for GCK activity. At 1 week (green bars), the highest GCK activity was in the PN group (p < 0.05) while it was the lowest at 16 weeks (p < 0.05). Panel B: There was no significant interaction between age and modes of nutrition for protein levels of GCK. The highest level was in the ON group (p < 0.01). The bands from the ON group on the image were cut and transferred to the left of the same image to match the graphic underneath, even though they are part of the same membrane. Data are reported as mean ± S.E.M. PN: parenteral nutrition received during the first week of life; PN + 6 µM: PN enriched with 6 µM glutathione; PN + 12 µM: PN enriched with 12 µM glutathione; Oral Nutrition (ON): animals fed with regular food for guinea pigs. Green bars: 1-week animals; blue bars: 16 weeks animals. *: p < 0.05; **: p < 0.01.
There was no significant interaction (F(3,51) = 1.29) between age and groups relatively to GCK protein levels (Fig. 3b). There was a significant difference between PN + 6 µM GSSG and PN + 12 µM GSSG groups (F(1,51) = 7.23, p < 0.01), but GCK protein levels did not differ from the PN group (F(1,51) = 0.50). The protein levels were higher in ON group compared to all PN groups (F(1,51) = 5.90, p < 0.01). There was no difference between the young and older animals (F(1,51) = 0.73).
Phosphofructokinase
The statistical analysis showed a significant (F(1,49) = 4.37, p < 0.05) interaction between ages and groups on PFK activity (Fig. 4a). At 1 week, the activity was lowest in the PN group (F(1,49) = 7.46, p < 0.01) because the values were similar between the PN + GSSG groups and the ON group (F(1,49) < 3.76). At 16 weeks, differences between groups did not reach the statistical significance (F(1,49) < 2.21).

Fig. 4. Hepatic activity and protein levels of phosphofructokinase (PFK) measured at 1 and 16 weeks of life of animals. Panel A: There was a significant interaction between age and modes of nutrition for PFK activity (p < 0.05). At 1 week (green bars), activities were similar between the PN + GSSG groups and the ON group. Their overall value was greater than the measured value of the PN group. Panel B: There was no significant interaction between age and modes of nutrition for protein levels of PFK. The protein level was higher at 16 weeks of age (p < 0.01). Among modes of nutrition, the highest level was in the ON group (p < 0.01). The bands from the ON group on the image were cut and transferred to the left of the same image to match the graphic underneath, even though they are part of the same membrane. Data are reported as mean ± S.E.M. PN: parenteral nutrition received during the first week of life; PN + 6 µM: PN enriched with 6 µM glutathione; PN + 12 µM: PN enriched with 12 µM glutathione; Oral Nutrition (ON): animals fed with regular food for guinea pigs. Green bars: 1-week animals; Blue bars: 16 weeks animals. *: p < 0.05; **: p < 0.01; NS: statistically non-significant.
There was no interaction for protein levels of PFK (Fig. 4b) between parameters (F(3,53) = 0.72). The levels were similar between the three PN groups (F(1,53) < 0.4), lower than levels measured in orally fed group (F(1,53) = 9.74, p < 0.003). The relative PFK protein levels were higher at 16 weeks of age compared to 1 week (F(1,53) = 19.6, p < 0.0001).
Acetyl-CoA carboxylase
The impact of early PN on ACC activity (Fig. 5a) differed depending on the time of analysis, immediately after PN (at 1 week) or at 16 weeks. The same effect was also found for GCK. Indeed, the interaction was significant (F(3,49) = 7.34, p < 0.0005). At 1 week, the ACC activity was higher in the 12 µM GSSG group compared to the 6 µM GSSG group (F(1,49) = 8.69, p < 0.005), both higher than the activity observed in the ON group (F(1,49) = 4.72, p < 0.05), all were higher than the activity measured in the PN group (F(1,49) = 35.5, p < 0.0001). At 16 weeks, there was no difference between all three PN groups (F(1,49) <3.23), regardless of glutathione supplementation. All three groups had higher ACC activities than those measured in the ON group (F(1,49) = 11.19, p < 0.005).

Fig. 5. Hepatic activity and protein levels of acetyl-CoA carboxylase (ACC) measured at 1 and 16 weeks of life of animals and phosphorylation of ACC in Ser79 measured at 16 weeks of life of animals. Panel A: There was a significant (p < 0.001) interaction between age and modes of nutrition for ACC activity. At 1 week, the lowest activity was in the PN group (p < 0.001). At 16 weeks, the ACC activity was the lowest in the ON group (p < 0.01). Panel B: There was a significant (p < 0.05) interaction between age and modes of nutrition for protein levels of ACC. At 1 week, the highest level of protein was in the ON group (p < 0.05). At 16 weeks, the ACC protein level was the lowest in the PN group (p < 0.01). The bands from the ON group on the image were cut and transferred to the left of the same image to match the graphic underneath, even though they are part of the same membrane. This was done for the graphics in panel C. Panel C: The ratio of phosphorylated ACC on total ACC protein was the highest in the ON group (p < 0.05). Data are reported as mean ± S.E.M. PN: parenteral nutrition received during the first week of life; PN + 6 µM: PN enriched with 6 µM glutathione; PN + 12 µM: PN enriched with 12 µM glutathione; Oral Nutrition (ON): animals fed with regular food for guinea pigs. Green bars: 1-week animals; blue bars: 16 weeks animals; *: p < 0.05; **: p < 0.01; ***: p < 0.001.
Significant negative correlations were found between the activity of ACC and GSSG level (ACC: y = −2.41 ln (GSSG nmol · mg of protein−1) + 4.64; r 2 = 0.33, p < 0.001). This correlation analysis included all data from 1 and 16 weeks animals (Fig. 6a). Similarly, phosphorylation of ACC in Ser79 was positively correlated with GSSG (ACC-P[Ser79]/ACC: y = 0.65 · (GSSG nmol · mg of protein−1) + 0.71; r 2 = 0.20, p < 0.05) (Fig. 6b).

Fig. 6. Linear relationship between ACC activity and phosphorylation of ACC in Ser79 with GSSG level. Panel A: The negative relationships between ACC activity and hepatic GSSG, including all data collected at 1 and 16 weeks, were significant (y = −2.41 · ln (GSSG nmol · mg of protein−1) + 4.64; r 2 = 0.33; p < 0.001). Panel B: The positive relationships between the ratio ACC-P[Sr79]/ACC and hepatic GSSG were significant y = 0.65 · (GSSG nmol · mg of protein−1) + 0.71; r 2 = 0.20, p < 0.05). ACC: Acetyl-CoA Carboxylase-1; GSSG: disulfide form of glutathione. U: nmol·min−1·mg of protein−1.
Similarly, the interaction was significant (F(3,53) = 3.05, p < 0.05) for the protein levels of ACC between ages and groups (Fig. 5b). At 1 week of age, there was no difference between all three PN groups (F(1,53) < 1.61). PN groups had lower ACC protein levels than ON group (F(1,53) = 5.19, p < 0.05). At 16 weeks, there was no difference between ON group and the PN + 6 µM or PN + 12 µM groups (F(1,53) < 2.65); overall, they were higher than the measured activity in PN group (F(1,53) = 4.80, p < 0.05).
At 16 weeks, the ratio of phosphorylated ACC on total ACC protein (Fig. 5c) was not different neither between PN + 6 µM and PN + 12 µM (F(1,24) = 0.40) nor between PN + glutathione and PN (F(1,24) = 0.31). However, it was decreased in all three PN groups, compared to ON group (F(1,24) = 6.69, p < 0.05).
NADPH
An increase in NADPH levels in 1-week animals receiving PN (with or without glutathione), relatively to ON, was observed (F(1,48) = 4.55, p < 0.05). No differences were observed in 16-week animals (Fig. 7d).

Fig. 7. Liver lipids, plasma triacylglycerol, and liver NADPH concentrations measured at 1 and 16 weeks of life of animals. Panel A: Representative images of Oil Red (lipid droplets) and Hematoxylin (nuclei) staining by group. Panel B: At 1 week, the surface area of lipid droplets was larger (p < 0.05) in the PN group compared to the PN + GSSG groups and the ON group, which had a similar value. There was no difference between the groups at 16 weeks. Panel C: At 1 week, plasma concentration of triacylglycerol was lower (p < 0.05) in the PN groups compared to the ON group. At 16 weeks, there was no difference. Panel D: Liver NADPH levels were increased (p < 0.05) in the PN group at 1 week of life. No differences were found at 16 weeks. Data are reported as mean ± S.E.M. PN: parenteral nutrition received during the first week of life; PN + 6 µM: PN enriched with 6 µM glutathione; PN + 12 µM: PN enriched with 12 µM glutathione; Oral Nutrition (ON): animals fed with regular food for guinea pigs. Green bars: 1-week animals; blue bars: 16 weeks animals; *: p < 0.05; NS: statistically non-significant.
Liver lipids
Due to the difference in staining intensity and pattern of hepatic lipids between 1 and 16 weeks, ANOVA was performed separately for each age. At 1 week, there was no difference in the histological areas stained with red oil (µm2)/field between the PN + GSSG groups and the ON group (F(1,24) = 1.47). However, the areas were 60% higher in the PN group (F(1,24) = 6.92, p < 0.05). Even if the areas stained with red oil were five times greater at 16 weeks compared to the areas measured at 1 week, there was no difference between these groups (F(1,24) < 2.66) (Fig. 7a and 7b).
Plasma Triacylglycerol
Similar to the staining of lipids, plasma TAG was analyzed by ANOVA performed separately for each age. At 1 week of life, no difference was observed among groups receiving PN, regardless of glutathione supplementation (F(1,24) < 0.07). Plasma TAG was 25% lower for all three PN groups, compared to ON group (F(1,24) = 4.39, p < 0.05). At 16 weeks, no comparison reached the statistical significance (F(1,24) <3.66) (Fig. 7c).
Insulin glucose, Glucose Tolerance Test, and HOMA-IR
No differences were observed for fasting plasma glucose at 16 weeks (5.4 ± 0.2 mM; F(1,24) < 1.12). At 1 week, the level of insulin, measured in a small number of animals (n = 3–4/group), was higher (F(1,10) = 24.6, p < 0.001) in the PN ± GSSG groups (2.45 ± 0.12 ng/ml plasma) compared with ON group (1.67 ± 0.17 ng/ml plasma). There was no difference (F(1,24) < 1.13) between groups at 16 weeks (2.22 ± 0.11 ng/ml plasma). Areas under the curve (AUC) following Glucose Tolerance Test (GTT) were not significantly different among groups (NP: 2194 ± 85; NP + 6 µM: 1879 ± 144; NP + 12 µM: 2324 ± 111; ON: 1988 ± 122 relative units; F(1,20) < 2.85). Similarly, HOMA-IR values were not statistically different (NP: 16 ± 1.2; NP + 6 µM: 15 ± 0.9; NP + 12 µM: 13 ± 0.7; ON: 15 ± 2.4 relative units; F(1,23) < 0.53).
Discussion
The study supports the hypothesis that PN received early in life would have a long-term impact on the energy metabolism. Depending on the key enzymes studied, causal agents were different. GCK activity appears to be affected by peroxides contaminating PN, with glutathione supplementation preventing the impact of PN. ACC activity appears to be independent of peroxides, since glutathione supplementation did not prevent the impact of PN. Long-term PFK activity was not influenced by PN or PN enriched with glutathione. The specificity of the reprogramming of GCK activity by peroxides was also highlighted by the lack of relationship with hepatic GSSG levels, in contrast to ACC activity. Although early exposure to peroxides influenced the short-term levels of liver GSSG, the long-term level of GSSG depended on the PN received during the first week of life and not on early exposure to peroxides.
Significant interactions between ages (at 1 week – immediately after infusion of PN – and at 16 weeks − 15 weeks after cessation of PN) and the modes of nutrition (PN and ON) suggest that the impact of PN components, including peroxides, has different targets according to the age. It was not surprising to observe a change in glutathione and enzymatic activities during PN infusion (increased GSSG, increased GCK activity, decreased PFK, decreased ACC activity). A direct impact of PN components was expected. The PN imprint on metabolic flow observed 15 weeks after the end of the infusion suggests that its components also interact with the epigenetic metabolism, which leads to a reprogramming of the metabolism. These interactions with the epigenetic process should be the subject of future studies.
Glutathione supplementation prevented the in situ glutathione oxidation observed in the PN group compared to the ON group, as evidenced by the lower GSSG and proportion of oxidized glutathione, suggesting better detoxification of peroxides. The data are consistent with previously reported results in the lungs of this animal model with a 10 µM glutathione supplement in PN Reference Elremaly, Mohamed, Rouleau and Lavoie20 . Glutathione supplementation also prevented metabolic changes induced by early PN, measured immediately after PN at 1 week of life (GCK, PFK, and ACC) and 15 weeks after cessation of PN for GCK activity.
Enzyme activity may depend on its level of protein. Immediately after PN, the relative (to vinculin) protein levels for each enzyme measured in all PN (±GSSG) groups were lower than that observed in the ON group. The lack of effect of the glutathione supplementation suggests that the divergence was not related to PN-induced oxidative stress, but could be explained by the difference in nutrition mode or by other factors intrinsically related to PN. Fifteen weeks after cessation of PN, the protein levels of the three enzymes remained lower in the PN group compared to the ON group, also suggesting a reprogramming of the metabolism leading to their gene expression. However, the inconsistency between enzymatic activities and their protein levels strongly suggests that a difference in protein expression is not enough to explain the changes in enzymatic activity. These changes could be induced by other regulating mechanisms.
The results show a significant correlation between ACC activity and liver GSSG values, the higher the GSSG, the lower the activity. Therefore, a structural modification of the enzymes, or their regulatory mechanism, following disulfide bond formation was suspected. The activity of the carboxyltransferase part of the enzyme depends on the redox status of a sensitive thiol Reference Blanchard and Waldrop32 . On the other hand, the significant and positive correlation between ACC-P [Ser79] levels and GSSG values in the liver suggests that early PN has to reprogram the mechanism for regulating ACC activity such as the tandem AMPK and PP2A. The activity of PP2A depends on the redox status of two critical cysteinyl residues whose oxidation is associated with the inhibition of its activity Reference Rao and Clayton33 . Thus, in a reductive environment such as that present in the PN groups (GSSG lower than in the ON group), PP2A can be expected to be more active, allowing a lower level of ACC-P and greater ACC activity.
The activity of GCK depends on the availability of glucose. During PN administration, glucose infusion was constant at 19.3 mmol/h. The higher insulin level in the PN groups compared to the ON group suggests higher glucose supply in these groups. However, for a similar supply of intravenous glucose, animals receiving glutathione supplementation had a lower GCK activity, thereby eliminating the possibility that these results are due to a difference in circulating glucose. The low activity of GCK observed 15 weeks later could be explained by lower blood glucose as previously reported as a long-term consequence of an early PN in guinea pigs Reference Kleiber, Chessex, Rouleau, Nuyt, Perreault and Lavoie34 . However, here, there was no significant difference between groups for blood glucose and insulin level in these fasted animals. On the other hand, GCK activity is also dependent on the redox status of thiol groups close to the active site Reference Tippett and Neet35,Reference Tiedge, Richter and Lenzen36 , whose oxidation is associated with an inhibition Reference Tippett and Neet35 . Peroxides induce the oxidation of the thiol function of cysteinyl residues in proteins into sulfenic acid Reference Winterbourn37 or induce the oxidation of GSH into GSSG through glutathione peroxidases. GSSG participates in the formation of the disulfide bond between two cysteinyl residues or between a cysteinyl residue and glutathione Reference Gilbert38,Reference Brigelius, Muckel, Akerboom and Sies39 , also modifying the activity of the protein. PFK is inhibited this way Reference Knafo, Chessex, Rouleau and Lavoie40 . However, contrary to what was expected, the study reports a greater activity in an oxidative condition at 1 week and lower activity in a reductive environment at 16 weeks of age. These changes in GCK activity in PN group, relatively to ON group, were prevented by the glutathione supplement, both at 1 and 16 weeks. However, the lack of correlation with hepatic GSSG confirmed the absence of redox influence on GCK activity. Therefore, other factor than blood glucose level or redox status is suspected to influence the programming of GCK activity; this PN-related factor is absent or ineffective in animals supplemented with glutathione. This change in GCK activity could be related to its association with lipid accumulation as already been reported by RM O’Doherty et al. Reference O’Doherty, Lehman, Telemaque-Potts and Newgard41 using overexpression of GCK in rats.
Compared to the ON group, hepatic GSSG was higher immediately after PN infusion and lower 15 weeks later. Glutathione supplementation prevented the increase of hepatic GSSG at 1 week, suggesting that peroxides infused with the PN favor GSSG production. At 16 weeks, the low level of GSSG observed in the PN groups was not influenced by the supplementation, suggesting the involvement of another PN-related factor, different from peroxides. If the long-term changes were caused by epigenetic modification, this could result from a loss of vitamin C in the PN groups Reference Knafo, Chessex, Rouleau and Lavoie40,Reference Lavoie, Chessex, Rouleau, Migneault and Comte42 , which leads to a lower hepatic concentration of ascorbate Reference Lavoie, Chessex, Rouleau, Tsopmo and Friel43 , this vitamin being essential to DNA demethylation Reference Blaschke, Ebata and Karimi44,Reference Yin, Mao and Zhao45 .
Thus, the metabolic flow of glucose (Fig. 8) differs according to the mode of nutrition, PN, or ON. During PN, the higher GCK and lower PFK activity could favor the accumulation of glucose-6-phosphate, which can be used as a substrate for the glycogen synthesis pathway or the pentose phosphate pathway generating NADPH. We chose to measure NADPH since it is involved in the redox state of the cells. The higher level of NADPH in the PN group confirms this accumulation, which was prevented by the glutathione supplement. The addition of GSSG in PN also prevented modification in GCK and PFK activity. In vivo, these enzymes are not saturated with the substrate. Thus, the increased availability of glucose-6-phosphate could lead to a greater glycolysis, with, ultimately, a greater availability of substrate for ACC, which could also lead to a higher lipid content in the liver, as observed histologically. However, the decrease in PFK activity observed in PN group at 1 week of life could limit this flow. In a previous study using the same animal model, PN-induced hepatic steatosis was associated with the presence of the multivitamin preparation in PN Reference Chessex, Lavoie and Rouleau17 , which, in the absence of photo-protection, leads to generation of peroxides Reference Lavoie, Chessex, Rouleau, Tsopmo and Friel43 . Taking into account the lower level of plasma triacylglycerol in the PN group, this steatosis could be explained, at least in part, by a defect in lipid release by the liver. In utero, the energy metabolism favors accumulation of lipids Reference Nau, Van Natta and Ralphe46,Reference Duee, Pegorier and El Manoubi47 . After birth, a transition occurs toward a greater utilization of lipids to generate energy. Therefore, the fatty liver phenotype present at birth disappears within a few days or weeks, depending on the species Reference Bohmer, Havel and Long48–Reference Du Bois52 . In the light of the present results, we can hypothesize that the peroxides contaminating the PN reduce the translocation of hepatic fatty acids to the mitochondria, limiting the production of ATP. Fifteen weeks after the end of PN, the pattern of metabolic flow was reversed in animals that received early PN. GCK activity was lower, and ACC activity was higher than activities measured in the ON group, with no significant change in PFK activity. With increased ACC activity, one would expect to observe a change in the deposit of lipid in the liver or plasma. There was an accumulation of lipids in both compartments depending on age. Compared to 1 week, histology performed at 16 weeks revealed five times more lipids per surface area in the liver, and plasma containing 2–3 times more triacylglycerol. The lack of difference between the ON and PN groups could be explained by a lower GCK activity combined with a greater ACC activity in the PN groups. This observation occurred at a specific time in the animal’s life, here at 16 weeks. These values may not be representative of the current metabolic change. Indeed, as shown in Fig. 1, from the 10th week of life, the growth rate is 20% higher in the PN groups than in the ON group, thus compensating for the growth retardation observed during the first 10 weeks of life. It would have been interesting to have additional data from older animals to better assess the biological relevance of this trend. In fact, the clinical importance of this permanent change in the metabolic flow of glucose induced by PN could be further demonstrated by a diet rich in sugar and over a longer lifespan, a study to be undertaken.

Fig. 8. Metabolic flow of glucose in animals of 1 and 16 weeks. Values were transformed into Z-scores, and their means were color coded according to defined intervals (see Method section). These colors were then used to illustrate the metabolic changes in a simplified metabolic pathway of glucose in liver. PN: parenteral nutrition received during the first week of life; PN + 6 µM: PN enriched with 6 µM glutathione; PN + 12 µM: PN enriched with 12 µM glutathione; Oral Nutrition (ON): animals fed with regular food for guinea pigs.
The association between PN and lower body weight is known in guinea pigs Reference Morin, Guiraut, Perez Marcogliese, Mohamed and Lavoie21,Reference Lu, Redmond, Baggs, Schecter and Gasiewicz53 as well as in infants Reference Ahmad, Nemet and Eliakim54 . This effect of PN seems independent of the subsequent growth rate because it is similar between the ON and PN groups. However, the increase in growth rate observed since the 10th week of life in the PN groups suggests a significant change in metabolism. Several hypotheses can be raised, for example, to name one, the sexual maturity of male guinea pigs which can occur in their second or third month of life. The cause(s) of this growth change, at this specific time in life, should be the subject of further studies.
Relationships between extreme prematurity and clinical outcomes, such as glucose intolerance, non-alcoholic fatty liver disease, and cardiovascular health later in life, are increasingly being reported Reference Nuyt, Lavoie, Mohamed, Paquette and Luu55 . Their metabolic explanations are more difficult. Because PN received by all these newborns is contaminated with peroxides Reference Lavoie, Bélanger, Spalinger and Chessex7,Reference Helbock, Motchnik and Ames56 , we have suspected the impact of this mode of nutrition. Thus, our study separated PN from prematurity. The results confirm that, as currently administered, PN could explain some of the reported relationships between extreme prematurity and the metabolic health of prematurely born adults. Indeed, the early administration of a conventional PN-induced change in the metabolic flow of glucose as observed for 15 weeks after the end of the PN. In 1-week-old ON animals, the metabolic flow from glucose to lipids is characterized by (1) a relatively low GCK activity (5 ± 1 U), limiting the availability of the substrate for glycolysis and (2) a high ACC activity (9.6 ± 0.4 U), promoting lipid synthesis. At 16 weeks of age, the flow is characterized by (1) a high GCK activity (14 ± 2 U) and (2) a low ACC activity (3.2 ± 0.2 U), suggesting that the intermediate molecules from glycolysis are used in other metabolic pathways, such as the Krebs cycle. Differently from ON animals, animals on PN showed (1) a GCK activity twice as high at 1 week of life (11 ± 3 U), which remained similar until 16 weeks (9 ± 4 U) and (2) a ACC activity 30% lower (6.9 ± 0.3 U) at 1 week, further decreasing by 35% up to 16 weeks (4.5 ± 0.3 U). This observation suggests that, during the first week of age, PN favored a certain maturation of the metabolic flow of glucose, which, however, remains immature at 16 weeks compared to ON animals. These modifications observed with PN have been corrected at least in part by glutathione supplementation, suggesting a role for the peroxides contaminating PN. Compared to ON animals, at 16 weeks, the lower GCK activity and the higher ACC activity in PN animals suggest a metabolic disturbance that could affect blood glucose and lipid metabolism, which an unfavorable environment could reveal.
Too few studies aim to elucidate the long-term impact of neonatal nutrition, especially PN, over metabolic outcomes during adulthood. Other studies have yet to confirm our conclusions and further clarify the mechanisms involved. It has been suggested that the long-term impact on metabolism or diseases such as stress-related asthma at the start of life or low birth weight may differ according to the sex of the newborn Reference Rosa, Lee and Wright57,Reference Metrustry, Karhunen and Edwards58 . In addition, the antioxidant capacity of newborns, in particular of premature infants, is known to be sex-specific, i.e., lower in males Reference Lavoie and Tremblay59,Reference Lavoie and Chessex60 . This is why we previously recommended an antioxidant nutritional strategy based on sex for newborns during their PN Reference Lavoie and Tremblay59 . The aim of the study was to demonstrate an impact of neonatal exposure to peroxides contaminating PN on long-term metabolism in animals. This objective was achieved by using only male guinea pigs while satisfying the animal ethic committee in terms of the reduction of animals used in research. However, estrogens are able to increase antioxidant defenses Reference Lavoie and Tremblay59 as the estrogen receptor is able to bind to and induce the expression of genes involved in antioxidant defenses. Given that oxidative stress seems to be the major driver of the metabolic perturbations we observe in our model, these results may be different in female animals. Further studies that include both sexes are necessary.
In studying the long-term metabolic impact of extreme prematurity, in addition to sex, two main factors could be active: prematurity or low body weight at birth and PN or oxidative stress induced by this mode of nutrition. The impact of this prematurity cannot be studied separately from PN. However, it is possible to isolate the effect of PN, as achieved in this study. Thus, our results may not be a true reflection of the situation of an extremely premature infant who receives a PN. However, our results suggest the importance of reducing the oxidative stress induced by PN received by these infants. Our study already proposes to enrich the PN solutions with GSSG as a measure that can partially prevent the long-term impact of early neonatal exposure to PN. It can only be a first step in the neonatal PN improvement practices.
Acknowledgments
The authors acknowledge the technical work of Thérèse Rouleau and Guillaume Morin, who performed the catheterization and sacrifice of animals, respectively.
Financial Support
This work was supported by a grant from the Canadian Institutes of Health Research (PJT-148522).
Conflicts of Interest
None.