


Introduction
Cardiovascular disease (CVD) is the biggest cause of death in the West, accounting for about 35% of all deaths in the United Kingdom.Reference Allender, Peto, Scarborough, Kaur and Rayner1 Low birth weight and thinness at birth, which can originate in utero as a result of inadequate nutrition, have been associated with later coronary heart disease,Reference Barker and Osmond2–Reference Barker, Osmond, Simmonds and Wield4 type 2 diabetes and related conditions (e.g. hypertension).Reference Barker, Osmond, Golding, Kuh and Wadsworth5, Reference Hales, Barker and Clark6 In adults who were in utero at the time of the Dutch Winter Famine (an abrupt-onset 5-month period of malnutrition from 1944 to 1945), exposure during early gestation was associated with increased incidence of coronary heart disease,Reference Roseboom, van der Meulen and Osmond7 whereas exposure to famine in mid-gestation was associated with microalbinuria in adults, possibly indicative of hyperfiltration injury as a result of having fewer nephrons.Reference Painter, Roseboom and van Montfrans8 Hypertension has been linked to impaired kidney development, and a decrease in nephron number may mediate the effects of poor in utero nutrition on later cardiovascular dysfunction.Reference Mackenzie and Brenner9 In humans, reduced glomerular number and increased glomerular size in adults and children have been associated with low birth weight.Reference Hughson, Farris, Douglas-Denton, Hoy and Bertram10 Thinner mothers have fetuses with sausage-shaped kidneys,Reference Mukherjee, Hanson, Crozier, Inskip and Godfrey11 which is suggestive of reduced nephron number and has previously been associated with hypertension.Reference Raman, Clark, Campbell, Watkins and Osmond12
Recently, we demonstrated that a 50% reduction in maternal nutrition for the first 31 days of gestation (dGA; peri-implantation) resulted in cardiac hypertrophy and altered cardiovascular function in adult sheep.Reference Cleal, Poore and Boullin13 Interestingly, this coincides with a period of gestation when a single dose of the synthetic glucocorticoid dexamethasone led to hypertension and decreased nephron number in adult sheep.Reference Wintour, Moritz and Johnson14 Late gestation nutrient restriction has been found to increase blood pressure and responsiveness to increasing doses of angiotensin II (Ang II) in singleton fetuses.Reference Edwards and McMillen15 In rats, a gestational proteinReference Langley-Evans, Welham and Jackson16 or globalReference Lucas, Costa, Miraglia and Zaladek17 restricted diet reduced kidney size, impaired nephron development and altered cardiovascular control in adult offspring. The timing of intrauterine nutrient restriction is likely to be critical in inducing this effect, as even early gestation nutrient restriction affects cardiovascular function in rodent offspring.Reference Bertram, Khan and Ohri18–Reference Watkins, Wilkins and Cunningham20 However, to date this has not been tested in relation to renal development and function during fetal life. Thus, the aim of the present study was to investigate in sheep, the relative effects on cardiovascular control and renal development/function in late gestation singleton fetuses of maternal undernutrition in the peri-implantation (spanning the key early stages of kidney development of giant glomerulus, mesonephros and metanephros formationReference Wintour, Alcorn and Albiston21) and in late gestation (in a phase of rapid fetal growth coinciding with the final phase of nephrogenesis) developmental windows. Sheep, like humans, develop the full complement of glomeruli prenatally,Reference Brace, Hanson and Rodeck22 and no significant nephrogenesis occurs after 120 dGA (term 145 days).Reference Gimonet, Bussieres and Medjebeur23 The intensity of the undernutrition challenges was based on previous sheep experimentsReference Edwards and McMillen24–Reference Gardner, Pearce and Dandrea26 and the modest effects of the 50% peri-implantation challenge intensity led us to increase its intensity in year 2.
Methods
All procedures were carried out with the approval of the local ethics board and in accordance with the UK Animals (Scientific Procedures) Act, 1986.
Animals and study design
Two studies were performed over two sheep-breeding seasons on singleton fetuses, as confirmed by a mid-gestation ultrasound scan. In both studies, Welsh Mountain ewes from a single supplier, of uniform body condition score [BCS (2.0–3.0) units, based on a 5-point scale]Reference Russel27 and age, were randomized to control or diet-restricted groups, housed individually on wheat straw and fed a complete pelleted diet with free access to water [89.2% dry matter as fed providing 10.7 MJ/kg dry matter (metabolizable energy) and 14.8% protein] from −16 dGA (provision adjusted to gestational age).28 As measured in study 2, animals acclimatized to the consumption of their full ration after 4–5 days. Oestrous was synchronized by withdrawal of a vaginal medoxyprogesterone acetate impregnated sponge (Veramix, Upjohn Ltd, Crawley, UK) at −2 dGA, 14 days after insertion. One of two twin rams (randomly assigned) was introduced for 2 days, and 0 dGA was taken as the first day that an obvious raddle mark was observed. At −16, −2, 29, 70, 104 and 111 dGA, ewes were weighed and BCS was scored. Maternal blood samples [36 ml (∼1% blood volume) onto chilled ethylenediaminetetraacetic acid (EDTA) tubes]Reference Rumball, Van, Rutland, Bloomfield and Harding29 were taken from the jugular vein at 29 dGA.
In study 1, control animals (C1, n = 9, two male fetuses, seven female fetuses) were fed 100% of their nutrient requirements. Peri-implantation nutrient-restricted animals (PI50, n = 10, five male fetuses, five female fetuses) were fed 50% of their nutrient requirements from 1 to 31 dGA, and 100% at all other times (Fig. 1). In study 2, control animals (C2, n = 9, five male fetuses, four female fetuses) were fed 100% of their nutrient requirements. Peri-implantation nutrient-restricted animals (PI40, n = 9, five male fetuses, four female fetuses) were fed 40% of their nutrient requirements from 1 to 31 dGA, and 100% at all other times. Late gestation nutrient-restricted animals (L, n = 6, four male, two female) were fed 50% of their nutrient requirements from 104 dGA until postmortem at 127 dGA, and 100% at all other times (Fig. 1). During the period of peri-implantation restriction, the change between −2 and 29 dGA in maternal weight (C1 v. PI50, 0.6 ± 0.4 v. −0.9 ± 0.4 kg, P < 0.05; C2 v. PI40, 2.4 ± 0.8 v. −0.4 ± 0.4 kg, P < 0.01) and BCS (C1 v. PI50, 0.00 ± 0.00 v. −0.03 ± 0.04 units (not significant); C2 v. PI40, 0.08 ± 0.08 v. −0.28 ± 0.07 units, P < 0.05) was significantly different in PI groups compared with their control groups.

Fig. 1 Plan of studies to show timing of maternal dietary restrictions (filled grey bars), surgery, experiments and postmortems in days (d) gestational age (where term is 147 d) for studies 1 and 2. C1 and C2, control groups; PI50 and PI40, peri-implantation restriction to 50% and 40% control, respectively; and L, late gestation restricted.
Surgical preparation and care
At approximately 117 dGA, anaesthesia was induced with 1 g thiopental sodium BP i.v. (10 ml, 0.1 g/ml, Link Pharmaceuticals, UK) and maintained with 2% halothane (Concord Pharmaceuticals Laboratory Ltd, UK) in O2 (1 l/min). Saline-filled polyvinyl catheters (Portex Ltd, Hythe, UK) were inserted into the fetal carotid and femoral artery, femoral vein, trachea, amniotic cavity and bladder, and the maternal jugular veins. Ultrasonic flow probes (Transonic Systems Inc., Ithaca, NY, USA) were placed around the uncatheterized carotid and femoral arteries, and stainless-steel electrodes were placed on the parietal cortex for fetal electrocorticogram (ECoG) recording. Uterine and abdominal incisions were closed and catheters were exteriorized. The vascular catheters were heparinized (fetal, 50 U/ml; ewe, 100 U/ml heparin, Leo Laboratories Ltd, Princes Risborough, UK in 0.9% NaCl saline).
At surgery, antibiotics were administered to the: 1) ewe – oxytetracycline hydrochloride (Terramycin, Pfizer, Eastleigh, Northants, UK) topically to incision sites; 150 mg/kg amoxicillin i.m. (Betamox Norbrook Laboratories Ltd, UK); 600 mg Crystapen i.v. (Britannia Pharmaceuticals Ltd, Redhill, Surrey, UK); 40 mg Gentamicin i.v. (Mayne Pharmaceuticals Plc, Royal Leamington Spa, Warickshire, UK); 2) fetus – 300 mg Crystapen i.v.; and 3) amniotic cavity – 300 mg Crystapen and 40 mg Gentamicin. Gentamicin doses were repeated on post-operative days 1 and 2, and half doses of Crystapen were administered daily for 4–5 post-operative days. Vascular and amniotic catheters were flushed daily with heparinized saline, and vascular catheters were kept patent with a continuous infusion (fetal, 0.01 ml/h; ewe, 1 ml/h). During the 5-day post-operative recovery period, there was no difference in the proportion of food refused (as a fraction of ration offered) between control and peri-implantation groups in studies 1 or 2 (C1, 0.57 ± 0.06; PI50, 0.54 ± 0.07; C2, 0.47 ± 0.07; PI40, 0.48 ± 0.04). In study 2, the proportion of food refused in the post-operative recovery period was significantly greater in both control and peri-implantation groups compared with the late restriction group (L, 0.19 ± 0.04 v. C2, P < 0.01 and PI40, P < 0.001).
Fetal monitoring
Fetal carotid artery, amniotic and tracheal pressures (Capto AS, N-3193, Horten, Norway/NL 108, Digitimer Ltd, Welwyn Garden City, Herts, UK), ECoG (NL 100/104/125), and carotid and femoral arterial blood flow (TS420, Transonic Systems Inc., Ithaca, USA) data were captured (sampling rate 100 samples per second during the phenylephrine challenge and at 40 samples per second at all other times, Maclab/8, ADInstruments Pty Ltd, Castle Hill, Australia) and recorded (Chart, ADInstruments, Chalgrove, Oxon, UK).
Experimental procedures
Following at least 5 days of recovery from surgery, fetuses were studied on 2 consecutive days between 123 and 126 dGA. Cardiovascular variables, and tracheal pressure and ECoG activity (indices of fetal breathing and behavioural state) were measured continuously during baseline and in response to a number of challenges (experimental order was not randomized).
Ang II challenge
Increasing bolus i.v. doses of Ang II (0, 1, 2.5, 5 and 10 μg, Sigma-Aldrich Co, UK, dissolved in 2 ml sterile saline) were administered during high-voltage ECoG activity, with at least 30 min recovery period between each dose to allow cardiovascular variables to return to baseline.
Frusemide challenge
Cardiovascular variables were measured continuously before (1 h) and after (90 min) a bolus of frusemide (20 mg in 2 ml, Phoenix, Pharmacia, UK) or saline vehicle to the fetus (i.v.). Fetal urine was collected over 30 min intervals throughout the protocol. Fetal blood (0.25 ml) was collected at −45, 15, 45 and 75 min for nutrient and metabolite analysis with a blood gas analyser (ABL735, Radiometer Limited, Crawley, UK), and at intervals (7 ml at −45 min, 2 ml at 45 min and 6 ml at 45 and 75 min) for hormone measurement into chilled EDTA and lithium heparin (Lhep) tubes.
Phenylephrine challenge
Sheep were administered a bolus (75 μg i.v., in 2 ml of saline) of the α-adrenergic agonist phenylephrine (Sovereign Medical, Essex, UK), and cardiovascular variables were monitored until they returned to baseline.
Hypoxia challenge
In study 2 only, fetal oxygenation was altered by manipulation of maternal-inspired medical air, N2 and CO2.Reference Giussani, Spencer, Moore, Bennet and Hanson30 A 30 min normoxia control period (44 l/min air) was followed by 30 min fetal hypoxia (arterial partial pressure of oxygen [PaO2] to ∼13 mmHg) by reducing maternal-inspired oxygen faction (inspirate, 14 l/min air, 22 l/min N2, 1.2 l/min CO2), and a 30 min normoxia recovery period (44 l/min air). Fetal cardiovascular parameters were measured continuously throughout the protocol. Fetal urine was collected over 30 min intervals throughout the protocol. Fetal urinary sodium (Na+) and fetal blood (0.25 ml, at −15, 5, 15, 30, 60 and 90 min) nutrients and metabolites were analysed with a blood gas analyser (ABL735, Radiometer Limited, Crawley, UK). Additional fetal blood was collected at intervals into chilled EDTA and Lhep tubes (6 ml at −15, 30 and 60 min, 3 ml at 15 min) for hormone measurement.
Plasma hormone analysis
All blood samples were centrifuged for 10 min at 3000 rpm and plasma aliquots were stored at −80°C.
Cortisol (single measurement) was determined in 10 μl plasma by a solid-phase, competitive chemiluminescent enzyme immunoassay [DPC Immulite analyser (LKC05), DPC Ltd, Gwynedd, UK]. The lower limit of the assay was 0.2 μg/dl and the interassay coefficient of variation was 8.2% at 3.0 μg/dl.
Adrenocorticotropin (ACTH; single measurement) was measured in 75 μl plasma using the automated DPC Immulite system with a sequential immunometric assay (LKAC5, DPC Ltd, Gwynedd, UK). The lower limit of the assay was 9 pg/ml and the interassay coefficient of variation was 3.2% at 105 pg/ml.
Angiotensinogen was measured in duplicate in plasma (0.5 ml; P. Masters and F. Broughton Pipkin, University of Nottingham). Briefly, angiotensinogen concentration was determined in the presence of excess exogenous renin utilizing an indirect radioimmunoassay (RIA) method to measure angiotensin-I.Reference Tetlow and Broughton Pipkin31 The intra-assay coefficient of variation was 6.3%.
Plasma renin concentration was measured in duplicate in plasma (1.5 ml; P. Masters and F. Broughton Pipkin, University of Nottingham). Briefly, plasma renin concentration was determined in the presence of exogenous angiotensinogen using an indirect RIA for angiotensin production.Reference Tetlow and Broughton Pipkin32 The interassay coefficient of variation was 8.4%.
Angiotensin-converting enzyme (ACE) activity was measured in duplicate in plasma (25 μl) by an enzyme assay. The method was adapted fromReference Raimbach and Thomas33 and validated in both adult and fetal sheep (plasma and tissue) for plasma/extraction quality and incubation length.Reference Forhead, Gillespie and Fowden34 The intra- and interassay coefficients of variation were 15.7% and 14.7%, respectively.
Ang II levels were measured in duplicate in plasma (0.5 ml) using a commercially available RIA (Euria-angiotensin II, ImmunoDiagnostic Systems Ltd, Tyne and Wear, UK) following its separation from plasma proteins using chromatography columns (C18 sep-pak; Waters Corporation, Massachusetts, USA). The intra- and interassay coefficients of variation were 8.0% and 7.5%, respectively.
Creatinine was measured in duplicate in plasma (0.5 ml) and urine (0.5 ml) using a commercially available kit (Infinity™ Creatinine Liquid Stable reagent, Thermo Electron Corporation, Australia). Briefly, creatinine reacts with alkaline picrate in the reagent to produce a reddish-colour complex (Jaffe reaction)Reference Husdan and Rapoport35 in direct proportion to the creatinine concentration and is measured spectrophotometrically at 500 nm. The intra- and interassay coefficients of variation were 4.9% and 8.5%, respectively.
Osmolarity was measured in duplicate in urine (100 μl; Roebling Micro-Osmometer, Borolabs, UK). Briefly, the freezing point of urine is measured, and the reduction below that of pure water is a direct measure of the osmotic concentration. The intra- and interassay coefficients of variation were 5.3% and 7.4%, respectively.
Postmortem
General
Ewe and fetus were killed humanely with 40 ml i.v. pentobarbitone (200 mg/ml Pentoject, pentobarbitone sodium Ph. Eur, Animalcare Ltd, UK) at 127 dGA. Under sterile conditions, total conceptus weight and fetal biometry were recorded, and fetal organs/placental tissues were removed and weighed.
Kidney preparation
At postmortem, the left fetal renal artery was catheterized in situ (Portex translucent PVC tubing, I.D. 0.58 mm, O.D. 0.96 mm, Portex Ltd, UK). The kidney was removed and 1 ml heparin (5000 IU/ml, Leo Laboratories Ltd, UK) and then 1 ml papaverine hydrochloride (0.24 mg/ml, Sigma-Aldrich Co, UK) were injected into the renal artery. The kidney was perfused (at 50 mmHg) with 50 ml of heparinized saline (50 U/ml heparin, Leo Laboratories Ltd, Princes Risborough, UK in 0.9% NaCl saline) and then 50 ml of formalin (10% neutral buffered, Surgipath, UK). The perfused kidney was weighed and the length and width were measured before it was cut in half longitudinally. Both halves were immersion-fixed for 72 h in formalin and then transferred to 70% alcohol.
To estimate left kidney volume (Cavalieri PrincipleReference Douglas-Denton, Moritz, Bertram and Wintour36), both halves of the kidney were sliced into 5 mm sections transversally. Every section was viewed with a superimposed orthogonal grid, and grid points that overlaid kidney tissue were counted. Kidney volume (Vkid) was then estimated using the following equation: Vkid = taP s, where t is average section thickness (0.5 mm), a is the area associated with each grid point (0.25 mm2) and P s is the sum of grid points that overlaid kidney tissue.
For subsequent stereology, every other section of the kidney was selected with the starting slice selected at random from the first two. The medulla was removed from the selected slices, leaving a small portion behind to prevent damage to the cortex. The slice of cortex was cut into 5 × 5 × 2 mm blocks, and every 10th block was selected with the starting block selected at random from the first 10 (9–11 per animal). The selected blocks were dehydrated, embedded in glycol methacrylate (GMA; JB-4 embedding kit, Polysciences, Germany) and stored at −20°C.
Kidney Stereology
Half of the blocks embedded in GMA were randomly selected (∼5 per animal), trimmed and sectioned completely at 2 μm thickness with a rotary microtome (R. Jung, Heidelberg). Every 200th and 210th section was mounted, giving a disector counting depth of 20 μm (between sections) and 200 μm between pairs (13–24 per animal). The sections were stained with 1% Toluidine Blue in Borax (BHD, Poole, UK).
The number of glomeruli (as a representative of nephron number) in the cortex of the kidney was counted with the physical disector technique,Reference Wintour, Moritz and Johnson14, Reference Douglas-Denton, Moritz, Bertram and Wintour36–Reference Nyengaard and Benediktsson38 using a light microscope (Leica DMBL, Milton Keynes, UK; magnification ×10). Glomeruli were counted in four sampling fields per pair of sections using an unbiased counting frame. A camera lucida was used to image and record diagrammatically the position of glomeruli in both the sample section and look-up section of the disector. Glomerular profiles in the sample section were counted, but not in the look-up section.
The total glomerular number (n) was estimated using the following equation:
The number represents the inverse of each sampling fraction (1 out of 2 of the slices; 1 out of 10 of the blocks; 1 out of 200 of the sections). P S was the total area of the kidney sections, P F was the fraction of the section area used for counting glomeruli (2 indicates that counting was performed in both directions to double the counting efficiency) and Q − was the actual number of glomeruli counted. Approximately 150–400 glomeruli were counted for each kidney. The number of nephrons in one kidney was counted three times by one individual (blinded to experimental group) to obtain a coefficient of variation for intra-observer error of 4.5%.
Data analysis and statistics
Fetal ECoG state was assessed by visual discrimination of traces.Reference El-Haddad, Chao, Ma and Ross39, Reference Walker and Pratt40 All cardiovascular variables were averaged over one-minute periods for analysis. Carotid and femoral artery vascular resistance were calculated (arterial blood flow/mean arterial pressure).Reference Green, McGarrigle, Bennet and Hanson41
To calculate the baroreflex sensitivity, the time between two consecutive R waves in the electrocardiogram (R-R interval) is plotted against the preceding systolic blood pressure over the period when blood pressure is increasing. A linear regression is constructed and the slope is a measure of baroreflex sensitivity and is expressed in ms/mmHg. The operating point (equivalent to the EC50 in pharmacology) is the pressure value at which the half-maximal RR interval response is seen.
Glomerular filtration rate (GFR, ml/min) was calculated as urine creatinine (g/l) × (urine volume (ml/min)/plasma creatinine (g/l)).
Using SPSS (version 12.0, Chicago, IL, USA), variables including baseline measurements were compared between groups by Student's t-test (study 1) or one-way ANOVA and Bonferroni post-hoc tests where appropriate (study 2). Changes in variables over time in response to the challenges were analysed by repeated-measures two-way ANOVA with Bonferroni post-hoc tests (using dietary group as a between-subject factor).
The peak response (systolic, diastolic and mean arterial pressure, heart rate, carotid and femoral flow) to each Ang II dose was compared between the groups by repeated-measures two-way ANOVA and a Bonferroni post-hoc test where appropriate.
Significance was accepted when P < 0.05, and data are expressed as mean ± s.e.m.
Results
Fetal body and organ size
There was no significant difference in fetal body weight, in major organ weight (brain, heart, lung, liver – data not shown), nor in kidney weight and adrenal weight. Aside from a small increase in kidney width in PI50 compared to C1 groups, there were no other differences in kidney dimensions or kidney volume between the diet-restricted and the control groups in either study (Table 1). There was no significant difference between the dietary groups in glomeruli number (Study 2 – C2, 326,123 ± 40,845; PI40, 451,568 ± 104,816; L, 460,986 ± 88,033).
Table 1 Fetal biometry, and body and organ weights

Postmortem measurements at 127 dGA in C, control; PI, peri-implantation-restricted; L, late gestation-restricted fetuses.
Values are shown as mean ± s.e.m. and were analysed using Student's t-test (study 1) and one-way ANOVA and Bonferroni post hoc tests where appropriate (study 2). Bracketed numbers indicate n different to that given in the column heading. *P < 0.05 compared to C1, but there were no other differences between dietary groups in study 1 or 2.
Baseline measurements
In studies 1 and 2, there was no significant difference between dietary groups in baseline fetal arterial nutrients and metabolites (Tables 2 and 3), fetal arterial plasma ACTH or cortisol levels (Table 4), fetal cardiovascular control (Fig. 2), fetal renal function (Tables 4 and 5) and associated plasma hormone levels connected to the renin-angiontensin system [Table 5, and angiotensinogen (C1, 0.38 ± 0.07; PI50, 0.32 ± 0.09; C2, 0.35 ± 0.13; PI40, 0.43 ± 0.10; L, 0.32 ± 0.07 μg Ang I per ml), and ACE (C1, 22.16 ± 1.47; PI50, 20.72 ± 1.89; C2, 14.75 ± 0.65; PI40, 15.01 ± 0.93; L, 15.02 ± 0.68 nmoles/ml per min)].
Table 2 Baseline fetal blood nutrients and metabolites

C, control; PI, peri-implantation-restricted; L, late gestation-restricted fetuses. Values are baseline measurements taken before the frusemide challenge (study 1, 123 dGA; study 2, 125 dGA). Values are mean ± s.e.m. and were analysed using Student's t-test (study 1) and one-way ANOVA and Bonferroni post hoc tests where appropriate (study 2). There was no difference between dietary groups in study 1 or 2.
Table 3 Fetal blood nutrients and metabolites in response to hypoxia

In study 2, C2, control; PI40, peri-implantation-restricted and L, late gestation-restricted fetuses.
Values are mean ± s.e.m. Data were analysed by repeated-measures two-way ANOVA and a Bonferroni post hoc test where appropriate (using dietary group as a between-subject factor). *P < 0.05, **P < 0.01, ***P < 0.001 compared to value at −15 min. There was no difference between dietary groups.

Fig. 2 The fetal cardiovascular effects of frusemide (infusion onset at time 0 indicated by dotted line) in control (C1 and C2, open circle, both n = 9), peri-implantation-restricted (PI50/40, triangle, both n = 9) and late gestation-restricted (L, square, n = 6) groups. Values are mean ± s.e.m. Data were analysed by repeated-measures two-way ANOVA and a Bonferroni post hoc test where appropriate (using dietary group as a between-subject factor). *P < 0.05 significantly different from baseline (all animals together). There was no difference between dietary groups in study 1 or 2.
Table 4 The effect of hypoxia on fetal renal function and plasma hormones

ACTH, adrenocorticotropin.
In study 2, control (C2), peri-implantation-restricted (PI40) and late gestation-restricted (L) fetuses. Values are mean ± s.e.m. Bracketed numbers indicate n different to that given in the column heading. Data were analysed by repeated-measures two-way ANOVA and a Bonferroni post hoc test where appropriate (using dietary group as a between-subject factor). *P < 0.05, **P < 0.01 and ***P < 0.001 compared to value at −15 min. There was no difference between dietary groups.
Table 5 The effect of frusemide on fetal renal function and the renin-angiotensin system

C, control; PI, peri-implantation-restricted; L, late gestation-restricted fetuses; GFR, glomerular filtration rate; Ang II, angiotensin II. Values are mean ± s.e.m. Bracketed numbers indicate n different to that given in the column heading. For each study, data were analysed by repeated-measures two-way ANOVA and a Bonferroni post hoc test where appropriate (using dietary group as a between-subject factor). ∼P < 0.1 (trend), *P < 0.05, **P < 0.01 and ***P < 0.001 compared to value at −15 min. There was no difference between dietary groups in study 1 or 2.
Response to Ang II challenge
Fetal heart rate and femoral and carotid artery blood flow fell in response to Ang II administration to a similar extent in all dietary groups (maximum decrease from baseline in response to 10 μg Ang II: heart rate: C1, 55.92 ± 9.02; PI50, 58.86 ± 9.48; C2, 77.42 ± 8.77; PI40, 54.74 ± 9.20; L, 50.60 ± 9.39 BPM; carotid flow: C1, 14.46 ± 4.36; PI50, 15.62 ± 3.15; C2, 23.59 ± 6.30; PI40, 16.27 ± 10.39; L, 23.15 ± 6.97 ml/min; femoral flow: C1, 20.07 ± 2.87; PI50, 14.55 ± 3.15; C2, 25.15 ± 2.59; PI40, 19.91 ± 4.90; L, 17.02 ± 4.70 ml/min).
Fetal mean arterial pressure increased in response to Ang II. In study 1 only, the maximum mean arterial blood pressure response to doses >2.5 μg of Ang II were significantly blunted in peri-implantation (PI50)-restricted fetuses compared with control fetuses (P < 0.05; Fig. 3).
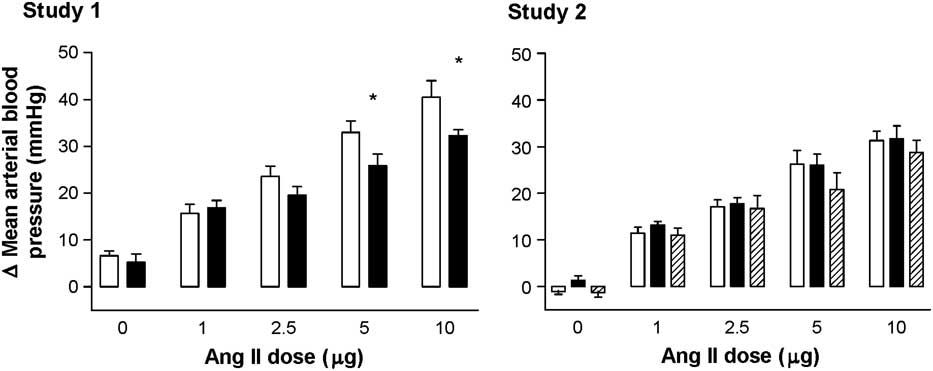
Fig. 3 The change in fetal mean arterial blood pressure from baseline in response to angiotensin II in control (C, open, n = 9), peri-implantation-restricted (PI50/40, filled, n = 10/9) and late gestation-restricted (L, hatched, n = 5) groups from studies 1 and 2. Values are mean ± s.e.m. Data were analysed by repeated-measures two-way ANOVA and a Bonferroni post hoc test where appropriate. *P < 0.05 compared to control values. In study 2, there was no difference between dietary groups.
Response to frusemide challenge
In all animals, following frusemide injection, there was an immediate (by 5 min, P < 0.05) decrease in femoral artery blood flow in both studies, and a slower (by 60 min, P < 0.05) increase in heart rate (study 2 only, Fig. 2). These effects were similar in both the diet-restricted and control fetuses. There was no effect of saline vehicle on cardiovascular parameters (data not shown).
Fetal GFR (Study 1: P < 0.1, Study 2: P < 0.01), urinary flow rate (P < 0.001), urinary Na+ (P < 0.001) and urine osmolarity (P < 0.01) increased following frusemide administration, to a similar extent in diet-restricted and control groups (Table 5).
Fetal plasma renin activity (P < 0.001) and Ang II levels (P < 0.001) increased following frusemide administration, to a similar extent in control and dietary restricted groups (Table 5).
Baroreflex response
After postmortem, the dose of phenylepherine was calculated per kg of fetus and there was no difference between the groups. There was no difference in the sensitivity (Study 1: C1, 0.008 ± 0.001; PI50, 0.011 ± 0.002, Study 2: C2, 0.008 ± 0.001; PI40, 0.007 ± 0.001; L, 0.008 ± 0.001 ms/mmHg) or operating point (C1, 75.94 ± 2.52; PI50, 70.95 ± 1.76; C2, 68.87 ± 4.43; PI40, 68.73 ± 3.43; L, 68.62 ± 4.21 mmHg) of the baroreflex between the dietary groups in either study 1 or 2.
Response to hypoxia challenge (study 2 only)
After 5 min of hypoxia, there were reductions in arterial pO2 (P < 0.001), pCO2 (at 5 min only, P < 0.05), base excess (P < 0.01) and bicarbonate (P < 0.001) levels. pH decreased (from 15 to 30 min, P < 0.001) and lactate levels increased (from 15 min, P < 0.001) during hypoxia (Table 3). These changes occurred to a similar extent in all dietary groups. Arterial haematocrit and haemoglobin were unaltered during hypoxia in all dietary groups.
In all animals, and as expected, hypoxia caused a decrease in heart rate (by 5 min, P < 0.05) and femoral flow (by 5 min, P < 0.05), and an increase in blood pressure (by 35 min, P < 0.05) and carotid blood flow (by 5 min, P < 0.05). Femoral artery vascular resistance increased (by 5 min, P < 0.05), but there was no significant change in carotid artery vascular resistance during hypoxia. There was no difference in these responses between the dietary groups (Fig. 4).

Fig. 4 The effect of hypoxia on fetal cardiovascular parameters in study 2 control (C, open circle, n = 7), peri-implantation-restricted (PI40, triangle, n = 8) and late-restricted (L, square, n = 4) groups. Shaded area denotes the 30-min period of hypoxia. Values are mean ± s.e.m. For each study, data were analysed by repeated-measures two-way ANOVA and a Bonferroni post hoc test where appropriate (using dietary group as a between-subject factor). *P < 0.05 significantly different from baseline (all animals together). There was no difference between dietary groups.
Urine flow rate did not change during hypoxia (Table 4). Urine osmolarity increased during hypoxia (P < 0.01), and increased further during recovery (P < 0.001) with an accompanying increase in urinary Na+ (P < 0.01). There was no difference in the renal function during hypoxia between the dietary groups.
Fetal plasma ACTH (P < 0.001) and cortisol (P < 0.001) levels increased during hypoxia and recovery (Table 4) to a similar extent in all dietary groups.
In all dietary groups, hypoxia had no effect on fetal plasma renin activity or Ang II levels. There was no significant difference between dietary groups in the fetal plasma renin activity or Ang II response to hypoxia (data not shown).
Discussion
Intrauterine nutrition is implicated in the risk of developing CVD in adulthood.Reference Godfrey and Barker42 Changes to the kidney and renin-angiotensin system (RAS) are key candidate underlying mechanisms, as disruption in kidney development and/or function predisposes an individual to hypertension and increased risk of later CVD. In this study, we found that early and late gestation maternal undernutrition had no effect on fetal weight, organ weight, kidney glomeruli number, basal cardiovascular or baroreflex function during late gestation, nor was there any effect on fetal RAS in terms of the cardiovascular or renal response to frusemide. However, peri-implantation nutrient restriction to 50%, but not to 40% of control, blunted the fetal blood pressure response to Ang II. There was no difference between groups in the cardiovascular or endocrine response to hypoxia.
Maternal undernutrition in the peri-implantation period did not affect basal cardiovascular function or baroreflex control in late gestation. Previous studies in rodents suggest that peri-implantation maternal nutrient restrictionReference Kwong, Wild, Roberts, Willis and Fleming19 or short-term embryo cultureReference Watkins, Platt and Papenbrock43 leads to raised postnatal blood pressure. Previously, we observed in sheep that a 50% peri-implantation maternal nutrient restriction resulted in cardiac hypertrophy, altered cardiovascular functionReference Cleal, Poore and Boullin13 and an increase in basal tone and sensitivity of the left internal thoracic artery to phenylephrineReference Khan, Torrens and Noakes44 in adult offspring. The lack of effect in the present study may reflect the early developmental stage (i.e. fetal) when cardiovascular control was assessed. Indeed, in sheep 15% of maternal undernutrition in the first half of pregnancy has been found to elevate blood pressure postnatally,Reference Gopalakrishnan, Gardner and Rhind45, Reference Hawkins, Steyn and McGarrigle46 but with no effectReference Hawkins, Steyn and McGarrigle46 or even a decreaseReference Hawkins, Steyn and Ozaki47 in blood pressure in late gestation. However, in the present study, peri-implantation maternal nutrient restriction of 50% blunted the fetal mean arterial pressure response to higher concentrations of Ang II, which may indicate altered Ang II receptor populations in the peripheral vasculature or centrally, but this was not assessed in the present study.
Maternal undernutrition in late gestation did not alter cardiovascular control or blood pressure responses to Ang II. This contrasts with previous work in which a 50% maternal nutrient restriction from 115 dGA onwards increased late gestation fetal blood pressure (115–125 and 135–145 dGA), and increased (115–125 dGA only) the late gestation fetal blood pressure response to Ang II associated with elevated maternal cortisol in Border-Leicester cross Merino ewes.Reference Edwards and McMillen15 The undernutrition in that study spanned a longer period of gestation than in the present study (115–145 dGA v. 104–127 dGA), but the observed rise in blood pressure is nonetheless hard to reconcile with our unaltered baseline blood pressure and unaltered response to hypoxia, aside from noting that the Welsh Mountain ewes used in our study are smaller (ca. 55 v. 50 kg), adapted to a harsh highland environment and may be relatively resilient to undernutrition. Although there were no obvious trends towards change in the data, it should be noted that there were fewer animals in this group compared with our other dietary groups. In addition, the greater refusal of dietary ration during the post-operative recovery period in the control and peri-implantation groups compared with the late gestation restriction group may have reduced the possibility of observing any effects of a late gestation restriction on cardiovascular parameters. Interestingly, the elevated maternal cortisol observed by Edwards and McMillenReference Edwards and McMillen15 soon after the onset of undernutrition, indicative of a maternal/fetal stress response, coincided with altered pressor responses to Ang II. We did not measure maternal cortisol, but did make our assessment of blood pressure response to Ang II towards the end (123–126 dGA) of our late gestation undernutrition challenge period and can only speculate that any potential initial maternal stress effects on the cardiovascular system following the onset of undernutrition might have already subsided. Late gestation maternal nutrient restriction had no effect on late gestation fetal responses to hypoxia, which, taken together with previous studies in which undernutrition for the first half of gestation did alter the response to hypoxia,Reference Hawkins, Steyn and Ozaki47 highlights that there are critical windows within which the mechanisms controlling cardiovascular control (e.g. chemoreflex and hormone factorsReference Green48) are adapted by in utero undernutrition.
In addition to having no effect on late gestation cardiovascular control, peri-implantation or late gestation undernutrition did not alter kidney size and nephron number, aside from a small but significant difference between C1 and PI50 in kidney width. However, it is of note that the same peri-implantation undernutrition led to altered cardiovascular control in adulthood.Reference Cleal, Poore and Boullin13 The lack of effect on blood pressure and kidney structure in the late gestation restricted group are consistent with previous studies in sheep fetuses exposed to prolonged hypoglycaemia during late gestation.Reference Boyce, Gibson and Wintour49 Previous studies of low-protein diet throughout gestation in rats have observed reduced kidney weight and reduced nephron number withReference McMullen, Gardner and Langley-Evans50, Reference Vehaskari, Aviles and Manning51 and withoutReference Merlet-Benichou, Gilbert, Muffat-Joly, Lelievre-Pegorier and Leroy52, Reference Woods and Rasch53 hypertension, or even with lower blood pressure,Reference Hoppe, Evans and Moritz54 in postnatal offspring. But the timing of physiological measurements in relation to the undernutrition challenge may be crucial. A 50% global nutrient restriction in the first half of gestation resulted in an ∼30% reduction in nephron number, but no change in blood pressure in offspring at 3 years,Reference Gopalakrishnan, Gardner and Dandrea55 compared with 11% reduction in nephron number and increased mean arterial pressure in offspring (majority of which were twins) at 8–9 months.Reference Gilbert, Lang, Grant and Nijland56 A single dose of the synthetic glucocorticoid, dexamethasone, at 26–28 dGA raised blood pressure and reduced nephron number in adult sheep.Reference Wintour, Moritz and Johnson57 Thus, the absence of an effect of peri-implantation undernutrition on fetal renal structure and function herein does not support a role for the kidney in mediating the altered postnatal cardiovascular phenotype previously reported.Reference Cleal, Poore and Boullin13 A key strength in the present study is the use of classic and robust stereological assessment of nephron number, but we cannot rule out the possibility of an impairment of nephron number later in gestation or even increased susceptibility to postnatal nephron loss/altered nephron sodium handling.
In conclusion, moderate reduction in maternal nutrition during the peri-implantation period and in late gestation, previously shown to be critical periods of development when undernutrition affects cardiovascular control in adult life, has no effect on fetal renal structure and function in late gestation. This does not support the assertion that reduced nephron endowment at birth is a mechanism linking a poor in utero nutrient environment to postnatal hypertension,Reference Brenner, Garcia and Anderson58 although this mechanism may apply to larger or longer challenges rather than those used here. The precise role of changes in renal development in relation to the Developmental Origins of Health and Disease hypothesis remains to be established unequivocally.
Acknowledgements
This work was funded by a Biotechnology and Biosciences Research Council project grant (D17858) to LRG and MAH. MAH is supported by The British Heart Foundation. We are grateful to John Thompson (Royal Veterinary College) for carrying out body condition score assessments; Dr P. M. Costello for assistance in surgery and experiments; Dr P. Masters and Prof F. Broughton Pipkin (University of Nottingham) for conducting the angiotensinogen and plasma renin assays; the staff at the Biological Services Unit (Royal Veterinary College) and the Biological Research Facility (University of Southampton) for expert animal care; and the staff at the Histochemistry Research Unit, Southampton General Hospital.


