Introduction
The fetal programming hypothesis proposes that an adverse intrauterine and early-life environment can shape the individual toward susceptibility to cardiometabolic diseases.Reference Godfrey, Gluckman and Hanson 1 This concept is supported by many studies that have shown that malnutrition, toxins, smoking and maternal diseases during pregnancy affect the birth weight of the offspring, resulting in an aberrant response of the cardiovascular and metabolic system in later life.Reference Mennitti, Oyama and Lopez de Oliveira 2 – Reference Werneck, Silva and Collings 5 Furthermore, the opposite situation of increased birth weight or macrosomia also contributes to metabolic programming and later-life morbidity, primarily via altered body composition at birth.Reference Leddy, Power and Schulkin 6 – Reference Reynolds, Pollack and Charnigo 8
Preeclampsia is a pregnancy-associated disorder, usually complicated with fetal growth restriction and affects 3–7%Reference Rajakumar, Michael and Rajakumar 9 of the population worldwide. It is diagnosed with hypertension and proteinuria and poses a major threat to the maternal and fetal health.Reference Odegard, Vatten, Nilsen, Salvesen and Austgulen 10 As a multifactorial disease, it is associated with several pathophysiological pathways including angiogenic imbalance with a predominance of soluble fms-like tyrosine kinase-1 (sFlt-1), which increased two- to five-fold in preeclamptic patients.Reference Rajakumar, Michael and Rajakumar 9 , Reference Hertig, Berkane and Lefevre 11 sFlt-1 serves as an antagonist to placental growth factor (PlGF) and vascular endothelial growth factor (VEGF), thus promoting hypovascularization, endothelial dysfunction and vasoconstriction in the mother with concomitant hypoxia.Reference Shibuya 12
Recent studies suggest that sFlt-1 may play a role in lipid and protein metabolism. The circulating plasma proteome of the dams exposed to sFlt-1 shows increased apolipoprotein fractions that are mediators of cholesterol esterification and removal of excess cholesterol from tissues.Reference Bytautiene, Bulayeva and Bhat 13 Moreover, the fatty acid availability is increased in sFlt-1-induced preeclampsia due to increased expression of fatty acid translocase in sFlt-1 overexpressing placental tissue.Reference Kuhnel, Kleff and Stojanovska 14 Additionally, it was reported that the liver X receptor and retinoid X receptor (LXR/RXR) pathway is upregulated in sFlt-1-induced preeclampsia which is a substantial pathway in the regulation of lipid metabolism and inflammation.Reference Bytautiene, Bulayeva and Bhat 13
Although increased concentrations of sFlt-1 contribute to the pathogenesis of preeclampsia and fetal growth restriction,Reference Maynard, Min and Merchan 15 the specific effects of sFlt-1 on the developing fetus are not well understood. With this study, we aimed to evaluate the following: (1) the effects of sFlt-1 on the fetal development, (2) effects on fetal liver gene expression and (3) whether prominent changes in gene expression are accompanied by changes in DNA methylation.
Materials and methods
Animals
All animals were housed and handled according to institutional guidelines following Dutch legislation. All experiments were approved by the Animal Ethics Committee of the University of Groningen. Female Sprague-Dawley (SD) rats of 10-weeks-old (Charles River, France) were housed in a light and temperature-controlled facility (lights on from 7:00 am to 7:00 pm, 21°C). Food and water were provided ad libitum. Vaginal smears were taken daily. When the females were in a pro-estrus phase of their cycle, they were housed with a male overnight. The following day, if spermatozoa were present in the vaginal smear, then it was considered day 0 of gestation. At day 8 of gestation, animals were randomly divided into two groups: control (n=6) and sFlt-1 (n=7), receiving either control Ad-null or adenovirus overexpressing sFlt-1 (Ad-sFlt-1), respectively. We distinguished either ultra-high (>1000 ng/ml) or very low (<1000 ng/ml) sFlt-1 plasma concentrations in our sFlt-1 group, and we continued the analysis with high (n=3) and low sFlt-1 (n=4) group of dams.
Amplification and purification of sFlt-1 and control adenovirus
Adenovirus vector stock of Ad-null (a kind of gift from U.J. Tietge, University Medical Center Groningen, the Netherlands) and Ad-sFlt-1 (a kind of gift from S.A. Karumanchi, Beth Israel Deaconess Medical Center, Boston, MA, USA) were used for adenoviral gene delivery. Viruses were amplified in HEK 293A cells at a multiplicity of infection of 10. Adenoviral purification was performed with a cesium chloride (CsCl) density gradient (d=1.45 and 1.20 g/ml). The clear thick adenoviral band was transferred to a DG column (Biorad, Temse, Belgium) for washing and elution. The titer of plaque-forming units (PFU) was analyzed with an enzyme-linked immunoassay that detects the adenoviral hexon (Adeasy viral titer kit, Agilent Technologies, Santa Clara, CA, USA), and 1×10¹² PFU of adenovirus expressing mouse sFlt-1 or the empty vector were injected via the tail vein on gestational day (GD) 8.
Blood pressure measurements
On GD19, the systemic blood pressure for all groups was assessed under anesthesia (100% O2, 0.8 ml/min, 5% isoflurane for induction followed by 2%) with the aortal catheter positioned in the abdominal aorta and connected with a bed-side monitor (Datex-Ohmeda, Cardiocap/5). Blood pressure measurement values were recorded 30 s after cannulation.
Analysis of blood and urine samples
On GD12, maternal blood was collected in ethylenediaminetetraacetic acid containing tubes via the tail vein. Within half an hour the blood was centrifuged for 20 min at 1000 rpm and the plasma was stored at −80°C until analysis. On GD19, animals were anesthetized with isoflurane inhalation and the abdominal cavity was opened. After blood pressure measurements, blood was collected via the abdominal aorta and centrifuged as stated above to collect plasma. Plasma was stored as stated earlier. Fetal blood was collected by nicking the left ventricle of the heart, while the fetuses were slightly tilted in order to keep the pooled blood in the thoracic cavity, and it was collected in heparin-coated capillary tubes (Vitrex Medical A/S, Herlev, Denmark). sFlt-1 concentrations in plasma were determined using a mouse sFlt-1 enzyme-linked immunosorbent assay kit (R&D Systems, Inc., Minneapolis, MN, USA). A total of 24 urine samples were collected by placing the pregnant dams in metabolic cages at GD16 and 17, and the protein levels were determined using Pierce method. The concentration of proteins (mg) per sample was multiplied by the 24-h urine volume.
RNA isolation
Total RNA was isolated from fetal livers collected on GD19 with allprep DNA/RNA mini kit (Qiagen, Venlo, the Netherlands), following the manufacturer’s protocol. RNA quality and quantity were assessed with Nanodrop 2000c (Thermo Scientific, Pittsburgh, PA, USA). RNA was immediately stored at −80°C until further analysis. RNA integrity was further verified on an Agilent 2100 bioanalyzer, using the Eukaryote total RNA nano assay according to manufacturer’s protocol (Agilent Technologies, Amsterdam, the Netherlands). Samples that had an RNA integrity number >9.0 and no RNA degradation products were considered acceptable for microarray hybridization.
Microarray hybridization and analysis
Total RNA isolated from fetal livers (five samples per group: control and high sFlt-1) was used for microarray analysis. Labeled cDNA was prepared from 100 ng RNA using the Ambion Whole Transcript Expression Kit (Life Technologies, Carlsbad, CA, USA) and Affymetrix GeneChip WT Terminal Labeling Kit (Affymetrix, Santa Clara, CA, USA). All samples were hybridized to Affymetrix GeneChip Mouse Gene 1.1 ST arrays according to standard Affymetrix protocols. Array images and normalization was performed with Bioconductor software packages (Lin 2011). Probes sets were assigned to unique gene identifiers (IDs) of the Entrez Gene database, resulting in 19.357 assigned Entrez IDs.
Bioinformatics analysis
The microarray covered 19.357 genes, and only the ones with an intensity value of >20 on at least three arrays and interquartile range (IQR) >0.2 on at least five probes per gene on the array were selected for further analysis. The top 1000 most variable genes were used for principal component analysis (PCA) using MultiExperiment Viewer version 4.8.4. Signal log2 ratios, which represent fold changes, and related significances of change were calculated from the mean intensities of the control and high sFlt-1 group using intensity-based moderated t statistics implementing Bayes correction.Reference Sartor, Tomlinson and Wesselkamper 16 Resulting log2 ratios and P-values were applied for further analysis of the data. Gene set enrichment analysis (GSEA) was used to relate the microarray data to networks of diseases and biological functions. Heat maps generation showing a comparison of gene expression patterns was done with MultiExperiment Viewer version 4.8.4.
Real-time quantitative polymerase chain reaction analysis
Of total RNA, 1 µg was used for cDNA conversion with reagents from Invitrogen (Invitrogen, USA), according to manufacturer’s recommendations. Real-time quantitative polymerase chain reaction (qPCR) was performed using PowerUp SYBR green master mix (Applied Biosystems, Foster City, CA, USA) on StepOnePlus real-time PCR system (Applied Biosystems) with the following settings: 20 s 95°C, 40 cycles at 95°C for 1 s and at 60°C for 20 s. Multiexon spanning PCR primers (sequences available at rtprimerdb.org) were designed with Primer Express Software (Applied Biosystems) and synthesized by Eurogentec (Seraing, Belgium). The average expression level of 36b4 and Gapdh was used as a housekeeping gene in all qPCR analysis and the ddCt method was used for quantification.
Genomic DNA isolation and pyrosequencing
Fetal livers were homogenized with a TissueLyser LT (Qiagen) for 1 min at 40 Hz. Genomic DNA was isolated using allprep DNA/RNA mini kit (Qiagen), following manufacturer’s protocol. DNA purity and concentration were validated on Nanodrop 2000c, while 500 ng of genomic DNA was used for bisulfite conversion with the EZ DNA methylation gold kit (Zymo Research, Leiden, the Netherlands) according to manufacturer’s protocol. Samples were stored at −20°C until analysis. With Pyromark Assay Design 2.0 software (Qiagen), bisulfite specific primers were designed for the rat Ppar alpha promoter region (forward: 5′-biotin-GAGGGTATTAGGTGGGAAGTTTTATTAG-3′; reverse: 5′-AACCTAAAAAACCCTAAACAATTCT-3′). Bisulfite-modified DNA of 20 ng were used for amplification with HotStarTaq master mix using the following steps: DNA polymerase activation (95°C for 15 min), three-step cycle of denaturation (94°C for 30 s), annealing (58°C for 1 min) and extension (72°C for 45 s) repeated for 45 cycles in a row. Finally, the last extension was carried out at 72°C for 7 min. The PCR product was analyzed using the sequencing primer: 5′-CTAAATAAAAAAACTACCCAAAAT-3′ and sequence-to-analyze: CACCCRACRA ACRAAACAAC CCTATAAAAA AAACRCRCCT AAACRAACRC RCCTTTCTAC TCCCAACCCC RCRCACCR, for the extent of methylation per selected CpG position by pyrosequencing using a Pyromark Q24 system and analysis software 2.0 (Qiagen). The level of DNA methylation is given as a percentage.
Statistical analysis
All data are presented as M±s.e.m. Differences between groups were calculated with an unpaired t-test (two groups) or one-way analysis of variance (ANOVA) (three groups). Comparison of multiple groups (DNA methylation analysis of different CpG positions) was analyzed by two-way ANOVA, followed by a Bonferroni post-hoc test. For all statistical tests, a P-value <0.05 was considered significant. All data were analyzed using GraphPad Prism 6.0 Software (GraphPad).
Results
Maternal characteristics upon sFlt-1 overexpression
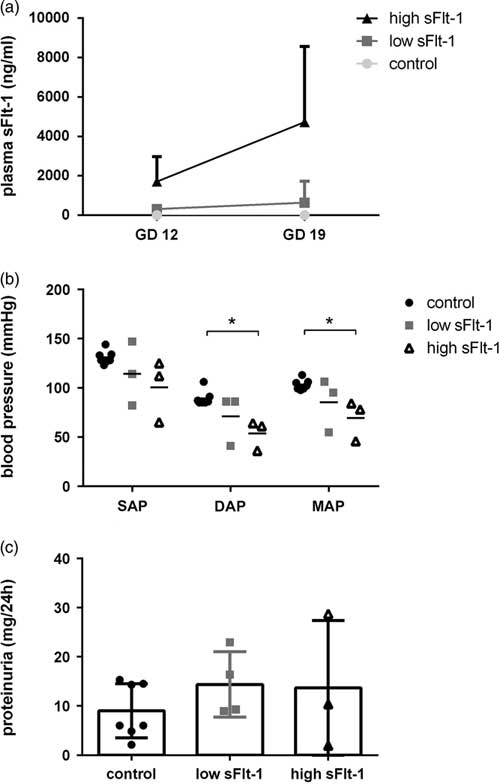
To validate our overexpression model, we measured sFlt-1 concentrations in plasma, 96 h post adenovirus injections (GD12) and at GD19. Surprisingly, plasma sFlt-1 concentrations in the overexpressed animals were not in the same range. As presented in Fig. 1a, some dams showed a moderate increase (n=4) of sFlt-1 concentrations in plasma (sFlt-1 at GD12: 310±109 ng/ml and at GD19: 640±624 ng/ml), whereas other dams (n=3) showed high sFlt-1 concentrations (at GD12: 1073±735 ng/ml; and at GD19: 4726±2215 ng/ml). In that way, we characterized two groups of dams with low and high sFlt-1 concentrations in addition to the control group, where the sFlt-1 concentrations at GD19 were almost zero (0.08±0.008 ng/ml). No statistical analysis was performed for the data presented in Fig. 1a, as the primary purpose was to show increase of sFlt-1 concentrations after sFlt-1 adenoviral overexpression. In addition, at GD19 the aortic blood pressure was assessed, and there were no significant differences between the control and low sFlt-1 group. In comparison, the high sFlt-1 group showed decreased diastolic and mean arterial pressure (Fig. 1b). Furthermore, excessive proteinuria was not present in any of the inspected groups (Fig. 1c).

Fig. 1 Overexpression of sFlt-1 in pregnant dams. (a) Plasma sFlt-1 concentrations in dams (n=3,4), (b) blood pressure values (*P<0.05, n=3,4), (c) protein levels in 24 h urine from pregnant dams (n=3,4).
Fetuses from dams that have high sFlt-1 concentrations are growth restricted
It has been reported that increased sFlt-1 concentrations in the mother can result in growth restriction of the fetus.Reference Maynard, Min and Merchan 15 In our study, fetuses that were exposed to high sFlt-1 concentrations were approximately 22% lighter and the length was reduced by 9% in comparison to controls. Also, the body proportionality, as expressed by the ponderal index (weight in grams/length in mm), was lower in the fetuses exposed to high sFlt-1 concentrations when compared to the fetuses exposed to low or no sFlt-1 (Fig. 2a–c). There were no differences between these parameters in the control and the low sFlt-1 group (Fig. 2).

Fig. 2 Fetal characterization. (a) Fetal body weight at GD19 (n=10), (b) fetal crown-rump length at GD19 (n=10), (c) fetal weight to length ponderal index (n=10). ***P<0.001.
Brain-sparing and increased sFlt-1 concentrations in fetuses exposed to high sFlt-1 maternal concentrations
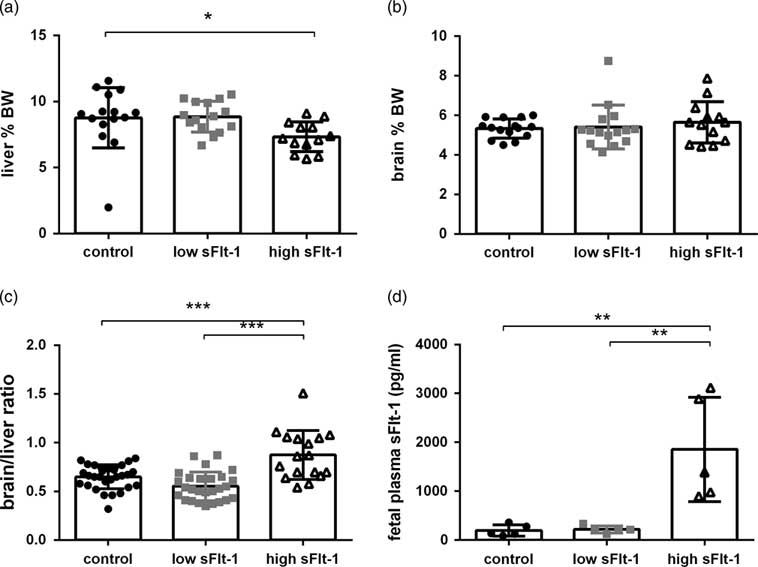
To evaluate whether the fetal growth restriction is asymmetrical or symmetrical, we assessed the organ weight at GD19. The liver weights of fetuses exposed to high maternal sFlt-1 concentrations were smaller in comparison to the control group (Fig. 3a). Brain weight was uncompromised in all groups (Fig. 3b). We also checked the brain/liver ratio as an indicator of fetal asymmetrical/symmetrical growth. We observed increased brain/liver ratio in the fetuses exposed to high sFlt-1 as compared with the low sFlt-1 and the control group and no changes in the low sFlt-1 group as compared with the control group (Fig. 3c), indicating that brain-sparing occurs in the fetuses exposed to the high sFlt-1. To evaluate whether the maternal sFlt-1 levels could interfere the fetal sFlt-1 levels, we measured the plasma sFlt-1 levels in the fetuses to confirm the difference in the sFlt-1 exposure of the fetuses. We observed that fetuses exposed to high sFlt-1 during pregnancy have an 18-fold increase of sFlt-1 in fetal plasma in comparison to control and low sFlt-1 group (Fig. 3d).

Fig. 3 Asymmetrical growth restriction in fetuses exposed to high sFlt-1. (a) Fetal liver weight as percentage of body weight at GD19 (n=10), (b) fetal brain weight as percentage of body weight at GD19 (n=10), (c) brain to liver ratio (n=10), (d) fetal plasma sFlt-1 concentrations at GD19 (n=10). *P<0.05, **P<0.01, ***P<0.001.
sFlt-1 overexpression and growth restriction modulate the fetal liver gene expression
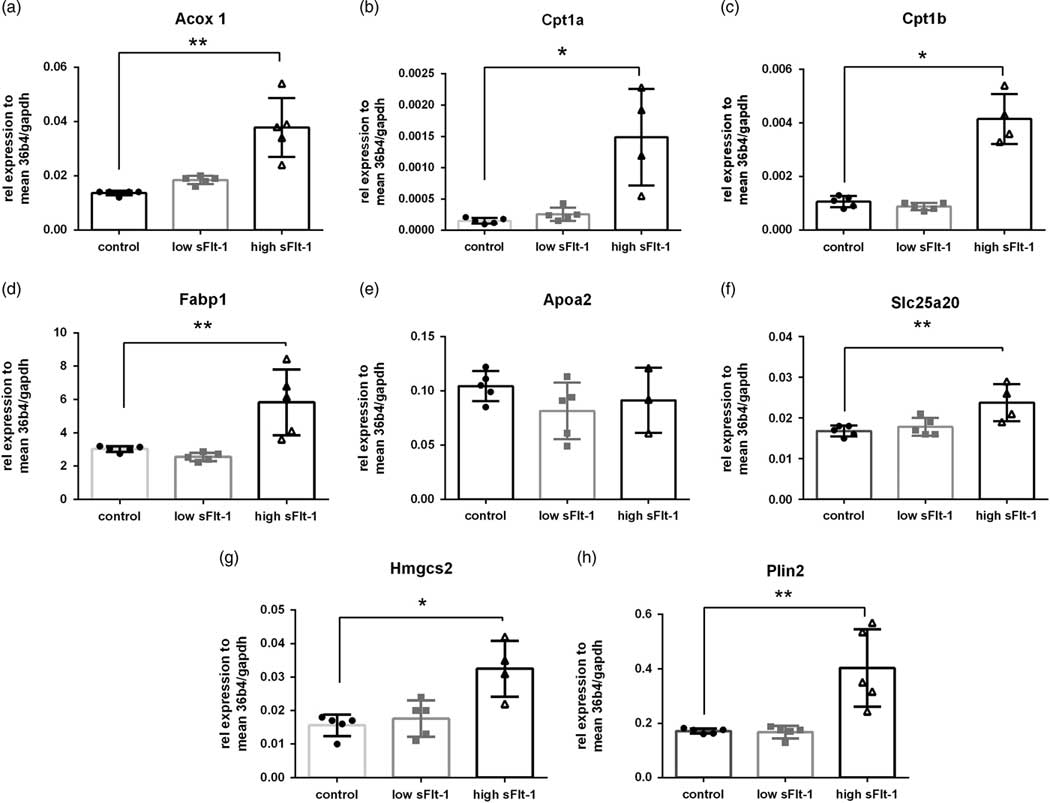
In order to detect whether the fetal growth restriction due to the sFlt-1 overexpression affected the liver function, we performed microarray analysis on fetal liver RNA. We performed an unsupervised clustering analysis of the top 1000 most variable genes based on IQR, which is an indicator of variability of gene expression. In continuation, we performed PCA of the top 1000 most variable genes. As shown in Fig. 4a, the samples tend to cluster in two separate clusters in principle component 1 (PC1), which accounts for 34% of the gene expression. Only one fetal liver from the high sFlt-1 group tends to cluster with the control ones. The dendrogram plot, accompanied by a heat map of the gene expression differences between the groups, is presented in Fig. 4b. As expected, the liver gene expression profiles between the groups were recognizably different; that is exposure to high sFlt-1 concentrations in utero can mediate fetal liver molecular changes. Further analysis depicted that there is upregulation of several genes involved in fatty acid β-oxidation, including the master regulators such as Cpt1a, Cpt1b and Acadvl. Furthermore, we have validated the microarray data with qPCR analysis of eight target genes of the Ppara transcription factor in fetal livers (Fig. 5). As expected, seven out of eight genes showed increased levels only in the group of fetuses exposed to the high sFlt-1 concentrations in the mother.

Fig. 4 Analysis of the transcriptional response to high sFlt-1 in fetal liver. (a) Principal component analysis of the top 1000 differentially expressed genes. (b) Heatmap showing top 1000 differentially expressed genes in the liver in response to sFlt-1. (c) Heatmap showing enriched fatty acid β-oxidation gene set.

Fig. 5 qPCR validation of eight Ppara targets. (a) Acox1, (b) Cpt1a, (c) Cpt1b, (d) Fabp1, (e) Apoa2, (f) Slc25a20, (g) Hmgcs2 and (h) Plin2 mRNA levels relative to 36B4 and Gapdh in fetal liver. One-way ANOVA, shown M±s.e.m. *P<0.05, **P<0.01.
Fatty acid metabolic pathways are upregulated in liver from growth-restricted fetuses exposed to high sFlt-1 concentrations
Since many genes were upregulated in the high sFlt-1 fetal livers as compared to the control fetal livers (Fig. 4b and 4c), we performed a GSEA in order to evaluate the pathways in which these genes are involved. We used GSEA to analyze GO and KEGG gene sets that are significantly altered in the livers from the high sFlt-1 group in comparison to the controls. Top downregulated pathways involved olfactory sensing pathways and g-gated potassium and calcium channels (Supplementary Table 1). Moreover, significantly enriched metabolic pathways included genes responsible for fatty acid β-oxidation, fatty acid, triacylglycerol and keto body metabolism (Table 1). Moreover, GSEA indicated that genes involved in the Ppara signaling pathway are induced upon sFlt-1 overexpression (Table 1).
Table 1 Gene set enrichment analysis of upregulated pathways in response to high sFlt-1. The normalized enrichment score (NES) and the false discovery rate (FDR) with adjusted P-value (or q-value) FDR-q val are indicated in the table. Ppara targets are significantly enriched in the fetal liver after exposure to high sFlt-1

Ppara is differentially methylated in fetal liver upon fetal growth restriction due to sFlt-1 overexpression
Moreover, it has been reported that protein-restricted diet during pregnancy influences the methylation rates of the Ppara promoter region in livers from juvenile offspring.Reference Lillycrop, Phillips and Torrens 17 To investigate whether the methylation status of Ppara is influenced in our growth-restricted and sFlt-1-exposed fetuses, we designed a rat-specific pyrosequencing assay for Ppara that encompasses 10 CpG positions located 500 bp upstream the transcriptional start site (Fig. 6a). Methylation of CpG position 5 was decreased in the high sFlt-1 group (Fig. 6b) and the average methylation of the selected region showed hypomethylation (Fig. 6c), which is in accordance with the previously reported results.

Fig. 6 Ppara is differentially methylated in the liver in response to high sFlt-1. (a) Schematic representation of promoter region of rat Ppara. (b) Methylation percentage levels per each inspected CpG site (n=6, two-way ANOVA test). (c) Average methylation percentage per inspected area (n=6), *P<0.05.
Discussion
The results of the present study indicate that maternal sFlt-1 overexpression has an important implication in the fetal liver physiology. Despite the limited changes in the maternal physiology, exposure to a high sFlt-1 concentration from middle to the end of gestation resulted in fetal growth restriction. This was accompanied with decreased liver weight, altered gene expression and Ppara methylation in the fetal liver.
It was reported that sFlt-1 overexpression during pregnancy contributes to the pathophysiology of preeclampsia.Reference Maynard, Min and Merchan 15 , Reference Lu, Longo and Tamayo 18 However, in our study, despite the increased viral load to induce sFlt-1 overexpression, we could not record the clinical symptoms of preeclampsia. One possible explanation could be that our model produced either too high or too low sFlt-1 concentration instead of the middle range concentrations that were obtained with other models.Reference Maynard, Min and Merchan 15 , Reference Lu, Longo and Tamayo 18 , Reference Levine, Maynard and Qian 19 It can be speculated that these conflicting results are due to the differences in the timing and methods used to track the blood pressure and proteinuria. For example, we avoided usage of telemetry and we primarily assessed the systemic blood pressure via aortal catheter that involves administration of anesthesia to the dams, which might as well contribute to the lower blood pressure values. However, the advantage of this specific model is that we can study the effects of high levels of sFlt-1 on the fetuses in the absence of maternal signs, such as hypertension and proteinuria. Therefore, we consider our models as a model of sFlt-1 overexpression.
Using this maternal sFlt-1 overexpression model, we demonstrate that the increased maternal sFlt-1 concentrations lead to asymmetrical growth restriction of the fetus. This is a condition where the brain development is preserved at the expense of liver growth. The brain-sparing effect usually occurs due to maternal and/or fetal hypoxia where concomitant redistribution of the oxygenated blood is established at the expense of other organs.Reference Cohen, Baerts and Van Bel 20 , Reference Giussani 21 In addition, brain/liver ratio is an important predictor of the fetal outcome.Reference Boito, Struijk, Ursem, Fedele and Wladimiroff 22 It is well established that redistribution of nutrients leads to a reduction of the functional capacity of metabolically active organs, for example, liver. This adaptation can lead to metabolic programming and a thrifty phenotype that can persist later in life. Several previous studies have shown that low birth weight increases the risk of cardiovascular and metabolic diseases, for example, stroke, diabetes, obesity, etc.Reference Salam, Das and Bhutta 23 – Reference Von Beckerath, Kollmann and Rotky-Fast 27 Potential factors include malnutrition and toxins present during pregnancy. Our data demonstrate that fetal exposure to sFlt-1 is associated with asymmetrical growth restriction, however to what extent this contributes to developmental programming of the fetus still remains to be determined.
sFlt-1 has a molecular weight higher than 5 kDaReference Rajakumar, Powers and Hubel 28 and in normal physiological conditions does not freely diffuse through the placenta. However, in our study, we observed that maternal plasma sFlt-1 concentrations result in increased plasma sFlt-1 concentrations in the fetuses as well. We speculate that this can be either due to changed permeability of the placenta when the angiogenic balance is disturbed or due to direct exposure of the pup to the sFlt-1 adenoviral delivery. These results support earlier observations that angiogenic factors are increased in maternal and umbilical cord samples in pregnancies complicated with intrauterine growth restriction.Reference Wallner, Sengenberger and Strick 29 Additionally, several other studies have reported that newborns small for gestational age have also increased sFlt-1 concentrations in umbilical plasma samples.Reference Bergen, Bouwland-Both and Steegers-Theunissen 30 , Reference Boutsikou, Malamitsi-Puchner and Economou 31 These results suggest that the fetuses are not only exposed to the indirect effects of sFlt-1 but also via direct exposition to sFlt-1. It is possible that sFlt-1 interferes with the fetal organ angiogenesis, but the exact mechanism will require further investigation.
Importantly, we observed that the gene expression profile is changed in fetal livers that were exposed to high sFlt-1 concentrations in utero. The difference was prominent in the genes involved in the fatty acid metabolism, which is crucial for the energy supply of the fast-growing fetal organism. This is in accordance with a mouse study of sFlt-1 overexpression where it was found that the LXR/RXR pathway was the top modified canonical pathway in the plasma proteome of dams 6 months postpartum.Reference Bytautiene, Bulayeva and Bhat 13 The LXR/RXR pathway is involved in the regulation of the lipid metabolism. In contrast, a calorie-restricted diet results in decreased expression of genes involved in fatty acid synthesisReference Renaud, Cui, Lu and Klaassen 32 and folate-restricted diet increases the expression of genes involved in fatty acid degradation and β-oxidation processes.Reference Champier, Claustrat, Nazaret, Montange and Claustrat 33 These findings suggest that expression of modulation of genes involved in fatty acid metabolism serves as a compensatory mechanism in fetal growth restriction, obtained either via nutritional or via antiangiogenic manipulation.
In agreement with the upregulated fatty acid metabolism genes, we observed that the Ppara targets pathway was enriched as well. Ppar genes are a unique set of fatty acid-regulated transcriptional factors that increase fatty acid metabolism.Reference Grygiel-Górniak 34 In particular, Ppara acts as a key nutritional and environmental sensor in order to establish metabolic adaptation.Reference Contreras, Torres and Tovar 35 Activation of Ppara induces uptake and catabolism of fatty acids by upregulation of genes involved in β-oxidation and fatty acid transport.Reference Narravula and Colgan 36 Moreover, the peroxisome proliferator-activated receptors have a substantial role in fetal metabolism and are well known for their role in developmental programming.Reference Lendvai, Deutsch, Plösch and Ensenauer 37
It has been reported that fetal growth restriction due to a caloric-restricted maternal diet results in decreased Ppara expression and can be maintained for longer period of time.Reference Magee, Han and Cherian 38 However, growth-restricted livers from protein-restricted mothersReference Lillycrop, Phillips and Torrens 17 have increased Ppara expression that is in accordance with our results. It appears that the differences in the fatty acid metabolism and Ppara signaling are also affected in our sFlt-1-exposed growth-restricted fetuses.
We found moderate but significant changes in the promoter methylation pattern of Ppara in the fetal liver exposed to the highest sFlt-1 concentrations in utero. Previously, it was reported that Ppara is differentially methylated in the offspring livers of growth-restricted rats exposed to low protein and calorie restriction intake in utero. In continuation, it was shown that these discrete changes are stable and persistent in adulthood.Reference Lillycrop, Phillips and Torrens 17 These Ppara methylation differences in early life might be considered as an indicator of metabolic adaptation to the intrauterine harsh environment.
Together, these results show that high maternal levels of sFlt-1 result in fetal growth restriction, high fetal plasma sFlt-1 levels, changes in fatty acid gene expression and their master regulator Ppara, which also shows promoter methylation alterations in accordance with the gene expression. This is consistent with other models of developmental programming, for example, protein restriction.Reference Lillycrop, Phillips and Torrens 17 These findings should warrant further investigations into the sFlt-1 contribution to the developmental programming of offspring health, namely via inspection of the second-generation offspring exposed to high sFlt-1 concentrations.
Acknowledgments
The authors want to acknowledge Joseé Plantinga and Dyonne Vos for their invaluable technical support.
Financial Support
This work was supported by the Netherlands Organization for Health Research and Development (ZonMW, grant number 91211053).
Conflict of Interest
The authors report no conflict of interest.
Ethical Standards
The authors assert that all procedures contributing to this work comply with the ethical standards of the relevant national guides on the care and use of laboratory rats and has been approved by the Institutional Committee for Animal Ethical Experiments of the University of Groningen.