


Introduction
Obesity is a public health challenge that affects various groups of people to a greater or lesser degree. Although the main factor that causes this disease is undoubtedly an imbalance between intake and energy expenditure, there is current evidence that a combination of dietary, environmental, and genetic factors are also causes of obesity. Obesity during pregnancy and lactation leads to maternal and offspring metabolic dysfunction. Human epidemiologicalReference Tain and Hsu1 and experimental animal studiesReference Dickinson, Moss and Gatford2 have suggested that perinatal insults such as placental insufficiency,Reference Briffa, O’Dowd and Moritz3 glucocorticoid exposure,Reference Cuffe, Turton and Akison4 nutritional deficits/excess,Reference Rodríguez-Rodríguez, de Pablo and García-Prieto5 stress,Reference Entringer, Buss and Wadhwa6 as well as the maternal gut microbiomeReference Ma, Prince and Bader7 can alter the developmental trajectory of the fetus/offspring leading to long-term unfavorable outcomes and chronic noncommunicable diseases.
This relationship between maternal environmental conditions and offspring health has given rise to the concept of “developmental programming,” more recently called “Developmental Origins of Health and Diseases”, defined as the response to a specific challenge to the mammalian organism during a critical developmental time window that alters the trajectory of development with resulting effects on health that persist throughout life.Reference Zambrano and Nathanielsz8
High-fat diets (HFDs) generally consumed in maternal obesity (MO) increase adipose tissue expansion and adipocyte size (AS). Multiple processes are involved in adipose tissue expansion, e.g., the rate and duration of cell cycle length and cell division underlie AS variability.Reference Ginzberg, Kafri and Kirschner9 Recent studies suggest that probiotics might be a novel approach to counteract these MO effects, providing potential therapies in the treatment of MO. Evidence from animal studies suggests that probiotic administration may reduce maternal weight gain and adipose tissue expansion during HFD-induced obesity.Reference Cano, Santacruz and Trejo10–Reference Kobyliak, Conte and Cammarota12 According to an expert panel of the International Scientific Association for Probiotics and Prebiotics, probiotics are defined as “live microorganisms that, when administered in adequate amounts, confer a health benefit on the host”.Reference Hill, Guarner and Reid13 Some studies have reported isolation of new probiotic bacteria with health benefits from unconventional sources.Reference Argyri, Zoumpopoulou and Karatzas14–Reference Castro-Rodríguez, Hernández-Sánchez and Yáñez Fernández17 The aim of this study was to evaluate the effects of maternal intervention in obese rats, prior to and throughout pregnancy and lactation, with a probiotic of the genus Leuconostoc obtained from aguamiel (edible sweet sap obtained from Agave salmiana, a traditional Mexican drink) and identified as Leuconostoc SD23.Reference Castro-Rodríguez, Hernández-Sánchez and Yáñez Fernández17 We analyzed maternal histological and metabolic changes produced by Leuconostoc SD23 to determine if this strain can modify negative effects of a HFD. We hypothesized that oral administration of Leuconostoc SD23 1 month before mating and through pregnancy and lactation improves maternal metabolic dysfunction in obese rats.
Materials and methods
Bacterial strain and growth conditions
The strain Leuconostoc mesenteroides subsp. mesenteroides SD23 employed in the present research was isolated from aguamiel of Agave salmiana and identified by sequencing of amplified 16S rDNA regions as previously described.Reference Castro-Rodríguez, Hernández-Sánchez and Yáñez Fernández17 All new data have been deposited in GenBank (Accession number: KR476473).
Bacteria were grown in Man–Rogosa–Sharpe broth (MRS, Difco Laboratories, MI, USA) and incubated at 30 °C for 24 h under aerobic conditions. Cells were harvested by centrifugation (11,200 g for 20 min) and washed twice in phosphate-buffered saline (PBS, 130 mM sodium chloride, 10 mM sodium phosphate, pH 7.4). The collected cells (1 × 10¹⁰ CFU/ml)Reference Castro-Rodríguez, Reyes-Castro and Vega18,Reference Shokryazdan, Jahromi and Liang19 were suspended in 10% skimmed milk for oral administration to rats. Aliquots of the suspensions were stored at −70 °C until used. The number of live cells after freezing and thawing was determined by counting colony-forming units (CFUs) on MRS agar following 48 h incubation. More than 90% of cells were alive when thawed and no significant differences were found during storage (2 months). One fresh aliquot was thawed for every new experiment to avoid variability in the viability of cultures.
Animal care, diets, and experimental design
All procedures were approved by the Animal Experimental Ethics Committee (BRE-1871–18/21–1) of the Instituto Nacional de Ciencias Médicas y Nutrición Salvador Zubirán (INCMNSZ) in accordance with the Official Mexican Guideline for the Care and Use of Laboratory Animals (NOM-062-ZOO-1999). Food and water were provided ad libitum.
Female Wistar rats were maintained under controlled lighting (lights on from 07:00 to 19:00 h at 22–23 °C) and fed normal laboratory chow (Zeigler Rodent RQ22–5, USA) containing 22.0% protein, 5.0% fat, 31.0% polysaccharide, 31.0% simple sugars, 4.0% fiber, 6.0% minerals and 1.0% vitamins (w/w), and energy 4.0 kcal g−1. Between 16 and 17 weeks of age, when they weighed 200–240 g, females were randomly bred with males from other mothers. These females were the Founder Generation (F0) mothers. At weaning (day 21), one female F0 pup from each litter was randomly assigned to either a maternal control (C; n = 20) group fed laboratory chow or to a MO group (n = 20) fed a high-energy obesogenic diet containing 22.5% protein, 20.0% animal lard, 5.0% fat, 20.5% polysaccharide, 20.5% simple sugars, 5.0% fiber, 5.0% mineral mix, 1.0% vitamin mix (w/w), and energy 4.9 kcal g–1. The high-energy obesogenic diet was produced in the specialized dietary facility of the INCMNSZ.Reference Rodríguez-González, Reyes-Castro and Bautista20 Thus, each F0 group contained only one female from any litter and F0 females in different groups, but not within groups, were sisters, providing homogeneity in F0 mothers’ own developmental programming and genetics.
At day 90, 1 month before breeding, one half of C and MO F0 were randomly selected to continue their diet and receive a daily dose of Leuconostoc SD23 orally (1 × 10¹⁰ CFU/ml), suspended in 10% skimmed milk for voluntary oral consumption by pipette: maternal control with probiotic (CP), and MO with probiotic (MOP). This regime was maintained during pregnancy and lactation. F0 female rats were placed with proven male breeders on day 120 and conceived during the next cycle. The day in which spermatozoa were detected in a vaginal smear was designated as day of conception – day 0. To minimize consumption of the high-energy obesogenic diet by the males during the mating period, males were placed with females at night and removed each morning. Lactating mothers were maintained on their pregnancy diet. Litter size and pup weight were recorded at birth. Offspring (F1) anogenital distance was measured to distinguish males and females.Reference Zambrano, Bautista and Deas21 Litters of over 12 pups or less than 10 pups were not included in the study. Litters of 10–12 pups were adjusted to 10 pups for each mother while maintaining as close to a 1:1 sex ratio as possible. Offspring were weaned at postnatal day 21, housed 5/cage, and fed chow diet.
Measurement of F0 food intake
Body weight and food intake were measured daily during pregnancy and lactation. Two rats of each experimental group were separated in acrylic cages (19 cm × 29 cm × 12 cm) for controlling the amount of food ingested during gestation. Before the end of gestation (19 days of gestation), the rats were separated, placing one rat per cage to measure food intake during lactation.
Maternal phenotype and blood parameters at the end of lactation
At the end lactation (21 days), maternal age at that time was around 160 days old (range 154 to 164), body composition analysis of F0 female rats was performed using a 4-in-1 small animal MRI (Echo Medical Systems, Houston, TX) to measure total fat and lean body mass. Mothers were fasted 4 h, anesthetized with isoflurane and bled by aortic puncture. Blood samples for analysis of metabolic parameters were collected in tubes and centrifuged to obtain serum, which was stored at −20 °C. Glucose and triglycerides were determined enzymatically by Synchron CX auto analyzer (Beckman Coulter, Co.), insulin, and leptin by ELISA Kits (ALPCO-Insulin; RayBiotech-Leptin). Homeostasis model assessment of insulin resistance (HOMA) was calculated from HOMA = [glucose (mmol/L) × insulin (µU/ml)]/22.5.Reference Vega, Reyes-Castro and Bautista22
Histology from liver, white adipose tissue, and small intestine
The liver, perirenal adipose tissue, and small intestine were fixed in 10% neutral formalin buffered solution for histological analysis. Paraffin-embedded tissues were sectioned to a thickness of 3–4 µm and fixed to glass slides. Slides were deparaffinized and stained with hematoxylin-eosin. Ten random fields per rat were evaluated to determine percentage fat area in the liver, adipocyte size (area per adipocyte) in the adipose tissue, and changes in the villus height.Reference Mah, Van Landeghem and Gavin23 Data analysis was performed by ImageJ software.
Characterization of maternal adipocyte size distribution
Median adipocyte size (AS) differences among groups were compared by one-way analysis of variance (ANOVA) on Ranks. In addition, data differences due to data distribution and/or spreading in AS were assessed by statistical comparison of their cumulative distributions by two-sample Kolmogorov–Smirnov test. Histograms of AS relative frequency with area intervals, approximated by the Sturges ruleReference Scott24 of 750 μm2 (i.e., 0–750 μm2, 751–1500 μm2, 1501–2250 μm2 until the maximal observed area interval), were overlaid with their corresponding gamma probability density function for each group, which was modeled through their parameters estimation by the moments method.Reference Ibáñez, Vázquez-Martínez and León-Contreras25
Relative small and larger AS cutoff points were defined, respectively, by the first and last percentile of the gamma distribution of the C group.
Statistical analysis
Statistical analyses were carried out using SigmaPlot 11.0 software. Prior to pregnancy (F0 day 90), there were only two groups, compared by Student’s unpaired t-test. Biochemical variable data were normally distributed and significant differences were determined by two-way multiple ANOVA using post hoc Tukey’s test; the two factors were maternal diet and probiotic intervention. Data are presented as mean ± SEM. AS is shown as median with interquartile range and compared by one-way ANOVA on ranks. AS cumulative distributions were analyzed by two sample Kolmogorov–Smirnov test and the observed p-value was adjusted with the Bonferroni correction to counteract three sample simultaneous comparisons. AS dispersion of extreme values was determined by gamma distribution probability comparison. Values of p < 0.05 were considered statistically significant. A priori analysis was performed using G * Power 3.1.9.4 to compute the required total sample size of 31 (~8 per group), with α = 0.05, power = 0.95, and effect size = 0.67. Effect size corresponded to body weight.
Results
Body composition
At weaning, F0 body weights were similar in females randomized to the four groups (C = 64 ± 1, MO = 61 ± 1 g; p = 0.079). Body weight differed between C (214 ± 2 g) and MO (238 ± 4 g; p < 0.05) for the first time at day 55, 34 days after HFD initiation. When probiotic intervention began at day 90, nonpregnant MO females were 17% heavier than C (C = 269 ± 3, MO = 315 ± 6 g; p < 0.05); at breeding (day 120), MO and MOP were 23% and 18% heavier than respective C groups. Maternal weight after delivery was greater in MO than C mothers but similar at the end of lactation. Probiotic intervention had no effect on maternal weight at any stage (Fig. 1a). At the end of lactation, body weight was similar between groups (Fig. 1b). However, the percentage of body fat in MO increased by 50% compared to C, CP, and MOP (p < 0.05, Fig. 1c).
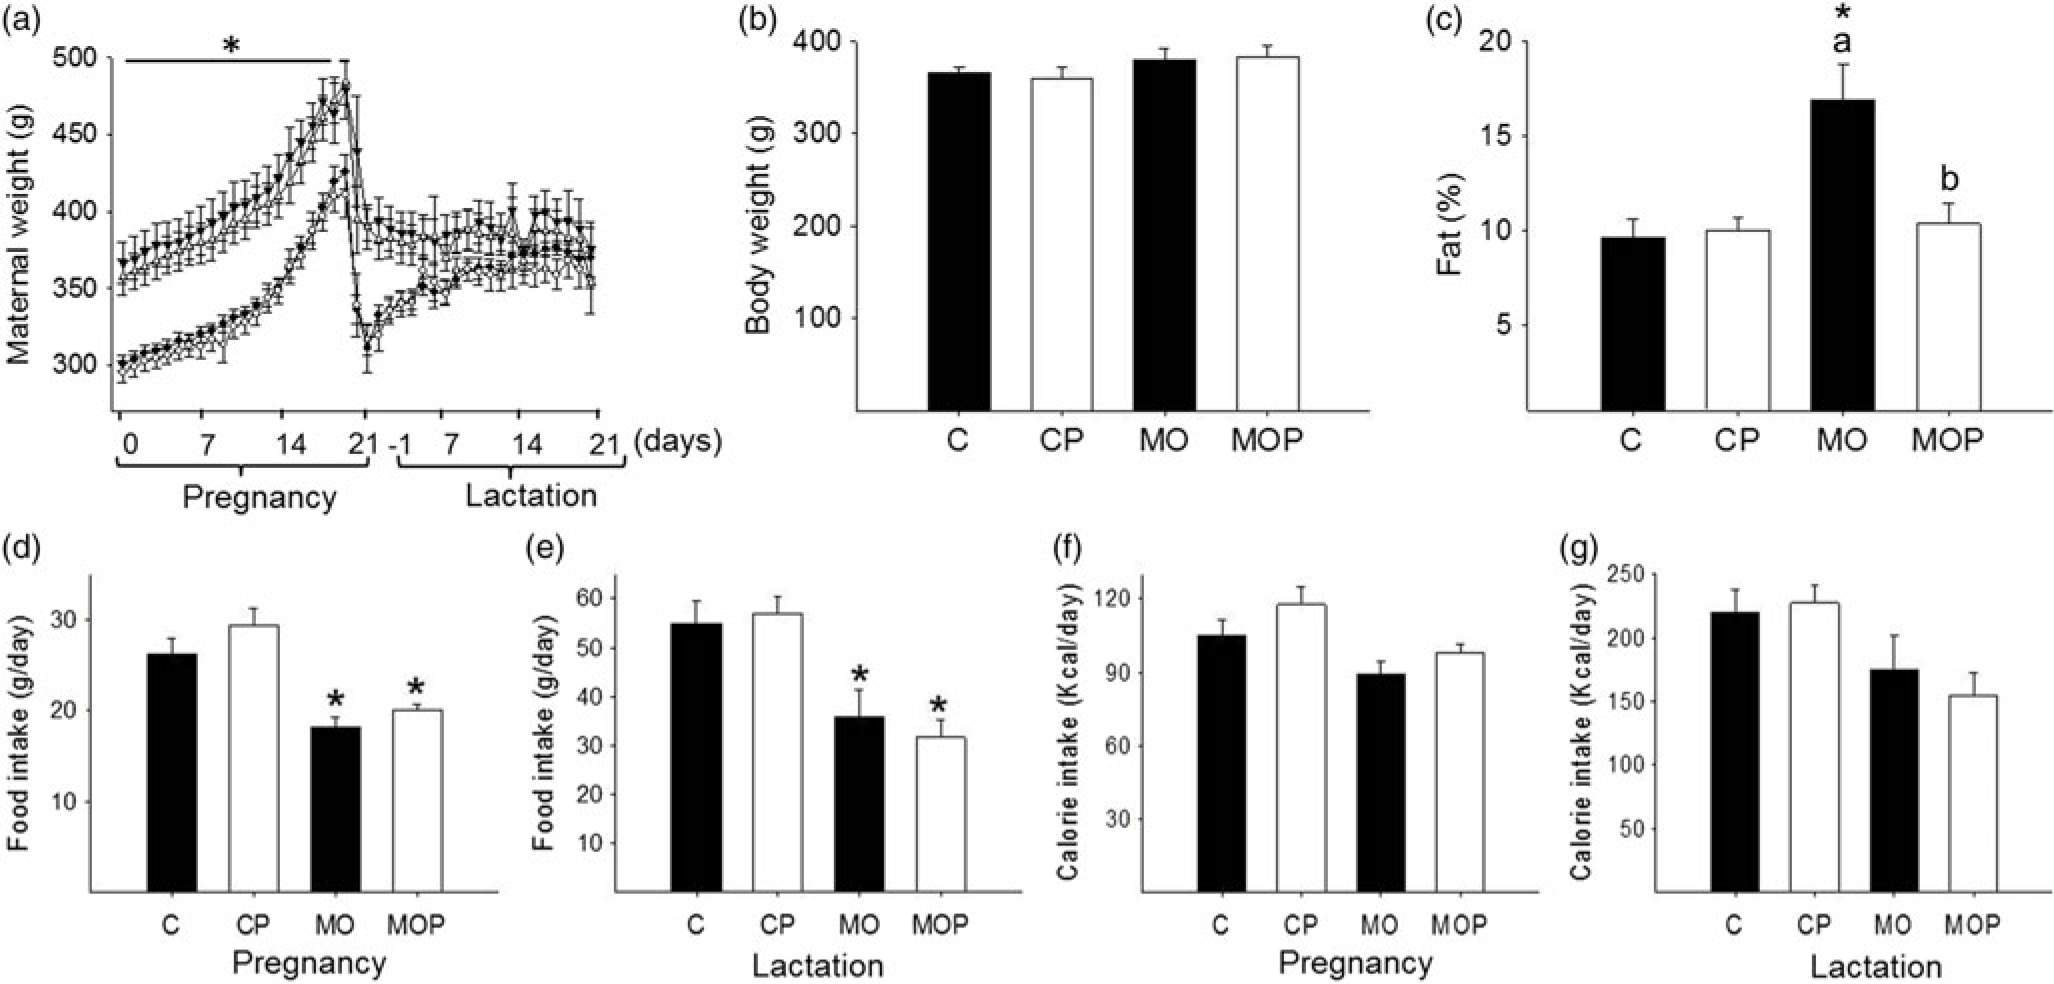
Fig. 1. Maternal body composition: (a) body weight during pregnancy and lactation; (b) body weight at the end of lactation; (c) percentage of body fat at the end of lactation; (d) food intake during pregnancy and (e) at the end of lactation; (f) calorie intake during pregnancy and (g) at the end of lactation. C = control (n = 8), CP = control + probiotic (n = 8), MO = maternal obesity (n = 7), MOP = maternal obesity + probiotic (n = 8). Data are mean ± SEM, two-way ANOVA, *p < 0.05 versus effect of diet between C and MO or CP and MOP groups; p < 0.05 for different letters between C and CP or MO and MOP.
F0 food intake during pregnancy and lactation
Food intake was lower in MO and MOP compared with C and CP during gestation (C = 26 ± 1.7; CP = 29 ± 1.8; MO = 18 ± 1.2; MOP = 20 ± 0.7 g/day) and lactation (p < 0.05, Fig. 1 d, 1e). Calorie intake per day was similar in all four groups during gestation and lactation (Fig. 1f, 1 g).
Biochemical parameters
At the end of lactation, MO exhibited a 43% increase in serum glucose compared to C. HOMA and leptin were 1.2- and 4.6-fold higher in MO compared to C. Triglycerides were 64% higher in MO than C mothers (p < 0.05, Fig. 2a, 2c, 2d, and 2e). Interestingly, MOP mothers exhibited a 23% reduction in serum glucose, a 55% reduction in HOMA, and a 66% reduction in triglycerides compared to MO (p < 0.05, Fig. 2a, 2c, and 2e), but serum leptin was not different between MO versus MOP (Fig. 2 d). Insulin was similar in all four groups (Fig. 2b).

Fig. 2. Maternal metabolism parameters at the end of lactation: (a) glucose, (b) insulin, (c) HOMA, (d) leptin, and (e) triglycerides. C = control (n = 8), CP = control + probiotic (n = 8), MO = maternal obesity (n = 7), MOP = maternal obesity + probiotic (n = 8). Data are mean ± SEM, two-way ANOVA, *p < 0.05 versus effect of diet between C and MO or CP and MOP groups; p < 0.05 for different letters between C and CP or MO and MOP.
Morphological changes in the liver, small intestine, and adipose tissue in mothers at the end of lactation
Hepatic fat content was higher in MO compared to C (Fig. 3a). MOP exhibited a 77% reduction in hepatic fat content compared to MO (p < 0.05, Fig. 3a). Fat in MOP was higher than C and CP, whereas fat accumulation was similar in C and CP (Fig. 3a). Villus height was increased in MO compared to MOP, C, and CP. Villus height was similar in MOP and CP (p < 0.05, Fig. 3c).
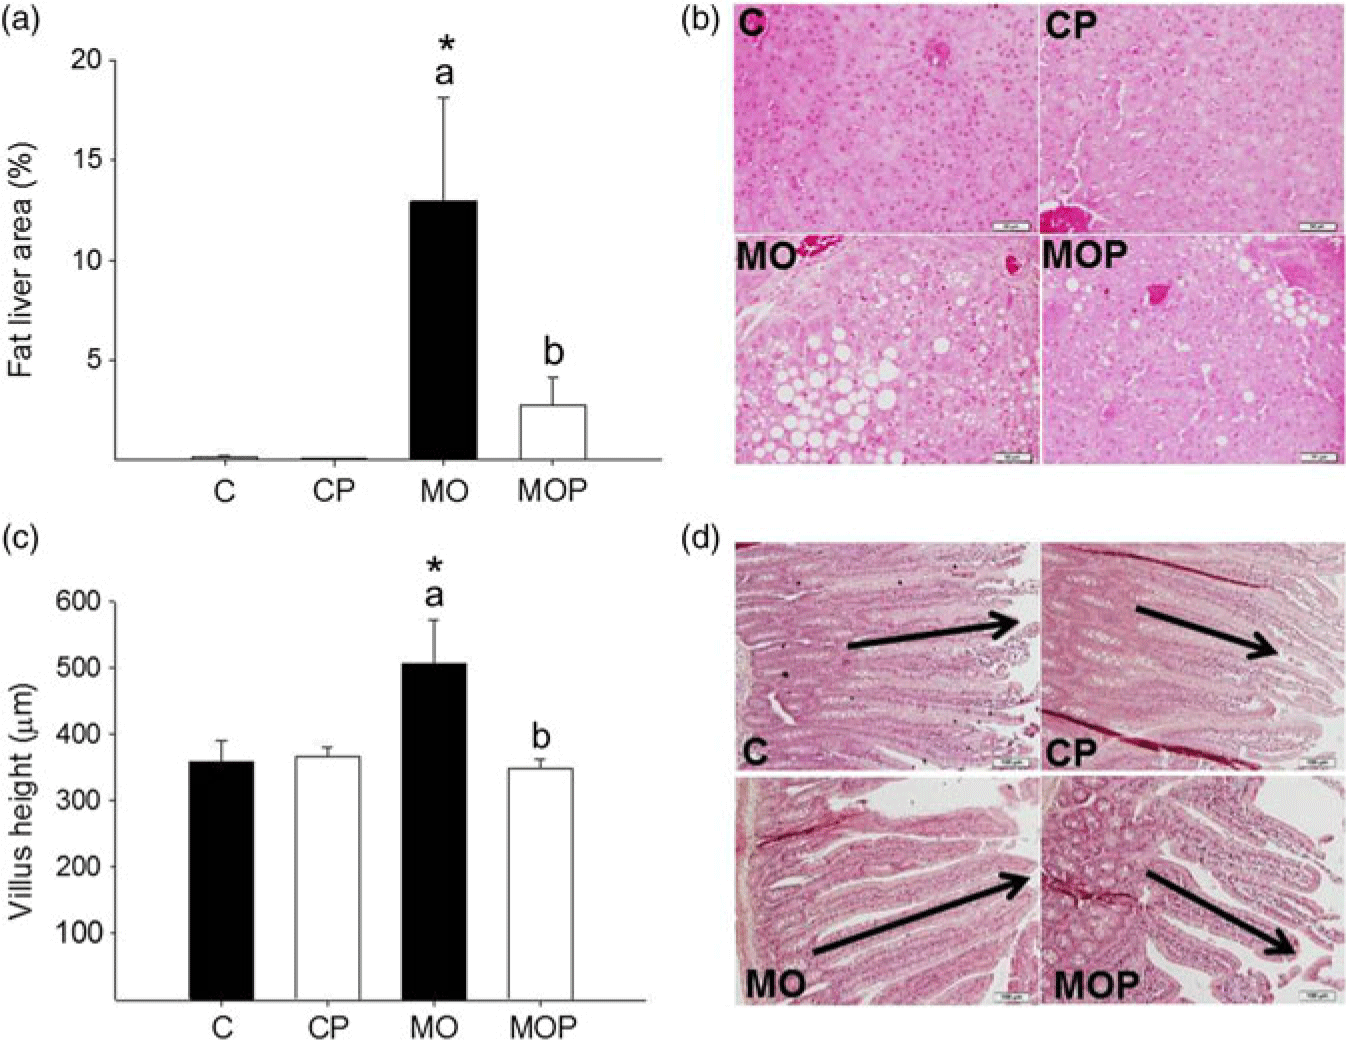
Fig. 3. Histological analysis of liver (a) and small intestine (c). For liver, photomicrographs 40× of representative HE-stained slides (b) and for small intestine, photomicrographs 10× (d). Data are mean ± SEM, two-way ANOVA, *p < 0.05 versus effect of diet between C and MO or CP and MOP groups; p < 0.05 for different letters between C and CP or MO and MOP.
In MO, mean and median AS were higher compared to MOP, C, and CP (p < 0.05, Fig. 4a, 4b). In MOP, mean and median AS were higher compared with C and CP (Fig. 4a). MO cumulative AS distribution was different (p < 0.05) from MOP, C, and CP (Fig. 4c). C and CP AS distributions were similar (Fig. 4c).

Fig. 4. Adipocyte size central tendency in mothers at the end of lactation. Mean (a), median (solid line) and mean (dotted line) adipocyte size with interquartile range (b), and cumulative distributions (c) were compared by two sample Kolmogorov–Smirnov test and the p-values adjusted by Bonferroni correction. C n = 8, CP n = 8, MO n = 7, MOP n = 8. * versus C, # versus MO. Representative photomicrograph of retroperitoneal adipose tissue H&E stained and observed at 20× magnification (d). Data not sharing a letter are statistically different, p < 0.05.
Similar effects were observed in terms of AS distribution of C and CP. However, Leuconostoc SD23 intervention led to a right-skewed AS distribution, with an increased number of small adipocytes in MOP compared to MO. Small and larger proportions were similar in C and CP. However, in MO, the proportion of small cells was lower compared to C, CP, and MOP. In contrast, the proportion of large cells in MO was larger than C, CP, and MOP. In MOP, the proportion of small cells was lower than C and CP, while the proportion of large cells was greater than C and CP (p < 0.05, Fig. 5).

Fig. 5. Adipocyte size by gamma distribution. Relative frequency histograms and the gamma distribution function are represented for each maternal group (C, CP, MO, and MOP). Small and large adipocyte proportions are represented by the shaded region under the curve below and above the respective adipocyte size cutoff points defined by the first decile and last decile; C n = 8, CP n = 8, MO n = 7, MOP n = 8. * versus C, # versus MO, & versus CP; p < 0.05.
Offspring (F1) birth parameters
Litter sizes (C = 11.6 ± 0.7, CP = 11.0 ± 0.8, MO = 10.0 ± 1.1, MOP = 11.0 ± 1.0; p = 0.644) and body weight (C = 7.3 ± 0.2, CP = 7.5 ± 0.5, MO = 6.3 ± 0.3, MOP = 7.1 ± 0.5 g; p = 0.151) were similar in all groups at birth.
Discussion
This study clearly demonstrates that consumption of Leuconostoc SD23 strain obtained from the aguamiel of Agave salmiana improves metabolic dysfunction in obese mother rats at the end of lactation.
Oral administration of L. mesenteroides SD23 to HFD-fed mother rats reduced body weight gain and AS at the end of lactation, associated with a reduction in fat mass despite equal caloric intake, indicating that this probiotic strain can reduce fat deposition. Many studies suggest that diet plays major roles in obesity and metabolic diseases, which can affect the development and function of the gastrointestinal tract of both mother and offspring.Reference Rautava, Luoto and Salminen26,Reference Angelakis, Armougom and Million27 MO and excessive gestational weight gain are the most common obstetric risk factors with direct implications for both maternal and offspring outcomes.
Obesity causes hyperglycemia by inducing insulin resistance. These outcomes are observed in our model of MO. MOP reduced serum glucose, indicating an improvement in carbohydrate metabolism, and alleviated insulin resistance. This is consistent with another study that reported that probiotics may regulate glucose metabolism and metabolic syndrome.Reference Andersson, Bränning and Ahrné28
In obesity, there is an increased flux of free fatty acids into the liver due to their excessive accumulation in the adipose tissue and to the inability of insulin to suppress lipolysis in adipocytes due to insulin resistance. These changes lead to steatosis or fatty liver disease.Reference Boden, She and Mozzoli29,Reference Ma, Hua and Li30 The results of this study show that liver fat content was effectively decreased in MOP. Given the decreased hepatic lipid uptake observed in MOP, these data indicate that Leuconostoc SD23 protects against HFD-induced hepatic steatosis by suppressing hepatic lipid accumulation and lipotoxicity. The decrease in liver fat affects mostly the triglyceride levels.Reference Ipsen, Lykkesfeldt and Tveden-Nyborg31 Our results showed that Leuconostoc SD23 reduced maternal triglyceride levels in MOP.
It is well known that the type of diet alters intestinal morphology and function.Reference Dailey32 This intestinal adaptation may be one factor driving the differences in nutrient processing in C versus MO. In this study, intestinal adaptation in the obese state was demonstrated by an increase in villus height in MO compared with C. These changes are likely to increase intestinal absorption and permeability with subsequent metabolic inflammation. These changes would increase energy harvest from the HFD, impair short-chain fatty acids synthesis, and alter bile acids metabolism.Reference Kobyliak, Conte and Cammarota12, Reference Lam, Ha and Campbell33,Reference de La Serre, Ellis and Lee34 In addition to altering intestinal morphology and increasing villus length, high-fat feeding alters expression and release of the gut peptides that control food intake.Reference Covasa35,Reference Mao, Hu and Xiao36 Our results are consistent with recent findings that report increases in villus height with long-term HFD feeding.Reference Mah, Van Landeghem and Gavin23,Reference Baldassano, Amato and Cappello37 Administration of Leuconostoc SD23 is effective in reducing villus height in MOP, a change that may reduce absorption of dietary fat and constitute a mechanism by which this bacterial strain exerts a positive effect on liver steatosis. Another possible mechanism underlying the protective effect of Leuconostoc SD23 may be the maintenance of gut integrity. It is important to highlight that the administration of Leuconostoc SD23 in MOP and CP maintains the structure and function of the small intestine, which results in beneficial changes on metabolic parameters such as triglycerides and glucose serum levels.
Dietary supplementation with probiotics in obese pregnancy offers the potential for intervention to improve maternal health.Reference Esposito, Iacono and Bianco38 In our study, diet supplementation in obese mother rats at the end of lactation with Leuconostoc SD23 reduced AS, associated with a reduction of percentage of fat mass, supporting the potential of this probiotic strain to reduce dietary fat absorption resulting in a reduction of long-chain fatty acid availability.Reference Castro-Rodríguez, Reyes-Castro and Vega18,Reference Esposito, Iacono and Bianco38
The changes observed in body composition and the metabolic parameters are likely related to the changes we observed in adipose tissue.Reference Wagner, Samdal Steinskog and Wiig39 Adipose tissue stores energy in the form of lipids and responds rapidly and dynamically to alterations in the balance between energy intake and expenditure. In our study, we compared effects on AS by oral administration from Leuconostoc SD23 during pregnancy and lactation in F0. It is known that increased AS and number are associated with the body’s response to different metabolic states.Reference Garaulet, Hernandez-Morante and Lujan40–Reference Fang, Guo and Zhou42
The asymmetric distribution of AS is due to the fact that adipocytes that reach a critical size provide signals to neighboring preadipocytes to divide and differentiate.Reference Faust, Johnson and Stern43 These paracrine signals can stimulate or inhibit adipogenesis.Reference MacDougald and Mandrup44 Asymmetry in AS distribution is an important consequence of adipocyte proliferation and differentiation, since small adipocytes are directly linked to an increased rate of adipocyte proliferation and large adipocytes are associated with an increased lipid storage capacity. Our results confirm differences between C and MO in AS distribution. The administration of probiotic in MOP reduced mean and median AS, which resulted in differences in gamma distribution compared to MO. MO decreased asymmetry compared to C, but MOP increased asymmetry compared to MO. An asymmetric distribution to greater numbers of small adipocytes as observed in C and CP groups can be interpreted as better regulation of lipid storage homeostasis than seen in MO. MOP increased the proportion of small cells and decreased the proportion of large cells compared to MO. These changes were accompanied by reduced MOP triglyceride compared to MO. All parameters evaluated in CP were similar to C. It is important to highlight that the administration of Leuconostoc SD23 in CP maintains the structure and function of the different tissues. Thus, Leuconostoc SD23 can be considered safe with no adverse effects seen in the C group.
In summary, Leuconostoc SD23 efficiently suppresses hepatic and adipogenic fat accumulation in obese mother rats at the end of lactation. This strain also improves fasting blood glucose level. We therefore propose that Leuconostoc SD23 could have an anti-obesity effect in obese mothers. In conclusion, Leuconostoc SD23 administered to the mother 1 month before mating and through pregnancy and lactation has beneficial effects on rat maternal metabolism, which might help to prevent adverse metabolic programming in the offspring due to MO. However, further studies are required to support this hypothesis and to reveal plausible mechanisms of action of the specific bacterial strain used in this preclinical study.
Acknowledgments
The authors thank CONACyT-SEP (Consejo Nacional de Ciencia y Tecnología-Secretaría de Educación Pública) México (287912) and Newton Fund RCUK-CONACyT (Research Councils UK – Consejo Nacional de Ciencia y Tecnología – I000/726/2016 FONCICYT/49/2016). The authors also thank Hillary F. Huber for proofreading the manuscript.
Author contributions
DCCR and EZ: conception and design of the project. GJP, LCC and MPS: performance of experiments. DCCR, CAI, LARC, JYF and EZ: analysis and interpretation of data. All authors have approved the final version of the manuscript and agree to be accountable for all aspects of the work. All persons designated as authors qualify for authorship, and all those who qualify for authorship are listed.
Financial support
This work was supported by CONACyT-SEP (Consejo Nacional de Ciencia y Tecnología-Secretaría de Educación Pública) México (287912) and Newton Fund RCUK-CONACyT (Research Councils UK – Consejo Nacional de Ciencia y Tecnología – I000/726/2016 FONCICYT/49/2016).
Conflict of Interest
On behalf of all authors, the corresponding author states that there is no conflict of interest.
Ethical standards
The authors assert that all procedures contributing to this work comply with the ethical standards of the relevant national guides on the care and use of laboratory animals.
Declaration of interest
The authors have no competing interests to declare.


