


Introduction
Intrauterine growth restriction (IUGR) of the fetus resulting from maternal under-nutrition (MUN) leads to placental insufficiency and gives rise to low birth weight newborns.Reference Brenner and Chertow1–Reference Hales and Barker3 Epidemiologic studies have shown a clear correlation between low birth weight and a greatly increased risk of metabolic syndrome (i.e. obesity, type II diabetes, hypertension, cardiovascular disease).Reference Phillips, Jones and Goulden4, Reference Barker5 This relationship has been further born out in animal models demonstrating that gestational under-nutrition results in increased adult onset metabolic syndrome phenotype.Reference Holemans, Aerts and Van Assche6, Reference Desai, Babu and Ross7
The kidney is a key at risk organ for gestational programming due to the preferential shunting of nutrients to more critical nutrient sensitive organs.Reference Simmons, Gounis, Bangalore and Ogata8 Programmed offspring demonstrate significantly reduced nephron numbers per kidneyReference Schreuder and Nauta9–Reference Chen and Chou14 and subsequent hypertension in the adult.Reference Chen and Chou14, Reference Brenner and Mackenzie15 The mechanism(s) for this phenotype is unknown but may result from altered gene expression regulating ureteric branching, glomerular formation, ion transport, apoptosis, glucocorticoid responsiveness, and epigenetic modulation during renal development.Reference do Carmo Pinho Franco, Nigro and Fortes16–Reference Fowden, Giussani and Forhead18
Nephrogenesis is regulated by stage specific transcription and growth factors, many of which are potential candidates for MUN mediated programming. Mutation or deletion of ureteric bud branching factors, such as glial derived neurotrophic factor (GDNF) and rearranged during transfection (RET), as well as others, results in reduction of nephron number.Reference Pichel, Shen and Sheng19–Reference Zhang, Quinlan and Hoy21 In the rat, ureteric bud branching occurs from embryonic day (E)11 to approximately birth with GDNF as the first well-defined growth factor.Reference Shah, Sampogna, Sakurai, Bush and Nigam22, Reference Durbec, Marcos-Gutierrez and Kilkenny23 We previously reported MUN mediated downregulation of several members of the GDNF signaling pathway at E20Reference Abdel-Hakeem, Henry and Magee24 including GDNF and down-stream bud branching factors WNT4 (combination of Wg [wingless] and Int [integration site]s) and WNT11. We also demonstrated dysregulation of WT1 (Wilms tumor 1) and paired box 2 (PAX2), factors that regulate the mitogenic activity of GDNF. However, it is not known how this MUN-associated reduction in GDNF signaling is mediated to effect nephrogenesis. GDNF signaling is complex and has been shown to involve multiple signal transduction pathways including extracellular signal-regulated protein kinase (ERK), p38 mitogen-activated protein kinase (MAPK, p38), and c-Jun N-terminal kinase/stress-activated protein kinase.Reference Hida, Omori and Awazu25 These pathways have been implicated in branching morphogenesis and their inhibition reduces cell proliferation and alters matrix organization.Reference Zhang, Quinlan and Hoy21, Reference Shah, Sampogna, Sakurai, Bush and Nigam22, Reference Hida, Omori and Awazu25, Reference Fisher, Michael, Barnett and Davies26 Additionally, the activation of ERK in the ureteric bud is dependent upon GDNF.Reference Fisher, Michael, Barnett and Davies26, Reference Tang, Cai, Tsai, Wang and Dressler27 Therefore, we hypothesized that MUN programming is mediated, at least partially, through both the GDNF and MAPK/ERK signaling pathways. In this study, we examined several time points in nephrogenesis and found that the co-receptor for GDNF binding, growth factor receptor alpha 1 (GFRα1), was downregulated and that phosphorylation of MEK1/2 (mitogen-activated protein kinase kinase) and ERK1/2 are reduced at fetal stage E20, although not their steady state. This effect persists after birth (P1), but is normalized by 3 weeks of age when nephrogenesis is completed. These data suggest fetal signaling events are impacted by MUN and provide a possible mechanism for reduced nephron number.
Methods
Animal preparation
Studies were approved by the Animal Care and Use Committee of the Los Angeles BioMedical Research Institute at Harbor-UCLA Medical Center and were in accordance with the American Association for Accreditation of Laboratory Care and National Institutes of Health guidelines. A model of rat dams that were 50% food-restricted (MUN) during pregnancy was used. First-time pregnant Sprague Dawley rats (Charles River Laboratories, Hollister, CA, USA) were housed in a facility with constant temperature and humidity and a controlled 12:12-hour light/dark cycle. At 10 days of gestation, rats were provided either an ad libitum diet of standard laboratory chow (Lab Diet 5001, Brentwood, MO, USA; protein, 23%; fat, 4.5%; metabolizable energy, 3030 kcal/kg) or a 50% food restricted diet that was determined by quantification of normal intake in the ad libitum fed rats. The respective diets were given from 10 days of pregnancy until the end of gestation (E22).
Newborn offspring
At postnatal day (P)1, pups were culled to eight (four males and four females) per litter to normalize rearing and both control and MUN offspring were cross fostered and nursed by ad libitum fed dams. P1 non-cross fostered and P21 pups (end of lactation) were sacrificed, visually sexed, kidneys removed and snap frozen in liquid nitrogen. Only male P1 and P21 kidneys were used in this study.
Fetal kidney removal
The dams (six control and six MUN) were anesthetized with isoflurane, and fetuses were quickly removed and placed on ice-cold dishes. Litter sizes ranged from 12–16. Fetuses from dams with < 12 or more than 16 fetuses were not used. Fetuses were dissected, intact kidneys removed and kidneys flash frozen in liquid nitrogen. Due to the limiting size of the E20 kidneys, kidneys were pooled from unsexed fetuses derived from each dam for a total of six control and six MUN pools, with approximately 4–5 kidneys per pool. Several (3–4) fetal kidneys derived from each dam were placed in 4% paraformaldehyde for immunohistochemistry.
Glomerular counting of P21 kidneys
Glomerular counting was performed as reported previously.Reference Mansano, Desai, Garg, Choi and Ross28 Male offspring from control and MUN dams (n = 5 each group) were sacrificed at 21 days. Kidneys were weighed; poles were removed from one kidney per animal and the central half of each kidney subsequently was fixed in formalin. Kidneys were sectioned sagittally and stained with periodic acid-Schiff and periodic acid methenamine silver. For each animal, two sections of kidney were analyzed. All glomeruli in each section were counted. The entire cortical surface area was determined using computer-assisted image analysis. Digital images were captured at ×4 magnification, the cortical area outlined, and Image J software (National Institutes of Health) was used to determine the cortical cross-sectional area. The glomerular number per unit area was determined for each animal as follows: total number of glomeruli/cortical surface area (μ 2).
Blood pressure determination
At 12 weeks of age, blood pressure was measured in male rats (n = 5 each group) using a tail-cuff sphygmomanometer (ML125 NIPB System, AD Instruments, Colorado Springs, CO, USA) method. Briefly, the offspring were handled daily and acclimatized to the restrainer 1 week prior to obtaining the first blood pressure. On the day of measurement, after a 30 min equilibration period during which no readings were done, five consecutive recordings of blood pressure were taken and the mean values determined.
Protein isolation and Western blotting
The primary and secondary antibodies were: MEK1/2 (Cell Signaling L38C12): primary 1 : 1000, secondary 1 : 10,000; phosphorylated (pMEK)1/2 (Cell Signaling 9121, Ser217/Ser221): primary 1 : 500, secondary 1 : 10,000; GFRα1 (Santa Cruz SC-74045): primary 1 : 500, secondary 1 : 10,000; RET (Santa Cruz SC-167): primary 1 : 200, secondary 1 : 3000; GDNF (Santa Cruz SC-13147): primary 1 : 500, secondary 1 : 10000; ERK1/2 (Cell Signaling 9102): primary 1 : 1000, secondary 1 : 10000; phosphorylated ERK (pERK)1/2 (Cell Signaling 9101, Thr202/Tyr204): primary 1 : 500, secondary 1 : 10,000; β-actin (Sigma A5441): primary 1 : 10,000, secondary 1 : 10,000. Secondary horseradish peroxidase conjugated antibodies were anti-goat (Santa Cruz SC-2020), anti-rabbit (Bio-Rad 170-6515), and anti-mouse (Bio-Rad 170-6516). All commercial antibodies were optimized for binding specificity and bands depicted have the expected molecular weights. As GDNF and RET previously were evaluated by us at E20Reference Abdel-Hakeem, Henry and Magee24, they were not assessed in this study at this time point. All primary antibodies were used for P1 and P21 assays.
Protein extraction
Protein was extracted in radioimmuno precipitation assay buffer that contained protease inhibitors (HALT cocktail, Pierce) by homogenization of frozen kidneys on ice. Supernatants were clarified by 20 min microcentrifugation at 12,000 g. Supernatant protein concentration was determined by bicinchoninic acid solution (Pierce, Rockford, IL, USA). Supernatants were frozen at −80°C until use.
Western blot
Protein expression was analyzed as previously done by our groupReference Abdel-Hakeem, Henry and Magee24, Reference Choi, Tosh and Garg29 and each blot was performed at least twice. For control and MUN 4–6 samples were run. Equal amounts of protein (25 μg) were mixed with Criterion sodium dodecyl sulfate sample buffer (Bio-Rad), boiled for 5 min, and separated on a Criterion 4–12% Bis-Tris denaturing gel.Reference Mansano, Desai, Garg, Choi and Ross28 The separated proteins were transferred electrophoretically to a nitrocellulose membrane (Bio-Rad) for 2 h at 120 volts, 4°C. Nonspecific antibody binding was blocked by incubation for 1 h at room temparature with 5% non-fat dry milk in Tris-buffered saline solution containing 0.1% Triton X-100 (TBST; Bio-Rad). The membrane was incubated with the appropriate primary antibody in 5% milk in TBST overnight, washed three times for 10 min each with TBST + 0.1% Triton X-100 at room temperature. Blots were incubated for 1 h with anti-goat, anti-rabbit, or anti-mouse secondary antibodies depending on the primary antibody, followed by washing as before and a final TBS only wash, each 10 min. Chemi-Glow substrate (Alpha Inotech, San Leandro, CA, USA) was used to detect the targeted protein. The band density on the X-ray film was optically scanned with a BioRad GS800 calibrated Densitometer and quantitated using BioRad Quanti-One software. Blots were stripped with Restore stripping buffer (Pierce), reprobed and normalized to the reference protein (β-actin) and presented as fold change relative to the control level (fold = 1.0). All standard errors for controls were equal to or < 0.4 fold.
Immunohistochemical analysis
E20 kidneys were fixed in 4% paraformaldehyde for 1–2 h, washed briefly in phosphate buffered saline (PBS), and incubated overnight in 30% sucrose in PBS. Kidneys next were sequentially dehydrated and embedded in paraffin. Four-micrometer paraffin sections were cut with a microtome, dried on Fisher permafrost slides (Fisher Scientific), and stored at room temperature until used.
Tissue sections were processed simultaneously for immunohistochemistry to ensure uniformity of immunostaining. Paraffin sections were dewaxed, rehydrated and subjected to antigenic retrieval by boiling with 10 mM EDTA (pH 8.5) for 5 min and cooling to room temperature in dH2O. Sections were washed followed by incubation in 1% Na borohydride for 30 min, washed again, and permeablilized with 0.6% Triton X-100 in PBS. After washing, endogenous peroxidase activity was quenched using 3% H2O2 and non-specific binding was blocked by incubating the sections with 10% goat serum, 3% bovine serum albumin and 0.6% Triton-X100 in PBS (blocking solution) for 1 h at room temperature. Sections were rinsed and endogenous biotin binding sites were blocked with avidin–biotin solutions according to the manufacturer’s instruction (Vector Laboratories, Burlingame, CA, USA). Sections were incubated overnight at room temperature with primary antibody recognizing the phosphorylated form of ERK1/2 (Cell Signaling 9101), diluted 1 : 100 in blocking solution. After rinsing, slides were incubated at room temperature for 1 h with biotinylated anti-goat secondary antibody diluted in blocking buffer (1 : 250 dilution), washed and incubated for 1 h with the avidin–biotin complex (Vectastain ABC kit; Vector Laboratories), washed in PBS and incubated for 6 min with 3,3-diaminobenzidine (Sigma-Aldrich, St Louis, MO, USA). Sections were counter stained with Mayer’s haematoxylin (Sigma) and coverslipped with permount. Intense brown staining was regarded as strongly positive, brown as positive and light brown as weakly positive. Negative control sections were incubated with non-immune serum instead of primary antibody and no immunoreactivity was observed (data not shown). All sections were examined with a photomicroscope and digital images taken. Quantitative evaluation of the stained sections was performed by computerized densitometry using Image Pro, version 5.02, software program (Media Cybernetics, Silver Spring, MD, USA), coupled to a Leica microscope equipped with a Spot RT digital camera. After images were calibrated for background lighting, the integrated optical density per area for stained regions was determined as in a previous study.Reference Cantini, Ferrini and Vernet30 Twelve fields were measured per kidney, with three kidneys evaluated for both control and MUN.
Statistics
Differences between control and MUN groups were compared by unpaired t-test. P-value ⩽ 0.05 was considered significant. Means were transformed into fold changes and s.e.m., and expressed as a percentage proportional to the original mean and s.e.m.
Results
MUN offspring phenotype
We have previously shown that 50% MUN from E10 to birth reduces both maternal and newborn offspring weights, which then increase rapidly while nursing on cross-fostered control dams.Reference Desai, Gayle, Babu and Ross31, Reference Jelks, Belkacemi and Han32 We examined whether nephron number and blood pressure are affected by our MUN model. Offspring kidney phenotype was evaluated at weaning 21 days (P21) and blood pressure at 12 weeks. At 3 weeks of age, the total glomerular number was decreased in male MUN offspring by 19% compared with controls (4.4 + 0.7 glom/μ2v. 5.4 + 0.6 glom/μ2, P ⩽ 0.05). Measurement of systolic blood pressure of male MUN and control offspring at 12 weeks of age revealed significantly higher blood pressure in the MUN offspring compared with controls (152 ± 3 v. 146 ± 2 mmHg, P ⩽ 0.05).
Protein expression at the fetal E20 stage
Western blot analysis was used to examine the expression of the GDNF co-receptor GFRα1 following MUN treatment of rat dams. Figure 1 shows a significant reduction in GFRα1 protein expression (0.64 fold, P = 0.05; Table 1) in MUN kidneys as compared to controls (n = 5). Previously, we reported a significant reduction of GDNF gene and protein expression in E20 MUN kidneys, but no alteration of its receptor RET.Reference Abdel-Hakeem, Henry and Magee24

Fig. 1 Downregulation of glial derived neurotrophic factor and mitogen-activated protein kinase/extracellular signal-regulated protein kinase (ERK) pathway factors growth factor receptor alpha 1 (GFRα1), mitogen-activated protein kinase (MEK), phosphorylated MEK (pMEK)1/2, extracellular signal-regulated protein kinase (ERK), and phosphorylated ERK (pERK)1/2 at embryonic day 20 by protein expression. Western blotting of 4–6 control v. maternal under-nutrition (MUN) kidney lysates, normalized to β-actin.
Table 1 Protein expression

E, embryonic day; P, postnatal day; GDNF, glial derived neurotrophic factor; RET, rearranged during transfection; GFRα1, growth factor receptor alpha 1; MEK1/2, mitogen-activated protein kinase; pMEK1/2, phosphorylated MEK; ERK1/2, extracellular signal-regulated protein kinase 1/2; pERK1/2, phosphorylated ERK.
*P ⩽ 0.05.
We next examined the total and phosphorylated levels of the MAPK–ERK pathway members MEK1/2 and ERK1/2, representing a mitogenic signaling pathway that mediates GDNF–RET signaling in the kidney.Reference Popsueva, Poteryaev and Arighi33 Levels of phosphorylated MEK1/2 and ERK1/2 were significantly reduced at E20 in MUN offspring kidneys but total expression was unchanged (Fig. 1 and Table 1).
Protein expression postnatal at P1
The period immediately following birth results in a rapid change in kidney gene expression compared to the late gestational stage.Reference Tsigelny, Kouznetsova and Sweeney34 We examined expression during this period and found significant downregulation of both GFRα1 and pERK1/2, whereas no change was found in GDNF, RET and total ERK1/2, total MEK1/2 and pMEK1/2 (Fig. 2 and Table 1).

Fig. 2 Downregulation of glial derived neurotrophic factor (GDNF) and mitogen-activated protein kinase/ extracellular signal-regulated protein kinase (ERK) pathway factors growth factor receptor alpha 1 (GFRα1) and phosphorylated ERK (pERK)1/2 at postnatal day 1 by protein expression. Western blotting of 4–6 control v. maternal under-nutrition (MUN) kidney lysates, normalized to β-actin. RET, rearranged during transfection; MEK, mitogen-activated protein kinase; pMEK, phosphorylated MEK.
Protein expression postnatal at P21
At P21, when the kidney has completed nephrogenesis, no significant changes were identified in protein expression of GDNF, GFRα1, RET or the MAPK/ERK factors except for total expression of MEK1/2 which was significantly increased (Fig. 3 and Table 1).

Fig. 3 Protein expression for glial derived neurotrophic factor (GDNF) and mitogen-activated protein kinase/ extracellular signal-regulated protein kinase (ERK) pathway factors at postnatal day 21. Western blotting of 5–6 control v. maternal under-nutrition (MUN) kidney lysates, normalized to β-actin. RET, rearranged during transfection; GFRα1, growth factor receptor alpha 1; MEK, mitogen-activated protein kinase; pMEK, phosphorylated MEK; ERK, extracellular signal-regulated protein kinase; pERK, phosphorylated ERK.
Regional expression of pERK1/2 protein in E20 kidneys
We sought to confirm reduced expression of pERK in the kidney and to evaluate localization of this reduction to determine any differences in regional expression within the MUN kidney. We detected decreased immune staining of the active phosphorylated form of ERK in E20 kidneys by 0.62 fold (P = 0.03; Figs 4 and 5), confirming the Western data. In control E20 kidneys, pERK was strongly expressed in the nephrogenic zone in immature glomeruli, focal areas of mesenchyme and the tips of ureteric bud branches, and also in medullary collecting ducts. There was lesser staining in scattered cortical and medullary tubular cells and mature glomeruli (Fig. 4). In MUN kidneys, protein expression, while reduced in intensity, was localized proportionately within these cells and areas without regional reductions.
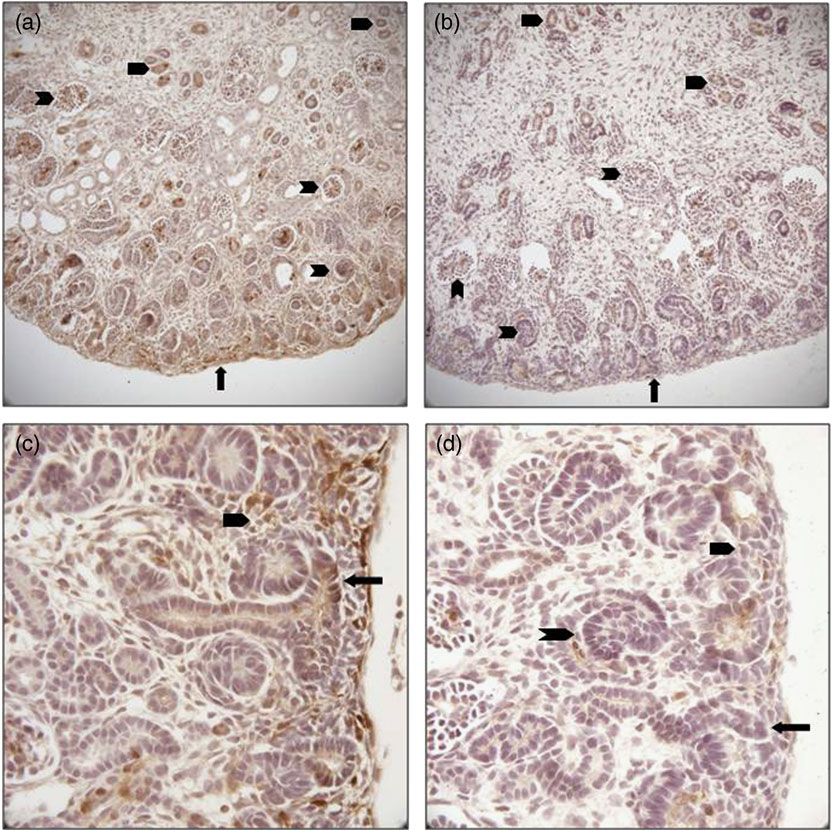
Fig. 4 (Colour online) Immunohistochemical localization of phosphorylated extracellular signal-regulated protein kinase (ERK) in embryonic day 20 fetal kidney cross-sections. (a) control demonstrating staining throughout the kidney, most prominently in the nephrogenic zone (arrow), glomeruli (notched arrowheads) and collecting ducts (un-notched arrowheads; ×100); (b) maternal under-nutrition (MUN) showing proportionally reduced staining in all areas of the kidney (×100); (c) control nephrogenic zone showing strong phosphorylated ERK staining in a ureteric bud branch tip (arrow), and metanephric mesenchyme (un-notched arrowhead; ×200); (d) MUN nephrogenic zone reveals reduced staining in the ureteric bud branch tip (arrow), metanephric mesenchyme (un-notched arrowhead) and immature glomerulus (notched arrowhead; ×200).

Fig. 5 Immunohistochemical quantification of phosphorylated extracellular signal-regulated protein kinase expression in embryonic day 20 fetal kidney cross-sections. Staining was quantitated by integrated optical density measurement for 12 sections per kidney, n = 3 for control and maternal under-nutrition (MUN). *P ⩽ 0.05.
Discussion
Our study evaluated GDNF signaling pathway protein expression and MAPK–ERK signaling activity at E20, P1 and P21 time points in offspring of MUN rats. These selected time points represent discrete phases in nephrogenesis. At E20, 10 days of 50% MUN have ensued, allowing for an impact on fetal kidney gene expression. Also at E20, ureteric buds branching and mesenchymal to epithelial transformation are rapid and ongoing, with formation of intermediate glomerular stages and the beginning development of the collecting duct system. We previously reported reduction of GDNF protein expression,Reference Abdel-Hakeem, Henry and Magee24 and now report reduction of the co-receptor GFRα1, as well as reduced phosphorylation of MEK1/2 and ERK1/2 at E20. There was no change noted in protein expression of the GDNF receptor RET at this time point. At P1, GFRα1 protein expression was downregulated and phosphorylation of ERK1/2 was decreased. At P21, interestingly the total level of MEK was increased (Fig. 4). This result along with the normalization of the other factors may be due to the rapid ‘catch up’ growth previously noted in MUN rats as well as in other IUGR animal models.Reference Desai, Gayle, Babu and Ross31, Reference Jelks, Belkacemi and Han32 The fact that kidney nephron number as well as the programmed hypertensive phenotype remain suggests that the majority if not all MUN nephrogenic effects occur in the pre-natal time frame.
Our findings that GDNFReference Abdel-Hakeem, Henry and Magee24 and GFRα1 are downregulated at the fetal E20 time point suggest that mitogenic GDNF ligand signaling is reduced during active nephrogenesis in the setting of MUN. We previously reported MUN mediated downregulation of several other members of the GDNF signaling pathway at E20,Reference Abdel-Hakeem, Henry and Magee24 including downstream bud branching factors WNT4 and WNT11 and upstream factors WT1 and PAX2. GDNF was found to be reduced only at the fetal stage and not post-natally, suggesting that MUN’s programmed effects in the kidney occur primarily during gestation and are compensated for by factors expressed after birth. Indeed, large changes are seen in gene expression in the kidney immediately following birth as determined by microarray metagene analysis.Reference Tsigelny, Kouznetsova and Sweeney34 Therefore, our results agree with other studies showing that GDNF activity is most critical for initial and progressive bud branching and less so for kidney maturation after birth.Reference Orth, Ritz and Suter-Crazzolara35 The importance of GDNF signal transduction in renal development has been demonstrated in knock-out mice and in mice lacking its receptors, RET or GFRα1. These animals have no kidneys due to a failure of ureteric bud (UB) outgrowth, while mice heterozygous for GDNF have small kidneys with 30% fewer nephrons.Reference Cullen-McEwen, Drago and Bertram20, Reference Cullen-McEwen, Kett, Dowling, Anderson and Bertram36 These data, along with studies showing the ability of ectopically expressed or applied GDNF to induce the formation of supernumerary ureteric buds from the Wolffian Duct in explants of E10–11 urogenital regionsReference Vega, Worby, Lechner, Dixon and Dressler37 or in vivo,Reference Shakya, Watanabe and Costantini38 confirm the critical role of GDNF in promoting ureteric bud outgrowth. Therefore, a major effect of MUN programming likely is inhibition of ureteric branch formation, which subsequently leads to lowered glomerular numbers. How this precisely occurs is unknown.
Our finding that the receptor RET protein expression was not affected by MUN, but that the co-receptor GFRα1 was downregulated at E20 and P1, suggests several mechanistic possibilities. GFRα1 is a glycosylphosphatidylinositol-anchored co-receptor bound in lipid rafts that recruits RET in a dimer formation following GDNF ligand binding.Reference Arighi, Borrello and Sariola39 A decrease in GFRα1 availability may reduce dimer formation and activation of RET trans-autophosphorylation. Alternatively, GDNF signaling reduction may be RET independent, as suggested in previously proposed mechanisms in neurons and kidney.Reference Popsueva, Poteryaev and Arighi33, Reference Poteryaev, Titievsky and Sun40, Reference Vieira, Thomas-Crusells and Vieira41 Phosphorylation activity of RET during MUN is unknown and will be explored in future studies.
GDNF signaling of ureteric branching is poorly understood but likely involves activation of multiple signal pathways. There is evidence that early initial bud formation occurs primarily through the PI3K/AKT pathway, whereas later iterative budding, which is likely to be affected by our MUN model in mid-late gestation, occurs through the MAPK/ERK pathway.Reference Tang, Cai, Tsai, Wang and Dressler27 This is demonstrated by inhibition of ureteric branching in culture models with downregulation of ERK.Reference Hida, Omori and Awazu25, Reference Fisher, Michael, Barnett and Davies26In vitro amino acid substitution for tyrosine 1062 of RET9, which blocks activation of ERK, results in severe defects in UB branching in vivo.Reference Wong, Bogni and Kotka42, Reference Jain, Encinas, Johnson and Milbrandt43 Additionally, treatment of kidney explants with anti-GDNF antibodies reduces both branching and ERK phosphorylation.Reference Fisher, Michael, Barnett and Davies26 Treatment with MAPK pathway antagonists blocks tubular and nephron formation in vitro as shown by PD98059, a MAPK pathway inhibitor, reversibly blocking ureteric bud formation and branching.Reference Fisher, Michael, Barnett and Davies26 Additionally, inhibition of MEK1/2 by U0126 reduces tubular formation and glomerular number.Reference Hida, Omori and Awazu25 ERK signaling also is reported to control WNT4 expression, which is an important tubulogenesis growth factor and was found previously to be downregulated by MUN.Reference Abdel-Hakeem, Henry and Magee24, Reference Stark, Vainio, Vassileva and McMahon44 Our results support the concept that decreased GDNF signaling results, at least in part, in decreased downstream MAPK–ERK pathway activation, as evidenced by decreased phosphorylation of both MEK1 and ERK. These results again suggest gestational time points are involved in MUN dysregulation of nephrogenesis with resulting decrements in adult nephron numbers.
Restricted nutrition in both humans and animal studies reduces the number of offspring nephrons.Reference Schreuder and Nauta9, Reference Welham, Riley, Wade, Hubank and Woolf13, Reference Chen and Chou14, Reference Hoppe, Evans, Bertram and Moritz45–Reference Desai, Gayle, Babu and Ross48 Our study using Sprague-Dawley rats demonstrated that pre-natal under-nutrition programs reduced nephrogenesis and resulted in hypertension when the rats were cross-fostered to control dams. Placental insufficiency in Sprague-Dawley rats also leads to reduced nephron numbers.Reference Merlet-Benichou, Gilbert, Muffat-Joly, Lelievre-Pegorier and Leroy49 These results are in contrast to a placental insufficiency model (bilateral uterine artery and vein ligation beginning at E18) by Wlodek’s groupReference Wlodek, Mibus and Tan50 that showed normalization of both nephron number and blood pressure when restricted Wistar-Kyoto pups were cross fostered to control dams. There are several possible explanations. The difference in post-natal effects may be related to strain differences. It also is possible that vascular ligation and food restriction have subtle mechanistic differences, which are not equally responsive to correction in the lactational period. Finally, it is possible that the MUN results in a more severe nephron deficit phenotype that is inadequately normalized by post-natal control lactation. The effect of maternal nutrition in this food-restricted model requires additional studies to differentiate these possibilities. It is still unclear precisely how nephron numbers are reduced. Reduction of branch signaling may result in a decreased branch tip formation over time, and even a small decrease could result in reductions approaching 20%–40% in the adult. Alternatively, MUN dysfunction may result in reduced proliferation at bud tips, thereby tilting towards apoptotic effects. We identified expression of pERK in immature glomeruli, suggesting these pathways may play a role in glomerular formation. In fact, ERK has been detected in the proliferative, nephrogenic regions of the fetal kidney including immature glomeruli, ureteric bud branches, mesenchyme, collecting ducts, and to lesser extent maturing glomeruli.Reference Omori, Hida, Ishikura, Kuramochi and Awazu51 Therefore, reduced activity in this pathway may be a global phenomenon in the MUN developing kidney impacting development of several renal structures, as we identified reduction in pERK in all renal elements in which it is found.
In conclusion, we have identified MUN-induced dysregulation of factors impacting ureteric bud branching and mesenchymal to epithelial transformation in the developing fetal kidney at E20 and to a lesser extent at P1. Further identification of key renal genes affected by MUN at different stages of development will provide additional insights into our understanding of reduced nephron number associated with fetal growth restriction. To intervene and potentially correct this maladaptive programming, it is necessary to dissect fully these aberrant mechanisms during fetal development in order to reverse the effects in the programmed offspring.
Acknowledgements
Supported by SMFM-AAOGF fellowship award to RZM and NIH R03HD060782 to TRM. The authors thank Qinghai Liu, Linda Day, Stacy Behare, and Karina Cervantez for their technical assistance.
Statement of Interest
None.


