


Introduction
The prevalence of diabetes in pregnancy has increased worldwide. Reference Poston, Caleyachetty and Cnattingius1 In 2019, data from the International Diabetes Federation (IDF) showed that one in six pregnancies was affected by diabetes. 2 In addition to the increased prevalence of prepregnancy Diabetes mellitus (DM) (type 1 and type 2 DM) in women of reproductive age, there is a dramatic increase in the rates of gestational Diabetes mellitus (GDM), 3 with 13.6% of pregnancies affected by pregestational diabetes and 86.4% affected by GDM. 2 Clinical and epidemiological studies show that maternal hyperglycemia causes developmental programming leading to adverse long-term effects through the generations, 2 such as increased adiposity in offspring, regardless of birth weight, Reference Aris, Soh and Tint4–Reference Lowe, Lowe and Kuang6 increased susceptibility to obesity and adverse metabolic risks that can persist for as long as childhood to adulthood of offspring. Reference Godfrey, Gluckman and Hanson7,Reference Tam, Ma and Ozaki8 These changes, added to environmental factors such as consumption of a high-fat Western diet and low physical activity, significantly contribute to the increased prevalence of overweight, obesity, type 2 DM, GDM Reference Tellechea, Mensegue and Pirola9–Reference Calkins and Devaskar11 and reproductive alterations Reference Desai, Jellyman, Han, Beall, Lane and Ross12 at the adulthood of offspring, regardless of the type of maternal diabetes (pregestational diabetes or GDM). Reference Bueno, Sinzato and Volpato13
Due to several uncontrollable variables and ethical aspects involved in studies in humans, it is necessary to use laboratory animals in an extremely ethical way to mimic the conditions of pregestational diabetes and obesity models in rats. The offspring coming from hyperglycemic intrauterine environment present alterations in the metabolic profile concerning glucose tolerance. Reference Aerts and Van Assche14 The presence of maternal hyperglycemia creates an unfavorable intrauterine environment and interferes with developmental programming. Fat deposits in the periovarian region are widely observed in rodents, but this is not observed in humans, and this fat is highly analogous to the functions of visceral omental fat. Reference Tchkonia, Thomou and Zhu15,Reference Chusyd, Wang, Huffman and Nagy16 The fat accumulation or expansion occurs through the process of hyperplasia (increased number of cells) or hypertrophy (increased area/volume of cells) of adipocytes. Reference Björntorp and Sjöström17 This accumulation is found in the visceral or subcutaneous regions Reference Ahima and Flier18 and has cell specificity in each region, being more prone to hyperplasia in the subcutaneous region and hypertrophy in the visceral region. Reference Gesta, Blühet and Yamamoto19
Hypercaloric or hyperlipidic diet (HFD)-induced obesity in animal models has already proven to be effective in adipose tissue changes. Reference Tellechea, Mensegue and Pirola9,Reference de Almeida, Dias-Rocha and Reis-Gomes20–Reference Sellayah, Thomas, Lanham and Cagampang22 Mothers fed chronic HFD influences the morphology of visceral white adipose tissue of their offspring (area, diameter, and the number of adipocytes), especially in the subcutaneous region of females, compared to those that maintain the consumption of the diet after birth. Reference Lecoutre, Deracinois and Laborie23–Reference Parente, Aguila and Mandarim-de-Lacerda25
Because of the current global scenario in which maternal diabetes can interfere with fetal development plasticity and the consumption of HFD or high-calorie diet has been exponentially increasing, the study of the association of maternal diabetes and HFD consumption is relevant. We hypothesized that the offspring of diabetic mothers and those exposed to an HFD after weaning have changes in the periovarian adipose tissue. Thus, the objective of this study was to evaluate the influence of an HFD after weaning, associated or not with the hyperglycemic intrauterine environment, on the periovarian adipose tissue of adult female rat offspring.
Method
Animals
A total of 52 rats (8 males and 44 females) of the Sprague-Dawley lineage were used, acquired from the Animal Facility of the State University of Campinas (CEMIB/UNICAMP), and kept in the Animal Facility of the Laboratory of Experimental Research in Gynecology and Obstetrics, Botucatu Medical School, Unesp, under controlled conditions of temperature (22 ± 2°C), humidity (60 ± 10%) and light/dark cycle (12 h). Filtered water and food were offered ad libitum to the animals, which were kept in a polypropylene cage (three animals/cage) on wood shavings with environment enrichment (paper balls). Reference Simpson and Kelly26
Experimental sequence
An experimental sequence of parental generation (mother rats)
The experimental sequence of animals from the first generation aimed at inducing the diabetes status, which was made in females on day 5 of postnatal life (n = 10) using the beta-cytotoxic drug Streptozotocin (STZ, Sigma Aldrich®), at a dose of 70 mg/kg subcutaneously. Reference Sinzato, Klöppel and Miranda27 Females of the nondiabetic group (control, n = 6) received a volume of vehicle (citrate buffer) corresponding to the group that received the diabetogenic drug. On day 75 of life, the Oral Glucose Tolerance Test (OGTT) was performed to assess the glycemic values, which characterized the inclusion criteria of the rats. Reference Macedo, Iessi and Gallego28 For this, after six hours of fasting, a drop of blood was obtained from the distal end of the animal’s tail, which was introduced into a conventional glucometer for glycemic determination (time 0). Following, the rats received glucose solution (0.2 g/mL) via intragastric (gavage) at a dose of 2.0 g/kg of body weight. After 30, 60, and 120 min of the administration of the glucose solution, the blood glucose levels were also determined. The glucose level determination with threshold values between 140–200 mg/dL for glucose intolerance status at least two-time points during OGTT, and ≥200 mg/dL at any point of the test for confirmation of diabetes. In the control group, only rats with glycemia <140 mg/dL at least three time points during the OGTT were included. Reference Sinzato, Klöppel and Miranda27,29 The animals that received the STZ and presented an unchanged OGTT, as well as the nondiabetic rats that presented an abnormal OGTT were excluded from the respective groups, anesthetized with sodium thiopental (120 mg/kg), and killed.
Mating period, pregnancy, and breastfeeding
In adulthood, from day 90 of life onwards, the Diabetic (D, n = 8) and Control (Con = 6) rats were mated during a maximum duration of 15 days, corresponding to at least three estrous cycles, until reaching the trial number. In each propylene cage with three female rats and one male rat was used for mating, and these cages were lined with wood shavings. At the end of the afternoon, each normoglycemic male rat was placed in each cage with three females in the vivarium. The following morning, males were removed and vaginal smears were collected. After analyzing the material deposited on the slides under a biological microscope, pregnancy confirmation was performed by the presence of sperm, which was considered day zero of pregnancy (GD0). According to previous results of our studies, about 20% of diabetic rats are infertile and, of those with a positive vaginal smear, around 10% of rats did not reach pregnancy at term due to complications caused by hyperglycemia, so we started with a larger number of rats in this group. During pregnancy, the rats were kept in individual cages and the offspring were obtained through vaginal delivery to evaluate the diabetogenic environment on developmental plasticity in the female offspring. After birth, female newborns were kept with their mothers from lactation until the weaning period (22 days of life). After weaning, these animals were distributed into the corresponding experimental groups.
Experimental sequence of offspring of diabetic or control mothers (Fig. 1)
Calculation of sample size
To calculate the sample size, the mean values and standard deviations of blood glucose levels obtained in the area under the curve (AUC) from previous experiments were considered. In addition, reliability of 95%, power of 90%, and margin of error of 5% were also considered, and the calculated sample size was 5 animals per group.
Experimental groups
After weaning, the rats were randomly distributed in a pseudo-randomized manner (respecting a maximum of two rats from each litter per experimental group) into four experimental groups (n = 5 animals/group): 1. Female offspring from control mothers and who received a standard diet (FOConSD); 2. Female offspring from control mothers and who received a high-fat diet (FOConHFD); 3. Female offspring from diabetic mothers who received a standard diet (FODSD) and 4. Female offspring from diabetic mothers and who received a high-fat diet (FODHFD).
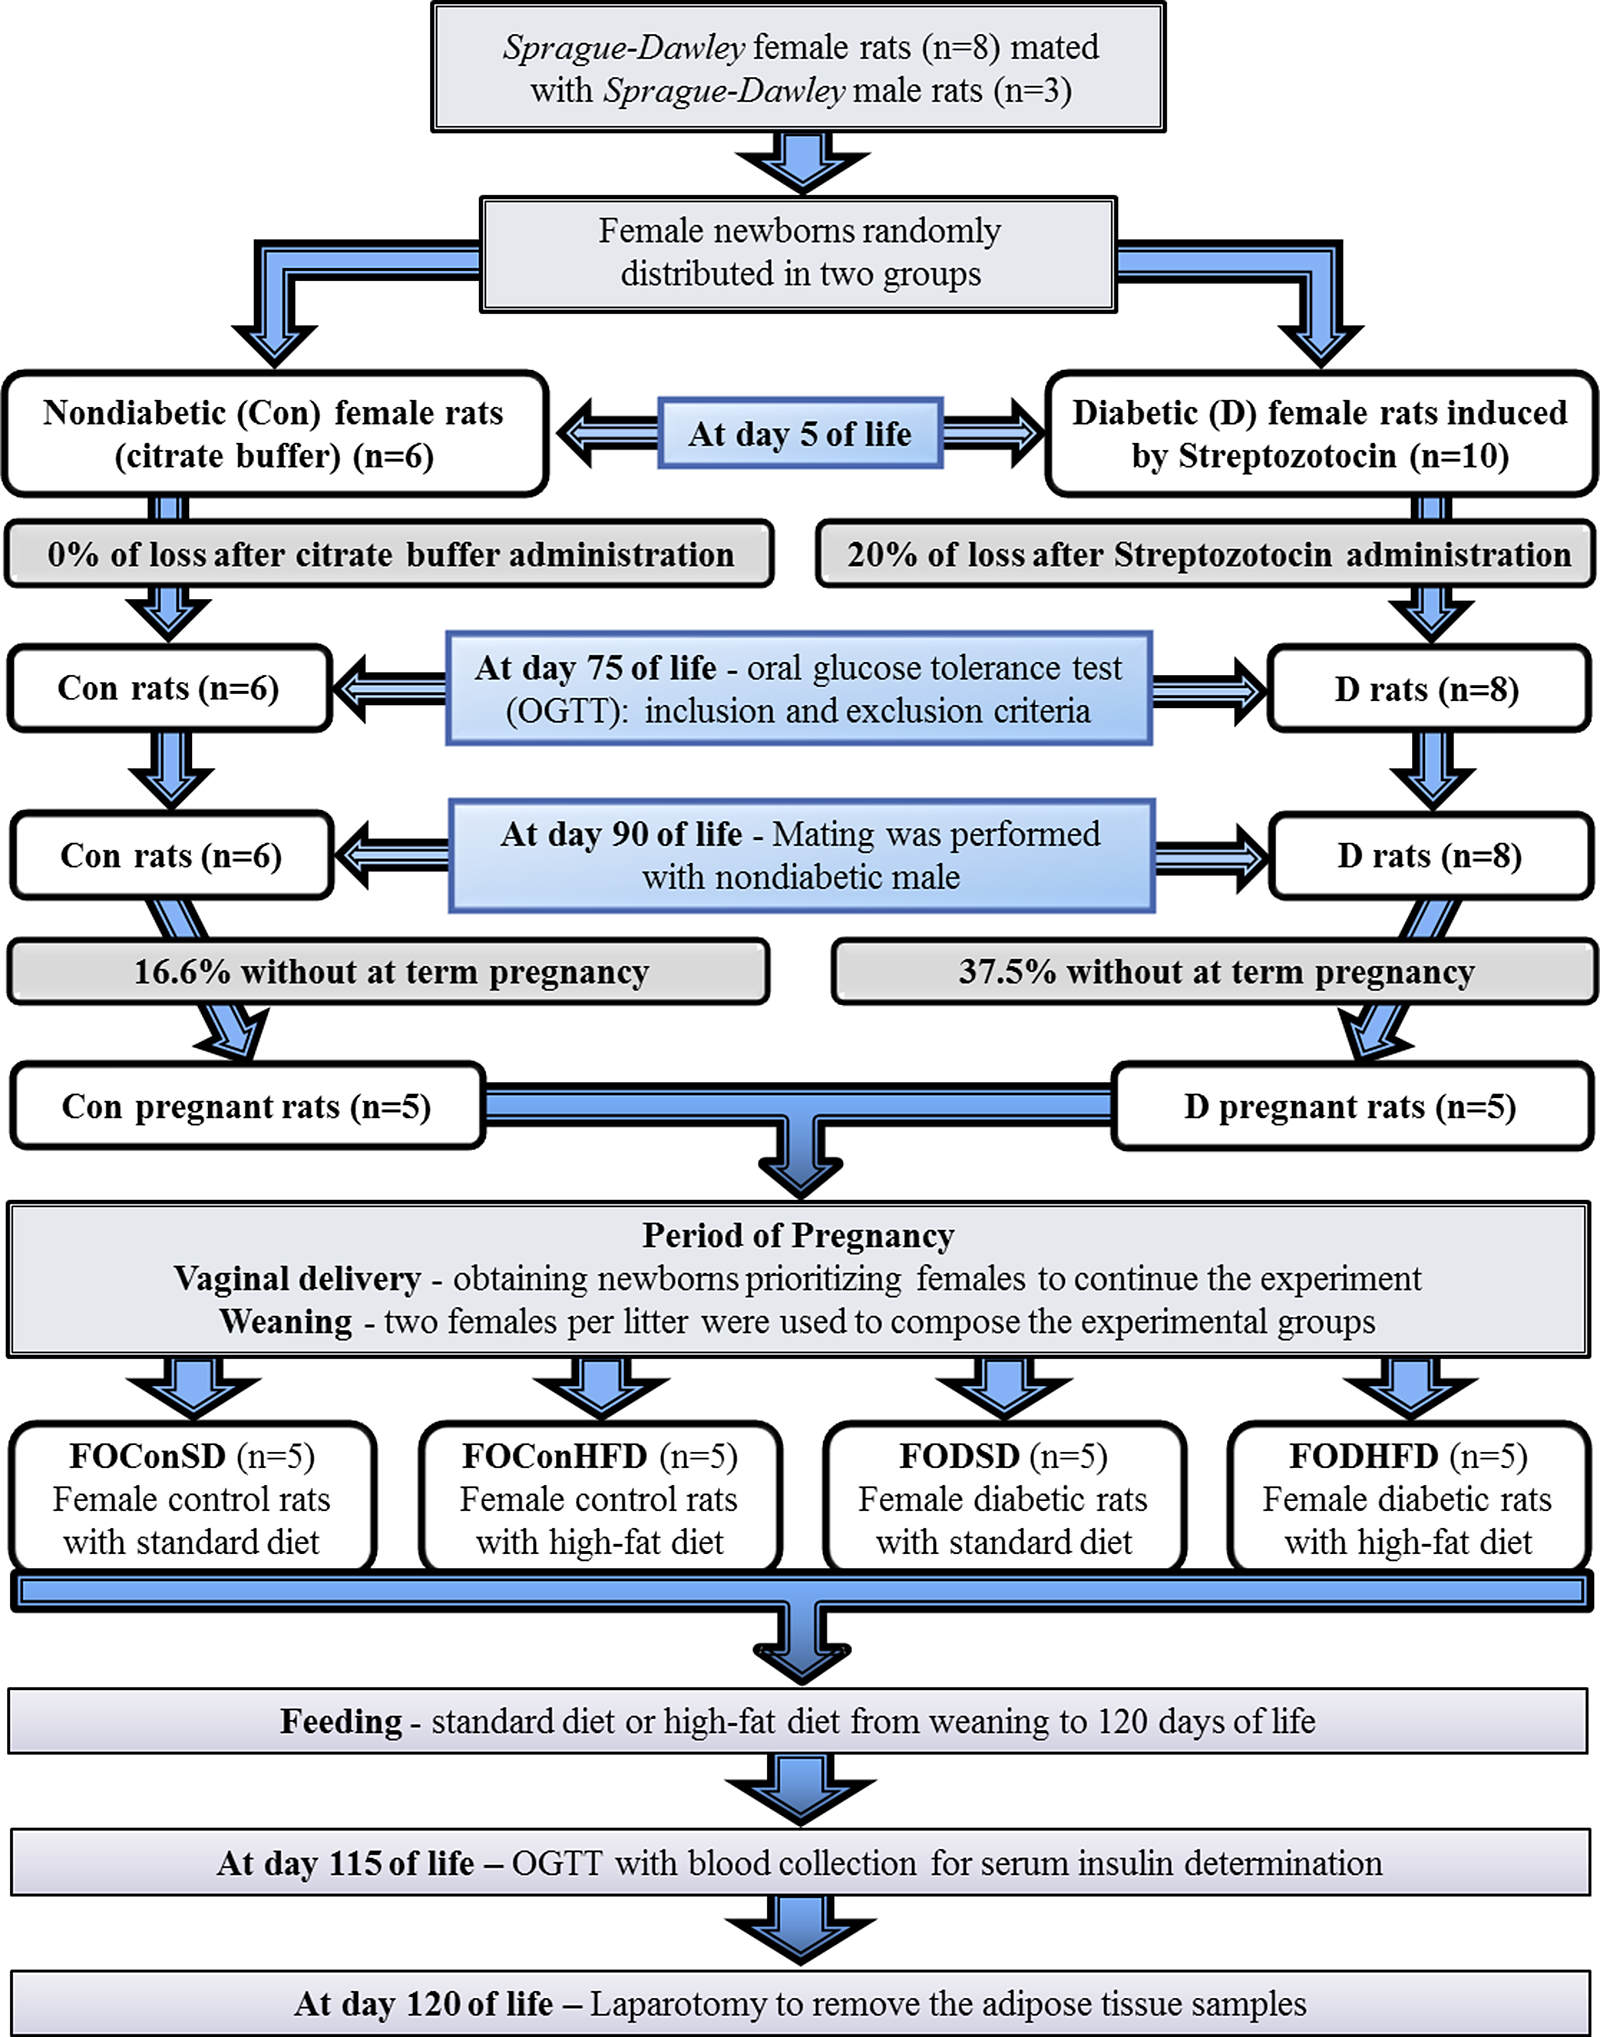
Fig. 1. Experimental design.
Standard or high-fat diet
Female offspring from control and diabetic mothers received standard commercial diet Purina chow, Purina®, Brazil (28.54% Kcal of protein, 62.65% Kcal of carbohydrate, 8.7% Kcal of fat – commercial rat food, Purina®, Brazil) or high-fat diet (HFD: 23.43% Kcal from protein, 46.63% Kcal from carbohydrates, 30% Kcal from fat) Reference Araujo-Silva, Santos-Silva and Lourenço30 according to the experimental group from weaning to adulthood (120 days of life). HFD was made at our institution and lard was the source of fat used. After preparation, the food was kept under refrigeration until consumption.
Oral glucose tolerance test
On day 115 of life, the OGTT was performed to assess glucose tolerance as described above. The total glucose response was assessed by estimating the AUC using the trapezoidal method. Reference Tai31,Reference Soares, Moraes-Souza and Carneiro32
Animal death and morphological analysis of adipocytes
On day 120 of life, the rats were anesthetized with sodium thiopental (Thiopentax® – 120 mg/kg, intraperitoneal route) and submitted to laparotomy to remove the adipose tissue samples. The total body fat was calculated by the sum of the periovarian fat + retroperitoneal fat + visceral fat. For adiposity index was used the ratio (total body fat/final body weight) × 100. Reference Taylor and Phillips33 The samples of periovarian adipose tissue were weighed, placed in a fixative solution (10% formaldehyde) for 24 hours, and then placed in 70% ethanol. The fragments were processed and embedded in paraffin for further cutting in a rotating microtome. The adipose tissue samples were stained with hematoxylin–eosin (H&E). After this process, the images were analyzed under a microscope at 20× magnification to allow for counting the number of adipocytes and calculating their areas using the ImageJ software. Large adipocytes were considered as those whose area was greater than or equal to 4.58 µm2, medium those whose area was between 1.03 and 4.57 µm2, and those whose area was lesser than or equal to 1.02 µm2 were considered as small. Reference Ibáñez, Vázquez-Martínez and León-Contreras34
Statistical analysis
For comparison of the means and standard deviation between the four experimental groups with data presenting normal distribution, Tukey´s Multiple Comparison Test was used. If the data presented abnormal distribution, Negative Binomial and Poisson Distribution with Wald’s Multiple Comparison Test was carried out. Pearson´s correlation test was used for correlation analysis. P < 0.05 was considered as the limit of statistical significance.
Results
As shown in Table 1, significant increases in body weight, total fat, periovarian adipose tissue weight, and adiposity index were found in offspring from mothers with hyperglycemia and who were postnatally exposed to a high-fat diet (FODHFD) compared to FOConSD rats. The ratio between the periovarian adipose tissue weight and the body weight showed no significant difference between the groups, as well as the ratio between the number of adipocytes and the body weight, and the ratio between the number of adipocytes and the periovarian adipose tissue weight. There was a significant increase in the ratio between adipocyte area and body weight, and in the ratio between adipocyte area and periovarian adipose tissue weight in the FODHFD group compared to the FOConSD group.
Table 1. Body weight, fat and glycemic parameters at day 120 of life of female offspring (FO) from control (Con) or diabetic (D) mothers who consumed a standard diet (SD) or high-fat diet (HFD) after weaning

AUC (area under the curve), g (gram).
Data presented as mean ± standard deviation.
* p < 0.05 – compared to the FOConSD group.
# p < 0.05 – compared to the FOConHFD group.
$ p < 0.05 – compared to the FODSD group.
a Tukey´s multiple comparison test.
b Poisson distribution with Wald’s multiple comparison test.
c Negative binomial distribution with Wald’s multiple comparison test.
The calculation of the AUC obtained during OGTT showed a significant increase in the FOConHFD, FODSD, and FODHFD groups than to the FOConSD rats, as the sum as the level of circulating glucose per minute, and the FODHFD group showed an even greater increase in these parameters compared to the other groups (Table 1).
When the correlation between the adipocyte number, adipocyte area, body weight, periovarian adipose tissue weight, total fat weight and adiposity index was evaluated, positive correlations between body weight and area of adipocytes (r = 47%, p = 0.02), as well as between the weight of the periovarian adipose tissue and the adipocyte area (r = 65%, p = 0.0006), the total fat weight and the adipocyte area (r = 66%, p = 0.0005), and the adiposity index and adipocyte area (r = 62%, p = 0.0015) were found. There was also a positive correlation between body weight and periovarian adipose tissue weight (r = 43%, p = 0.03), and between body weight and total fat weight (r = 48%, p = 0.02). The periovarian adipose tissue weight and total fat weight (r = 80%, p < 0.0001), as well as the periovarian adipose tissue weight and adiposity index (r = 78%, p < 0.0001), total fat weight and adiposity index (r = 99%, p < 0.0001) showed a positive correlation (Table 2).
Table 2. Correlation between body weight and fat parameters at day 120 0f life of the female offspring (FO) from control (Con) or diabetic (D) mothers who consumed a standard diet (SD) or high-fat diet (HFD) after weaning

* p < 0.05 – Pearson´s Correlation test
Regarding the classification of the size of adipocyte areas, there was a higher frequency of large adipocytes in the FOConHFD group compared to the FOConSD group and a higher frequency in the FODHFD group compared to the other three groups (FOConSD, FOConHFD, and FODSD). For medium-sized adipocytes, the FOConHFD rats had a higher frequency compared to the FOConSD group, but the FODHFD rats had a reduced proportion in medium-sized adipocytes compared to the other groups. As for small adipocytes, the FOConHFD group showed a higher frequency than the FOConSD group (Fig 2).

Fig. 2. Number (A) and area (B) of adipocytes, and frequency of large, medium, and small adipocytes (C) at day 120 of life of the female offspring (FO) from control (Con) or diabetic (D) mothers who consumed a standard diet (SD) or high-fat diet (HFD) after weaning. Data presented as mean ± standard deviation (A and B) and percentage (C). *p < 0.05 – compared to the FOConSD group, #p < 0.05 – compared to the FOConHFD group, $p < 0.05 – compared to the FODSD group (Poisson Distribution with Wald’s Multiple Comparison Test).

Fig. 3. Representative photomicrograph of the adipocytes. (A) Small adipocytes (pointed by arrows). (B) Medium Adipocytes (pointed by arrows). (C) Large adipocytes (pointed by arrows). Hematoxylin & Eosin staining (H&E). Magnification: 20×.
Discussion
Animal studies show that the metabolic imprint caused by the obese or diabetic intrauterine environment can be transmitted through the generations. Reference Pettitt and Knowler35 Study carried out in Pima Indians also corroborates these findings, in which maternal diabetes increased the risk for the onset of Type 2 DM in young Pima Indians, confirming the vicious cycle postulated by which “diabetes breeds diabetes”. Reference Dabelea, Hanson, Bennett, Roumain, Knowler and Pettitt36 Similar data were reported among young adults in Denmark exposed to Type 1 DM in the intrauterine period, suggesting that the effects of a hyperglycemic environment at long-term are similar regardless of the type of diabetes. Reference Clausen, Mathiesen and Hansen37 The mechanisms responsible for these effects are not entirely clear, but much research has been carried out involving animal models to better understand the epidemiology and mechanistic effects. However, the association of a hyperglycemic intrauterine environment and post-weaning exposure to a HFD has not been explored. Thus, there was an interest in studying the fusion of these variables to comprehend the repercussions in the adult life of offspring from diabetic mothers who started to consume an HFD after weaning due to the exponential increase in women with prepregnancy or gestational diabetes and due to the excessive consumption of foods rich in saturated fat during childhood, youth, and adulthood.
The present study showed that offspring who were exposed to an unfavorable intrauterine environment (maternal hyperglycemia) and who consumed an HFD after weaning had higher total fat weight, periovarian fat weight, and adiposity index, contributing to the greater body weight. These offspring (FODHFD) also had adipocytes presenting larger areas, concerning either the body weight or periovarian fat weight. The adipose tissue alterations might be related to the increase in glycemic concentrations measured during the OGTT, which confirmed a state of glucose intolerance in these animals due to the greater values of the area under the curve. Adipocytes are recognized for adipokine (cytokine) synthesis and secretion, which act on many physiological systems including appetite, energy expenditure, insulin sensitivity, and inflammation. However, an ineffective adipose expansion (or excessive visceral adipose tissue) leads to local inflammation, and insulin-resistant phenotype, Reference Gustafson, Hedjazifar, Gogg, Hammarstedt and Smith38 dyslipidemia, dysglycemia, and a predisposition to diabetes status, Reference Yki-Järvinen39 according to our results.
There was also a greater relationship among total fat weight, the periovarian adipose tissue weight and the adiposity index, and the total body weight in the FODHFD adult offspring. This relationship was also established between the increase in adipocyte area (as evidenced by the higher percentage of medium and large-sized adipocytes) with the different types of weight (body, total fat, and periovarian adipose tissue). Furthermore, there was a significant positive correlation between adiposity index and body weight in adult FODHFD females. However, none of these parameters correlated with the number of adipocytes, showing a greater effect of adipocyte hypertrophy than hyperplasia. The increase in the area and the decrease in the number of adipocytes in the adult offspring of the FODHFD group demonstrates that as larger the area of these cells as the smaller amount of cells in this tissue. Hypertrophic obesity is characterized by having adipose tissue with macrophage infiltration, which impairs the adipogenesis process (adipocyte differentiation process). This indicates that the hypertrophied adipose tissue inhibits the signaling cascade responsible for the increase in the number of cells in this tissue. Reference Goossens40 In this study, we found that HFD changed the size of adipocytes, but differently depending on the intrauterine environment to which the offspring has been exposed. There was a higher percentage of medium-sized adipocytes in offspring from nondiabetic mothers and an increase in the percentage of large adipocytes from those from diabetic mothers. In general, the HFD consumption after weaning promoted an increase in the cell size of the adipose tissue of the offspring, showing tissular hypertrophy, leading to greater fat weight. Adipose tissue with hyperplasia synthesizes and secretes pro-inflammatory adipokines in physiological amounts. In addition, it synthesizes and secretes anti-inflammatory adipokines and has protective metabolic effects. Reference Tchkonia, Tchoukalova and Giorgadze41,Reference de Queiroz, Alonso-Vale, Curi and Lima42 In contrast, hypertrophied adipose tissue synthesizes and secretes greater amounts of pro-inflammatory adipokines, Reference Rosenbaum and Leibel43 which negatively contributes to the appearance of other comorbidities in the adult female offspring.
Our study showed that this association of maternal diabetes and HFD consumption after weaning exacerbated the size of adipocytes, obtained from the periovarian adipose tissue, leading to adipocyte hypertrophy. This finding might be explained by the fact that the HFD caused an imbalance between consumption and energy expenditure, Reference Bouchard44,Reference Swinburn, Sacks and Hall45 driving more to the consumption, which resulted in the storage of energy in adipocytes in the form of triglycerides through lipogenesis. Reference Chouchani and Kajimura46
The evaluation of the molecular effects involved in the regulation of lipogenesis, especially regarding the PPAR (Peroxisome proliferator-activated receptor) pathway has been widely investigated. However, there is a need to further investigate the cascade of biochemical changes involved in lipogenesis considering the transgenerational repercussions. So, this encourages further studies to be carried out to unite the molecular and biochemical information involved in this process.
The increased size of adipocytes in females of the FODHFD group verified in our findings is related to a greater total fat weight, periovarian adipose tissue weight, adiposity index, and, consequently, an increase in body weight. Another explanation would be that, while maternal glucose is transferred to the fetus via the placenta, maternal insulin does not cross the placental membrane due to its molecular weight. Faced with maternal glycemic stimulation, the fetal pancreas responds to this glucose overload and synthesizes additional insulin. Hyperinsulinemia, in turn, acts as a fetal growth hormone leading to fetal growth and adiposity. Reference Dabelea and Crume47,48 The relationship between maternal blood glucose and neonatal adiposity is very important for understanding and possible influence on the development of future obesity.
Excess adipose tissue in the visceral compartment leads these nonesterified free fatty acids (NEFA) to spread to non-adipose tissues such as the liver, skeletal muscle, and pancreas. In the liver and skeletal musculature, the NEFA deposit causes a reduced insulin sensitivity in these tissues. As a consequence, there is increased hepatic glucose synthesis and lower glucose uptake by skeletal muscle. NEFA can also act on the pancreas and destroy pancreatic beta cells, decreasing insulin secretion. Taken together, the cellular defects lead to insulin resistance throughout the body, progressing to hyperglycemia and later to diabetes itself. Visceral adipose tissue is also secreting lower levels of insulin-sensitizing hormones, such as adiponectin, which further contribute to peripheral insulin resistance. Reference Muhlhausler and Smith49
Children exposed to diabetes and/or maternal obesity during pregnancy are at greater risk of becoming obese and developing Type 2 DM at a young age. Many of the offspring (female) become obese and have diabetes or abnormal glucose tolerance by the time they reach the fertile stage, thus perpetuating the cycle. Over generations, this cycle likely increases the risk and/or anticipates the onset of obesity and Type 2 DM. Reference Dabelea and Crume47 Despite growing evidence that exposure to intrauterine diabetes is associated with diabetes on the offspring and may be responsible for the early onset of a disease of adulthood, it is not known whether this exposure associated with the consumption of a HFD exacerbates the metabolic abnormalities that are precursors of DM2 and/or obesity in adulthood. In our findings, we found that female rats who consumed HFD, or who were exposed to maternal diabetes or who were subjected to the association of these two conditions had hyperglycemic peaks, with a diagnosis of glucose intolerance, confirmed by the glycemic values obtained in the calculations of the area under the curve. Impaired insulin secretion has also been proposed as a possible mechanism, but whether this is a transient phenomenon or whether it leads to impaired glucose tolerance later in life is still under discussion.
Considering all of the information above described and the developmental critical window, especially the period of formation and development of white adipose tissue in the fetus, a maternal insult may determine vulnerability to possible environmental aggressions, such as the HFD consumption. Reference Tang and Lane50
In conclusion, the hyperglycemic intrauterine environment, associated with the HFD consumption by the offspring, increases the size of adipocytes, leading to hypertrophy, which contributes to the greater weight of periovarian fat, total fat, and, consequently, in greater body weight and its adiposity index. Furthermore, the association between maternal diabetes and postweaning HFD consumption resulted in glucose intolerance in offspring, confirming the intergenerational effect of diabetes and exacerbation after another environmental insult. Thus, it is necessary to understand the repercussions of intrauterine and postnatal insults, so that it is possible to reduce the prevalence of obesity and type 2 diabetes in the next generation and, consequently, benefits for future generations.
Acknowledgements
The authors thank the students of the research team of the Experimental Laboratory on Gynecology and Obstetrics, Botucatu Medical School/Unesp; to Mr. Danilo Chaguri and Jurandir Antonio, for the care and maintenance of the animals.
Financial support
The authors thank the FAPESP (The São Paulo Research Foundation) for the financial assistance granted (Grant Number: 2016/25207-5), and CAPES (Coordination for the Improvement of Higher Education Personnel) for C M Saullo’s fellowship.
Conflicts of interest
No conflicts of interest to this article have been reported.
Ethical standards
The authors assert that all procedures contributing to this work comply with the ethical standards of the relevant national guides on the care and use of laboratory animals (Guide for the Care and Use of Laboratory Animals) and has been approved by the institutional committee (Protocol number CEUA 1335/2019).


