Introduction
There is a relationship between environmental factors during early life and the development of diseases during adult life. Reference Lillycrop and Burdge1–Reference Gentner and Leppert4 Therefore, the study of the environment’s influence on the physiological changes occurring during the pre- and postnatal stages is fundamental to understand and control pathological processes. Maternal milk contributes to the nutrition of the newborn at an early age, a key stage of development. Thus, lactation may be considered an important environmental factor with profound implications in adult health.
Maternal milk has nutritional components and non-nutritional bioactive compounds that allow offspring survival and a healthy development. Reference Ballard and Morrow5,Reference Iyengar and Walker6 Several components of milk could be responsible for modulating the expression of the infant’s genes through epigenetic regulation. Reference Melnik and Schmitz7–Reference Hartwig, De Mola, Davies, Victora and Relton11 One of the main epigenetic processes is DNA methylation that occurs mainly within CpG dinucleotides located in the promoter region of a given gene. Reference Cutfield, Hofman, Mitchell and Morison12–Reference Waterland and Michels15 Epigenetic processes are essential to determine when and where specific genes are expressed, thus inducing profound changes in the phenotype associated with modifications in the susceptibility to diseases.
Of all cancerous diseases, breast cancer is the most common malignancy among women all over the world. The causes of this disease are associated with multifactorial processes. There are risk factors that can be intervened, such as alcohol consumption, overweight, obesity, lack of physical activity, and type of food. Reference Danaei, Vander Hoorn, Lopez, Murray and Ezzati16 A meta-analysis on breastfeeding and breast cancer revealed a lower risk of breast cancer in pre-menopausal women who had been breastfed when infants. Reference Martin, Middleton, Gunnell, Owen and Smith17
The mammary gland, unlike most other organs of the body, reaches its functional maturity in postnatal stages. Reference Geddes18,Reference Russo and Russo19 In humans, the first 2 years of life constitute a critical period for the morphological development and cellular differentiation of breast tissue. Reference Javed and Lteif20,Reference Naccarato, Viacava and Vignati21 Infants have wide variations in the degree of glandular development (branching of the ductal tree and formation of acini) and the functional differentiation of the ducts and acini lining cells. Reference Howard and Gusterson22 These variations may be due to differences in nutrition during the postnatal period. The epigenetic changes induced by breastfeeding during the postnatal stage could lead to modifications in the mammary gland development or structure, which influence its susceptibility to factors that can initiate the carcinogenic process later in life. Reference Waterland and Michels15
The rodent mammary gland has structures at the ends of the growing ducts called terminal end buds (TEBs). These structures are maximal when the animal is 21 d old, when they begin to differentiate into smaller buds or alveolar buds (ABs). The TEBs are recognized as the sites where mammary carcinogenesis begins when exposed to a carcinogen and, therefore, a greater number of TEBs correlates with a greater predisposition for cancerous development. Reference Russo, Gusterson, Rogers, Russo, Wellings and van Zwieten23,Reference Russo and Russo24 In humans, there are structures similar to TEBs called terminal duct lobular units (TDLUs). Both the TEBs and the TDLUs present a high rate of cell proliferation, making them the primary source of the majority of breast cancer precursors. Reference Figueroa, Pfeiffer and Patel25,Reference Russo and Russo26
There are several genes involved in the alveolar mammary cell differentiation process. The transcription factor Stat6 stimulates alveolar differentiation and proliferation potentially by transcriptional induction of Gata3. Reference Haricharan and Li27,Reference Khaled, Read and Nicholson28 Gata3 is the most highly enriched transcription factor in the mammary epithelium of pubertal rodents. It is located in the cellular body of TEBs and the mammary ducts luminal cells. Its function is to maintain active epithelial differentiation in the adult mammary gland, thus posing important implications in the development of breast cancer. Reference Kouros-Mehr, Slorach, Sternlicht and Werb29 In addition, Pinc is a non-coding RNA that can confer epigenetic modifications in post-pubertal epithelial cells to negatively regulate mammary alveolar differentiation. Reference Shore, Kabotyanski and Roarty30 On the other hand, Tbx3 is a necessary protein for the normal development of the mammary gland, since it plays an important role in the mammary ductal tree growth. Reference Rowley, Grothey and Couch31
We recently studied the effects of high maternal milk intake during postnatal life on mammary cancer development in adult life. For this, an in vivo model of a differential consumption of maternal milk was established. We showed that animals that maintained a higher intake of maternal milk had a lower incidence and longer latency of mammary cancer in adulthood, with respect to animals that maintained a lower consumption of milk. We also proved that the tumors have a proliferation cell rate reduction and apoptosis rate increased in high maternal milk consumption animals. Reference Santiano, Zyla and Campo Verde-Arboccó32
In the present study, we evaluate the mechanisms by which the consumption of maternal milk can modify the susceptibility to mammary carcinogenesis. For this purpose, we used animals that maintained the different consumption of maternal milk to analise (1) the changes in the morphology of the mammary gland, (2) the modifications in the expression of genes involved in the processes of differentiation and the normal development of mammary tissue (Stat6, Gata3, Pinc, Tbx3), and (3) if there are variations in the methylation of genes (Stat6, Gata3) that participate in the differentiation of the mammary alveolar cell.
Materials and methods
Postnatal litter size adjustment
Female Sprague Dawley rats bred in our laboratory were used. The animals were kept in a light (lights on 06:00–20:00 h) and temperature (22–24°C) controlled room. One day-old pups (n = 72) born on the same day were distributed at random in litters of different sizes: 3 (L3), 8 (L8), or 12 (L12) pups per dam, to induce a differential consumption of maternal milk as previously described. Reference Santiano, Zyla and Campo Verde-Arboccó32 Fostering of 1-d-old pups of the Sprague Dawley strain does not lead to any adverse effect. Reference Barbazanges, Vallée and Mayo33 Body weight of pups was monitored every 3 d.
On Day 21, the litters were weaned and fed with rat chow (Cargill, Argentina) and tap water ad libitum until the end of the experiment. They were housed in cages containing approximately six rats from the same group per cage. In this way, we obtained three groups of rat’s growth with different levels of lactation, as we have previously demonstrated Reference Santiano, Zyla and Campo Verde-Arboccó32 : L3 (n = 24), L8 (n = 24), and L12 (n = 24).
Sample collection
Six animals from each group were sacrificed on Day 21 by decapitation, and the right inguinal mammary glands were removed for the complete assembly of the organ (Whole Mount technique). Day 21 of age was chosen because it is the usual day of weaning in rats and it is the earliest pre-pubertal stage of the mammary gland. The remaining animals (n = 54) were sacrificed at 55 d of age by decapitation. The two inguinal mammary glands were removed, one for the whole mount, and the other as a sample for genetic and epigenetic studies. Day 55 of age represents a post-pubertal stage of the mammary gland and the rats show the maximal sensitivity to carcinogenic transformation as we have previously described. Reference Santiano, Zyla and Campo Verde-Arboccó32 All the animals were decapitated between 10:00 and 12:00 h.
Hormone determinations
Animals were sacrificed on Day 55 of life regardless of the phase of the estrus cycle. At the time of sacrifice, the trunk blood was collected and allowed to clot at room temperature. Serum was separated by centrifugation and stored at −20°C until assayed for hormone determinations. Serum levels of estradiol and progesterone were determined by electrochemiluminescence in Roche’s Cobas e411 system following the manufacturer instructions.
Mammary gland whole mounts
Whole mounts of the mammary glands were performed on Days 21 and 55 of life, in animals that maintained differential lactation. Once the animal was euthanized, we separated the mammary gland from the skin using sharp scissors, and immediately it was spread onto a slide. Then, the slide was placed in a container carrying Carnoy’s fixative (75% glacial acetic acid and 25% absolute ethanol) at room temperature for 2 d. Subsequently, they were dipped into 70% ethanol at room temperature for 1 h, rinsed with distilled water for 30 min and placed in a Carmine Alum coloring solution (1 g of carmine and 2.5 g of aluminum potassium sulfate – Sigma Aldrich, USA – in 500 ml of distilled water, the solution was boiled 20 min, filtered and refrigerated) for 2 d, until the lymph nodes were found to be stained. Then we proceeded to dehydrate in increasing concentrations of ethanol: 70%, 95%, and 100%. Finally, we placed the glands in xylene at room temperature for 2 d. Reference de Assis, Warri, Cruz and Hilakivi-Clarke34 Then, we proceeded to mount the glasses with synthetic Canada balsam (Biopack, Argentina). Images were captured with an Eclipse E200 microscope coupled to a digital camera with 5.0 M resolution, and were analyzed with Micrometrics SE Premium (both from Nikon Corp., Japan) under magnification of 100×.
In order to evaluate mammary epithelial growth on Day 21 (pre-pubertal age), we measured the length of the epithelial tree considered as the distance from the nipple to the end of the epithelial tree. Reference de Assis, Warri, Cruz and Hilakivi-Clarke34 We also measure the width of the epithelial tree considered from one end of the tree to the other, in the widest region. On Day 55 (post-pubertal age), the growth of the epithelial tree was evaluated by measuring the distance from the lymph node to the end of the epithelial tree and the distance from the tip of the epithelial tree to the end of the fat pad. Reference de Assis, Warri, Cruz and Hilakivi-Clarke34 All measurements were considered in millimeters using a ruler. In addition, we evaluated the potential for malignant transformation through the count of TEBs under the microscope. Between 10 and 18 fields per mammary gland were analyzed, with an area of 2.36 mm2 per field. The number of fields analyzed per sample was necessary to cover the entire mammary surface. Subsequently, the density of TEBs per field was determined using the following formula: Total number of TEBs/number of fields analyzed. The analysis of TEBs was performed in double-blind by two independent observers.
The number of TEBs and the measurements of the mammary tree of each animal were normalized by the respective body weight and they are expressed per 100 g of the animal.
RNA isolation and real-time RT-PCR analysis
Total RNA was isolated from 150/200 mg of mammary tissue using TRI Reagent® (Sigma Aldrich, Argentina) according to the manufacturer’s instructions. Ten micrograms of total RNA were reverse transcribed (RT) at 37°C using random hexamer primers and Moloney Murine Leukemia Virus Retrotranscriptase (MMLV, Invitrogen-Life Technologies, Argentina) in a 20 μL reaction mixture.
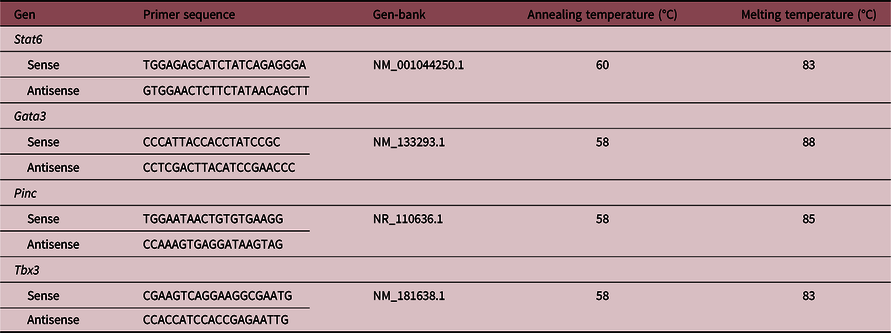
The primers were designed with the Primer-BLAST tool (www.ncbi.nlm.nih.gov) and used for genes determination (Table 1). The PCR reactions were performed using a Corbett Rotor-Gene 6000® Real-Time Thermocycler (Corbett Research Pty Ltd, Australia) and Eva-Green™ (Biotium, Hayward, USA) in a final volume of 10 μL. The reaction mixture consisted of 1 μL of 10× PCR Buffer, 0.5 μL of 50 mM MgCl2, 0.2 μL of 10 mM dNTP Mix (Invitrogen, Argentina), 0.5 μL of 20× Eva Green, 0.125 μL of 5 U/μL Taq DNA Polymerase (Invitrogen, Argentina), 0.05 μL of each 50 pM primer (forward and reverse primers), and 5 μL of diluted cDNA. The PCR reactions were initiated with 5-min incubation at 95°C, followed by 40 cycles of 95°C for 30 s, 30 s at the annealing temperatures shown in Table 1 and 72°C for 30 s. A melt curve analysis was used to check that a single specific amplified product was generated. Real-time quantification was monitored by measuring the increase in fluorescence caused by the binding of EvaGreen™ dye to double-strand DNA at the end of each amplification cycle. Relative expression was determined using the Comparative Quantitation method of normalized samples in relation to the expression of a calibrator sample, according to the manufacturer’s protocol. Reference Pfaffl35 Each PCR run included a no-template control and a sample without retrotranscriptase. All measurements were performed in duplicate. The reaction conditions and quantities of cDNA added were calibrated so that the assay response was linear with respect to the amount of input cDNA for each pair of primers. RNA samples were assayed for DNA contamination by performing the different PCR reactions without prior RT. Relative levels of mRNA were normalized to the Hypoxanthine Guanine Phosphoribosyltransferase reference gene. The RT-real-time PCR products were analyzed on 2% agarose gels containing 0.5 μg/ml ethidium bromide and a unique band of the approximately correct molecular weight corresponded with a unique peak in the melt curve analysis.
Table 1. Sequences and conditions for the RT-qPCR reactions
Extraction of genomic DNA
Mammary tissue samples were resuspended in T10 E10 buffer (10 mM Tris, 10 mM ethylenediaminetetraacetic acid (EDTA)) and subjected to a mechanical break through the use of a homogenizer (Ultraturrax) until completely homogenized. They were then centrifuged for 15 min at 5000 g and the supernatant was discarded. Next, 3 ml of a solution of hexadecyltrimethylammonium bromide (CTAB, 1.4 M NaCl, 20 mM EDTA, 100 mM Tris, 0.2% β-mercaptoethanol, CTAB 2%) were added. The tubes were stirred vigorously for 10 min and incubated 1 h at 60°C until complete disintegration of the precipitates. In order to purify the DNA, one volume of IAC (chloroform: isoamyl alcohol, 24:1 v/v) saturated in H2O was added. The supernatant was recovered and transferred to a clean tube. Finally, the DNA was precipitated with two volumes of 100% cold ethanol. The visible DNA was recovered, allowed to dry in an oven at 37 °C and resuspended in 200 μL of T10 E1 buffer.
Design of primers
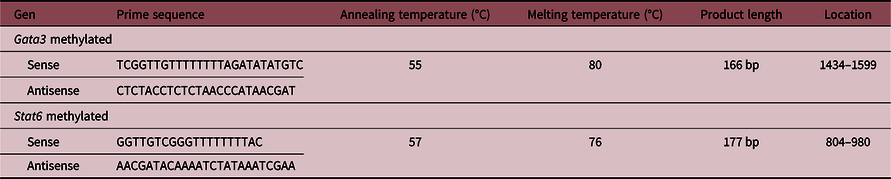
With the Methyl Primer Express® Version 1.0 program, the CpG islands of the promoter region of the Stat6 and Gata3 genes of the rat were detected using the reference sequences: ENSRNOG00000025026 and ENSRNOG00000019336 from ENSEMBL, respectively. Through the Promoter 2.0 program, the chosen regions were analyzed to verify the existence of regulatory elements of the transcription and the binding sites. The primers designed for the determination of the expression of each gene are detailed in Table 2. The primers are specific to fully methylated sequences, and recognize unconverted cytosine during bisulfite treatment.
Table 2. Sequences of the primers for methylation detection
Treatment with bisulfite
The DNA samples were treated with sodium bisulfite using the EZ DNA Methylation-Gold™ kit (Zymo Research, USA) according to the manufacturer’s instructions. The conversion was made from a total DNA amount between 50 and 450 ng/μL. To do this, the total DNA of the samples was quantified in a NanoDrop spectrophotometer (LNS-101 Labocon Scientific Limited, UK).
Real-time methylation-specific polymerase chain reaction (real-time MSP)
For real-time MSP, 1 μL of bisulfite-modified DNA from each sample was used. Five samples from each group were pooled to use for amplification. The amplification of the fragments was carried out using the enzyme Go Taq DNA polymerase (Promega, Argentina) following the manufacturer’s instructions. The final volume of the PCR reaction was adjusted with sterile H2O to 25 μL. The PCR conditions were: 5 min at 95°C, 35 cycles for 20 s at 95°C, 30 s at the temperature of annealing and 40 s at 72°C, followed by a final step at 72°C for 10 min. All of the procedures were done in duplicate to confirm repeatability and they were averaged following analysis.
Gel-based fragmentation analysis
To verify the correct amplification of the DNA product of PCR and the state of methylation, 10 μL of the PCR product was loaded, with 2 μL of SYBR Gold at a concentration of 10 pg/μL in a 12% polyacrylamide gel. Three microliters of 100 bp molecular weight marker (Bio-Logical Products, Argentina) was loaded along with the DNA samples. Electrophoresis was performed at 110 V for 40 min. The DNA was visualized, and a digital image of the gel was obtained using a ChemiDoc XRS + Image Lab Software from BIO-RAD to detect specific bands that were quantified by densitometry using a FIJI Image processing package. Reference Schindelin, Arganda-Carreras and Frise36
Statistical analysis
All statistical analyses were performed using the GraphPad Prism 5.01 software (GraphPad Software, Inc., USA). Differences in the variables between the three studied groups (L3, L8, and L12) were assessed using one-way analysis of variance (ANOVA I) or the Kruskal–Wallis test, depending on the normality of the variables as evaluated by the Kolmogorov–Smirnov test. Post hoc comparisons were performed by Bonferroni’s test or Dunn’s Multiple Comparison test. Differences were considered significant when the probability was 5% or less.
Results
Body weight
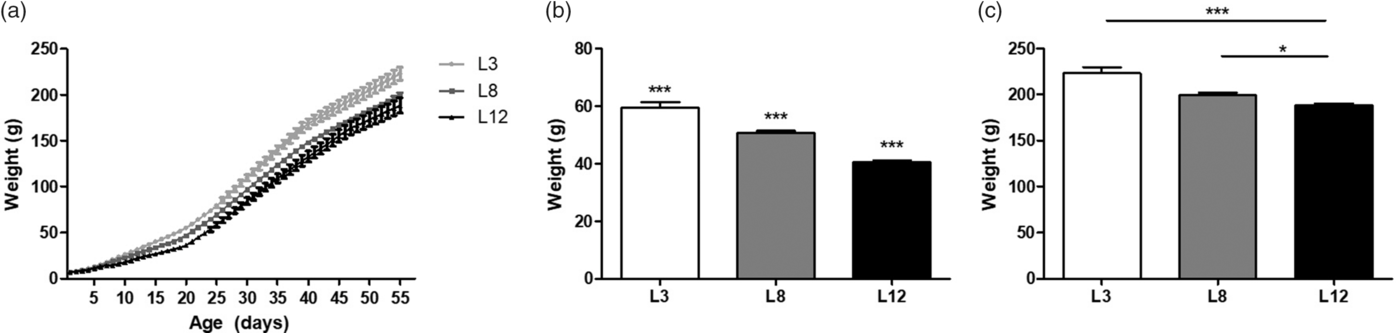
The different consumption of breast milk causes differences in body weight between the experimental groups. These findings support the previously published results, validating our animal model. Reference Santiano, Zyla and Campo Verde-Arboccó32 Figure 1a shows that L3 animals are heavier than L8 and L12 animals from Days 39 and 22 of life, respectively (p < 0.05, Fig. 1a), without differences in body weight between L8 and L12. At weaning, on Day 21, significant differences in body weight can be observed between the three groups (p < 0.001, Fig. 1b). The observed difference in weight between L3 and L12 is maintained even on Day 55 of life (p < 0.001, Fig. 1c).

Fig. 1. Body weight variations due to the differential consumption of milk. (a) Variations in weight between L3 and L8 can be observed from Day 39 of life onwards (*p < 0.05), and between L3 and L12 from Day 22 of life (*p < 0.05). No differences in body weight were observed between L8 and L12. (b) On Day 21 of life, body weight variations can be observed between the three groups (***p < 0.001). (c) On Day 55 of life L3 maintained a significantly higher body weight with respect to L12 (***p < 0.001). In turn, L8 also had a higher average weight compared to L12 (*p < 0.05). Values represent mean ± SEM. of 24 animals/group. Comparisons shown in (a) were performed by ANOVA II and Bonferroni’s test. Values shown in (b and c) were compared by ANOVA I and Bonferroni’s test.
Serum estradiol and progesterone levels
No significant differences were observed between the three groups. The mean of estrogen concentration (expressed as pg/ml ± SEM) did not differ significantly between L3 (6.77 ± 0.98), L8 (6.20 ± 0.88) and L12 (5.44 ± SEM 0.32). Similarly, the progesterone values (expressed as ng/ml ± SEM) did not differ between the three groups L3 (24.98 ± 6.7), L8 (22.02 ± 6.8), and L12 (15.92 ± 5.9).
High maternal milk intake modifies the mammary gland morphology on Day 21 of life (pre-pubertal stage)
In order to study the morphology of the mammary gland in pups with differential milk intake, we performed the whole mount technique. Given that most of breast cancers in humans begin in TDLUs, similar to TEBs in rats, the count of the latter was used to determine the potential for malignant transformation presented by each group of animals.
From the analysis of the whole mounts of the mammary glands, we observed that the number of TEBs is higher in those animals that were reared in litter of 12 (L12) with respect to those nursed in litters of 3 and 8 (L3 and L8; p < 0, 05; Fig. 2 b). The epithelial development showed no differences between the three studied groups (Fig. 2c and d).

Fig. 2. Analysis of the whole mounts of mammary glands from rats at 21 d of age, reared in litters of 3, 8, or 12 pups per mother. (a) Representative photographs of the whole mounts of the mammary glands of animals reared in litters of 3, 8, or 12 pups per mother. (b) The number of TEBs on Day 21 of life is higher in L12 with respect to L8 and L3 (*p < 0.05). (c) The mean width of the ductal tree is similar in the three groups. (d) No changes were observed in the distance from nipple to the end of the epithelial tree (considered the length of the epithelial tree). The data shown in b represent an average of 10–18 fields per mammary gland of 6 animals per group. The data shown in c and d represent measurements of six mammary glands per group. The statistical comparisons were made by ANOVA I and the Bonferroni test as a post-test.
High maternal milk intake modifies the mammary gland morphology on Day 55 of life (post-pubertal stage)
We wanted to evaluate if the changes in the morphology of the mammary gland observed on Day 21 of life are maintained over time or even if they become more significant due to the ovulatory cycles of the post-pubertal stage. For this purpose, we proceed to analyze the whole mounts of the mammary glands of 55-day-old animals, reared in litters of 3, 8, or 12 pups per mother. The results show that the number of TEBs is significantly lower in those animals that maintained higher maternal milk intake (L3) with respect to the other groups (Fig. 3a and b). The epithelial development of the mammary glands at 55 d of age showed differences in the tip of the epithelial tree to the end fat pad distance between the groups studied (Fig. 3d).
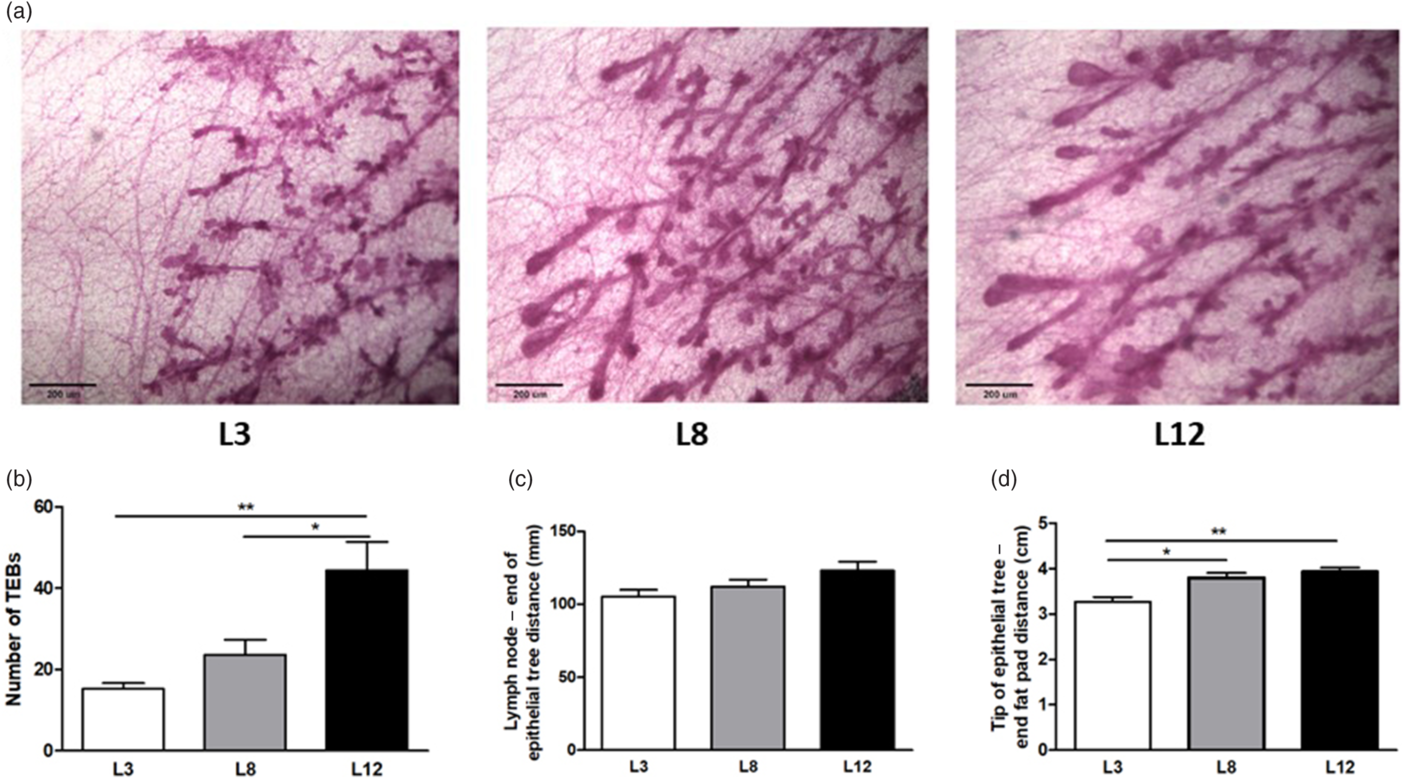
Fig. 3. Analysis of the whole mounts of mammary glands from rats at 55 d of age, nursed in litters of 3, 8, or 12 pups per mother. (a) Representative micro-photographs (100×) of the mammary glands of animals reared in litters of 3, 8, or 12 pups per mother. (b) The number of TEBs was lower in L3 with respect to L8 (**p < 0.01) and L12 (***p < 0.001). (c) No changes were observed in the distance from the lymphatic node (lymph node) to the end of the epithelial tree in the different groups. (d) The distance from the tip of the epithelial tree to the end of the fat pad was greater in L12 with respect to L8 (*p < 0.05) and L3 (*p < 0.01). The values corresponding to the number and size of TEBs represent an average of 10–18 fields per mammary gland of 10–14 animals per group. The data shown in c and d represent measurements of 10–14 mammary glands per group. The comparisons were made by ANOVA I and the Bonferroni test as a post-test.
High maternal milk intake modifies the mammary expression of genes involved in the differentiation process
We investigated the expression of genes involved in the process of development and differentiation of the mammary epithelium. We evaluated by real-time-RT-PCR the level of expression of Stat6, Gata3, Pinc, and Tbx3 (Fig. 4). The results show a lower mRNA expression of Pinc (p < 0.05), and increased mRNA expression of Stat6 (p < 0.01), Gata3 (p < 0.05), and Tbx3 (p < 0.05) in L3 with respect to L12.
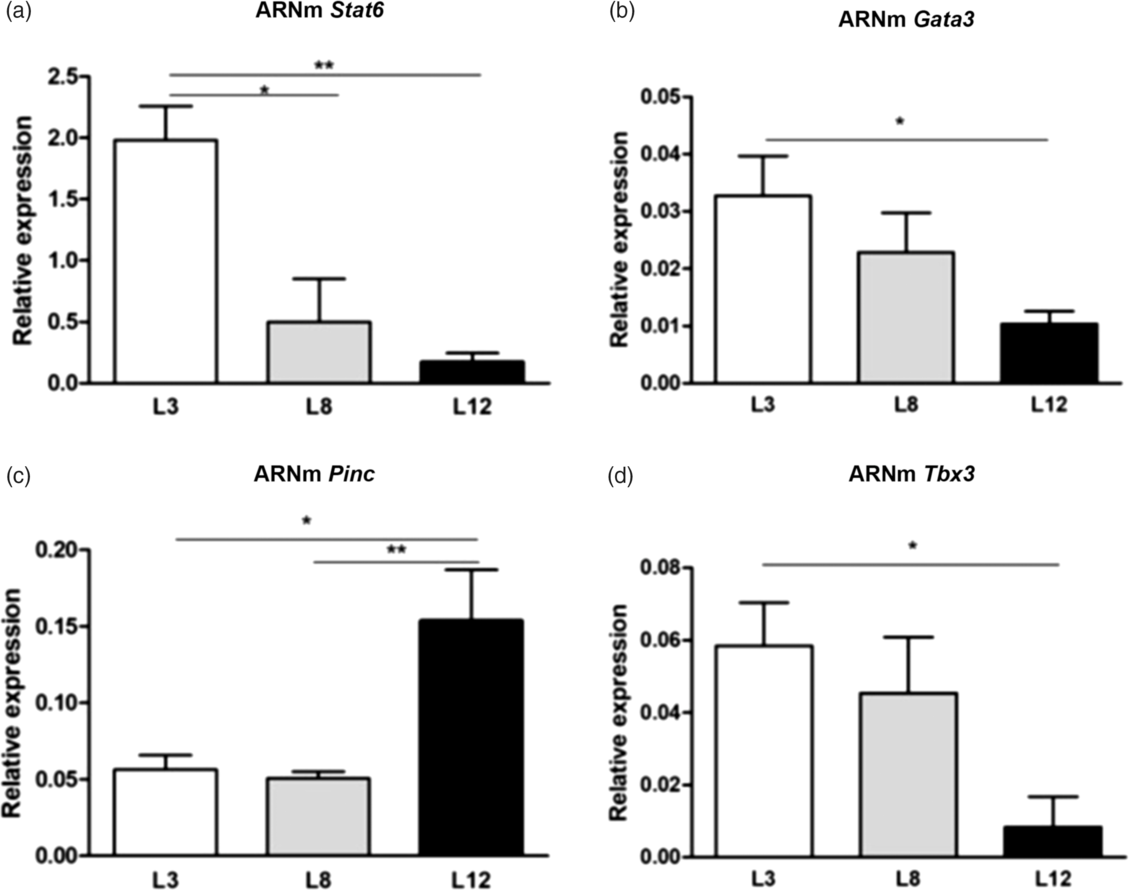
Fig. 4. Analysis of the mammary expression of genes related to the state of differentiation, by RT-PCR. (a) Stat6 mRNA showed greater expression in L3 with respect to L8 (*p < 0.05) and L12 (**p < 0.01). (b) The expression of Gata3 was higher in L3 vs. L12 (*p < 0.05). (c) The content of Pinc mRNA was increased in L12 with respect to L3 (*p < 0.05) and L8 (**p < 0.01). (d) The expression of Tbx3 is decreased in L12 compared to L3 (*p < 0.05). The values represent the mean ± SEM of 15 animals/group. The comparisons were made using ANOVA I and the Bonferroni test as a post-test.
High maternal milk intake modifies the methylation of genes involved in mammary alveolar differentiation
We investigated the level of methylation of genes that regulate the differentiation of the mammary epithelium. To determine the impact of Stat6 and Gata3 promoter methylation over its expression, we analyzed by real-time MSP the methylation status of a CpG site located in each gene promoter. We compared the methylation level in mammary glands of 55-day-old animals reared in litters of 3, 8, or 12 pups per mother.
Real-time MSP analysis showed that Stat6 presented high levels of methylation in the CpG island of the promoter analyzed in L12 (pink) and L8 (orange), while L3 (green) showed a lower level of methylation at this site (Fig. 5). The results of the methylation profile analysis of Gata3 showed that this gene is more methylated in L12 than in L3 and L8 in the CpG island of the promoter region analyzed (Fig. 6).
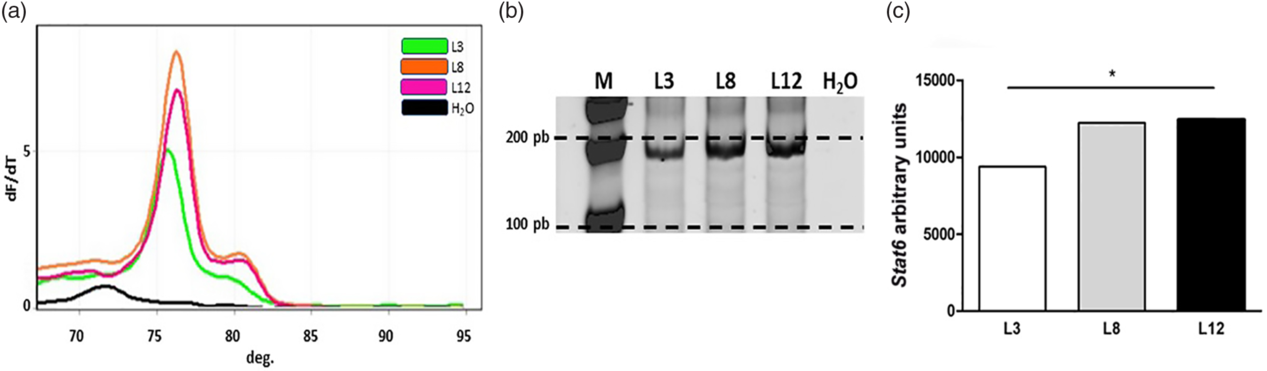
Fig. 5. Analysis of the methylation level by real-time MSP for Stat6. (a) Melt curves from qPCR of Stat6 at 76°C. (b) Representative polyacrylamide gel of real-time MSP products for Stat6. Each band represents a pool of five samples of converted DNA from each group. (c) The graph bars represent the quantification by densitometry of the bands separated in polyacrylamide gel. Stat6 is mainly found methylated in the CpG island of the promoter analyzed in L12 and L8, and moderately in L3 (*p < 0.05). The comparisons were made by one-sample Z-test.
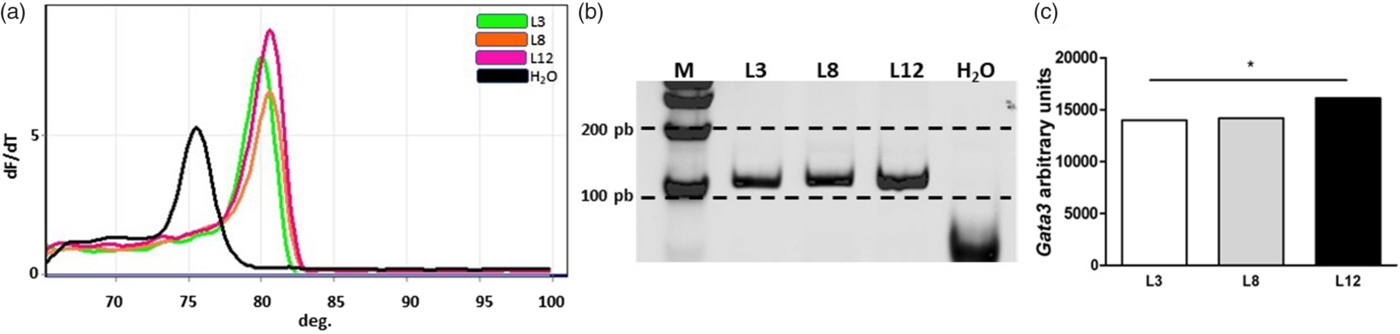
Fig. 6. Analysis of the methylation level by real-time MSP for Gata3. (a) Melt curves from qPCR of Gata3 at 80°C. (b) Polyacrylamide gel representative of real-time MSP products of Gata3. Each band represents a pool of five samples of converted DNA from each group. (c) The graph bars represent the quantification of the bands by densitometry, isolated in polyacrylamide gel. The promoter region analyzed of Gata3 has higher levels of methylation in L12 than in L3 and L8 (*p < 0.05). The comparisons were made by one-sample Z-test.
Discussion
The association between nutritional factors during early life and the development of diseases in adult life is in the focus of current research. Reference Danquah, Addo and Boateng37,Reference Heidari-Beni38 Numerous studies suggest that cancerous development may be due to epigenetic modifications established during pregnancy and postnatal life. Reference Lillycrop and Burdge1,Reference Greco, Lenzi, Migliaccio and Gessani39 In the present study, we aimed to determine the epigenetic role of breastfeeding in mammary differentiation related to the prevention of cancer in adulthood.
To do this, we analyzed the development of the mammary gland and its potential for malignancy in animals with differential lactation. This analysis was carried out at weaning, in 21-day-old rats, fed exclusively with maternal milk, and on Day 55 of life in order to observe the influence of puberty and the estrus cycles. We also studied the expression of genes involved in the process of differentiation of the mammary alveolar cell and carcinogenesis, as well as their methylation levels.
In our animal model, there are variations between the experimental groups in the volume and composition of milk ingested, as previously reported. Reference Santiano, Zyla and Campo Verde-Arboccó32 There is evidence that the reduction of the rodent litter to three offspring per mother and their subsequent overfeeding in the postnatal stage, generates metabolic alterations. Reference Habbout, Li, Rochette and Vergely40 In the present study, metabolic parameters have not been evaluated.
From our whole mount analysis, it is remarkable to note that the changes observed in the morphology of the mammary glands are evident as early as Day 21 of age, the day of weaning. Those changes can only be endorsed to the different intake of maternal milk of dissimilar quality. As we previously demonstrated, L3 pups have a higher intake of maternal milk of a better nutritional value. Reference Santiano, Zyla and Campo Verde-Arboccó32 In agreement, L3 animals present a smaller number of TEBs in their mammary gland, in comparison with animals that maintained poor lactation (L12).
After pubertal development, on Day 55 of life, the L3 animals presented a lower number of TEBs explaining the lower susceptibility to carcinogens previously shown in those animals. Reference Santiano, Zyla and Campo Verde-Arboccó32 In fact, the present study completely supports the idea that on Day 55 of age, when the carcinogen is administered, the mammary glands of L3 are more resistant to carcinogenesis due to the lower number of sites where carcinogens are especially active. Our results agree with several publications showing that the diet during the postnatal period can modify the structure of the mammary gland. Reference Lillycrop and Burdge1,Reference Ballard and Morrow5–Reference Melnik and Schmitz7 According to these morphological effects, we found a higher epithelial growth in L12 pups compared to L3 evidenced by the increase in the size of the epithelial tree.
Another important feature that affects mammary carcinogenesis is the level of differentiation reached by the epithelial cells when exposed to the carcinogen. Reference Hilakivi-Clarke, Shajahan, Yu and de Assis41 In the present study, we assessed the expression of genes involved in the differentiation of the mammary epithelium by real-time-RT-PCR in 55-day-old animals from L3, L8, and L12. The Stat6 gene, a member of the family of signal transducers and transcription activators (Stat) has the function of regulating T cells (Th) during the immune response Reference Shimoda, van Deursent and Sangster42,Reference Takeda, Tanaka and Shi43 and has also been identified as a regulator of the mammary gland differentiation, stimulating proliferation, and commitment of luminal cells to an alveolar lineage. Reference Khaled, Read and Nicholson28 Stat6 activity is enhanced by the transcriptional induction of Gata3. Asselin-Labat and colleagues showed that Gata3 is an important regulator of ductal morphogenesis and lobuloalveolar differentiation in the postnatal mammary gland. Reference Asselin-Labat, Sutherland and Barker44 In agreement with these findings, we observed that the group of animals (L3) showing a lower number of TEBs (and consequently lower susceptibility to carcinogens) in the mammary tissue had a higher expression of Stat6 and Gata3. This expected result confirms that L3 animals have not only a lower number of TEBs but also a more differentiated mammary epithelium. Additionally, Pinc expression in the L3 mammary gland was significantly lower when compared to L12. Accordingly, Shore and colleagues showed an inverse correlation between Pinc expression and mammary alveolar differentiation. Reference Shore, Kabotyanski and Roarty30 Finally, we also evaluated the expression of Tbx3, a protein necessary for the normal development of the mammary gland and we found increased Tbx3 expression in L3 pups compared to L12. Beyond the choice of these genes, it would be interesting to study the expression of many others involved in breast development.
The expression of the genes studied and the other parameters analyzed in the L8 group throughout this work behave in an intermediate manner compared to the groups of animals L3 and L12. This could be due to the presence, within the same litter of eight, of some pups that achieve a greater consumption of milk, resembling L3 animals, which coexist with other pups with a lower intake, more similar to L12 animals. This could also explain the greater variability observed in the L8 group in most of the parameters measured in the present and previous studies. Reference Santiano, Zyla and Campo Verde-Arboccó32
Since promoter methylation is an important mechanism implicated in gene expression regulation, Reference Newell-Price, Clark and King45,Reference Curradi, Izzo, Badaracco and Landsberger46 we assessed the level of methylation of Stat6 and Gata3 genes involved in the process of differentiation of mammary tissue. It is generally assumed that a higher level of methylation in a promoter region of a given gene is associated with its lower expression. As expected, in our rats, both genes showed higher levels of methylation in L12 with respect to L3. This observation suggests that high methylation on Stat6 and Gata3 promoters correlates with lower mRNA expression levels.
Although the regulation of Stat6 and Gata3 mRNA expression could be affected by many other factors, we demonstrated that promoter methylation is clearly involved in the inactivation of the genes studied, resulting in less development and differentiation of mammary tissue. It is important to note that the changes observed in methylation were analyzed in non-tumoral mammary gland, which differs from the hypermethylation processes observed in pre-tumor or tumor tissues. Reference Thuy, Thuan and Phuong47 This would explain why the differences between the different groups in the levels of methylation are not all-or-nothing responses.
A possible mechanism, by which mammary milk can act as an epigenetic regulator, is through the transfer of miRNA, immune, hormonal, and/or nutritional components that may contribute to the differentiation process of the mammary gland components. Reference Melnik and Schmitz7,Reference Verduci, Banderali and Barberi10,Reference Haricharan and Li27
In conclusion, we showed that the increased consumption of maternal milk during the postnatal stage generates epigenetic and morphological changes in the mammary epithelium. Specifically, we postulate that the increased consumption of breast milk during the postnatal life stimulates breast tissue to differentiate.
Acknowledgments
The authors are deeply indebted to Vet. Paula Ginevro and Mr. Juan Rosales for their excellent technical assistance.
Financial Support
This work was supported by Instituto Nacional del Cáncer, identified as number B11 according to the resolution of the Ministry of Health of Argentina number 493/14 and from a grant of CONICET identified as PUE 22920160100074CO.
Conflicts of Interest
None.
Ethical standards
The authors assert that all procedures contributing to this work comply with the ethical standards of the relevant national guides on the care and use of laboratory animals (NIH publication no. 86-23, revised 1991) and the UK requirements for ethics of animal experimentation (Animals Scientific Procedures, Act 1986). All the experimental procedures were approved by the Animal and Ethics Committee (CICUAL number 0011463/2011) of the School of Medicine of the National University of Cuyo, Mendoza, Argentina.