


Introduction
Cardiovascular diseases are the leading causes of morbidity and mortality, and a considerable part of their origin is likely to lie in fetal and childhood life. Recent research shows that cardiovascular risk in young and middle-aged adults can be traced back to higher risk in childhood and adolescence. Reference Franks, Hanson, Knowler, Sievers, Bennett and Looker1,Reference Juonala, Magnussen and Berenson2 Measures of obesity and adiposity, blood pressure, and other markers of macro- and microvascular function during childhood have been associated with later cardiovascular morbidity and mortality Reference Juonala, Magnussen and Berenson2–Reference Lurbe, Torro, Garcia-Vicent, Alvarez, Fernández-Fornoso and Redon5 For example, childhood blood pressure predicts adult blood pressure and other markers of cardiovascular disease, Reference Magnussen and Smith6 and obesity during childhood has been shown to be associated with increased arterial stiffening, a potential precursor to atherosclerosis, during childhood and adulthood. Reference Hudson, Rapala, Khan, Williams and Viner7,Reference Cote, Phillips, Harris, Sandor, Panagiotopoulos and Devlin8 Further, structural changes in the microvasculature during childhood, as measured through retinal vein and arteriole diameters, have been linked to arterial hypertension, coronary heart disease, diabetes mellitus, and obesity in adulthood. Reference Newman, Andrew and Casson9,Reference Li, Ikram and Wong10 Retinal venular widening is indicative of inflammation and atherosclerosis, while arteriolar narrowing is indicative of damage. Reference Li, Ikram and Wong10
The developmental origins of health and disease hypothesis states that developmental programming during the pre- and early postnatal periods is sensitive to certain exposures that appear to play a critical role in future disease risk. Reference Heindel and Vandenberg11 Accelerated growth during the postnatal period is one such exposure, suggested to play a role in adverse cardiovascular health over the life course, particularly among those with low birth weight. Reference Barker, Osmond, Forsén, Kajantie and Eriksson12,Reference Victora, Adair and Fall13 Studies examining the relationship between individual aspects of growth (e.g. birth weight, accelerated growth, obesity, and adiposity status) have found that these different aspects are associated with risk factors for cardiovascular disease in later life such as increased cholesterol, blood pressure, pulse wave velocity (PWV), and adverse changes to the retinal microvascular structure. Reference Li, Ikram and Wong10,Reference Spiotta and Luma14–Reference Adair and Cole19 Fewer studies have utilized growth trajectories which integrate growth information over a period of time, thereby permitting a more accurate identification of children at a higher disease risk than just growth assessed at a single time point. Reference Ziyab, Karmaus, Kurukulaaratchy, Zhang and Arshad20–Reference Toemen, De Jonge and Gishti24 These studies found associations between growth trajectories characterized by accelerated growth or early overweight/obesity and increased blood pressure, augmentation index (a measure of arterial stiffness), and cardiovascular risk during adolescence and early adulthood. Reference Ziyab, Karmaus, Kurukulaaratchy, Zhang and Arshad20–Reference Toemen, De Jonge and Gishti24
As previous studies primarily focused on measures of macrovascular health (e.g. blood pressure) or examined cross-sectional associations between infant growth or obesity and vascular health, there is need to examine the relationship between growth trajectories and a wider range of cardiovascular health measures. Therefore, in the present study, we aimed to evaluate the associations between childhood body mass index (BMI) growth trajectories from 0 to 9 years and preclinical cardiovascular measurements of macrovascular function (systolic and diastolic blood pressure, PWV) and microvascular function (central retinal arteriolar and venular equivalent) in young adolescents at 11 years old.
Method
Study population
We studied children from the INMA (INfancia y Medio Ambiente, Environment and Childhood) birth cohort study from Sabadell, Spain. A total of 787 women were recruited at 10–13 weeks of gestation or at birth through regional hospitals from 2004 to 2007. The inclusion criteria were ≥16 years of age, singleton pregnancy, intention to deliver at reference hospital, and no assisted conception or communication issues. Reference Guxens, Ballester and Espada25 Children and their families were followed up with at 28–32 weeks gestation, birth, and child’s age of 6 months, 1, 2, 4, 7, 9, and 11 years. Reference Guxens, Ballester and Espada25 Information was collected though medical registries, interview-based questionnaires with the mothers, and physical examinations of the children conducted by specially trained personnel. Reference Guxens, Ballester and Espada25 The present analysis was limited to children who participated in the 11-year follow-up and who had both a BMI trajectory and at least one cardiovascular measurement available (N = 454–489, depending on outcome) (Fig. 1). This study was approved by the Ethics Review Boards of the hospitals involved in the study. All mothers signed a written consent for themselves and their child’s participation.
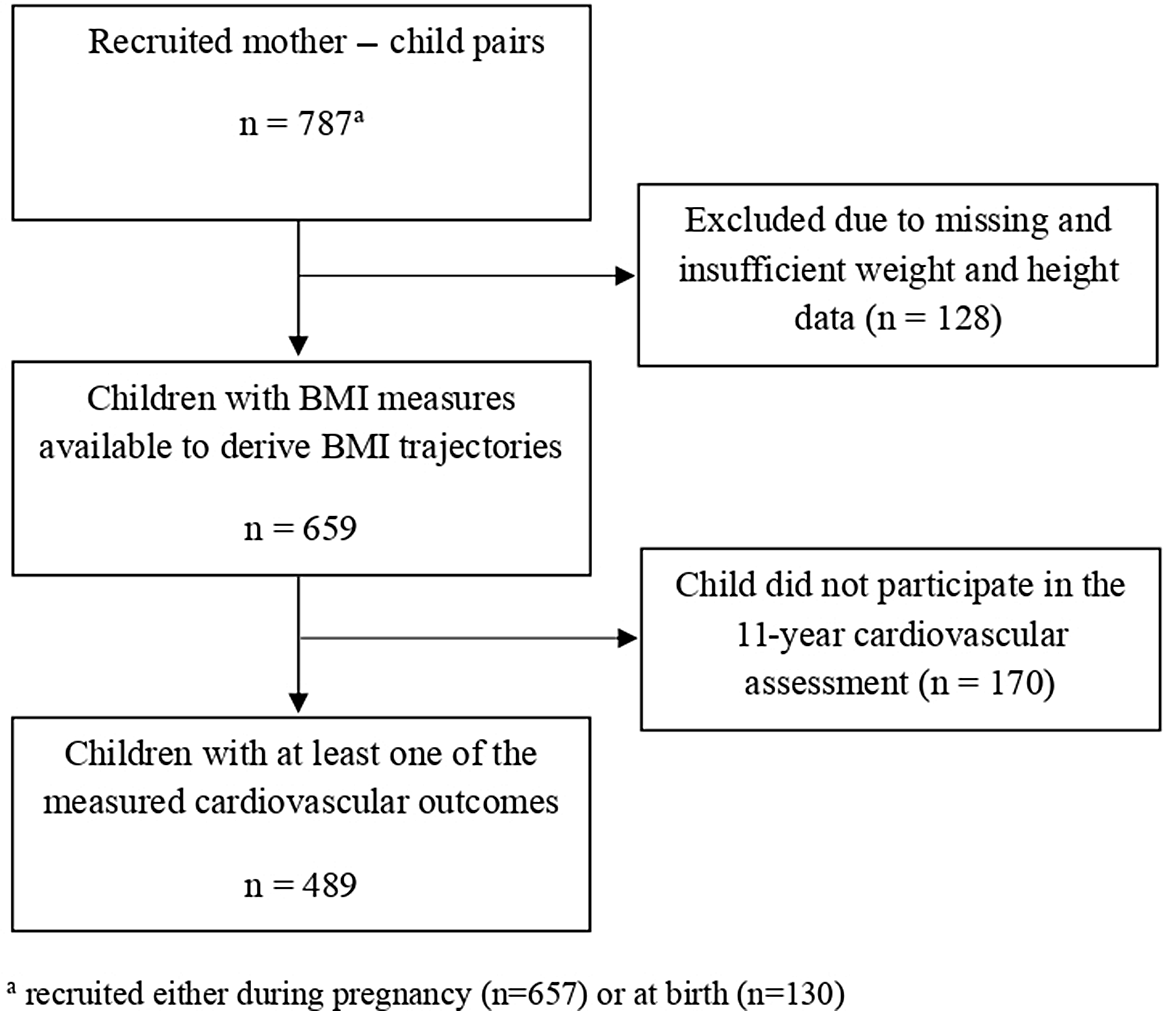
Fig. 1. Flowchart of the study sample.
Growth trajectories
Repeated measurements of child’s height and weight from birth to 9 years of age were extracted from medical records and measurements taken by trained INMA staff. Children were measured using standardized protocols, always without shoes and in lightweight clothing. BMI was calculated using the standard equation (kg/m2), and age- and sex-specific BMI z-scores were calculated using the WHO Child Growth Standards. 26,Reference de Onis, Onyango, Borghi, Siyam, Nishida and Siekmann27
BMI z-score trajectories (referred to as BMI trajectories hereafter) were previously estimated from 0 to 4 years using latent class growth analysis (LCGA). Reference Montazeri, Vrijheid and Martinez28,Reference Slining, Herring, Popkin, Mayer-Davis and Adair29 Following the same methods, the trajectories were extended to 9 years (mean = 9.9 years) with an average of 14.3 measurement points per child. Five distinct BMI trajectories from birth to 9 years of age were identified as the best fit. Extending the trajectories to 9 years did not change the classes from the previously identified trajectories. The trajectories differed in birth size (defined as “lower”, “average,” or “higher”) and in BMI gain velocity (defined as “slower” or “accelerated”) (Fig. 2). Based on these differences, the five trajectories are class 1, larger birth size with subsequent accelerated BMI gain, class 2, larger birth size with subsequent slower BMI gain, class 3, smaller birth size with subsequent accelerated BMI gain, class 4, average birth size with subsequent slower BMI gain, and class 5, smaller birth size with subsequent slower BMI gain. For analysis, we used class 4 as the reference category.

Fig. 2. BMI z-score growth trajectories from 0 to 9 years old.
Cardiovascular measurements
INMA research nurses trained to use the necessary technology carried out the cardiovascular measurements. Children were visited during school time for the assessment.
Blood pressure
Systolic blood pressure (SBP) and diastolic blood pressure (DBP) were measured using an automated oscillometric device OMRON 705IT with brachial cuff attached. Children were asked to sit down in a chair and positioned with their arm and back supported and their legs uncrossed with both feet on the floor. The cuff was placed on the child’s arm positing the artery index marker over the child’s brachial artery. After 5 min of rest, three consecutive measurements were taken with 1-min intervals between. SBP and DBP measures were averaged using the second and third measures taken. Values are presented in millimeter of mercury (mmHg).
Pulse wave velocity
PWV was recorded using VICORDER®, an arterial stiffness testing system with neck cuff and femoral thigh cuff attached in combination with the VICORDER® vascular diagnostic program package. To do this, the child laid in the supine position with a support to raise their head and shoulders 30º above their heart level. The thigh cuff was placed on their upper right thigh as high as possible, and the neck cuff was placed after palpating the pulse of the right common carotid artery. The 80% method was used (80% of the measured direct distance between the carotid and femoral recording sites) to ensure the smallest possible measurement error. With the child relaxed and still, three waveform measurements were recorded with the nurse observing a stable wave pattern. PWV measures were averaged using the three initial measurements. Values are given in meter per second (m/s).
Central retinal arteriolar/venular equivalent
Retinal images were photographed using a Canon CR2-Plus Non-Mydriatic Retinal Camera which provides information on retina changes not visible with standard photography. The child was seated behind the camera with their chin on the chin rest and their forehead pressed to the overhead bar (glasses were removed if needed). The child was asked to look straight into the camera lens, while the operator used software guides to properly align the child’s eye using the joystick, finally taking the retina image. Photos were taken from both the left and right eyes and saved in high resolution for later analysis with the IFlexis software (version 2.1.1, VITO Health, Mol, Belgium). This software calculates the Central Retinal Venular Equivalent (CRVE) and Central Retinal Arteriolar Equivalent (CRAE) using the Parr–Hubbard–Knudtson formula. Reference Knudtson, Lee, Hubbard, Wong, Klein and Klein30 Average CRVE and CRAE were calculated using the Big 6 methodology; an average of the six widest arterioles and venules running through a zone between 0.5 and 1 disk diameter from the optic disk margin. Reference De Boever, Louwies, Provost, Int Panis and Nawrot31 Processing of these measurements was carried out by one trained researcher to limit observer variability. CRAE and CRVE measures were averaged between the right and left eyes. Values are denoted in micrometer (μm).
Statistical analysis
Our analysis included a maximum of 489 children. After confirming normality of residuals, homoscedasticity, and outliers, associations between child BMI trajectories and cardiovascular measurements were assessed using multiple linear regression. Covariates were selected using directed acyclic graphs (DAGs). Models were adjusted for child age at cardiovascular measurement (years), child sex (male/female), gestational age (weeks), family socioeconomic status (SES) (low/middle/high) based on occupation using the Goldthorpe model, maternal smoking during pregnancy (none/until first trimester/until third trimester), maternal prepregnancy BMI (kg/m2), paternal BMI (kg/m2), and parental cardiovascular history (neither parent has diagnosis/one parent has at least one diagnosis/both parents have at least one diagnosis) based on questionnaire data from parents on previous cardiovascular events: heart attack, angina, hemorrhage or stroke, arthrosclerosis in legs, high cholesterol, high blood sugar, and high blood pressure. SBP, DBP, and PWV were additionally adjusted for child’s height (cm) at cardiovascular measurement. BMI was not included in the models because the DAG indicated that it was a mediator rather than a covariate. Further variable descriptions can be found in Supplemental Material Table S1.
In order to maximize sample size, multiple imputation generating 20 datasets was performed to handle missing covariate observations (missing values between 1% and 13%). Imputation was carried out using the multiple imputation by chained equations (MICE) approach using the ice command in STATA 14. This approach assumes that data are missing at random, thus additional covariates were added to the predictive models for more accurate imputation. The imputed data were used for our main analyses and results were combined using Rubin’s combination rules.
To assess any differences by sex, we stratified the associations. Further, we conducted the following sensitivity analyses: a) not adjusting for height for associations with SBP, DBP, and PWV; b) removing those children with incomplete measures (less than two measures for SBP and DBP or less than three measures for PWV) or less than good quality measures (as assessed by a trained researcher and computer software) for CRAE and CRVE; c) a complete case analysis using the non-imputed dataset; and d) cross-sectional analysis of zBMI and cardiovascular measurements.
Statistical significance was defined at P-value <0.05. LCGA analysis for determining the BMI z-score trajectories was performed using the “lcmm” function in Rstudio. All other analyses were conducted using STATA version 14 (College Station, TX).
Results
Study population characteristics are presented in Table 1. There was virtually no difference between SES categories. On average, both parent’s had a normal prepregnancy BMI, and the majority of mother’s (73%) did not smoke during pregnancy. Approximately 40% of children had one parent with at least one diagnosed cardiovascular condition (Table 1). At the time of cardiovascular measurement, on average, children were 11 years old, weighed 42 kg, and were 146 cm tall. Imputed study population data can be found in Supplementary Material Table S2.
Table 1. Characteristics of the study population (n = 489)

a Taken at the time of cardiovascular measurement.
b Doctor diagnosis of cardiovascular disease (coronary heart disease, cerebrovascular disease, and peripheral vascular disease) or cardiovascular risk factors (hypercholesterolemia, hypertension, and diabetes).
Children were most likely to belong to the reference trajectory, class 4, characterized by average birth size and slower BMI gain (35%). Subsequently; class 1, higher birth size and accelerated BMI gain (9.8%); class 2, higher birth size and slower BMI gain (27%); class 3, lower birth size and accelerated BMI gain (13.7%); and class 5, lower birth size and slower BMI gain (14.5%) (Table 1 and Fig. 1).
Average SBP and DBP were 101.6 mmHg and 59.5 mmHg, respectively (Table 1). Average PWV was 4.4 m/s, and average CRAE and CRVE measures were 180.6 μm and 252.0 μm, respectively. Averages and standard deviations for each cardiovascular measurement by BMI trajectory can be found in Table 2. Correlation coefficients between cardiovascular measurements can be found in Supplementary Material Table S3 and Fig. S1.
Table 2. Cardiovascular measurements by BMI z-score growth trajectory
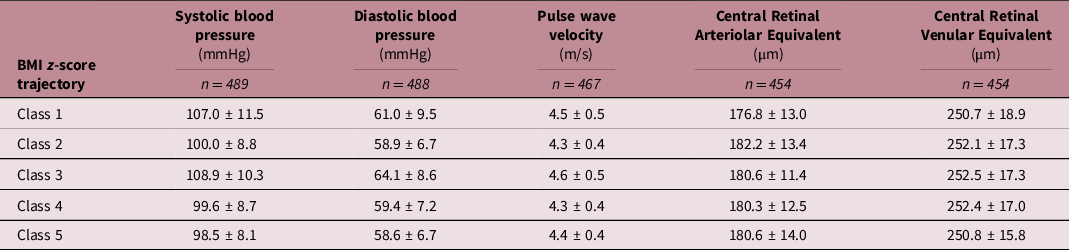
BMI z-score trajectory description: Class 1: higher birth size – accelerated gain; Class 2: higher birth size – slower gain; Class 3: lower birth size – accelerated gain; Class 4: average birth size – slower gain; Class 5: lower birth size – slower gain.
In covariate-only analysis, boys had higher SBP and PWV, and smaller CRAE and CRVE measurements than girls (Supplementary Material Table S4). Those children with lower family SES had higher SBP and DBP than those with higher SES. Height and maternal prepregnancy BMI were positively correlated with SBP and PWV, while gestational age was positively correlated with CRAE. Children of mothers who smoked through the third trimester had higher SBP and PWV compared to those whose mothers did not smoke, and children with one parent with a cardiovascular event in their history had higher PWV compared to those with parents with no history.
Table 3 shows the adjusted associations between BMI trajectories and cardiovascular measurements. Compared to children with average birth and slower BMI gain (class 4, reference trajectory), children with a lower birth size and accelerated BMI gain (class 3) had a higher SBP [β = 6.57; (95% CI 4.00, 9.15)], DBP [β = 3.65; (95% CI 1.45, 5.86)], and PWV [β = 0.14; (95% CI 0.01, 0.27)]. The BMI trajectory with children with higher birth size and accelerated BMI gain (class 1) showed an increase in SBP [β = 4.75; (95% CI 1.79, 7.71) compared to the reference trajectory. We found no significant associations between BMI trajectories and the retinal measurements, CRAE or CRVE. Crude associations were similar although higher, and all significant associations remained the same (Supplementary Material Table S5).
Table 3. Adjusted associations between BMI z-score trajectory class and cardiovascular measurements
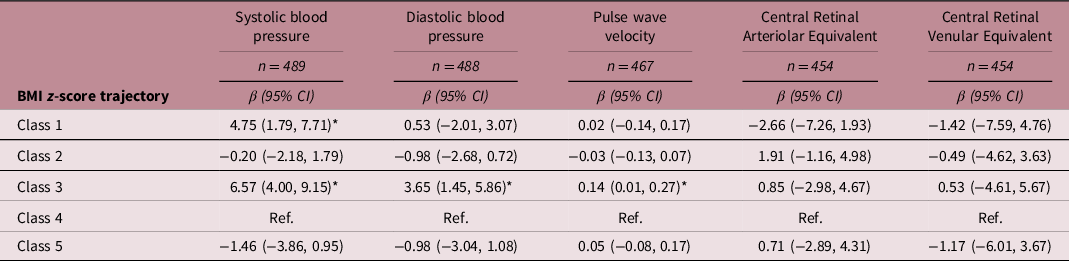
BMI z-score trajectory description: Class 1: higher birth size – accelerated gain; Class 2: higher birth size – slower gain; Class 3: lower birth size – accelerated gain; Class 4: average birth size – slower gain; Class 5: lower birth size – slower gain.
Coefficients marked with *are significant at P < 0.05.
Models using imputed data and adjusted for: child age at cardiovascular measurement, child sex, gestational age, family SES, maternal smoking (during pregnancy), maternal prepregnancy BMI, paternal BMI (during pregnancy), and parental cardiovascular history. Systolic blood pressure, diastolic blood pressure, and pulse wave velocity were additionally adjusted for child’s height at cardiovascular measurement.
Overall, results were similar to main analyses when stratifying by sex. We found that both boys and girls with accelerated BMI gain (class 1 and 3) had a higher SBP (Supplementary Material S5). However, we found that the observed associations for children with a lower birth size and accelerated BMI gain (class 3) with DBP and PWV were only significant for boys. Furthermore, girls from class 2 characterized by higher birth size and slower BMI gain had a decreased PWV when compared to the reference.
In sensitivity analyses, not adjusting for height strengthened all associations (Supplemental Material Table S7). No significant differences were found between children with complete measures and those with incomplete measures for DBP, PWV, or those with less than good measures for CRAE and CRVE (Supplemental Material Table S8-S9). Complete case analyses showed similar results to analysis with imputed data (Supplementary Material Table S10). Cross-sectional analysis showed similar significant relationships between zBMI and the cardiovascular measurements; however, associations were stronger with the BMI trajectories (Supplementary Material Table S11).
Discussion
In this prospective population-based study in Spain, we found that BMI trajectories from birth to 9 years were associated with preclinical macrovascular measurements in young adolescents at 11 years. Specifically, we found that children with a lower birth size and accelerated BMI gain (class 3) had increased SBP, DBP, and PWV, when compared to the reference class. Children with a higher birth size and accelerated BMI gain (class 1) had increased SBP. We found no associations between BMI trajectories and retinal microvascular measurements.
Macrovasculature
We found that a trajectory characterized by lower birth size and accelerated BMI gain during infancy and early childhood was associated with increased measurements of macrovascular function. Previous longitudinal studies using growth trajectories have found similar results. Reference Hanvey, Mensah, Clifford and Wake21–Reference Toemen, De Jonge and Gishti24 One study that analyzed pre-/postnatal growth trajectories found that those with decreased or normal fetal growth and accelerated infant growth had higher blood pressure. Reference Toemen, De Jonge and Gishti24 Other studies found that rapid weight gain from the first year onward and early persistent obesity were positively associated with SBP and DBP in young adults of 18 years old. Reference Ziyab, Karmaus, Kurukulaaratchy, Zhang and Arshad20,Reference Buffarini, Restrepo-Méndez and Silveira22 While an Australian birth cohort that identified growth trajectories from birth to 14 years did not find associations between growth trajectories and blood pressure or PWV, they did find that augmentation index was higher in consistently overweight children. Reference Hanvey, Mensah, Clifford and Wake21 Augmentation index is an independent measure to PWV, but they are both measures of macrovascular structure function and specifically arterial stiffness. Lycett et al. found that those in an “always very high” zBMI trajectory from 2 to 11 years had higher PWV at 11–12 years old. Reference Lycett, Juonala and Magnussen32 Additionally, in our study, we observed that those with a higher birth size followed by accelerated BMI gain had higher SBP. Likewise, Boyer et al. calculated trajectories from 15 months to 10.5 years of age and found that higher BMI at 15 months coupled with slower declines before adiposity rebound and faster BMI rebound after adiposity rebound, predicted higher adolescent cardiovascular risk as calculated using waist-to-height ratio, skinfold thickness, SBP, and BMI. Reference Boyer, Nelson and Holub23
Blood pressure and PWV are closely related measures of the macrovascular system. Young people with hypertension have been shown to have similar heart damage as the elderly, Reference Mangena, Saban, Hlabyago and Rayner33 and hypertension, once developed early in life, is irreversible. Reference McEniery, Franklin, Cockcroft and Wilkinson34 Further, PWV is an indicator of early vascular alterations and is considered the most precise noninvasive measurement of arterial stiffness related to cardiovascular events and mortality in adults. Reference Lurbe, Torro, Garcia-Vicent, Alvarez, Fernández-Fornoso and Redon5 From the aforementioned studies, including our own, there is a pattern of higher blood pressure and PWV (or other arterial stiffness marker) associated with accelerated growth during infancy or afterward. Given that childhood blood pressure tracks into adulthood and hypertension is a risk factor for cardiovascular disease, Reference Magnussen and Smith6 identifying early risk factors should be a priority to avoid adverse health outcomes in later life. Identification of children and/or adolescents at high-risk through the use of growth trajectories may be helpful for preventative strategies targeting the reduction of cardiovascular events. One of the most important modifiable risk factors for cardiovascular health is overweight and obesity. Juonala et al. observed that children who had overweight or obesity but achieved normal weight status by adulthood had a similar cardiovascular risk to those who never had overweight or obesity. Reference Juonala, Magnussen and Berenson2 These results show that children’s bodies are still flexible and developing, which may imply that their cardiovascular system is more adaptable than during adulthood indicating a point of reversibility during childhood.
Microvasculature
There are a limited number of studies that have used retinal measurements to assess cardiovascular outcomes in healthy children and adolescents. In our study, childhood growth trajectories were not associated with microvasculature measured through retinal imaging. Comparably, an Australian study did not observe an association between their calculated growth trajectories and microvasculature measured by the arteriole-to-venule ratio (AVR = CRAE/CRVE). Reference Hanvey, Mensah, Clifford and Wake21 To our knowledge, this is the only other study to have assessed retinal microvascular measurements with growth trajectories. However, a systematic review of cross-sectional studies found that adverse retinal vascular changes were associated with childhood overweight and obesity. Reference Li, Ikram and Wong10 This cross-sectional relationship was not found in our study.
Given that we took measures of both micro- and macrovasculature, we had initially hypothesized to find changes in the microvasculature structure associated with the child growth trajectories if changes in the macrovasculature were observed. In diabetic individuals, it has been shown that microvascular disease plays a causative role in the development of macrovascular disease, and the two diseases being highly intertwined. Reference Chawla, Chawla and Jaggi35 However, in many instances, changes in the micro- and macrovascular structures are observed together, and it remains unclear whether microvascular changes precede macrovascular changes or occur concurrently. This is even less clear in the case of healthy children. The small body of research in this area does seem to indicate a relationship between overweight and obesity and adverse changes in the retinal microvasculature; however, we did not find this in our study. Given that the observed differences in previous studies were small, perhaps our study lacks sufficient variability and/or sample size to observe such changes.
Strengths and limitations
Major strengths of this study were the longitudinal study design that permitted the collection of repeated weight and height measurements to be able to calculate the distinct BMI trajectories, and the detailed measures of micro- and macrovasculature structure utilized. Further, the strong follow-up in the INMA study permitted us to measure micro- and macrovascular function in a pediatric population that is otherwise infrequently measured. This study also had some limitations. Our small sample size was prohibitive in that we were not able to stratify groups further by potentially important modifying factors like SES. Although we controlled for SES in our regression models, there may still be some residual confounding given that SES was based solely on occupation. In initial models, we tested SES based on occupation and maternal education as potential markers of SES and found similar results with both variables. Nevertheless, we cannot exclude residual confounding by unmeasured social factors related to cardiovascular measures in young adolescents. Further, longitudinal studies are prone to selection bias and our study is no exception. Those with an interest in research and of higher SES tend to agree to participate and continue. However, follow-ups were done in the school setting, making it more easily accessible for children to participate. Lastly, there was little variation for all cardiovascular measurements. This is most likely due to the fact that these measurements were taken in healthy children during early adolescence. Nevertheless, we still found significant differences with macrovascular measurements across BMI trajectories.
Implications
Our study offers an important contribution to the current literature, as we were able to demonstrate two distinct patterns of accelerated BMI gain (departing from higher and lower birth size) and show that both patterns of accelerated growth are associated with the measures of preclinical macrovascular health. A study by Barker et al. previously found that the risk of coronary events in later life is more related to tempo (i.e. rate or speed) of childhood BMI gain rather than BMI at any particular age. Reference Barker, Osmond, Forsén, Kajantie and Eriksson12 Like Barker’s findings, other studies concluded that chronic diseases were most common in children who experienced weight gain after infancy, and weight gain during infancy (0–2 years old) had less impact on cardiovascular risk than weight gained during later childhood years. Reference Victora, Adair and Fall13,Reference Adair and Cole19 While these findings relate to participants of lower birth size and accelerated growth after infancy, our study shows that the same may in part be true for those born at higher birth size and experience accelerated BMI gain during infancy. One potential explanation for the reported differences could be the income level of the study population country. The aforementioned studies reported results from low- to middle-income countries where rapid/catch-up growth during the first 2 years in otherwise small infants may be protective. Reference Singhal36 This may not be the case in high-income countries like Spain where our study population is from.
To further quantify our results on the population level, knowing that blood pressure tracks from childhood to adulthood, Reference Magnussen and Smith6 a reduction of SBP as little as 2 mmHg could result in a 10% decrease in stroke and a 7% decrease in coronary heart disease during middle age. Reference Lewington, Clarke, Qizilbash, Peto and Collins37 Being able to identify those at the highest risk for coronary events at the earliest age possible may be possible through BMI trajectories. BMI trajectories are noninvasive and easily calculated measures. Additionally, using blood pressure and PWV screening in those children with higher risk growth trajectories (i.e. those who have an accelerated growth trajectory pattern) may be a novel way to identify those at greatest risk for cardiovascular disease during adulthood, early in life, while damage may be reversible and set the child on a healthier trajectory.
Conclusion
We conclude that BMI trajectories from birth to 9 years are associated with preclinical macrovascular measurements in young adolescents at 11 years. This study provides evidence that accelerated growth, especially in those of lower birth size, during infancy is a risk factor for higher SBP and DBP, and PWV in early adolescence. This subset of the population may be at greater risk for cardiovascular disease later in life. This knowledge could be used to help prevent future cardiovascular disease by targeting individuals at need for extra monitoring and lifestyle interventions. Prevention strategies for future mothers and throughout infancy and childhood should be a priority to avoid adverse health outcomes in later life.
Supplementary material
To view supplementary material for this article, please visit https://doi.org/10.1017/S2040174421000441
Acknowledgments
We thank all of the study participants for their support with the INMA Sabadell birth cohort study.
Financial support
The Instituto de Salud Carlos III (Red INMA G03/176; CB06/02/0041; PI041436; PI081151 incl. FEDER funds; PI12/01890 incl. FEDER funds; CP13/00054 incl. FEDER funds; PI15/00118 incl. FEDER funds; CP16/00128 incl. FEDER funds; PI16/00118 incl. FEDER funds; PI16/00261 incl. FEDER funds; PI18/00547 incl. FEDER funds), CIBERESP, Generalitat de Catalunya-CIRIT 1999SGR 00241, Generalitat de Catalunya-AGAUR (2009 SGR 501, 2014 SGR 822), Fundació La marató de TV3 (090,430), Spanish Ministry of Economy and Competitiveness (SAF2012–32,991 incl. FEDER funds), Agence Nationale de Securite Sanitaire de l’Alimentation de l’Environnement et du Travail (1262C0010; EST-2016 RF-21), EU Commission (261,357, 308,333, 603,794 and 634,453).
ISGlobal is a member of the CERCA Programme, Generalitat de Catalunya.
Conflicts of interest
The authors have no conflict of interest.


