1. Introduction
Traditional demographic projections are based on age–sex differentials in demographic behaviors. Recently, the importance of education as an additional dimension in population projection models has been highlighted [Lutz et al. (Reference Lutz, Goujon and Doblhammer-Reiter1998), Lutz (Reference Lutz2010)]. Indeed, education has been shown to influence fertility and mortality levels, as well as migration rates [Martin and Juarez (Reference Martin and Juarez1995), Docquier and Marfouk (Reference Docquier, Marfouk, Özden and Schiff2004), Valkonen (Reference Valkonen, Caselli, Vallin and Wunsch2006), Kravdal and Rindfuss (Reference Kravdal and Rindfuss2008), Skirbekk (Reference Skirbekk2008)]. Education will likely have a significant impact on population growth and structure and should be included as a dimension in projection models, in addition to age and sex [Lutz and KC (Reference Lutz and KC2011)]. Changes in future educational pathways could affect significantly the future world population in terms of size and age structure [Lutz et al. (Reference Lutz, Butz and KC2014)]. Furthermore, educational attainment is in itself an output relevant for public policies as well as for other analytical issues [Crespo et al. (Reference Crespo, Crespo, Lutz and Sanderson2014), Loichinger (Reference Loichinger2015), Loichinger and Prskawetz (Reference Loichinger and Prskawetz2017)]. In most economies, education is a strong and positive determinant of labor force participation, earnings, and productivity: as a matter of fact, the anticipated increase in the highly educated population is expected to curb some of the negative economic impacts of population aging [Loichinger (Reference Loichinger2015)]. Finally, including education in population projections can provide insights into the relationship between education and population dynamics, thus proving a useful tool in the implementation of education or population policies by decision-makers [Lutz et al. (Reference Lutz, Goujon, Wils, Fürnkranz-Prskawetz, Bloom and Lutz2008)].
In this paper, we describe the modeling of educational attainment for a microsimulation projection model of the EU28 member states developed within the framework of a larger project called CEPAM.Footnote 1 The CEPAM microsimulation model (CEPAM-Mic) includes—in addition to age, sex, and education—mother's education and sociocultural variables that are themselves determinants of educational attainment. These additional variables allow for a more refined modeling of education, and can lead to an improvement in the overall quality of the projections and to an increase in the value of derived factors such as literacy skills, labor force participation, or employment. They also provide more flexibility in the generation of policy relevant alternative projection scenarios, notably in terms of the intensity and composition of future migration flows and of the future evolution of educational attainment. Furthermore, results are enriched by these additional variables, as multistate projections usually do not account for demographic differentials related to immigration and sociocultural variables. Since demographic behaviors and socio-economic outcomes of immigrants differ from those of natives, and since the immigrant population is growing fast, taking these differentials into account becomes more and more important.
On the one hand, conventional multistate models are poorly adapted to the simultaneous projection of a large number of dimensions, because the number of cells increases exponentially with the number of individual characteristics and in consequence, the computational effort quickly becomes unmanageable [Van Imhoff and Post (Reference Van Imhoff and Post1998)]. Microsimulation, on the other hand, is a powerful tool that can be used to make population projections when the number of dimensions becomes large [Van Imhoff and Post (Reference Van Imhoff and Post1998)], because various statistical models can be used to derive life-course transitions and events. There is also a growing consensus on the usefulness of this type of model for population projections in general [Asghar et al. (Reference Asghar, Harding and Williamson2009)]. In microsimulation models, individuals are simulated one by one and their characteristics are modified through scheduled events whose timing is determined by the values of their specific parameters at any given time during the projection period. Since the simulation is performed at the individual level, individual records over the life course and across generations can be stored and retrieved. Characteristics of mothers, such as education, can be stored and used as determinants of further events.
The power and flexibility of microsimulation allow for the inclusion of 11 dimensions to the CEPAM-Mic model: region of residence, age, sex, educational attainment, mother's educational attainment, immigrant status, age at arrival in host country, religion, language spoken, and labor force participation.
This paper presents the argumentative and empirical basis for the projection of education. First, we discuss the necessity of inclusion of additional sources of heterogeneity in order to model the future evolution of educational attainment. Second, we describe the education module of the microsimulation model and estimate its parameters using an ordered logit regression model. The results of this analysis show the importance of mother's education and of sociocultural variables in explaining the educational attainment of EU28 residents. In the last section, we implement these parameters in the CEPAM-Mic microsimulation model and show the results of a sensitivity analysis obtained by comparing five scenarios of population projection, one using only gross cohort trends and the others using different sets of parameters for sociocultural variables and mother's education.
2. Empirical and past evidence on the importance of parental education and socio-cultural characteristics in determining educational attainment
Over the 20th century, the massification of education has been a worldwide phenomenon, resulting in the rapid growth of tertiary education [Altbach et al. (Reference Altbach, Reisberg and Rumbley2009)]. Although there exists no scientific consensus on the link between countries’ broad characteristics and the expansion of higher education, Schofer and Meyer (Reference Schofer and Meyer2005) stress the positive role of democratization, human rights, scientization, and development planning. This evolution in educational attainment was made possible by cultural and institutional changes that took place after the Second World War, as expansion in higher education was increasingly seen as a source of progress that benefits both individuals and society rather than a source of inefficiency and anomie [Schofer and Meyer (Reference Schofer and Meyer2005)]. Since then, developed nations have seen, along with the emergence of the welfare-state and social security, a strong decline in the cost of education [Breen et al. (Reference Breen, Luijkx, Müller and Pollak2009)]. As more schools were built and travel conditions improved, living conditions also increased for working classes, resulting in universal access to primary and secondary education [Breen et al. (Reference Breen, Luijkx, Müller and Pollak2009), Barakat and Durham (Reference Barakat, Durham, Lutz, Butz and KC2014)]. Through a domino effect, this improvement in primary and secondary education also increased the postsecondary enrolment [Altbach et al. (Reference Altbach, Reisberg and Rumbley2009)].
Figure 1 shows trends in educational attainment in European countries for cohorts born between 1940 and 1979. As a general trend, we note that the proportion of low-educated population has continuously declined for most countries.Footnote 2 The decline has occurred at a stronger pace for females when compared to males, and in countries lagging behind in terms of educational attainment, such as Greece. Overall, a convergence of all countries to a small proportion of low-educated population is clearly observed. Indeed, the arithmetic mean of low-educated population for EU28 countries decreased for females from 58.6% [standard deviation (SD) = 18.8%] for the cohorts of 1940–1944 to 14.5% (SD = 10.1%) for the cohorts of 1975–1979, and for males from 45.4% (SD = 19.2%) to 16.9% (SD = 12.8%). Despite this general decline in low education, significant gaps remain among EU28 countries. For instance, the range in the proportion of low-educated population varies from 3.3% (females born in Sweden) to 61.8% (males born in Portugal) for cohorts born between 1975 and 1979.
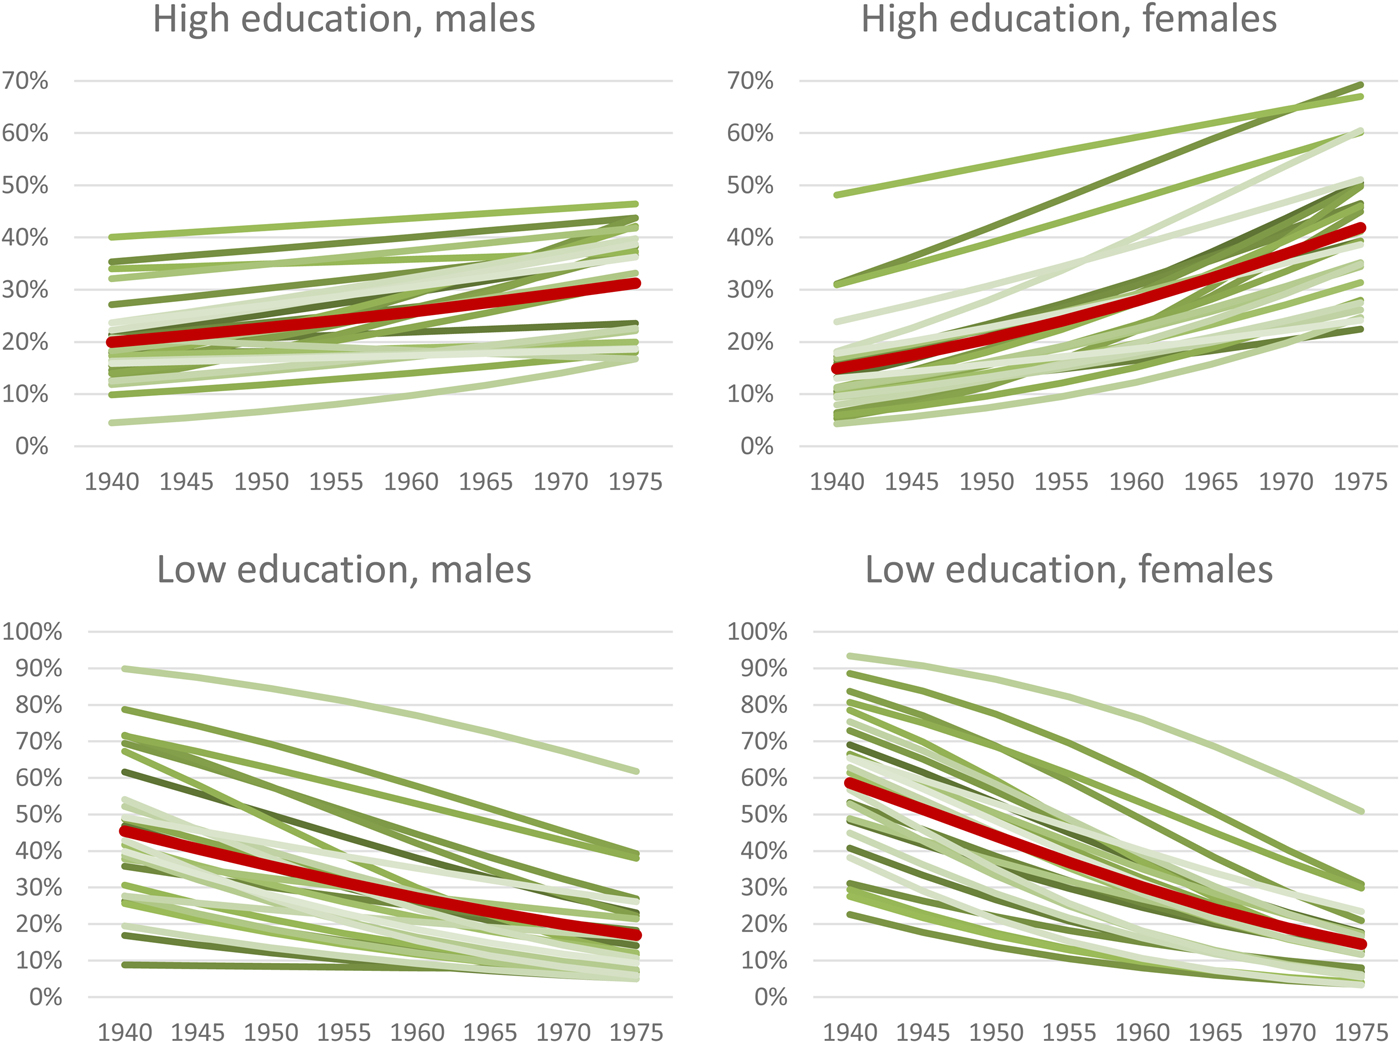
Figure 1. Evolution of educational attainment across cohorts (%) for European-born and immigrants arrived before age 25, by country (red line = arithmetic average).
Conversely, most countries have seen a general increase in the proportion of high education across cohorts. In general, the rate of change was greater for females than for males, so much so that females born between 1975 and 1979 were more likely to get a post-secondary degree than males of the same cohorts [Van Bavel et al. (Reference Van Bavel, Schwartz and Esteve2018)]. The opposite had been true for cohorts born 30 years earlier. Some countries, such as the Czech Republic and Romania, even saw their proportion of high-educated males stagnate at moderate or low levels. Overall, the arithmetic mean for the proportion of the high-educated population increased from 14.8% (SD = 9.3%) to 41.9% (SD = 12.7%) for females, and from 19.9% (SD = 8.1%) to 31.2% (SD = 9.7%) for males. Interestingly, and contrary to what was observed for low education, Figure 1 shows that there is no evidence of convergence between countries in post-secondary educational attainment.
It is known since many decades that the socioeconomic status of the family influences the educational attainment [Sewell and Shah (Reference Sewell and Shah1967), Sewell et al. (Reference Sewell, Haller and Portes1969), Lin (Reference Lin2001)]. Among socioeconomic characteristics, the education of parents proves to be an even better determinant of a child's educational attainment than the occupation [Shavit et al. (Reference Shavit, Yaish, Bar-haim, Stefani, Reinhard, Gunnar and Markus2007)]. Past research has consistently shown a strong correlation between a parent's and his/her children's educational attainment: individuals whose parents have a high level of education have a better chance of getting a high level of education themselves [Bowles and Gintis (Reference Bowles and Gintis1976), Hertz et al. (Reference Hertz, Jayasundera, Piraino, Selcuk, Smith and Verashchagina2008), Kogan et al. (Reference Kogan, Gebel and Noelke2012)]. Evidence shows that this type of intergenerational transfer occurs consistently in all developed nations and has remained stable since the Second World War [Erikson and Goldthorpe (Reference Erikson and Goldthorpe1992), Shavit and Blossfeld (Reference Shavit and Blossfeld1993), Pfeffer (Reference Pfeffer2008)]. Moreover, commenting a journal special issue on ethnic differences in educational attainment, Heath and Brimbaum (Reference Heath and Brinbaum2007) conclude that the socioeconomic status of parents, which is captured in part by their education level, has about the same effect for every ethnic group, since very few interaction variables were found to be significant.
Researchers have identified several mechanisms by which a child's education might be linked to the education of its parents: economic and cultural resources, the influence of other family members, track placement, and incentives to make more ambitious educational choices [Shavit et al. (Reference Shavit, Yaish, Bar-haim, Stefani, Reinhard, Gunnar and Markus2007)]. In short, the parents’ education is an important part of a child's social capital [Bourdieu (Reference Bourdieu1986)]. In addition, the educational attainment may also be linked to inherited abilities which are correlated between family members [Black et al. (Reference Black, Devereux and Salvanes2005)].
Along with parents’ education, other sociocultural variables may have an impact on educational attainment. Many studies in Europe and in the USA have found that some groups such as foreign-born children or racial minorities are at a disadvantage with respect to their educational trajectory [Hirschman (Reference Hirschman2001), Riphahn (Reference Riphahn2003), Heath and Brinbaum (Reference Heath and Brinbaum2007)] or on the contrary performs better than natives following the segmented assimilation hypothesis [Portes and Zhou (Reference Portes and Zhou1993), Alba and Foner (Reference Alba and Foner2016)].
Global expansion in higher education in the USA was shown to have been depressed by compositional effects, the expansion having been slower for Blacks and Hispanics than for Whites [Barakat and Durham (Reference Barakat, Durham, Lutz, Butz and KC2014)]. In Germany, Gang and Zimmermann (Reference Gang and Zimmermann2000) showed that children of immigrants meet a disadvantage in educational attainment that resists statistical controlling of several factors such as parents’ education. Moreover, the educational experience differs following the ethnic origin of children of immigrants, suggesting a persistence of cultural differences in a multicultural society. According to Heath and Brindaum's (Reference Heath and Brinbaum2007) review on ethnic inequalities, this persistent disadvantage affects mainly immigrants from low-developed countries. Among contextual factors explaining these differences, some researchers observed that minority groups are often concentrated in economically deprived neighborhoods, where the poorer quality of schools together with unequal access to resources and other contextual effects are likely to reduce their opportunities [Gronqvist (Reference Gronqvist2006), Heath and Brinbaum (Reference Heath and Brinbaum2007), Pong and Hao (Reference Pong and Hao2007), Zhou (Reference Zhou2009)].
3. Projecting the education
3.1 The multistate approach and the need of a new paradigm
Previous projections of education used a multistate approach in a dynamic model of all countries of the world [Lutz et al. (Reference Lutz, Butz and KC2014)]. Assumptions concerning future educational attainment were set by extrapolating previous cohort trends by sex and country, and different scenarios were constructed for prospective analyses.
Looking at the observed educational attainment by cohorts, it might appear reasonable to assume that past trends would extend to future generations. This would be called a gross cohort trend, as it does not account for population heterogeneity. However, as was shown in the previous section, educational attainment varies according to the individual's sociocultural characteristics and parental education, so that observed trends across cohorts may vary depending on changes in population composition.
As a matter of fact, population composition has changed across cohorts due to education-related fertility differentials, immigration flows and past changes in educational attainment of mothers. Thus, some of the observed changes at the aggregate level can be explained by changes in the composition of the population rather than by behavioral changes at the micro level [Orcutt (Reference Orcutt1957)]. Since cohorts’ educational attainment is inextricably linked to the evolution of sociocultural variables and to the education level of parents, we may expect that part of the observed changes in educational attainment is explained by changes in population composition, rather than by a net cohort trend, or changes affecting all subgroups of a cohort. Given the high transmission of education from parents to children, an observed increase in the proportion of the highly educated population could be explained by an increase in the education level of parents, even as the net cohort trend within education levels stagnate or decrease. Thus, explicitly considering the relationship between parental education and one's education level in the forecasting model should improve its predictive capacity.
Additionally, if the net effect on the educational attainment of ethnocultural characteristics remains statistically significant, it becomes necessary to take these characteristics into account as well. This is particularly necessary in a context where increasing immigration is increasing sociocultural diversity. However, multistate population projection models can hardly project simultaneously several dimensions, because the number of cells grows exponentially with the number of characteristics included. The microsimulation can overpass these challenges [Van Imhoff and Post (Reference Van Imhoff and Post1998)]. Therefore, a change in the methodological paradigm is required.
3.2 The CEPAM-Mic microsimulation model
In a continuous time dynamic microsimulation model, individuals from the base population are simulated one by one and their characteristics are modified through scheduled events whose timing is stochastically (Monte-Carlo) determined using the values of their specific input parameters at any given time during the projection period [Van Imhoff and Post (Reference Van Imhoff and Post1998), Bélanger and Sabourin (Reference Bélanger and Sabourin2017)]. Rules for intergenerational transfers of characteristics from mother to child determine the base characteristics of newborns, which can then change during the life-course following assumptions set in inputs. The parameters used as inputs are themselves derived through various statistical methods, using available data sources.
The objective of this paper is to describe the modeling of educational attainment for a microsimulation projection model of the EU28 countries called CEPAM-Mic. The framework of the model is based on the Canadian LSD model [Bélanger and Sabourin (Reference Bélanger and Sabourin2017), Bélanger et al. (Reference Bélanger, Sabourin, Marois, Vézina, Van Hook and Lutz2018a, Reference Bélanger, Sabourin, Vézina, Marois, D'Ovidio, Pelletier and Lafontaine2018b)]. CEPAM-Mic is a dynamic, continuous time, event-based, open, and spatial microsimulation projection model of the EU28 population programed in the Modgen language.Footnote 3 The model aims at investigating the impact of immigration on the future European population. It simultaneously projects demographic (age, sex, place of residence, and immigrant status), ethno-cultural (country of birth, language, and religion), and socioeconomic (education, labor force participation, and employment) characteristics of the EU28 population. It allows for changes in individual characteristics over the life course, as well as for intergenerational transfers of some characteristics from the mother to her child.
The starting population of CEPAM-Mic is derived from pooled data of the LFS 2014–2015 calibrated to the 2011 Census by age (5-year age groups from 0 to 95+), sex, country, education, and immigrant status. Religion and language are imputed from pooled data of the European Social Survey (ESS), following statistical procedures described in Sabourin et al. (Reference Sabourin, Marois and Bélanger2017). There is no theoretical limit for the time range of the projection, although for the purpose of this paper, we set it at 2060. Fertility differentials for region of birth, age at immigration, duration of stay, and student status are estimated from logit regressions applied to the EU-LFS controlling for, age, education, and country of residence. These differentials are assumed to remain constant during the projection period. The education variable used in the modeling of fertility included the category “is student” in order to avoid attributing the fertility level of low educated females to individuals who will complete their education later in life. These differentials are applied to country, age, and education fertility base rates which follow the trend estimated following a worldwide experts survey used in Lutz et al. (Reference Lutz, Butz and KC2014). Mortality assumptions by age, sex, and educational attainment are also taken from the projection model used in Lutz et al. (Reference Lutz, Butz and KC2014).
To obtain out-migration rates by sex and country of residence, the average number of out-migrants from 2014 to 2016 (Eurostat table: migr_emi2) is divided by the average population aged 20–34 during the same period. Age-specific outmigration rates are then derived within the microsimulation model as follows. First, the Eurostat derived outmigration rates are applied to the 20–34 population to obtain the expected number of out-migrants in a given year. The number of out-migrants are then distributed according to age using a Rogers-Castro schedule [Rogers and Castro (Reference Rogers and Castro1981)]. Finally, age-specific outmigration rates are obtained by taking the ratio of out-migrants to the population, by age, sex, and country of residence. Out-migration rates in the simulation are recalculated every 5 years. During the simulation, out-migrants may either move within the EU, and are assigned a new country of residence, or they can leave the EU, in which case their simulation is terminated. The proportion of out-migrants leaving the EU is derived from Eurostat tables on emigration according to region of destination (table: migr_emi3nxt). Origin-destination matrix for intra-European mobility was derived using an update for the period 2009–2016 of Raymer et al.’s (Reference Raymer, Wiśniowski, Forster, Smith and Bijak2013) Bayesian estimates of European migration.Footnote 4
The number of international immigrants is assumed to remain constant at the average level observed for the period 2014–2016 [Eurostat (2018)]. Furthermore, future immigrants in the baseline scenario are assumed to have the same characteristics as recent immigrants. Although the origin and composition of immigrants are not likely to remain constant, it is not possible to predict migration for the long run [Sander et al. (Reference Sander, Abel, Riosmena, Lutz, Butz and KC2014), Azose et al. (Reference Azose, Ševčíková and Raftery2016)]. This is particularly true when we need to make assumptions on migration composition along several dimensions. In consequence, the demographic scenario presented in this paper should be interpreted as being a continuation of current trends rather than a forecast. As stated above, the objective of this paper is to describe the modeling of the education module of the microsimulation model and for this purpose, a single set of assumptions for demographic events is sufficient.
The microsimulation model also includes intragenerational transmission of religion and language. At birth, religion and language are probabilistically attributed to the child according to their mother's characteristics, and are then allowed to change during the life course. Life course transition rates for language spoken at home are estimated from the ESS using a cross-section approach [Sabourin and Bélanger (Reference Sabourin and Bélanger2015)], whereas rates for religion are taken directly from the PEW projections by religion [Hackett et al. (Reference Hackett, Connor, Stonawski and Skirbekk2015)].
3.3 The CEPAM-Mic educational module
3.3.1 Data and variables
Because CEPAM-Mic aims at implementing sociocultural factors and the education of the parents as determinants of individual's educational attainment, it requires a microdata set that includes all or most of the theoretically relevant determinants of education for all countries, on which statistical models will be built to estimate the needed parameters.
Although the EU-LFS has a large sample covering all EU28 countries, it contains limited information on sociocultural characteristics. Moreover, education of the mother is only available for individuals living in the same household as their mother.Footnote 5 Despite its smaller sample size, the ESS was thus preferred to the EU-LFS for the analysis of educational attainment. Five cycles of the ESS (2006–2014) were pooled and reweighed in order to match the base population of the projection model (according to country/age/sex/region of birth/education).Footnote 6 Of the 28 EU countries, 13 participated in all five cycles, 13 were missing from at least one cycle, and two were completely missing (Luxemburg and Malta). These two latter countries are thus excluded from the analysis presented in this paper.
From this merged database, people born between 1940 and 1979Footnote 7 and immigrants arrived in their host country before the age of 25 were selected. Individuals were then classified according to their country of birth (if born in the EU) or country of residence (if born abroad). A description of the sample size for all countries can be found in Appendix Table A1.
Educational attainment is the dependent variable and is divided into three broad categories based on ISCED classification either:
(1) Low: lower secondary or less (ISCED 1 and 2);
(2) Medium: upper secondary completed (ISCED 3);
(3) High: postsecondary (ISCED 4+).
The independent variables used for the analysis are the following:
• Education of the mother: categories are the same as for the dependent variable.
• Country of birth (natives) or country of residence (immigrants): EU28 countries.
• Region of birthFootnote 8: Native, North America or Oceania/Other Europe/North Africa/Latin America/East, South, and South-East Asia/Near and Middle East.
• Religion: Christian/Muslim/Other religions/No religion.
• Language spoken at home: Country's official language(s)/Other official languages in the EU28/Other languages. Language has to be official at the national or federal level.
3.3.2 The education module
In the CEPAM-Mic model, educational attainment is modeled in three steps:
Step 1. Determining educational attainment
This first step is at the core of the education module and requires parameters from ordered logit regressions (or cumulative logit with non-proportional odds) at the education level. When an individual is born, a variable indicates the highest level of education that will be reached in his/her lifetime. This is also done for immigrants who arrived before their twentieth birthday and for individuals aged less than 30 in the base population.
The ordered logit regression analysis has two purposes. The first is to estimate the net effect of relevant individual characteristics on educational attainment. The second purpose is to estimate country-specific cohort effects in order to make assumptions on the educational attainment of future cohorts. Because the sample size is insufficient to build stratified country-specific models, countries are grouped into two large regions, EU15/NMS13, corresponding approximately to former historical division of Europe during the second half of the 20th century, which still shapes the immigration patterns in terms of number, origin, and socioeconomic integration [Kahanec and Zaiceva (Reference Kahanec and Zaiceva2009)]. The country-specific effect is captured by an interaction variable between the cohort and the country. The model equation is thus formulated as follows:
 $$\ln \left( {\displaystyle{{E_{ij}} \over {1-E_{ij}}}} \right) = \beta _{0j} + \beta _{1j}Ct_i + \beta _{2j}Cr_i + \beta _{3j}\lpar {Ct_i \times Cr_i} \rpar + \beta _{4j}X_i + \beta _{5j}Z_i\; $$
Where
• E ij is the probability that an individual i reaches level of education j, where j equals high or medium;
• Ct is the country;
• Cr is a discrete variable for cohorts (1940–44 = 1; 1945–49 = 2, …, 1975–1979 = 8);
• X is a set of sociocultural variables;
• and Z is the education of the mother.
The ordered logit model provides distinct parameters for high and medium education, low education being the reference. Detailed parameters for all categories and variables are presented in Appendix Table A2. For the sake of simplicity, we focus our analysis on the odds of getting a post-secondary degree (high) compared to the odds of getting a lower degree (low and medium combined).
Note that the attribution of a highest educational attainment only concerns individuals with incomplete education paths: newborn, immigrants arrived before age 20 and members of the base population under 30 years old. For immigrants arrived in adulthood and older members of the base population, the highest degree is the one at the arrival in the host country or at the time of the survey. In the reference scenario, it is assumed to remain the same for the rest of the simulation, although other assumptions may be set in alternative scenarios.
Step 2. Graduation schedule
For those reaching at least the upper secondary level, the age at graduation is determined for all degrees using Eurostat distributions by ISCED levels for the latest graduated cohorts (2013–2014). For those scheduled to complete a post-secondary level, the education module first establishes age at graduation for the post-secondary degree, and then finds a coherent age at graduation for the upper secondary level.
For the three countries with missing data (France for high education; Croatia and UK for medium education), the average distribution of comparable countries was used as an approximation.
Unfortunately, no data exist on education schedules according to sociocultural characteristics or education of mothers and data quality sometimes appears questionable for certain countries. Nevertheless, we assume that variations due to these sources of heterogeneity occur within the age resolution of the model (5 years).
Step 3. Simulation of life course
The last step involves the actual simulation of individual educational events at the age at graduation that was predetermined. At birth, the education level is set to low for everyone. If the individual survives until graduation, the education state variable changes to reflect the appropriate educational attainment. As long as the highest level set at birth is not reached, the individual is tagged as being a student, along with his/her current educational attainment. Since the education variable is used for the modeling of other demographic events, a change in education immediately affects mortality and fertility rates as well as labor force participation.
3.3.3 Limitations
Due to both data and methodological limitations, a large part of the social determinants of educational attainment are discarded in the modeling. For instance, although the literature suggests that father's education is probably more important than the mother's in the prediction of the educational attainment of their children [Gang and Zimmermann (Reference Gang and Zimmermann2000)], CEPAM-Mic is a female-dominant model, that is fertility rates are applied to women, and thus, it is not possible to create a link between the father and the child within the current microsimulation model. It is technically possible to model union formations and dissolutions by pairing individuals to form households and thus access to the characteristics of a potential father, but there are no data covering all EU member countries that would allow consistent statistical estimates of the parameters of these events without generating several major inconsistencies in the projection. Moreover, such addition would necessitate computer power that is actually out of range of most institutions. However, educational homogamy is important as shown by the high correlation between the education of the mother and the education of the father (0.61 in this sample). For these reasons, using education of the mother appears as a good proxy in this context.
Additionally, other sociocultural variables would empirically be relevant, but are not included in the projection model and some heterogeneity remains even when controlling for religion, language, and region of birth. As an example, Muslim or those speaking a non-European language include people from different socio-cultural backgrounds. However, as the sample size is relatively small, it was necessary to create some broad categories, especially for minority groups, to reduce the variance of the estimated parameters. In new member states (NMS13) specifically, the small sample size along with the small number of immigrants do not allow for a distinction of immigrants by region of origin. For the same reason, it is not possible to obtain reliable and coherent parameters from an interaction between the region of birth and religion or with language spoken at home to capture patterns for specific ethno-cultural groups such as Roma.
Similarly, contextual and environmental factors could not be accounted in the modeling of education. Organizational properties of schools (classroom effectiveness, teaching quality, etc.) have a major impact on student achievement [Heck (Reference Heck2009)]. Including this dimension in country-level projection of education would be very hazardous, as it would require to build a standardized indicator for all EU countries that is internationally comparable, and to set assumptions on how this indicator would involve in the future. Summing up, we can nevertheless assume that some of those missing factors are implicitly taken into account in the country-specific parameter of equation (1).
4. Estimation of parameters for the education module
Table 1 shows Max-rescaled R 2 and concordance levels for partial and full models. On average, adding mother's education (Z) and sociocultural variables (X) to cohort trends by country (Ct × Cr) increases the concordance by 5–10 points compared to models including cohort trends by country alone. The two performance indicators also show that mother's education is a better predictor of educational attainment than are sociocultural variables: models including Z alone perform better than those including X alone. Moreover, Max-rescaled R 2 scores show that mother's education and cohort/country have a similar effect on the explained variance. Performance indicators also show that models perform slightly better for the EU15 region when compared to NMS13, as well as for females compared to males.
Table 1. Performance indicators for partial and full models

In order to assess the effect of the education of the mother and sociocultural variables, we compare their net and gross effect in Figure 2. Gross effects correspond to observed differences (translated into logit), which do not take account the effect of other variables. Net effects are obtained from the full model (country, sex, cohort, sociocultural variables, and mother's education).

Figure 2. Odds of getting high level of education over odds of getting a low or medium level of education.
The importance of mother's education stands out from all other variables as the main determinant of educational attainment. In both regions, the odds of getting a post-secondary degree compared to getting other lower educational levels fall below 0.2 for both males and females with low-educated mothers (reference is high-educated mother), meaning that individuals with a low-educated mother are approximately five times less likely to complete a post-secondary level than individuals with a high-educated mother. Results for individuals whose mother has a medium level of education are similar, although a little less pronounced (odds ratio: approximately 0.3).
Preliminary models also included interaction terms between the education of the mother and the country or cohort, but most of the resulting parameters turned out not to be significant. Although the absence of a significant interaction could be a consequence of a relatively small sample size, this suggests that the effect of mother's education is roughly the same in all countries and didn't change across cohorts (at least since 1940). This result supports many other empirical analyses showing that differentials in intergenerational mobility rates do not vary much over time and across countries [Piketty (Reference Piketty, Atkinson and Bourguignon2000)]. As stated earlier, including mother's education explicitly in the projection model should improve predictive capacity.
Parameters for the region of birth show that cultural background is an important driver of educational attainment, and its effect differs according to sex. Indeed, a strong heterogeneity is observed with respect to the region of birth of immigrants arrived in their host country during childhood, as differences between some immigrant groups are larger than between immigrants and natives. For males in EU15, being born in other European countries (non-member of EU28) significantly reduces the odds of getting a high education level, while the odds increase strongly for those born in African countries (excluding North Africa). Females born in Near and Middle East have a significant disadvantage compared to others. Interestingly, the net effect is even larger than the gross one. By contrast, females born in East, South, and South-East Asia are about twice more likely to get a post-secondary degree than native-born females. Note that due to small sample size and low number of immigrants arrived during childhood in NMS13, this variable could not be included in models for this region.
Another significant result can be observed for the educational attainment of individuals according to their religious affiliation. Compared to being Christian, being Muslim significantly reduces the odds of obtaining a post-secondary degree in both regions and for both sexes and the effect remains significant even when controlling for the other variables. Since the education of the father could be a better explanatory variable than the education of the mother for Muslims [Gang and Zimmermann (Reference Gang and Zimmermann2000)], it is possible that part of the Muslim effect is due to the use of this later variable rather than the former.
With the exception of females in the NMS13 region, a significant and positive effect of religion also remains for the category “Other religions,” which mainly comprises Jews. Having no religion has a small positive effect on education in the gross models, but when controlling for the other variables this effect completely disappears, except for females in NMS13. In general, we can also conclude that the observed differences between religious groups are in part explained by their different composition in terms of mother's education or other variables, as the net effect of religion is always smaller than the gross effect.
Concerning the language spoken at home, the effect of speaking a non-European language on the odds of completing a post-secondary degree is generally reduced after a statistical control, but still remains negative and significant. Social issues underlying these differentials are distinct between EU15 and NMS13. In Eastern Europe, the non-official languages group comprises mainly Romani, whose educational pathways are well documented [Forray (Reference Forray2002)]. In the EU15, this group mostly comprises first and second generations of international immigrants.
Our results have shown that the net effect of the education of the mother on educational attainment is particularly strong, but that other sociocultural variables such as religion, language spoken at home, and in the case of EU15, the region of birth are also playing a significant role. Cohort composition has changed significantly along these dimensions in the course of the 20th century, and so we must aim to disentangle changes that occurred from the evolution of cohort composition and changes that affected the whole population. The second part of the analysis thus concerns the net cohort effect, which is the trend over cohorts once changes in population composition in terms of sociocultural variables and mother's education are factored out.
Figure 3 summarizes the net and gross cohort trends for males and females. For a simplified overview of the analysis, the graphs show the arithmetic average of cohort trend parameters across EU15 and NMS13 countries, and only provide odds for high education compared to the two lower categories.
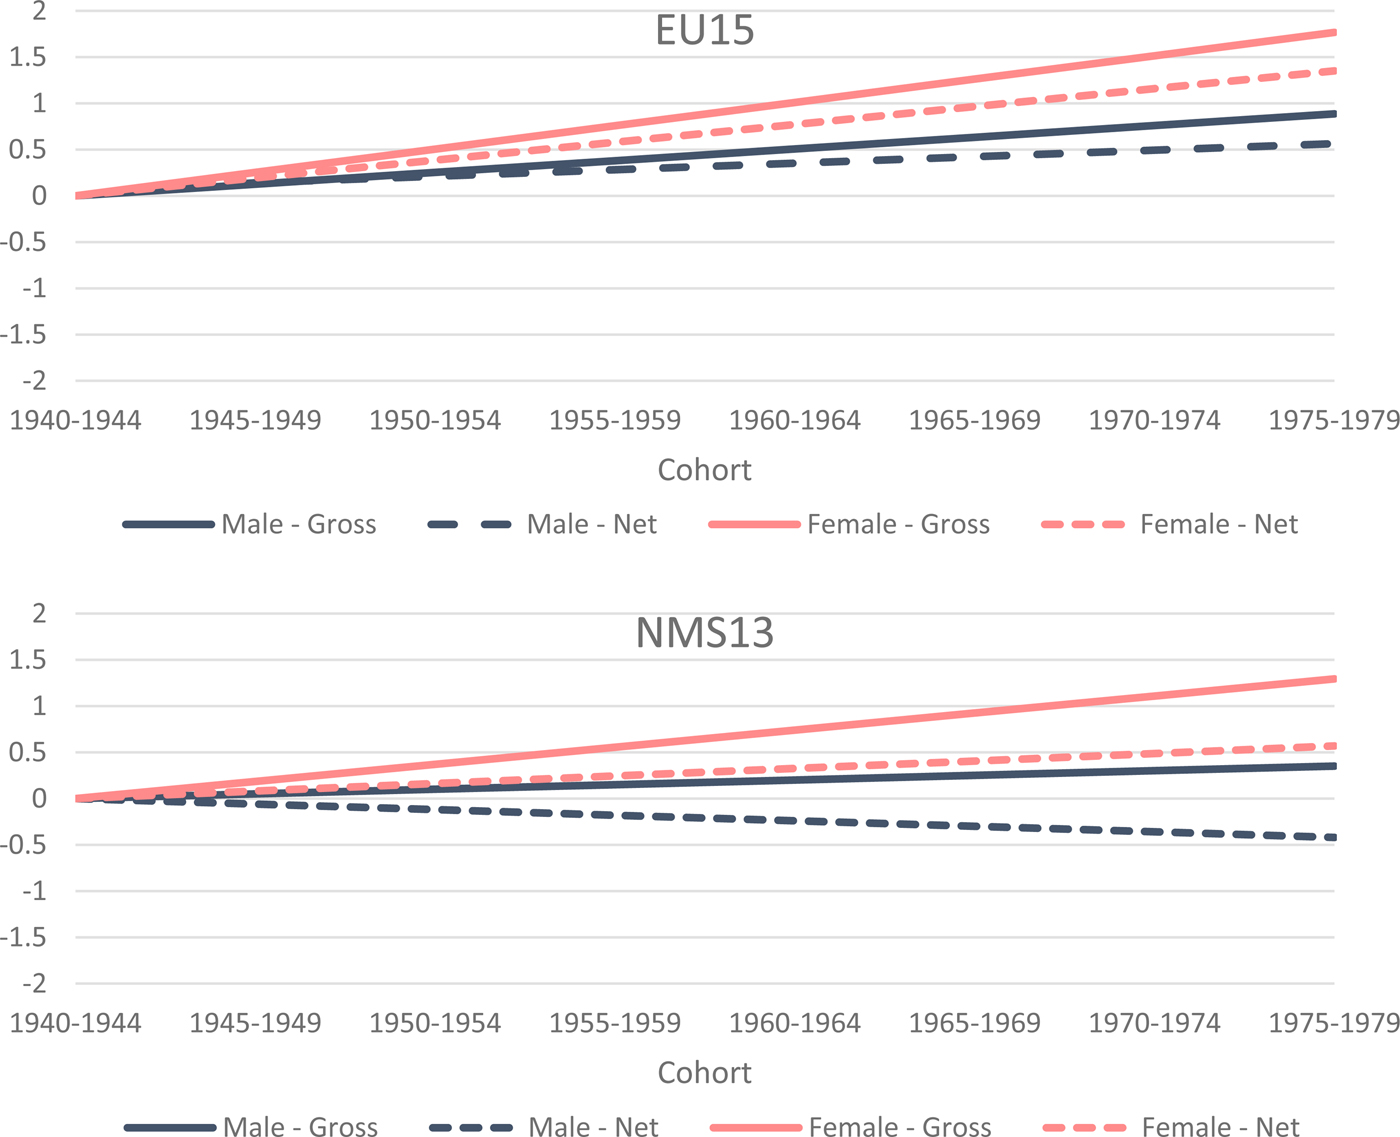
Figure 3. Comparison of gross and net cohort trends for the odds (logarithm) of getting a high level of education compared to medium or low levels.
When population composition in terms of sociocultural variables and mother's education is taken into account, cohort trends shift down significantly, in one case even changing the direction of the cohort trend from positive to negative. For males in the NMS13 region, gross odds ratios for high education followed a slightly increasing trend (Figure 3, NMS13, solid blue line). However, taking sociocultural variables and mother's education into account, the trend is reversed and becomes slightly negative (Figure 3, NMS13, dashed blue line). This result means that, ceteris paribus, a boy born in the 1970s from a mother with high education has less chance of obtaining a post-secondary level than a similar boy born in the 1940s. As a corollary, this shows that the observed improvement in the gross trends for NMS13 boys is more than completely explained by changes in population composition: there were more educated mothers in the 1970s than in the 1940s and consequently, children born in the 1970s are more likely to get a post-secondary degree. So the observed improvement in educational attainment of men in NMS13 among cohorts born between 1940 and 1979 is an echo of a past net cohort effect affecting previous cohorts of women. Because intergenerational transmission of education is high, a general increase in the level of education in a cohort reverberates in the following generations.
For females in both EU15 and NMS13 and for males in EU15, Figure 3 shows that population composition alone does not fully explain the observed improvement in educational attainment, since net cohort trends (dashed lines) still show improvements across cohorts. Nevertheless, the amplitude is reduced compared to gross trends (solid lines), meaning that a significant part of the improvement across cohorts is explained by sociocultural characteristics and by mother's education.
5. Implementing education of mothers and sociocultural variables in a microsimulation projection model of education
Given the results presented in Section 4, how does population composition in terms of mother's education and sociocultural characteristics affect the outcome of projections? Different forces will work in different directions.
On the one hand, international migration flows are likely to increase the proportion of people speaking a foreign language at home and of Muslims [Coleman (Reference Coleman2006)], which will likely have a negative impact on the average educational attainment. On the other hand, women are more educated than ever before, which is expected to positively affect their children's educational attainment. Moreover, the global increase in educational attainment, net of population composition effects, has been observed to level off or even decline in many countries.
To investigate how these dynamics could affect demographic projections of human capital, we designed five scenarios. First, we built two main scenarios to assess how taking into account sociocultural variables and the education of the mother impact projections of educational attainment:
(1) Gross cohort trend in education (GCTE)
In this scenario, educational attainment of future cohorts is extrapolated based on countries and cohort parameters for each sex (without controlling for sociocultural variables and mother's education). Because universal postsecondary attainment is unlikely to happen, the probability of getting a high degree of education is capped at 90% [Barakat and Durham (Reference Barakat, Durham, Lutz, Butz and KC2014)]. This type of scenario can be used in common cohort-components or multistate demographic projections, where future trends are a function of past trends by age and sex only [Lutz et al. (Reference Lutz, Butz and KC2014)].
(2) Multivariate determinants of education (MDE)
In this scenario, all parameters from equation (1) are used and cohort trends are extrapolated over the time span of the projection (postsecondary is capped at 90%, as in the first scenario). This second scenario allows isolating the effect of the different components of the model on the future evolution of educational attainment. As explained previously, taking many dimensions into account is best realized in a microsimulation model.
In short, scenario GCTE is closer to the reference scenario of the projection model used in Lutz et al. (Reference Lutz, Butz and KC2014), although without the specific convergence assumptions [Barakat and Durham (Reference Barakat, Durham, Lutz, Butz and KC2014)] and with different hypotheses in terms of immigration. Scenario MDE adds differentials according to sociocultural characteristics and education of the mother, so that the evolution of educational attainment can be decomposed into changes due to net cohort trends and changes due to the evolution of population composition.
In addition to these two main scenarios, we built three scenarios, taking the MDE scenario as a basis, but changing only a specific set of parameters. These scenarios allow analyzing how sensitive the modeling of education is to its different drivers of changes.
(3) Equality in education for Muslims (MDE-MuslimEq)
In this scenario, we set to 0 parameter for Muslims. In other words, this scenario assumes that there is no differential between Muslims and Christians in terms of educational attainment. Remember that the negative parameter associated with the mother's Muslim religion only describes a statistical relationship. It does not come from a causal analysis of the dynamics that could explain this observed relationship. The objective of this scenario is to test the sensitivity of the projection to this sociocultural variable, but additionally, it can also serve as an example of the potential impact of policies aimed at equal opportunities in education. Indeed, this statistical disadvantage to Muslim children may result from contextual factors associated with inequalities between neighborhoods and schools [Gronqvist (Reference Gronqvist2006), Pong and Hao (Reference Pong and Hao2007)], as well as unequal access to resources [Zhou (Reference Zhou2009)].
(4) Equality in education for children from low- and medium-educated mothers (MDE-EduM)
This scenario is set to 0 parameter for children from low- and medium-educated mothers and test how projection outputs are sensitive to this component of the equation. It thus assumes that these children have the same probability of getting the highest level of education than children from a high-educated mother. It may thus serve as an illustration of how policies improving the access to post-secondary education of children from less educated families may affect future education trends.
(5) Twice more Muslims among new immigrants (MDE-MuslimX2)
This scenario doubles the proportion of Muslims among new international immigrants (passing from about 30% to 60%). It tests how outcomes are sensitive to the migration composition in terms of religion.
In this paper, scenarios are built with the purpose of assessing how different models of education would affect projection results in the context of continued current demographic trends. Consequently, all scenarios assume continuation of recent trends for other demographic components of change, such as fertility, mortality, and domestic mobility.
Figure 4 shows the projected proportion of high education in the population aged 25–54 years old. First, concerning scenario GCTE and MDE, because of demographic inertia, the trends for high education are also very similar for the first decades of the projection. This occurs because educational attainment does not change for middle- and old-age adults: adults from the base population are only gradually replaced by new cohorts through a process of demographic metabolism [Ryder (Reference Ryder1965)]. At the end of the projection, however, results from the two scenarios differ by about five points, the proportion of post-secondary education being higher in scenario GCTE (52% vs. 48%). To a certain degree, in a scenario such as the GCTE in which no change in trends is explicitly modeled for major factors that are likely to change population composition, we can assume that gross cohort trends implicitly take population composition into account. The usefulness of microsimulation is that it makes it possible to explicitly model both the effects of a change in behavior and the effects of a change in population composition over time and to present the consequences of each on specific results pertaining to different population subgroups.
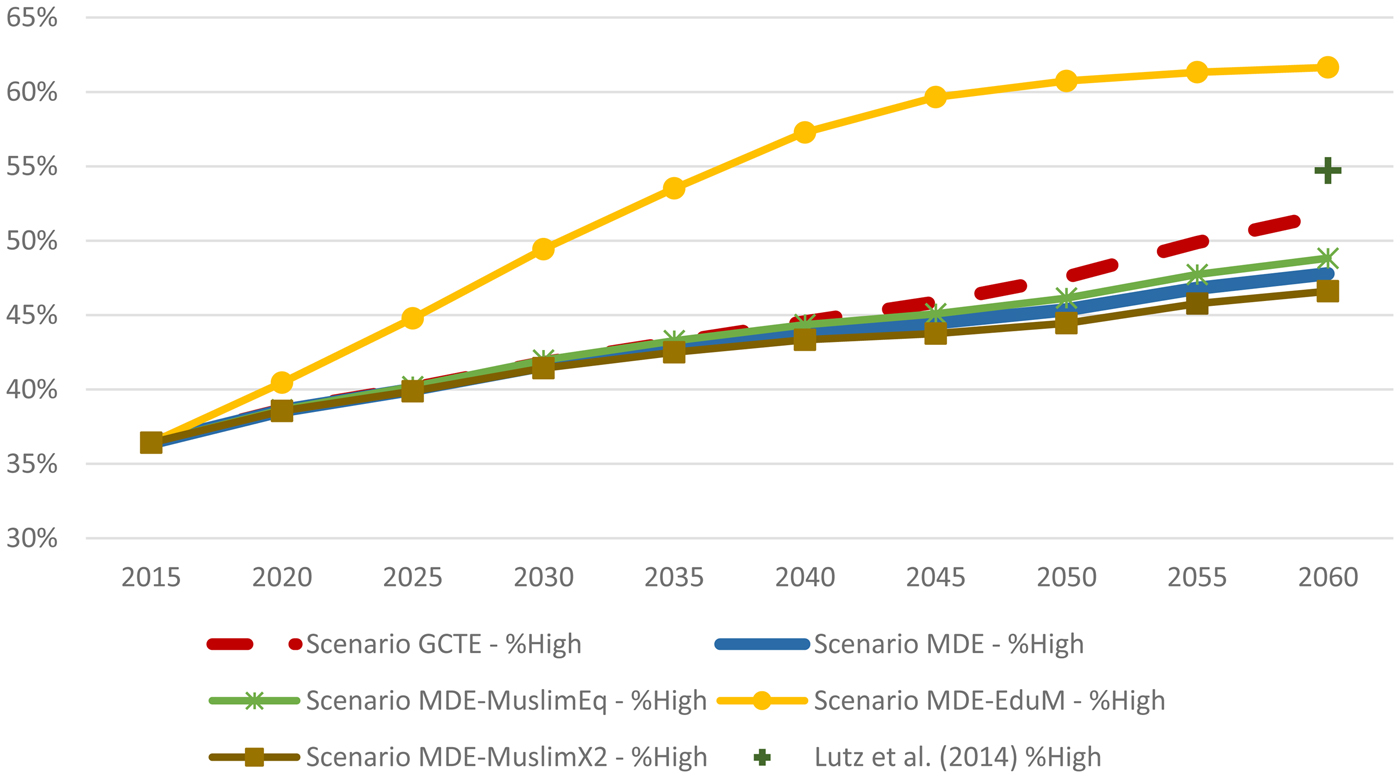
Figure 4. Projected proportion of high education, 25–54 years old, 2015–2060, EU26 (Luxemburg and Malta are excluded).
Different assumptions concerning parameters for the education of the mother may result into very different projection outcomes. The scenario MDE-EduM yields a much higher proportion of high-educated population in 2060 (62%). As shown by the scenario MDE-EduM, giving to children from low-educated mothers the same chance to get a post-secondary degree than those from a high-educated mother is likely to double the expected increase in the proportion of high-educated adults by 2060 compared to the MDE scenario. This outcome highlights the importance of the education of the mother as a driver of future educational trends and the potential gains in terms of future educational trends that can generate a policy aimed at increasing access to high education for children from less educated families. Scenarios MDE-MuslimEq and MDE-MuslimX2 yield about the same trend as MDE. The proportion of high educated is only slightly higher for MDE-MuslimEq and slightly lower for MDE-MuslimX2. Removing the parameter for the Muslim population is indeed unlikely to have a large effect on to whole European population because it only concerns a very small proportion of the population. For similar reasons, doubling the proportion of Muslims among immigrants cannot drastically change general educational trends among the whole population.
Integrating additional variables in the microsimulation model also allows for outputs that go beyond age, sex, and education, and that may thus provide valuable insights to European policy makers. Figure 5, for instance, contrasts the evolution of the proportion of Muslims in the total population and in the population with low education (age group 25–54).Footnote 9 It also illustrates the analytical possibilities provided by the microsimulation model which can generate outputs with much more dimensions.
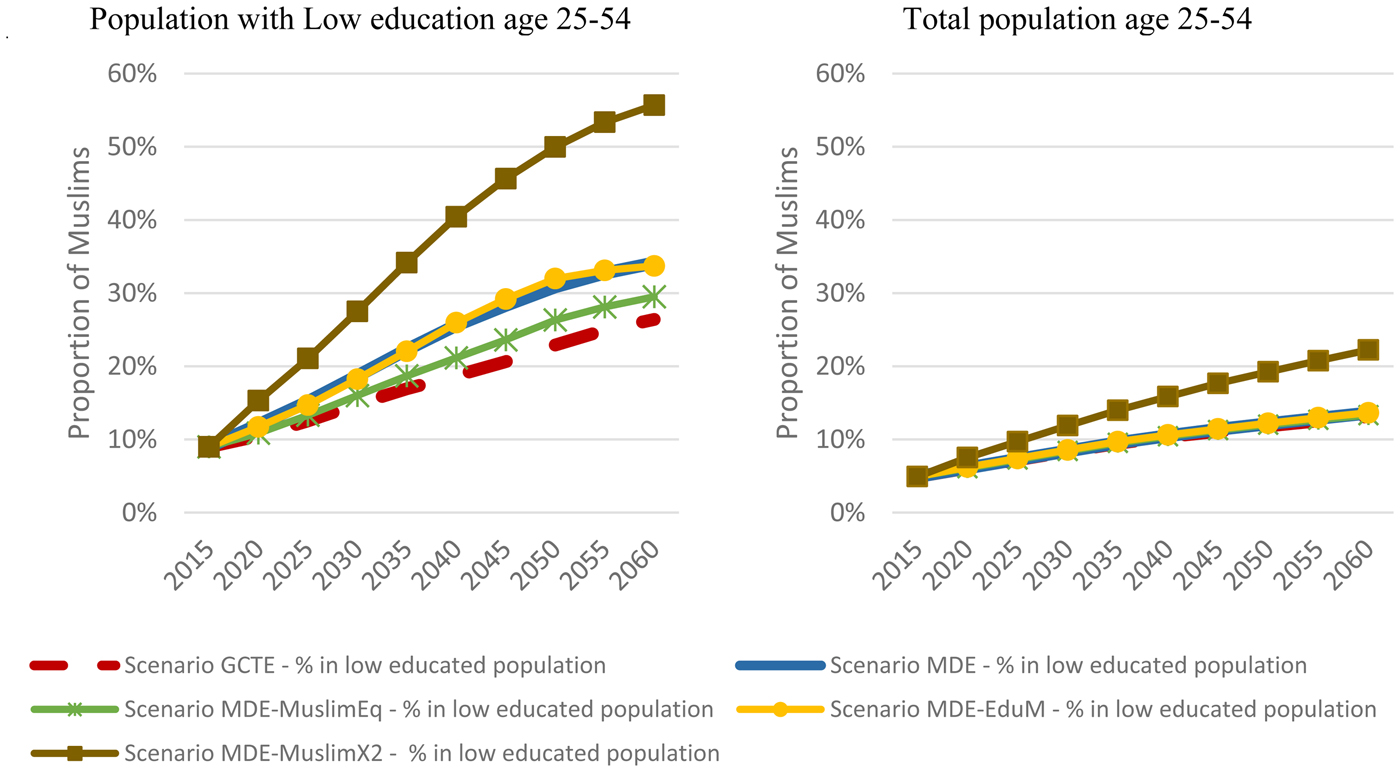
Figure 5. Projected proportion of Muslims in the total population and in the population with low education, age group 25–54, 2015–2060, EU26 (Luxemburg and Malta are excluded).
Figure 5 shows that for all scenarios, the proportion of Muslims is higher in the starting population and grows faster among the low-educated population than in the total population. In the population with low education, the growth of the proportion of Muslims increases about 50% faster in scenario MDE (blue line, left graph) when compared to scenario GCTE (red line, left graph). The proportion of Muslims in the population with low education increases from 9% in 2015 to 34% in 2060 in scenario MDE, compared to 26% in scenario GCTE. In scenario GCTE, the proportion of Muslims in the population with low education grows faster than in the total population solely because of assumptions on the intensity and composition of future immigration flows. In scenario MDE, the proportion of Muslims in the population with low education is also driven up by the religion-specific regression coefficient used in the derivation of educational attainment as well as by parameters for characteristics correlated with Muslims that affect negatively educational attainment (mother's education, region of birth, and language). The difference between scenarios GCTE and MDE in this specific output illustrates the importance of taking sociocultural variables into account in order to measure the impact of immigration on future educational attainment or on social cohesion and inequalities. Given that low-educated women, Muslims, and speakers of non-European languages will likely continue to be overrepresented in future cohorts of international immigrants compared to the native population, the outcome from the model variant MDE appears more plausible than the outcome from GCTE.
We saw that scenarios MDE-MuslimEq and MDE-MuslimX2 only slightly affected the EU28 trend in education. However, when looking at the Muslim population specifically, the effect of these alternative scenarios is much more evident. In 2060, the proportion of Muslims among the low educated is about five points of percent lower in the scenario MDE-MuslimEq compared to the scenario MDE. In opposite, the scenario MDE-MuslimX2 strongly increases the proportion of Muslims not only in the total population (brown line, right graph) (about 22% in 2060 vs. 13%–14% for other scenarios), but particularly among the low educated population (brown line, left graph) (about 55% in 2060 vs. 26%–34% for other scenarios).
In addition to testing how the model reacts to changes in parameters, scenarios MDE-MuslimEq and MDE-MuslimX2 are also examples of the potential of microsimulation in the generation of alternative scenarios to help understanding the interaction among different variables and the potential impact of public policies on education trends. While the scenario MDE-MuslimX2 showed that a change of the composition in immigration might lead into more disparities in education among sociocultural groups, the scenario MDE-MuslimEq revealed that a better access to post-secondary education for Muslim children is likely to reduce significantly those disparities. Such results, moreover, highlight important social fragmentation issues that could emerge from increasing immigration flows to Europe and rising inequalities in education without implementing programs facilitating better integration of the second generation for some population groups at risk of experiencing lower upward social mobility.
6. Conclusion
This paper makes several contributions to the modeling and projection of educational attainment. First, using ordered logistic regressions on ESS data, we have confirmed what had been already demonstrated in the scientific literature, namely that the education of the mother and sociocultural characteristics have a significant impact on educational attainment. In EU countries, mother's education has emerged as the main predictor of children's future educational attainment. Other sociocultural variables, such as being Muslim (especially for women) or speaking a non-European language at home, were also shown to decrease the odds of getting postsecondary education. It is important to stress that these results do not provide hints on the mechanisms involved or on normative actions to be taken. Those issues must be the object of further investigations.
Second, we described the design and structure of the education module in the CEPAM microsimulation model. The module uses a three step process. First, for individuals with incomplete educational paths, a final level of education is stochastically selected based on individual characteristics and parameters obtained from ordered logit regressions. The attributed level of education is then stored in a variable and age at graduation is determined in a second step based on graduation schedules provided by Eurostat. Finally, the life course of the individual is simulated and its education level is updated according to the provided schedule.
Third, the education module was used to further investigate the impact of using a multivariate approach in the modeling of educational attainment instead of using simple assumptions based on gross cohort trends in EU countries. The use of gross cohort trends or MDE in the projection of educational attainment leads to similar projection outcomes for the total population. However, when outputs on specific subpopulations are required, multivariate modeling of educational attainment is preferable because gross cohort trends tend to underestimate the impact of changes in the composition of the future population. The CEPAM microsimulation model can provide a more refined and richer set of outputs than a macro model including only age, sex, and education as dimensions. For instance, based on the assumptions of the model, we have shown that the share of Muslims grows faster in the population with low education than in the general population, possibly raising issues of segmented assimilation and increasing inequalities.
Fourth, different scenarios have been built to analyze how sensitive the modeling of education is to its different drivers of changes. A microsimulation model such as the one developed for the CEPAM project can be useful for policy makers as it can measure the effect of changes along several dimensions, thus allowing for a wide array of “What if” scenarios. For instance, the model can assess the effect of a scenario in which children from mothers with low education have the same probability of getting a post-secondary education as other children. We have shown that a change in the impact of mother's education on children's educational attainment may have a big effect on future trends. It could also investigate the impact of immigration selection, considering that immigrants’ characteristics would also affect the education of the second generation.
This paper presented the basic structure of the education module in the CEPAM microsimulation model. In many ways, this is a first iteration and further developments are still required. First, Malta and Luxembourg, which were missing from the pooled data of the ESS, should be modeled properly using other sources of data. Second, because post-secondary education is becoming increasingly relevant in knowledge-based economies, the high level of education should be broken down into three subcategories: postsecondary below bachelor's degree, bachelor's degree, and master's degree or above. To model these additional levels, other sources of data will be necessary, as the sample size of the ESS is too small to make robust estimations. Third, projections presented in this paper are based on a logit extrapolation of net observed cohort trends by sex and country. Other extrapolation assumptions should be explored to identify the best strategy for projecting cohort trends. Finally, with a policy-oriented focus, CEPAM-Mic will further be used to assess the impact on the population of different migration scenarios (in terms of size and composition), as well as scenarios related to changes in inequalities in education.
Author ORCIDs
Guillaume Marois, 0000-0002-2701-6286
Appendix
Table A1. Description of the sample

Table A2. Parameters from ordered logit regression on educational attainment