Plant lignans are one of the three main classes of polyphenolic compounds and they are classified as phyto-oestrogens (Stopper et al. Reference Stopper, Schmitt and Kobras2005). The outer fibre-containing layer of flaxseed is the richest source of plant lignans (Adlercreutz & Mazur, Reference Adlercreutz and Mazur1997) and secoisolariciresinol diglucoside (SDG) represents over 95% of total flax lignans (Liu et al. Reference Liu, Saarinen and Thompson2006). In non-ruminant animals, plant lignans are converted to mammalian lignans, enterodiol (ED) and enterolactone (EL), under the action of colonic bacteria (Setchell et al. Reference Setchell, Lawson, Mitchell, Adlercreutz, Kirk and Axelson1980). In ruminant animals, studies in vivo showed that ruminal microbiota of goats convert SDG to ED and EL, and that EL is the main lignan metabolite present in ruminal fluid (Zhou et al. Reference Zhou, Wang, Han, Yao and Zhu2008). Our in-vivo results showed that the rumen is the main site for metabolism of flax lignans in dairy cows and EL is excreted in urine, blood and milk, indicating that phyto-oestrogens can be transferred in physiological fluids (Gagnon et al. Reference Gagnon, Côrtes, da Silva, Kazama, Benchaar, dos Santos, Zeoula and Petit2009).
Presently there is a great deal of interest in promoting increased intakes of lignans in the human diet for their potential health benefits, especially in the prevention of cardiovascular diseases, hypercholesterolaemia, breast and prostate cancers, and osteoporosis (Adlercreutz, Reference Adlercreutz2007). Greater consumption of flax lignans may be potentially beneficial to human health as shown by the inverse relationship between blood concentrations of EL and the incidence of cardiovascular diseases (Vanharanta et al. Reference Vanharanta, Voutilainen, Lakka, Van der Lee, Adlercreutz and Salonen1999). Consumption of milk and dairy products enriched in EL could be an excellent strategy to increase intake of mammalian lignans. According to Saarinen et al. (Reference Saarinen, Smeds, Mäkelä, Ämmälä, Hakala, Pihlava, Ryhänen, Sjöholm and Santti2002) deconjugated EL may be passively absorbed along the intestine whilst plant lignans must first be converted by microbes to EL in the colon before being absorbed. Moreover, there is a 5-fold increase in urine excretion of EL in rats fed pure EL compared with those fed plant lignans (Saarinen et al. Reference Saarinen, Smeds, Mäkelä, Ämmälä, Hakala, Pihlava, Ryhänen, Sjöholm and Santti2002), indicating that the mammalian lignan EL is highly available for absorption and utilization by mammals.
Our previous results showed a linear increase in EL concentration of milk with increasing concentrations of flaxseed meal (FM) in the diet of dairy cows (Petit & Gagnon, Reference Petit and Gagnon2009). However, there is no information on the kinetics of excretion of EL in milk of dairy cows fed flax lignans. Therefore, the objectives of the present experiment were to determine the length of time to obtain peak EL concentration in the milk of dairy cows fed FM and the length of time to return to EL baseline level in milk when cows are switched from high to low intake of flax SDG.
Material and Methods
Cows, diets and experimental procedures
The experiment was conducted using 12 multiparous lactating Holstein cows in a complete randomized design to study weekly kinetics of milk excretion of the mammalian lignan EL over a 6-week period. Cows were kept in individual stalls with free access to water and they were fed for ad libitum intake (10% refusals) twice a day (8·30 and 14·30). Cows averaged 61 (se =18) days in milk at the start of the experiment with an average body weight of 645 (se=33) kg and an average body condition score of 3·27 (se=0·33; 5-points scale; Edmonson et al. Reference Edmonson, Lean, Weaver, Farver and Webster1989). No antibiotics were given for at least 16 weeks before the start of the experiment. The total mixed diets were formulated to meet requirements for cows of 650 kg body weight producing 35 kg/d of milk with 3·8% fat (NRC, 2001). The two total mixed diets (Table 1) were a control diet (CO) and a diet with 20% FM in the dry matter (DM). Cows were assigned randomly to one of two feeding regimens: the CO diet was fed for the whole experiment or the FM diet was fed for a period of 3 weeks (from the beginning of week 1 to the end of week 3) and then cows were switched to the CO diet for another 3-week period (from the beginning of week 4 to the end of week 6). Individual feed intake was measured for four consecutive days in week 3 of the experiment. Weekly samples of diets CO and FM were collected and composited on a 6-week and 3-week basis, respectively, and kept frozen at −20°C for SDG analysis. Cows were milked twice a day at 8·00 and 20·00. Milk production was recorded at every milking. Milk samples were collected before the morning meal at the beginning of week 1 before introduction of dietary treatments and thereafter once a week. All milk samples were frozen at −20°C for EL analysis. Animals were cared for according to the guidelines of the Canadian Council on Animal Care (Reference Olfert, Cross and McWilliam1993).
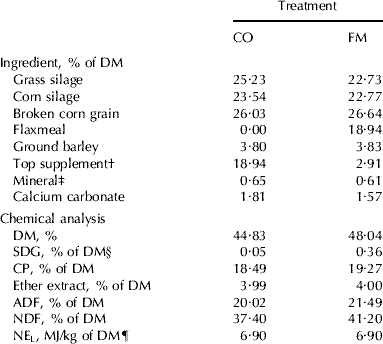
Table 1. Ingredient and chemical composition of total mixed diets of Holstein cows fed no flaxseed product (CO) or 20% flaxseed meal (FM) in the dry matter (DM)

† Contained 20% of canola meal, 30% of corn gluten meal, 20% of soybean meal, 30% of brewer's corn
‡ Contained 8·96% Ca, 4·89% P, 4·90% Mg, 1·80% S, 14% Na, 1·43% K, 2071 mg/kg Fe, 60 mg/kg Zn, 447 mg/kg Cu, 1814 mg Mn, 0·89 mg/kg I, 20 mg/kg Se, 451 747 i.u./kg of vitamin A, 58 005 i.u./kg of vitamin D3, and 2692 i.u./kg of vitamin E
§ SDG; secoisolariciresinol diglucoside
¶ Calculated using published values of feed ingredients (NRC, 2001)
Lignan analyses
Extraction and analysis of SDG in diets was performed according to the procedures described by Muir & Westcott (Reference Muir and Westcott2000). Lignans in milk samples were hydrolysed and extracted according to the method of Frank & Custer (Reference Frank and Custer1996) with some modifications. Briefly, 500 μl of warmed (40°C) milk was mixed with 5 μl of ß-glucuronidase/arylsulphatase from Helix pomatia (Roche-Diagnostics, Laval, QC, Canada). Milk samples were incubated for 1·5 h at 37°C in a shaking waterbath. After hydrolysis, samples were acidified with 10 μl of 6 m-HCl and washed with 3 ml of hexane to remove lipids (Raffaelli et al. Reference Raffaelli, Hoikkala, Leppälä and Wähälä2002). The samples were vortex-mixed twice for 2 min in 2 ml of diethyl ether. The organic layer was separated by freezing. The remaining liquid phase was submitted to a second extraction under the same conditions. The organic layers were pooled and evaporated by vacuum (Speed-Vac; Thermo Savant, Holbrook NY, USA) at room temperature for 40 min. The dry extract was redissolved in 500 μl of enzyme immunoassay (EIA) buffer and warmed at 37°C for EL analysis using an EIA kit (Cayman Chemical, Ann Arbor MI, USA) as described by Gagnon et al. (Reference Gagnon, Côrtes, da Silva, Kazama, Benchaar, dos Santos, Zeoula and Petit2009).
Statistical analyses
All data were analysed using the MIXED procedure of SAS (2000). Feed intake data averaged for week 3 and initial body weights were used for statistical analysis. Milk production data were analysed with repeated measurements using the PROC MIXED procedure. Data on EL concentrations were transformed (log) as previously performed by Nesbitt et al. (Reference Nesbitt, Lam and Thompson1999) to represent normal distribution. A repeated analysis of data on EL concentrations was first performed to look at the probability level of the interaction between time and treatment. t Tests with a Satterthwaite adjustment were systematically performed for each week and specific comparisons for differences between time points were tested using a paired t test. Results on milk EL concentrations in Fig. 1 are reported as the adjusted mean values (with 95% confidence interval) on the original scale of measurements (back-transformation). Significance was declared at P<0·05 and a trend at P<0·10.

Fig. 1. Concentration of enterolactone (EL) in the milk of Holstein cows fed no flaxseed product (▪) or 20% flaxseed meal (□) in the dry matter. Data are mean values with 95% confidence intervals. There was an interaction (P<0·0001) between feeding regimen and week.
Results and Discussion
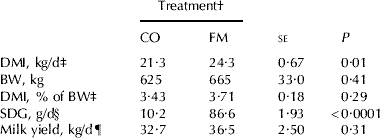
Daily intake of DM, expressed in kg/d, was higher (P=0·01) for cows fed FM than for those fed CO (Table 2). However, when DM intake was expressed as a percentage of body weight, there was no difference between diets. Similarly, recent results (Petit & Gagnon, Reference Petit and Gagnon2009) show no difference in DM intake when 0–15% of FM was added in the diet of mid-lactating dairy cows. Although no information on feed intake was found when FM was fed at more than 15% of the DM, the present results indicate that FM is likely to be a good feed ingredient for diets of dairy cows as reported previously (Petit & Gagnon, Reference Petit and Gagnon2009). A linear increase in milk EL concentration has been reported when feeding 0–15% FM in the DM (Petit & Gagnon, Reference Petit and Gagnon2009), thus suggesting that adding more than 15% FM may lead to further increase in milk EL concentration. In the present study, the 20% FM incorporation was chosen to give a more marked response in the level of EL in milk, thus making it easier to measure the kinetics of the mammalian lignan EL and also to determine whether such a high concentration of FM in the diet could be adopted in practice to replace other protein supplements without detrimental effect on DM intake. Our results then may suggest that it is possible to add FM as the sole protein supplement in the diet of dairy cows. Intake of SDG was higher (P<0·001) for cows on the FM diet than for those on the CO diet as a result of SGD concentration that was 7·2-times higher for the former diet. It is known that lignans in grains are concentrated in the outer fibre-containing layers (Adlercreutz & Mazur, Reference Adlercreutz and Mazur1997), which would lead to higher concentration of SDG in flax products with lower concentration of oil. Indeed, dairy cows fed 10% FM in the DM had higher intake of SDG than those fed 10% whole flaxseed (Petit et al. Reference Petit, Gagnon, Mir, Cao and Cui2009). However other feed ingredients in the ration such as forages and cereals, which also contain SDG (Penalvo et al. Reference Penalvo, Haajanen, Botting and Adlercreutz2005; Steinshamn et al. Reference Steinshamn, Purup, Thuen and Hansen-Møller2008) explain the presence of SDG in the CO diet.
Table 2. Dry matter intake (DMI), initial body weight (BW), and milk yield of Holstein cows fed no flaxseed product (CO) or 20% flaxseed meal (FM) in the dry matter

† Mean value with se
‡ Intake determined in week 3
§ SDG; secoisolariciresinol diglucoside
¶ Feeding regimen×week interaction (P=0·047)
Concentrations of EL in the milk of cows fed the CO regimen were similar (P=0·27) over time and ranged from 34·7 to 53·5 μg/l (Fig. 1), which agrees with the average content reported in previous studies (Antignac et al. Reference Antignac, Cariou, Le Bizec and André2004; Steinshamn et al. Reference Steinshamn, Purup, Thuen and Hansen-Møller2008). On the other hand, lower EL concentrations have been observed in the milk of cows fed no flaxseed product (Petit & Gagnon, Reference Petit and Gagnon2009). Plant lignans such as matairesinol, pinoresinol and lariciresinol also are converted to EL (Heinonen et al. Reference Heinonen, Nurmi, Kiukkonen, Poutanen, Wähälä, Deyama, Nishibe and Adlercreutz2001) and Milder et al. (Reference Milder, Arts, van de Putte, Venema and Hollman2005) reported that pinoresinol and lariciresinol are present in higher concentrations than SDG and matairesinol in many plants. Therefore feed ingredients other than flax products may contribute to modulating the level of EL in the milk of cows fed no flaxseed products. Concentration of EL in milk also could be affected by the efficiency of conversion of SDG to EL by ruminal microflora. Using another class of phyto-oestrogen, Setchell et al. (Reference Setchell, Brown and Lydeking-Olsen2002) reported that the efficiency of human colonic conversion of the plant precursor isoflavone diadzein to the end product equol is increased by dietary components such as fibre and protein through stimulation of bacterial fermentation.
As expected, there was an interaction (P<0·0001) between feeding regimen and week for milk concentration of EL as a result of higher concentration of EL from week 1 to 3 for cows on the FM regimen compared with those on the CO regimen (Fig. 1). Concentrations of milk EL on the FM regimen maintained uniform high levels from week 1 to 3 (P=0·41) and they decreased (P<0·0001) from week 3 to 4 when the CO diet was reintroduced in week 3. The difference from milk EL concentration measured on the first day of the experiment was similar between the two groups (P=0·14) from week 4 to 6 when all cows were fed the CO diet. Many studies have investigated the effect of feed ingredients on concentration of phyto-oestrogens in milk but, to our knowledge, the present study is the first one to investigate the kinetics of EL excretion in the milk of dairy cows fed high levels of SDG and the clearance of EL when cows are switched from high to low intake of SDG.
There was an interaction (P=0·047) between dietary treatment and week for milk yield as a result of an increase in milk yield from week 1 to 2 for cows on the FM regimen (36·5 and 37·5 kg/d for weeks 1 and 2, respectively) and a decrease for those on the CO regimen (32·8 and 31·6 kg/d for weeks 1 and 2, respectively). However, there was no overall feeding regimen effect on milk production (Table 2).
The present results suggest that the conversion of SDG to the mammalian lignan EL and the transfer of EL to the mammary gland are well established after one week of feeding 20% FM in the diet of dairy cows and that milk concentration of EL returns to the baseline level after one week of FM deprivation. New knowledge on the kinetics and excretion of EL in milk may provide an opportunity for dairy producers interested in producing value-added milk naturally enriched in mammalian lignans to respond quickly to the market (in less than one week) when there is an economic advantage to producing special milk and dairy products.
We thank Steve Méthot for his help in analysing the data and the staff of the Dairy & Swine Research & Development Centre for care of the animals.