Introduction
Mathematical models used in fitting longitudinal traits, such as lactation and growth, contribute toward better management decisions (Leclerc et al. Reference Leclerc, Duclos, Barbat, Druet and Ducrocq2008; Løvendahl & Chagunda, Reference Løvendahl and Chagunda2011). There is a long history of implementing mathematical models to explain the specific shape of the lactation curve (Wood, Reference Wood1967; Cobby & Le Du, Reference Cobby and Le Du1978; Adediran et al. Reference Adediran, Ratkowsky, Donaghy and Malau-Aduli2012). The lactation curve has been fitted using either nonlinear Wood (Wood, Reference Wood1967), Wilmink (Wilmink, Reference Wilmink1987), or polynomial (Ali & Schaeffer, Reference Ali and Schaeffer1987) models. There is no single model for the lactation curve that is best in all aspects. From the statistical point of view, one modeling challenge is to capture the rapid increase in milk production before the peak yield (Wilmink, Reference Wilmink1987). In physiological applications the ability to predict average energy balance and metabolic diseases is a major goal (Friggens et al. Reference Friggens, Ridder and Løvendahl2007; Friggens & Løvendahl, Reference Friggens, Løvendahl, Royal, Friggens and Smith2008; Sundrum, Reference Sundrum2015).
All longitudinal models applied in fitting the lactation curve assume that there is a common shape of lactation shared by all animals; i.e. the mean curve. ‘The mean curve’ represents the quantile 0·50 under normal distribution assumptions. In this study, a new approach is chosen to fit different lactation curves evaluated at different production levels using quantile regression (QR). QR as a useful supplement to the least squares regression was introduced by Koenker & Bassett (Reference Koenker and Bassett1978), in economics. Conceptually, a quantile p corresponds to a production level that divides producing animals into two groups with either proportion p (higher production) or 1 − p (lower production). This model is a flexible tool that allows a specific lactation curve at any production level of the trait. The quantile in which lactation curve is of interest can be pre-determined regarding economic and management criteria. Therefore, using QR can be more appropriate, for instance, where the pattern of lactation differs between high and low producing cows. A more insightful example is the level of somatic cell score (SCS) in mastitic cows which is not distributed as SCS in healthy cows (Rupp & Boichard, Reference Rupp and Boichard1999; Nash et al. Reference Nash, Rogers, Cooper, Hargrove, Keown and Hansen2000).
Further, QR is extremely robust against outliers and heterogeneous residuals (Buchinsky, Reference Buchinsky1995). QR is being used in many research areas such as medicine (Wei et al. Reference Wei, Pere, Koenker and He2006; Beyerlein, Reference Beyerlein2014), economics (Chernozhukov & Hansen, Reference Chernozhukov and Hansen2006) and genetics (Huang & Lin, Reference Huang and Lin2007; Briollais & Durrieu, Reference Briollais and Durrieu2014). Different functions can be accommodated in the QR framework based on the shape of a curve. In this paper, four widely used functions in animal science including Wood (Wood, Reference Wood1967), Wilmink (Wilmink, Reference Wilmink1987), Dijkstra (Dijkstra et al. Reference Dijkstra, France, Dhanoa, Maas, Hanigan, Rook and Beever1997) and Ali & Schaeffer (Ali & Schaeffer, Reference Ali and Schaeffer1987) were examined.
Applying QR can lead to making precise management decisions for each level of production, whereas regular linear models do not provide this information. The aim of this study was to introduce QR in modeling the lactation curve and to evaluate the goodness of fit of different functions in QR framework at different quantiles of milk production traits and SCS. In this study quantiles 0·25, 0·50 and 0·75 were chosen in order to estimate and compare lactation curves between low, medium and high producing cows.
Materials and methods
Data were recorded on 13 977 first lactation dairy cows in 183 herds from 1991 to 2011 by the Animal Breeding Center of Iran. The average number of test day records of each cow was 7·91 with a minimum of three and maximum of 10 records. The average daily milk yield, fat and protein percentage and SCS were 30·16 kg, 3·35, 3·06 and 4·47, respectively. All herds had three times milking program. Records with DIM <5 and >300 were removed. Age at first calving was between 20 and 40 months. The natural logarithm transformation of somatic cell count (SCC) was performed to decrease the deviation from normality (Ali & Shook, Reference Ali and Shook1980; Ødegård et al. Reference Ødegård, Heringstad and Klemetsdal2004). Some descriptive statistics of the data have been presented in Supplementary Table S1.
Four mathematical functions were used in the QR model to describe the lactation curve. In the QR theory there is no assumption underlying the distribution of error terms but randomness. Ignoring error terms, the systematic part of the functions under study were:
 $${\rm Wood} \; \lpar {{\rm WD}} \rpar \quad y_{\tau t} = at^be^{-ct}$$
 $${\rm Wilmink} \; \lpar {{\rm WIL}} \rpar \quad y_{\tau t} = a + b \times e^{-0.046t} + ct$$
 $${\rm Ali}\,{\rm \&} \,{\rm Schaeffer\ (AS)}\quad y_{\tau t} = a + b\left( {\displaystyle{t \over {305}}} \right) + c\left( {\displaystyle{t \over {305}}} \right)^2 \, + \, d\left[ {\ln \left( {\displaystyle{{305} \over t}} \right)} \right] + g\left[ {\ln \left( {\displaystyle{{305} \over t}} \right)} \right]^2\; $$
 $${\rm Dijkstra\ (DJ)}\quad y_{\tau t} = ae^{\lsqb {b\lpar {1-e-ct} \rpar /\lpar {c-dt} \rpar } \rsqb }$$
where y τt represents the trait; a, b, c, d and g are the parameters that define the scale and shape of the lactation curve; t is DIM. For milk yield, the Wood model is a gamma function, in which parameter a approximates the initial milk yield after calving, b is the inclining slope parameter up to the peak yield, and c is the declining slope parameter (Wood, Reference Wood1967). In Wilmink model, parameter a is the level of production, b is the initial raise to the peak and c is the decreasing rate after the peak. The factor k was set to 0·046 (Wilmink, Reference Wilmink1987; Macciotta et al. Reference Macciotta, Vicario and Cappio-Borlino2005) and is associated to the time of peak yield. The Ali & Schaeffer model was a second order regression of yields on days in lactation and on natural logarithm of 305-days yield divided by the day in lactation (Ali & Schaeffer, Reference Ali and Schaeffer1987). Dijkstra et al. (Reference Dijkstra, France, Dhanoa, Maas, Hanigan, Rook and Beever1997) proposed a mechanistic model with four parameters that describe the mammary growth pattern (cell proliferation and apoptosis) of mammals during pregnancy and lactation. The parameters of all functions were estimated using the ‘nlrq’ function of the ‘quantreg’ package in R (Koenker, Reference Koenker2017).
The models were fitted to data and compared using root mean square error (RMSE), Akaike's information criterion (AIC) and the log-likelihood.
RMSE is a kind of generalized standard deviation and was calculated as follows
 $${\rm RMSE\ =} \displaystyle{{{\rm RSS}} \over {\sqrt {n-p-1}}} $$
where, RSS is the square root of residual sum of squares, n is the number of observation and p is the number of parameters in the model,
AIC was calculated using the following equation (Akaike, Reference Akaike1974)
 $${\rm AIC} = -2\,{\rm log(}L{\rm )} + 2p,$$
Therein L is the maximized value of the likelihood function for the estimated model and p is the number of estimated parameters.
Smaller values of RMSE, AIC and higher values of the log-likelihood (log(L)) indicate a better fit when comparing models.
Quantile regression
The QR method is able to find more effects than classical regression and tests whether there is a change in the τth quantile of response variable for any certain τ ∈ (0, 1) instead of localizing on the variation in the mean of response variable (Koenker & Bassett, Reference Koenker and Bassett1978). When the conditional distributions of response variable are non-Gaussian, the mean might not be the best summary, and any variation in distributions may not be detected. In QR, for fixed τ ∈ (0, 1) the following model can be determined
 $$Q_\tau {\rm (}y_i{\rm \vert} \; \beta, \; x_i) = f\,(x_i,\beta _\tau )$$
where x i is the vector of covariates and β τ denotes a vector of unknown parameters on the τth (conditional) response quantile and is estimated such that proportion τ of the data having records below that quantile. In our analyses, covariate x i was DIM, model f was either WD, WIL, AS or DJ and parameter vector β τ was consisted of parameters of the models, namely, a, b, c, d, g. The model is defined as
 $$y_i = f\,(x_i,\beta _\tau ) + \varepsilon _i,$$
where ε i is random error term which can take any distribution. The parameters β τ can be estimated by solving the following
 $$\hat{\beta} (\tau ) = _{\; \; \; \; \; \; \; \; \; \beta \in R}^{{\rm arg\; min}} \mathop \sum \limits_{i = 1}^n \rho _\tau \lpar {y_i-f\,(x_i,\beta_\tau )} \rpar $$
 $$\rho _\tau (x) = x(\theta -I\lpar {x \lt 0} \rpar = \left\{ {\matrix{ {\tau_x\; \; \; \; \; \; \;\;\; \; \; \; {\rm if} \quad x \ge 0} \cr {\lpar {\tau -1} \rpar x\; \; \; {\rm if} \quad x \lt 0} \cr} \; \;} \right\}$$
where, the QR loss function (10) is an asymmetric absolute loss function that allocates weights τ and (τ − 1) to the positive and negative deviations. L1-norm estimator or least absolute deviation (LAD) estimator is obtained by taking τ = 1/2 and is often chosen as a replacement to least squares estimators. It performs better in the attendance of heavy-tailed distributions and in the upper or lower quantiles of the response variable, especially in situations where data include outliers.
Results and discussion
Goodness of fit statistics for milk production traits from different QR models are presented in Table 1. In a given quantile, the RMSE between models was similar and could not be used for model comparison. In terms of AIC, across all models, the 0·50th quantile (Q50) was best in describing milk yield data followed by the Q75 and Q25. For fat and protein percentage Q50 had the lowest AIC, followed by the Q25 and Q75 (Table 1). Based on AIC and log L, across quantiles, functions WIL, DJ and AS performed best in analyzing milk yield, fat and protein percentage, respectively (Table 1). WD function was consistently poor for all milk production traits in different quantiles. Goodness of fit statistics for SCS with different QR models have been presented in Table 2. In terms of AIC, among quantiles across all models the Q25 was the best followed by the Q50 and Q75. The results indicated that WD function had the worst fit of lactation curve for SCS, whereas, DJ and AS functions were best based upon AIC (Table 2).
Table 1. Goodness of fit statistics of different models in the same quantile
Fatp, fat percentage; Prop, protein percentage.
Table 2. Goodness of fit statistics of different models for all quantile for somatic cell score

To our knowledge, there is no report on the performance of QR models on analysis of lactation curve, but our findings can be compared with other studies based on random regression models. Boujenane (Reference Boujenane2013) showed that based on RMSE, WD, AS and WIL models were similar in fitting lactation curve of Moroccan Holstein dairy cows. Quinn et al. (Reference Quinn, Killen and Buckley2005) reported that the AS model gave the best fit to the lactation curve of Irish cows, compared with the WIL model. The results obtained in this study were different to those of Olori et al. (Reference Olori, Brotherstone, Hill and McGuirk1999), who found that AS and WIL provided residuals error smaller than WD function. Elahi Torshizi et al. (Reference Elahi Torshizi, Aslamenejad, Nassiri and Farhangfar2011) reported that amongst models (WD, WIL, AS and DJ), based on RMSE the AS model was the best model and WIL the worst model for milk yield trait. In fitting WD, WIL, AS and DJ models to lactation curve of Australian Holstein dairy cows data, Adediran et al. (Reference Adediran, Ratkowsky, Donaghy and Malau-Aduli2012) showed that AS and DJ performed best and worst, respectively. In fitting average test day milk yield, Adediran et al. (Reference Adediran, Ratkowsky, Donaghy and Malau-Aduli2012) reported that regression with DJ function had the lowest Bayesian Information Criterion (BIC) compared to WD, WIL and AS functions. Dematawewa et al. (Reference Dematawewa, Pearson and VanRaden2007) analyzed extended lactation curve for milk, fat and protein yield in US Holsteins and found that WIL was best function based on BIC but WD, WIL and DJ produced similar RMSE. Some studies have reported that WD model is more appropriate in fitting lactation curve (Papajcsik & Bodero, Reference Papajcsik and Bodero1988; Boujenane, Reference Boujenane2013; Ferreira et al. Reference Ferreira, Henrique, Vieira, Maeda and Valotto2015). Pakdel et al. (Reference Pakdel, Heydaritabar and Nejati Javaremi2010) applied six nonlinear models in different lactations to describe SCS and reported that at first and second lactations AS function was best, whereas in later lactations Morant & Gnanasakthy (MG) function was the best model. In the study of Rodriguez-Zas et al. (Reference Rodriguez-Zas, Gianola and Shook2000), AS model had the lowest MSE and the performance of WD model was worst and based on log Land AIC, MG and AS models were best, respectively.
QR can provide useful information on the shape and variation of lactation curves at different levels of production. We did not find similar QR analysis of lactation curve to compare the results. Ferreira et al. (Reference Ferreira, Henrique, Vieira, Maeda and Valotto2015) split the data to four sets according to the quantiles Q25, Q50 and Q75 and then employed a regression with several nonlinear functions to each of the four datasets. They showed that for low and medium producing cows WD function fitted best to the data and for high producing cows DJ had the best model fit. The problem with splitting the data is that only a fraction of the data is used in the analysis and the rest are kept out, whereas, in QR analysis parameters are estimated using a loss function based on whole data irrespective of which quantile is being considered (Koenker & Bassett, Reference Koenker and Bassett1978).
The estimated parameters of WD, WIL, AS and DJ models at different quantiles for milk yield, fat and protein percentage and SCS have been shown in Tables S1, S2, S3 and S4 of the supplementary file. For milk yield all parameters at the three quantiles were significantly different from zero (P < 0·01), except in AS function, where parameter g at Q25 and Q50 was not significantly different from zero (P > 0·05). Over quantiles, parameter a increased and b decreased in WD and WIL functions. Parameter c was quite constant in the WD and WIL functions. The trend of parameters in AS function over quantiles was quadratic such that the highest absolute values were observed in Q50 followed by Q75 and Q25. In DJ function, parameter a was increasing with quantiles and parameters b and c were constant (Supplementary Table S1). Scott et al. (Reference Scott, Yandell, Zepeda, Shaver and Smith1996) reported that the WD function has the tendency to overestimate milk yield prior to the peak yield and at the final stage of lactation. Elahi Torshizi et al. (Reference Elahi Torshizi, Aslamenejad, Nassiri and Farhangfar2011) reported that the WD function underestimates milk yield in the days 5 to 100 of lactation.
For fat percentage all parameters at the three quantiles were significant (P < 0·05), except, parameter g of AS at Q50, which was not statistically different from zero (P > 0·05). Parameter a in both WD and WIL functions increased over quantiles, whereas, parameter c did not differ among quantiles. Parameter b was increasing by quantile in WIL, but constant in WD function (Supplementary Table S2). There was an irregular trend for parameters of AS function over quantiles. In DJ function parameters a and d increased and parameters c and b were constant over quantiles (Supplementary Table S2).
For protein percentage all parameters at different quantiles were significant (P < 0·01), except, in AS function, where, parameter b at Q50 and Q75 and parameter c at Q75 were not significantly different from zero (P > 0·05). In general, standard errors of the parameters were much smaller than the ones of fat percentage (Supplementary Table S3). Therefore, the estimated parameters are more reliable. For protein percentage parameter a, that models the initial production level was increasing in all functions. It was a general pattern that parameter c in WIL and WD functions were always constant that shows declining (for milk yield) or increasing (for fat and protein percentage) slope is not changed by production level (Supplementary Tables S1–S3).
For SCS all parameters at different quantiles were significant (P < 0·01), except in AS function, where, parameter g at Q25 and Q50 and parameter d at Q50 were not significantly different from zero (P > 0·05). Parameter a, the initial level of SCS, showed an increasing trend over quantiles, that was similar to other studied traits (Supplementary Table S4).
Inadequacy of WD function in fitting lactation curve of SCS has been reported by Pakdel et al. (Reference Pakdel, Heydaritabar and Nejati Javaremi2010) and Rodriguez-Zas et al. (Reference Rodriguez-Zas, Gianola and Shook2000) in random regression framework.
From management and breeding point of view, the aim is not only fitting the best model, but also understanding the details of lactation at specific levels of production. QR is a tool to disentangle different shapes of lactation curves among different production levels. The best model fit was at Q50 for milk production traits. It is a natural finding as milk production traits are always assumed as normal traits and it is expected that estimation of the lactation curve based on the ‘mean’ in linear models or ‘median’ in quantile regression produce similar curves. Nonetheless, SCS is a different trait that is not perfectly normal even after log transformation. For SCS best model fit occurred at Q25 and the curves at different quantiles were further apart. This is due to the mixture distribution underlying somatic cell count of healthy cows, subclinical and clinical mastitic cows (Madsen et al. Reference Madsen, Shariati and Ødegård2008). QR has the advantage that it provides more information at different production levels which can lead to making management or selection decisions better.
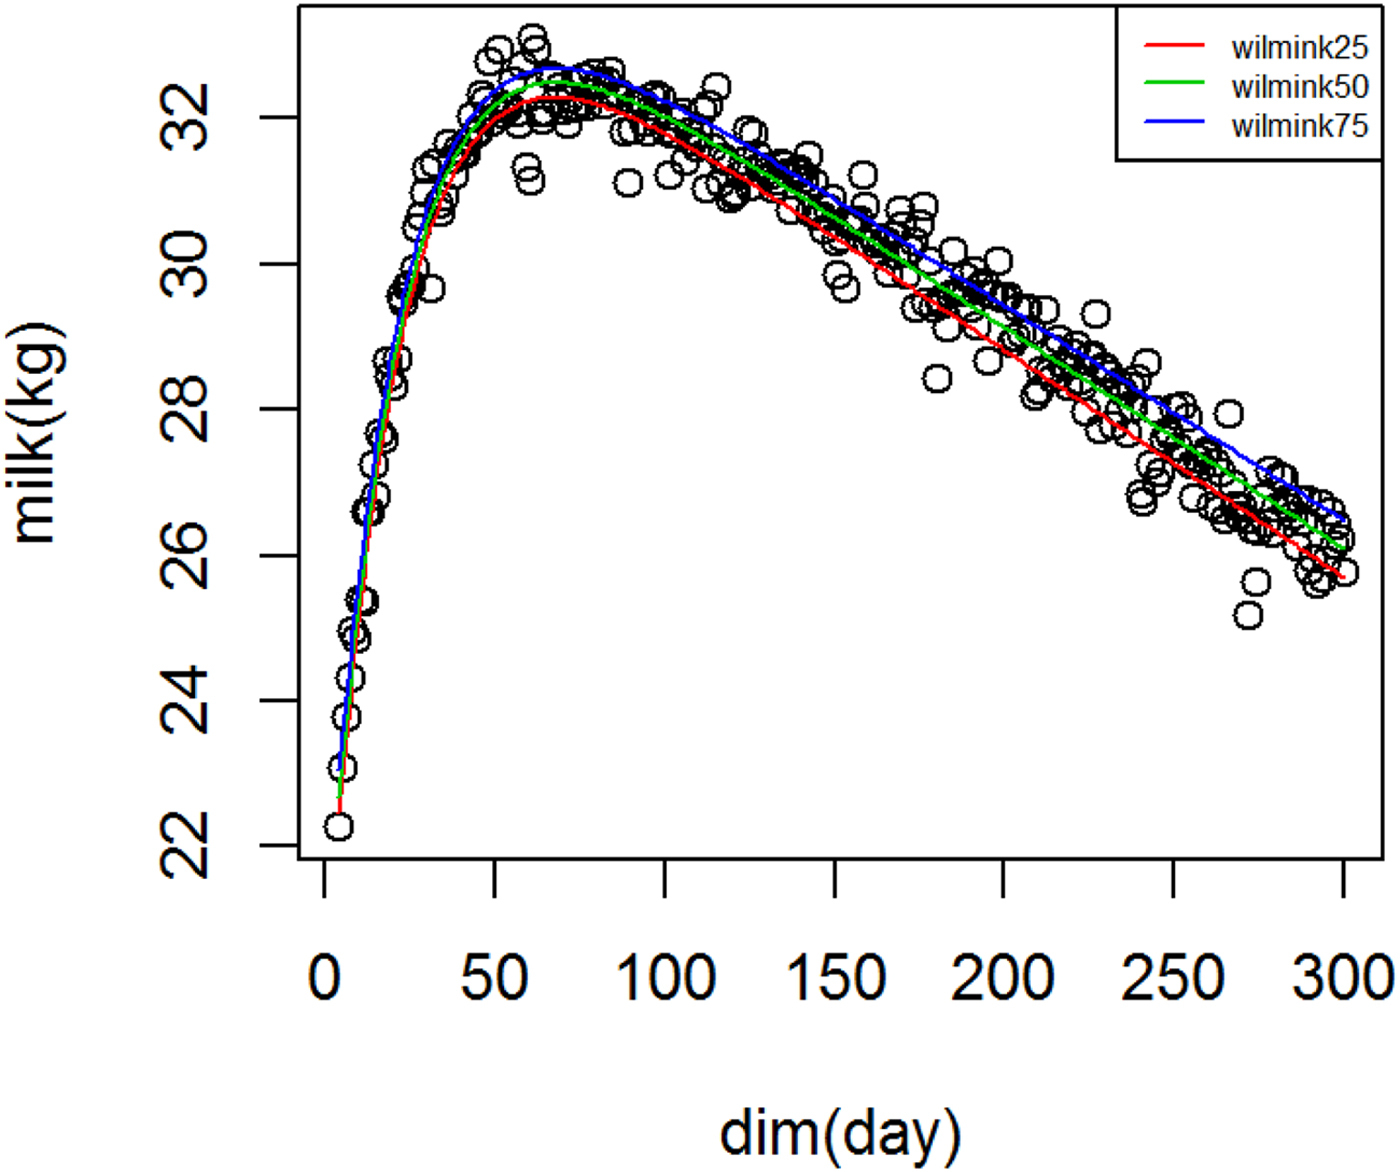
Figure 1 shows WIL lactation curves at three quantiles for milk yield that performed best among all models. For fat and protein percentage best models across quantiles were DJ and AS, respectively (Figs. 2 and 3). For each trait a specific model performed best and the ranking among models was not altered at different quantiles. It can be observed visually and from model fit criteria in Table 1 that milk yield and fat percentage were fitted adequately, such that the peak, lactation curve extremes, and persistency were captured by all models with negligible differences. For protein percentage all models except AS and DJ failed to capture the high protein percentage in first days and its rapid decline afterward. The differences between lowest and highest AIC of four models at Q50 for milk yield, fat and protein percentage were 378, 174 and 2836, respectively, that shows the comparable performance of the models for milk yield and fat percentage but not for protein percentage.

Fig. 1. Wilmink lactation curves for milk yield across quantiles.
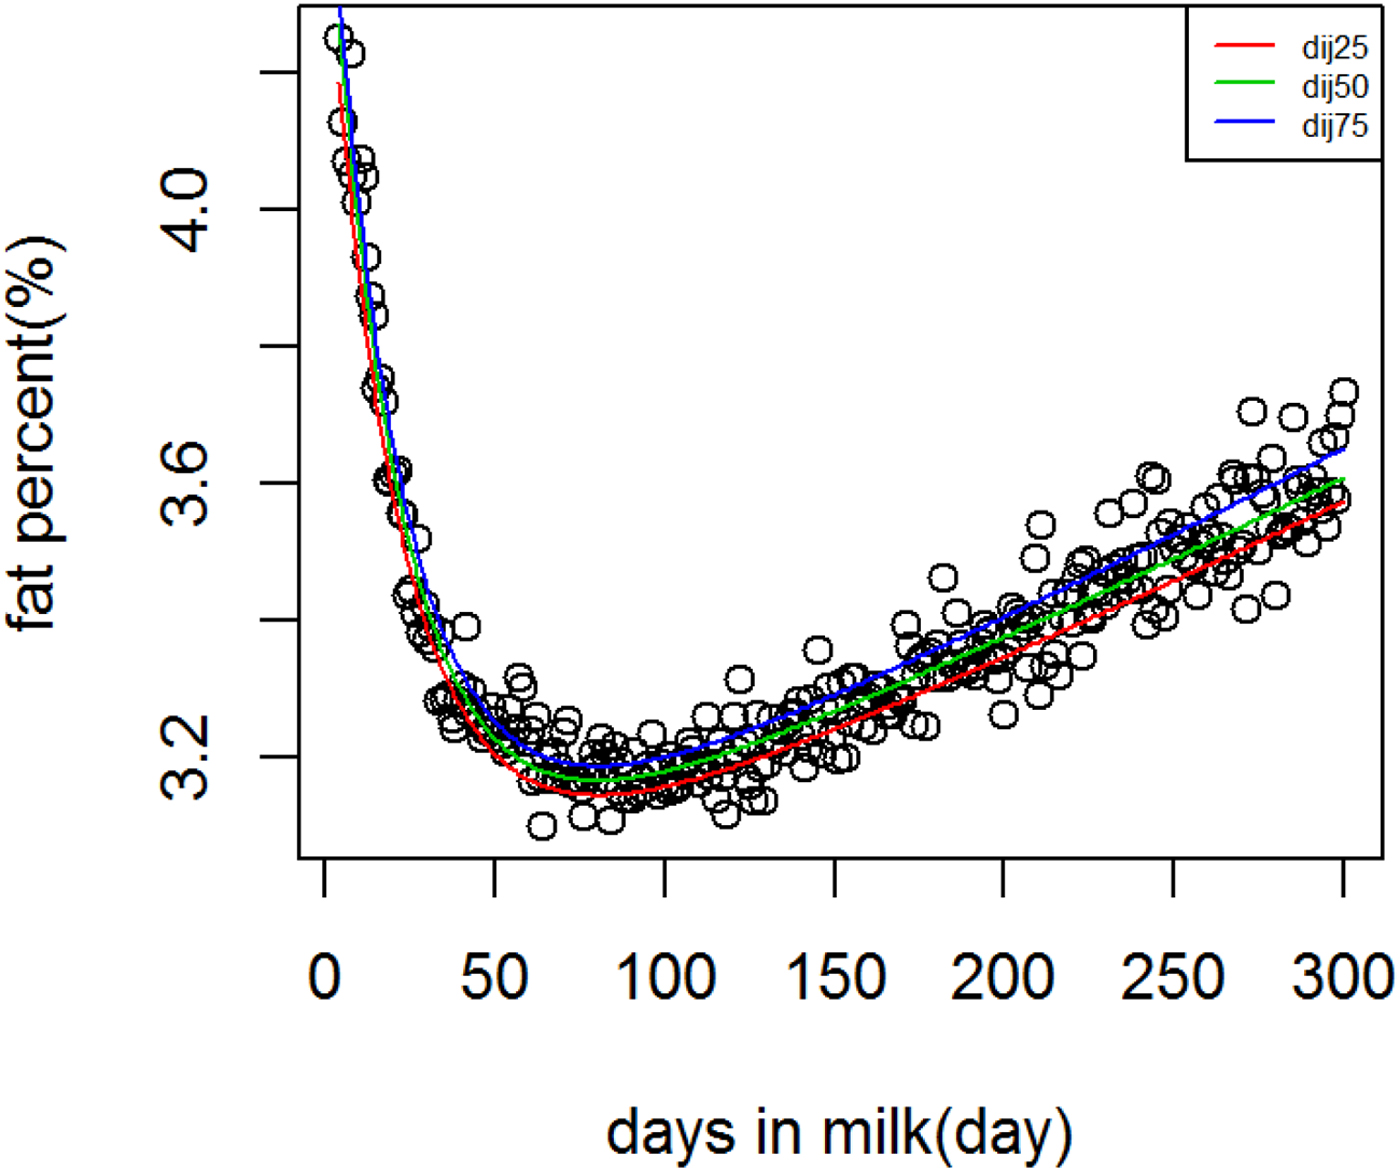
Fig. 2. Dijkstra lactation curves for fat percentage across quantiles.
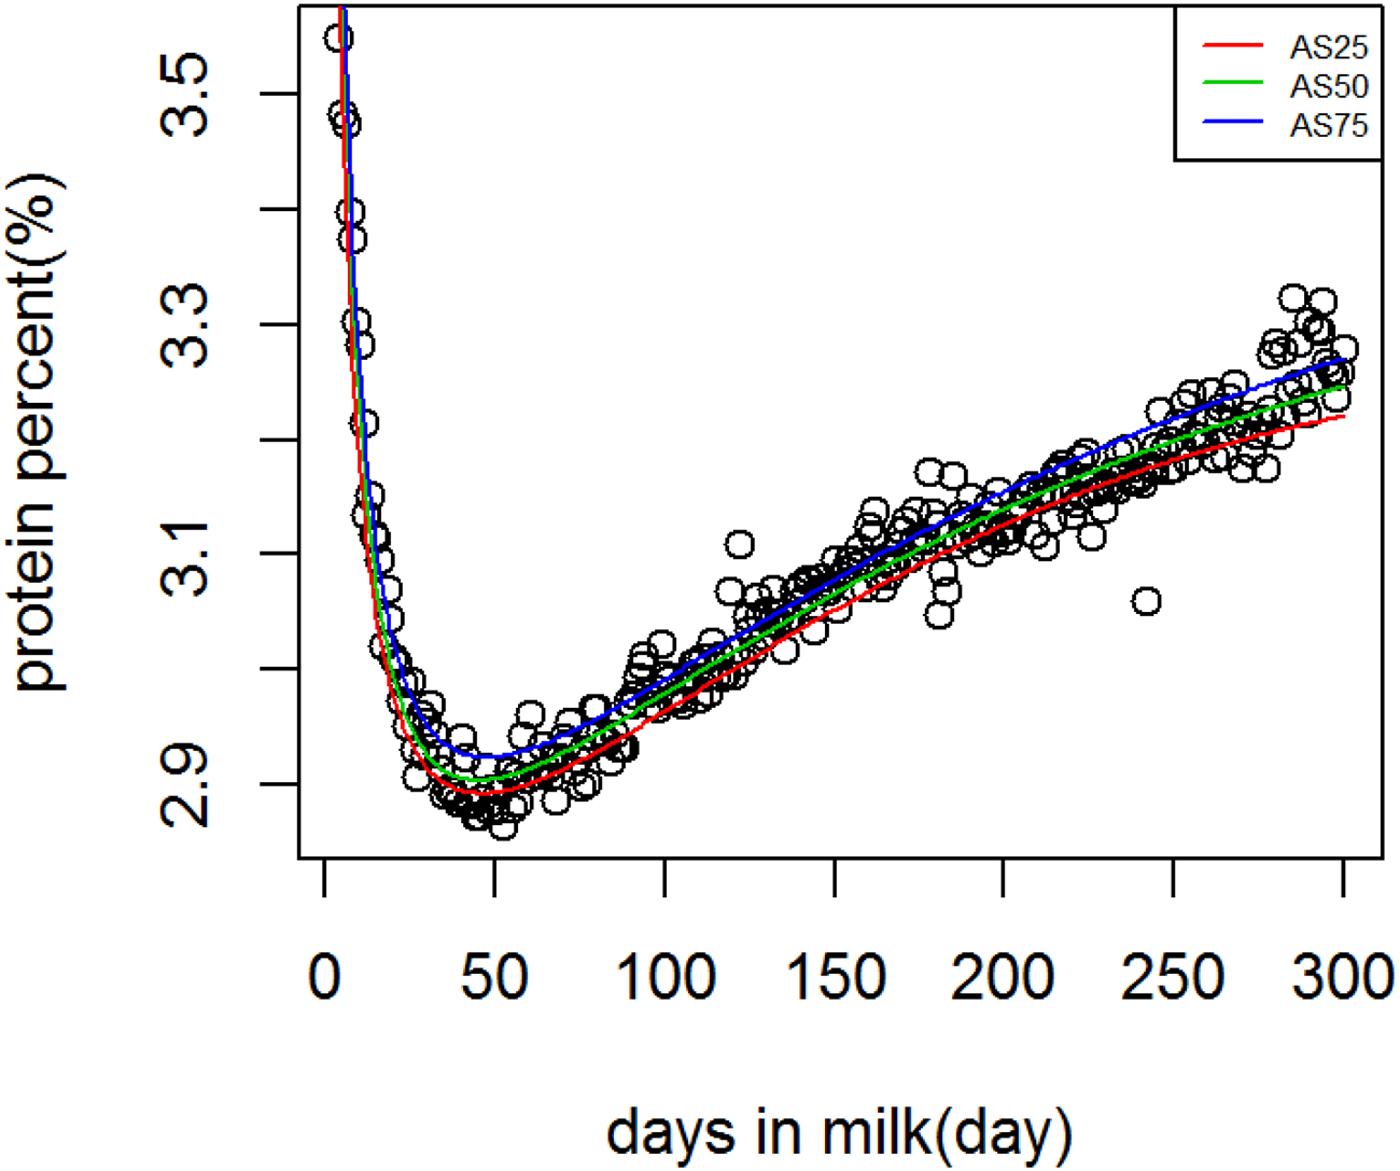
Fig. 3. Ali & Schaeffer lactation curves for protein percentage across quantiles.
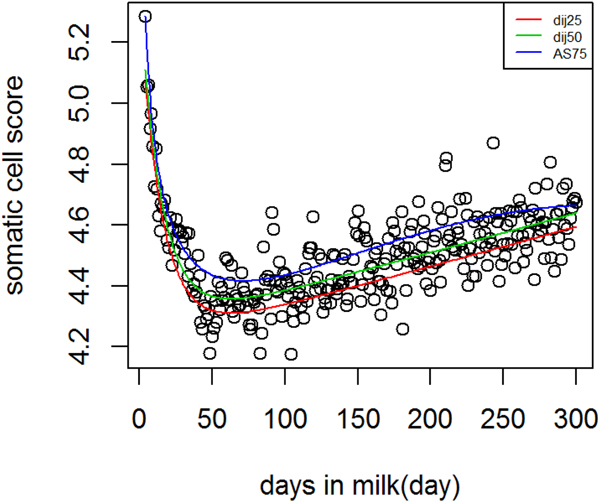
Figure 4 Shows lactation curves based on best models at each quantile for SCS. The variation in SCS was higher compared to milk production. In genetic analysis, SCS is analyzed as a proxy for mastitis because these are correlated traits (Heringstad et al. Reference Heringstad, Klemetsdal and Ruane2000). In this study QR was used to separate the population based on three levels of SCS production, that is not necessarily an indicator of healthy cows vs. mastitic cows. However, it is possible to study different shapes of SCS during lactation among cows that are very low in SCS and susceptible cows to mastitis.
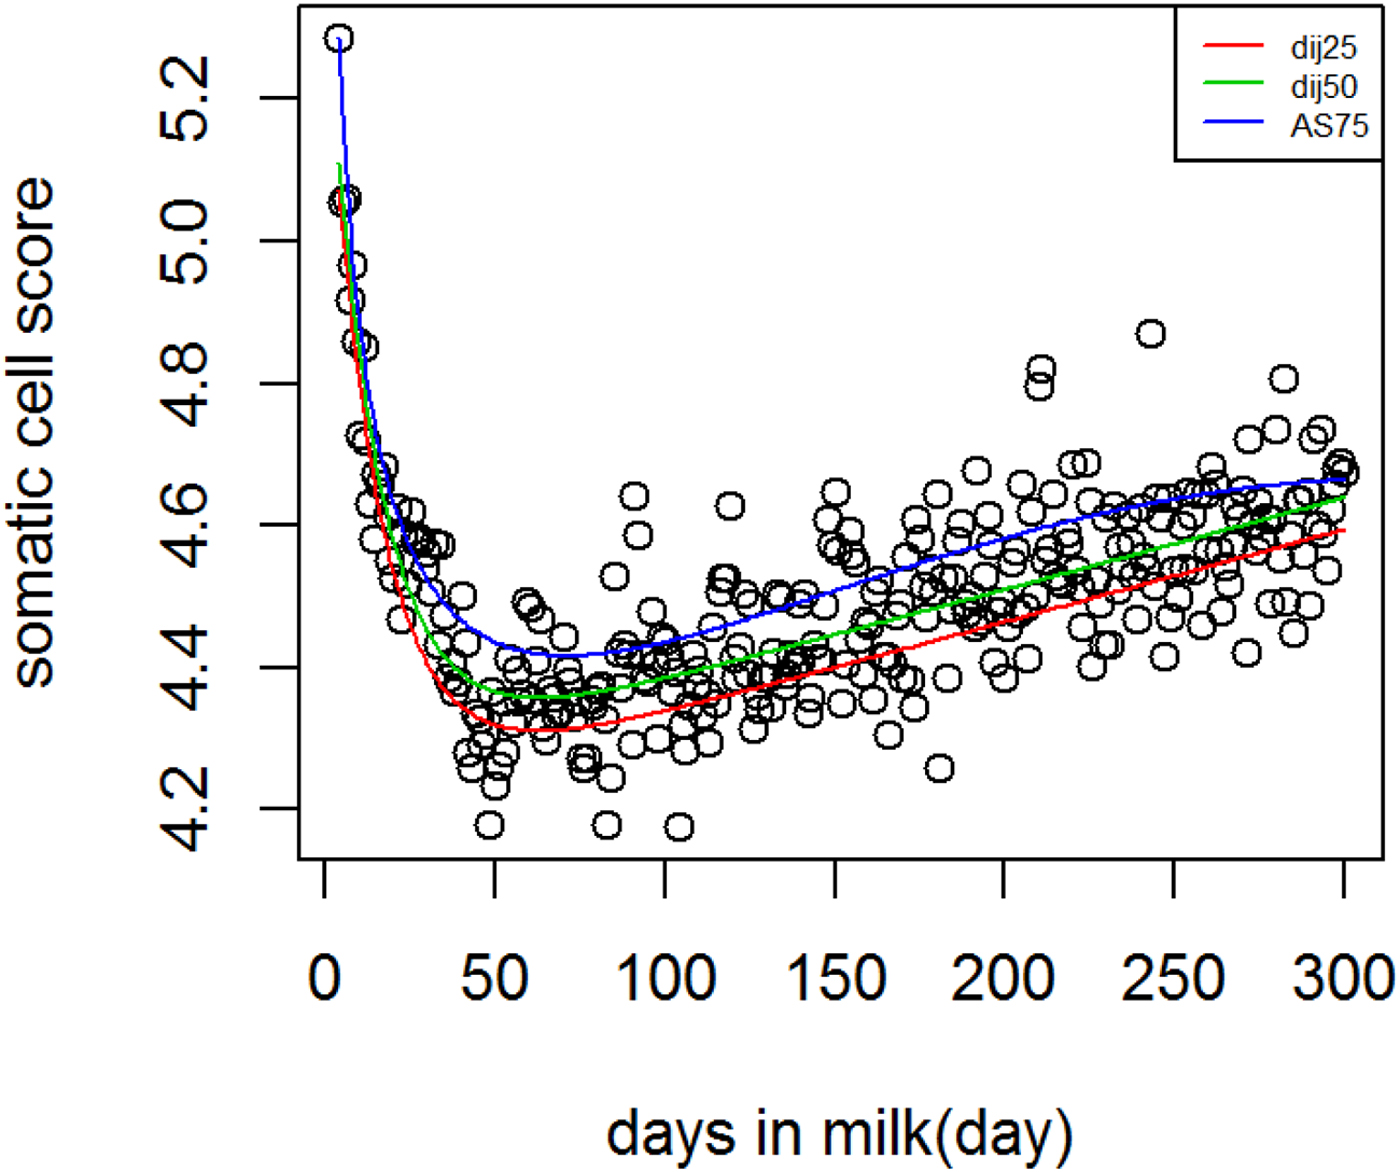
Fig. 4. Dijkstra and Ali & Schaeffer lactation curves for somatic cell score across different quantiles.
This study aimed at introducing QR in fitting lactation curve and growth pattern. Software packages used in animal breeding estimate these curves and predict genetic merit of animals in a linear mixed model analysis (Madsen & Jensen, Reference Madsen and Jensen2008; Gilmour et al. Reference Gilmour, Gogel, Cullis, Welham and Thompson2015). Combining QR and high dimensional random genetic effects in a single mixed model QR analysis is the next development.
Supplementary material
The supplementary material for this article can be found at https://doi.org/10.1017/S0022029919000013.
Acknowledgments
The authors are grateful to the Animal Breeding Center of Iran for providing the data.
Financial support
None.
Competing interest
The authors declare they have no competing interest.