


The period between late pregnancy and early lactation, generally referred to as the ‘transition period’, is characterized by haematochemical disruption with metabolic challenge to the high-yielding dairy cow (Le Blanc, Reference Le Blanc2010; Piccione et al. Reference Piccione, Messina, Marafioti, Casella, Giannetto and Fazio2012; Fiore et al. Reference Fiore, Perillo, Piccione, Gianesella, Bedin, Armato, Giudice and Morgante2016). Nutrient demands by the foetus and then lactation reach their maximum in this period, and rising energy demands result in mobilization of fats, protein and other nutrients from body stores (Nielsen & Ingvartsen, Reference Nielsen and Ingvartsen2004; Drackley et al. Reference Drackley, Dann, Neil Douglas, Janovick Guretzky, Litherland, Underwood and Loor2005; Ingvartsen, Reference Ingvartsen2006; Fiore et al. Reference Fiore, Barberio, Morgante, Rizzo, Giudice, Piccione, Lora and Gianesella2015). Excessive fatty acid mobilization is associated with the development of fatty liver, or deposition of lipid in the hepatic cytoplasm (Karcagi et al. Reference Karcagi, Gaál, Wágner and Husvéth2008). Approximately 40–60% of high-producing dairy cows develop moderate to severe fatty liver during early lactation (Starke et al. Reference Starke, Schmidt, Haudum, Scholbach, Wohlsein, Beyerbach and Rehage2011).
Several methods have been described to detect the mobilized fat or to determine the extent of fatty infiltration in the liver. These include liver biopsy, ultrasound and evaluation of blood parameters (Mahdi Komeilian et al. Reference Mahdi Komeilian, Sakha, Gholi Nadalian and Veshkini2011; Banzato et al. Reference Banzato, Fiore, Morgante, Manuali and Zotti2016). Although liver biopsy is the most reliable method of detecting fatty liver, it is impractical because of the time needed for acquiring and analysing the samples and the discomfort to cows (Starke et al. Reference Starke, Haudum, Weijers, Herzog, Wohlsein, Beyerbach, de Korte, Thijssen and Rehage2010; Mahdi Komeilian et al. Reference Mahdi Komeilian, Sakha, Gholi Nadalian and Veshkini2011). A suitable non-invasive method might be transcutaneous ultrasonographic imaging of the liver (Starke et al. Reference Starke, Haudum, Weijers, Herzog, Wohlsein, Beyerbach, de Korte, Thijssen and Rehage2010). Acorda et al. (Reference Acorda, Yamada and Ghamsari1995) and Mahdi Komeilian et al. (Reference Mahdi Komeilian, Sakha, Gholi Nadalian and Veshkini2011) showed that ultrasonographic features of hepatic lipidosis are more sensitive and specific than biochemical analysis for diagnosis of fatty liver in dairy cows. In humans, ultrasound has been proposed as an alternative non-invasive, cheap and dependable technique to measure the subcutaneous and intra-abdominal fat thicknesses and can also be used to assess the degree of liver fat infiltration (Sabir et al. Reference Sabir, Sermez, Kazil and Zencir2001). Detection of fatty liver is more difficult because it results in smaller changes of hepatic echo-structure (Bobe et al. Reference Bobe, Amin, Hippen, She, Young and Beitz2008). Accumulation of fat in hepatocytes causes parenchymal swelling and, thereby, an increase in hepatic size, rounding of liver margins, an increase in echo coarseness, increased echogenicity of the liver parenchyma near the abdominal wall, weakening of echoes as distance increases from abdominal wall and poor or no visualization of hepatic vessels (Mahdi Komeilian et al. Reference Mahdi Komeilian, Sakha, Gholi Nadalian and Veshkini2011; Starke et al. Reference Starke, Schmidt, Haudum, Scholbach, Wohlsein, Beyerbach and Rehage2011). In rodents and humans with fatty liver, parenchymal swelling leads to an increase in hepatic pressure and compression of hepatic blood vessels. In dairy cows, compression of hepatic blood vessels was detected using ultrasonography during fatty liver disease (Starke et al. Reference Starke, Schmidt, Haudum, Scholbach, Wohlsein, Beyerbach and Rehage2011).
The aim of the present pilot study was to evaluate, in periparturient high-yielding dairy cows, the potential for diagnosing fatty liver by means of ultrasonographic measurement of the depth of the liver (DL), thickness of perivisceral adipose tissue (TPAT), depth of perivisceral adipose tissue (DPAT), portal vein diameter (PVD), depth of the portal vein (DPV), hepatic vein diameter (HVD) and depth of the hepatic vein (DHV) as an alternative to the blood indicators of lipomobilization and/or the invasive method such as liver biopsy.
Materials and methods
Animals
A total of 30 pregnant multiparous Holstein cows from a single high producing dairy farm in Padua, Italy (45°41′N; 11°88′E, 17 m above sea level), were enrolled in this study. The milk production was about 10000 kg per year and the milk yield composition was 3·32% of fat and 3·34% of protein. The farm had a dry period of 60 d and a steaming-up period of 15 d before calving. All cows were fed a balanced diet in accordance with the nutritional requirements for the transition period: the composition is given in online Supplementary File Table S1. Water was available ad libitum. At the moment of the enrolment, all animals were clinically healthy. Their health status was evaluated based on rectal temperature, heart rate, respiratory rate, appetite, faecal consistency and haematologic profile. Twelve cows were clinically healthy during the entire experimental period, while 18 cows showed one or more periparturient pathologies (metritis 44·44%, mastitis 33·33%, dystocia 11·11% and retained placenta 38·89%) after calving. According to their clinical status, the cows were divided into two groups: healthy group (n. 12) and sick group (n. 18).
The experimental protocol was reviewed and approved in accordance with the standards recommended by the Guide for the Care and Use of Laboratory Animals and Directive 2010/63/EU.
Body condition score (BCS) measurement, blood sampling, liver and perivisceral adipose tissue ultrasonographic measurement and liver tissue biopsy were performed at 15 ± 5 d prepartum (T 0), 10 ± 2 d postpartum (T 1), 30 ± 2 d postpartum (T 2) and 50 ± 2 d postpartum (T 3).
Body condition score
Body condition score (0–5 scale) was evaluated in each animal according to Edmondson et al. (Reference Edmondson, Lean, Weaver, Farver and Webster1989).
Haematochemical parameters
Blood samples were collected from each animal by jugular venipuncture into vacuum tubes (Venosafe™, Terumo Europe) with no anticoagulant additive. Serum separation was performed in farm. The samples were allowed to clot for 30 min after blood sampling (Tuck et al. Reference Tuck, Chan, Chia, Godvwin, Grizzle, Kreuger, Rom, Sanda, Sorbara, Stass, Wang and Brenner2009), then the tubes were centrifuged at 3500 rpm for 10 min. The obtained sera were transferred into plastic tubes and transported at 4 °C to the laboratory of the Department of Animal Medicine, Productions and Health (MAPS) of the University of Padua (Italy) and then stored at −18 °C until analysis. On individual sera glucose, non-esterified fatty acids (NEFA) and β-hydroxybutyrate (BHB) were assessed by means of a BT1500 automated photometer analyser (Biotecnica Instruments S.p.A., Roma, Italy) using a commercially available kit according to Fiore et al. (Reference Fiore, Barberio, Morgante, Rizzo, Giudice, Piccione, Lora and Gianesella2015).
Ultrasonographic evaluation
Immediately after blood collection, transcutaneous ultrasonographic examination of the liver was performed on the right side of the animal within the dorsal part of the 10th intercostal space by means of a 2·5–6·6 MHz convex probe (SC3421® – ESAOTE S.p.A., Genoa, Italy) connected to a commercially available ultrasonographic scanner (Mylab™OneVET – ESAOTE S.p.A., Genoa, Italy) (Banzato et al. Reference Banzato, Fiore, Morgante, Manuali and Zotti2016). The hair was carefully clipped, the skin was degreased with alcohol 70%, cleaned with water and covered with ultrasonographic gel. Ultrasonographic settings were maintained constant throughout the scans and were as follows: frequency 2·5 MHz, depth 23 cm, gain 90, time gain compensation was in a neutral position. A general ultrasonographic inspection of the liver was performed to establish the general quality of the images and to rule out the presence of focal abnormalities (e.g., tumours, abscesses). Thereafter the depth of the liver (DL), thickness of perivisceral adipose tissue (TPAT), depth of perivisceral adipose tissue (DPAT), portal vein diameter (PVD), depth of the portal vein (DPV), hepatic vein diameter (HVD) and depth of the hepatic vein (DHV) were measured ultrasonographically. Depth of the liver was defined as the distance between the ventral edge of the internal intercostal muscle and the dorsal edge of the perivisceral adipose tissue, passing through the centre of the portal vein. Thickness of perivisceral adipose tissue was measured ventrally to the portal vein. Depth of perivisceral adipose tissue was defined as the distance existing between the ventral edge of the internal intercostal muscle and the ventral margin of perivisceral adipose tissue, passing through the centre of the portal vein. Depth of the portal vein was defined as the distance between the ventral margin of the internal intercostal muscle and the centre of the vein. Depth of the hepatic vein was defined as the distance that goes from the ventral margin of the internal intercostal muscle to the bifurcation of the hepatic vein (Fig. 1).
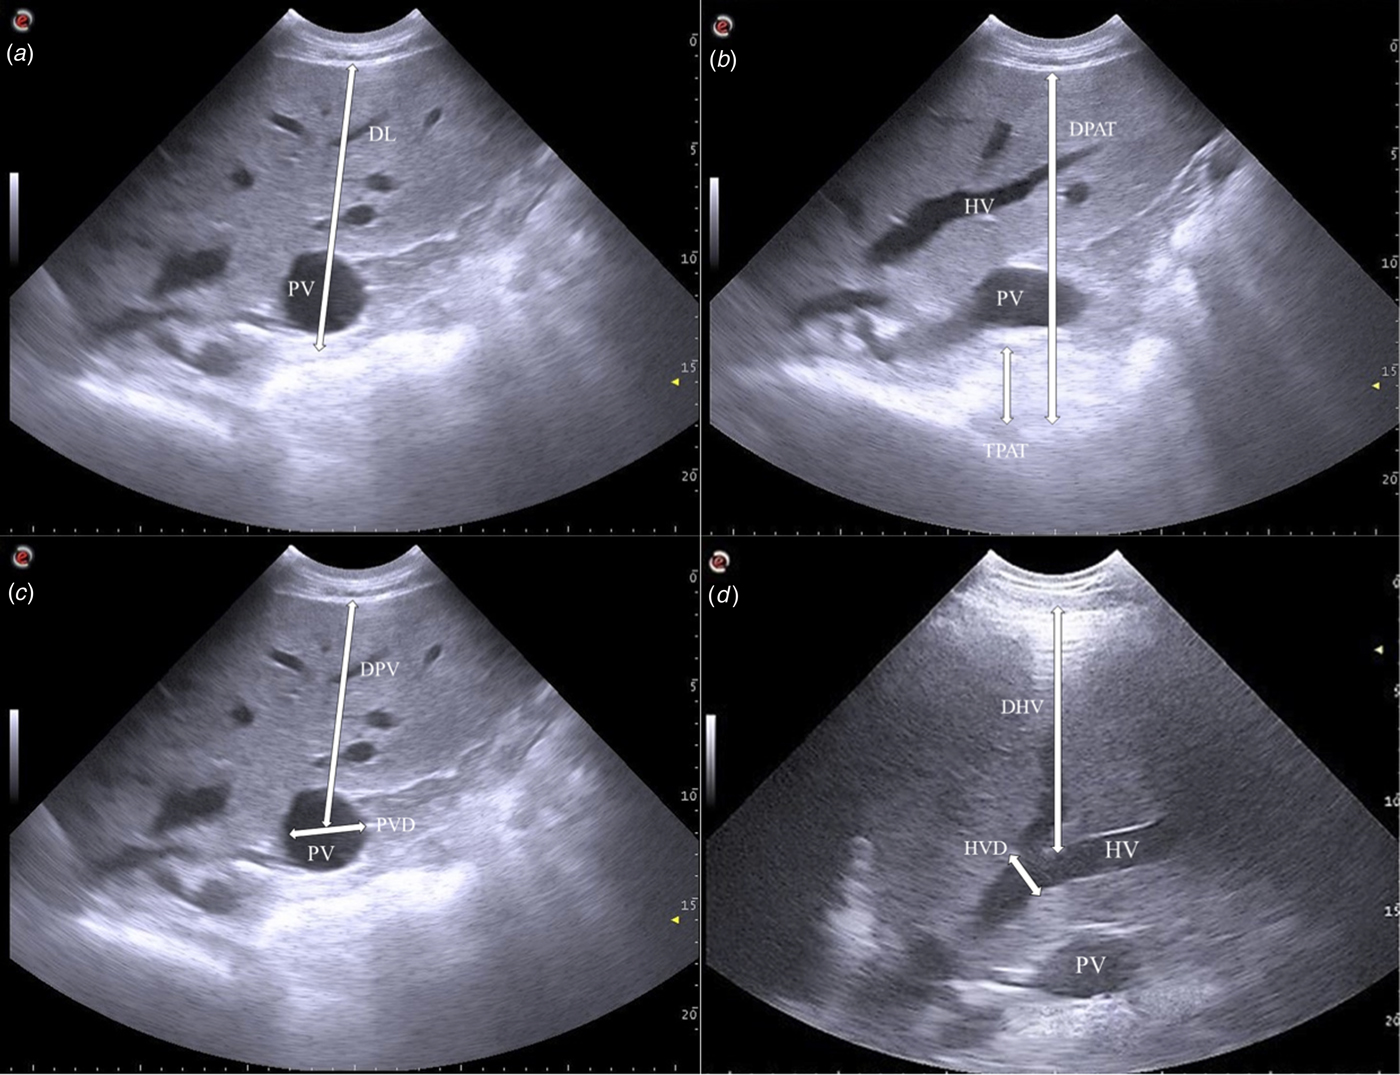
Fig. 1. Representative ultrasonographic measurements on the right side within the dorsal part of the 10th intercostal space: (a) depth of the liver (DL); (b) thickness of perivisceral adipose tissue (TPAT) and depth of perivisceral adipose tissue (DPAT); (c) portal vein diameter (PVD) and depth of the portal vein (DPV); (d) hepatic vein diameter (HVD) and depth of the hepatic vein (DHV) in a dairy cow.
Images were stored in a digital imaging and communications in medicine (DICOM) format without compression and utilized to make measurements regarding the liver tissue, its vascularization and the adipose perivisceral tissue.
Histologic examination
After the evaluation of the liver, ultrasound-guided biopsies of liver tissue were collected from each animal in order to determine the degree of lipid infiltration of the parenchyma, according to procedures recommended by Fiore et al. (Reference Fiore, Piccione, Perillo, Barberio, Manuali, Morgante and Gianesella2017). Surgical scrubs of the skin were performed before incision with a scalpel. Five ml of 2% lidocaine solution was infiltrated under the skin and into the intercostal muscles at the 10th right intercostal space. A 14 G Tru-Cut® biopsy needle (UK Medical, Sheffield, United Kingdom) was used for the collection of the biopsy samples. The angle of the Tru-Cut® biopsy needle ranged from 45 to 135° to avoid the collection of scar tissue from the previous biopsies. The biopsy samples consisted in 5 mg of tissue which were fixed in 10% buffered formalin for histopathologic examination.
Paraffin-embedded sections were routinely processed, stained with Haematoxylin and eosin (HE) and observed to evaluate lipid content under light microscopy. Lipids in HE-stained sections are visible as vacuoles in the cytoplasm because they are solubilized by alcohol during the staining procedure.
Liver fat content was classified histologically according to 6 different degrees (Grades der Leberverfettung or GdL), ranging from 0 (no fat droplets visible, totally normal hepatocytes) to 5 (panlobular fatty infiltration) in accordance with Kalaitzakis et al. (Reference Kalaitzakis, Roubies, Panousis, Pourliotis, Kaldrymidou and Karatzias2007). Examples are given in online Supplementary Fig. S3. Lipid content was evaluated and scored on the average observed in 5 randomly selected lobules and the median calculated.
Statistical analysis
The obtained data were expressed as Mean ± (sd). Data were assessed for the normality of distribution through the Shapiro and Wilk test and came out to be normally distributed (P > 0·005). Data were analysed using a mixed repeated linear model with sampling time point, health status and their interaction as fixed effects and subject (cow) nested within health status as random repeated effect.
 $$Y_{ijk} = {\rm \mu} + \; T_i + H_j + TxH_{ij} + s_{\,jk} + e_{ijk}$$
Y ijk: dependent variable;
μ: general mean
T i: fixed effect of time point (i = 0,…,3)
H j: fixed effect of health status (j = 0 healthy; j = 1 sick)
TxH ij: interaction between time point and health status;
s jk: repeated and random effect of animal nested inside health status
e ijk: error independently and identically distributed as N (0,1)
The model was applied to assess the statistically significant effects of the sampling time point and between the two groups (heathy group vs. sick group) on BCS, Glucose, NEFA, BHB, hepatic and perivisceral fat ultrasonographic measurements, and GdL. Bonferroni's multiple comparison test was used for post hoc comparison test. P values <0·05 were considered statistically significant. Pearson's correlation coefficient (r) was determined to investigate the relationship among studied variables.
The receiver operating characteristic (ROC) analyses were carried out to establish critical reference values on the considered parameters among the diseased animals. The ROC curves analyse sensitivity (Se) vs. 100-specificity (Sp). The point on the ROC curve that has the highest combined Se and Sp was considered the critical threshold. Interpretation of this critical threshold depends on the area under the curve (AUC), such that if the AUC >0·70% the test is considered mildly acceptable (Swets, Reference Swets1988). Data from the pre- and post-partum cohorts were analysed together excluding time effect.
Statistical analyses were performed by means of SAS software (version 9.3; SAS Institute, Inc., Cary, NC, USA, 2009); and ROC analyses was performed using MedCalc Software (Ostend, Belgium).
Results
Descriptive data for all main variables including both haematochemical parameters and ultrasonographic measures are in Table 1 and changes occurring across the transition period are shown in online Supplementary Figs S1 and S2. Values (mean ± sd) are given for both healthy and sick groups and for each time point (T 0, T 1, T 2 and T 3). The repeated mixed model showed a significant effect of sampling time (P < 0·005) on the following parameters: BCS, glucose, NEFA, BHB, TPAT, DPAT, PVD, DPV and GdL. Statistically significant differences (P < 0·05) between the groups (healthy group vs. sick group) on DL were found.
Table 1. Mean ± standard deviations (±sd) of studied parameters obtained in both groups (healthy and sick) during the different experimental periods (T 0 = 15 ± 5 d prepartum, T 1 = 10 ± 2 d postpartum, T 2 = 30 ± 2 d postpartum and T 3 = 50 ± 2 d postpartum)

BCS, body condition score; NEFA, non-esterified fatty acids; BHB, β-hydroxybutyrate; DL, depth of the liver; TPAT, thickness of perivisceral adipose tissue; DPAT, depth of perivisceral adipose tissue; PVD, portal vein diameter; DPV, depth of the portal vein; HVD, hepatic vein diameter; DHV, depth of the hepatic vein; GdL, Grades der Leberverfettung
The application of Bonferroni's post-hoc comparison showed statistically higher BCS values at T 0 compared to T 1–T 3 (P < 0·05) in both groups.
Glucose concentration showed an opposite trend with respect to NEFA and BHB; in particular, it was higher at T 0 compared to T 1 (P < 0·05) in both groups, but was lower at T 1 compared to T 2 and T 3 (P < 0·001) in the healthy group. NEFA and BHB levels were lower at T 0 compared to T 1 (P < 0·05) in both groups and higher at T 0 compared to T 2 (P < 0·001) in the sick group. They were also higher at T 1 compared to T 2 and T 3 (P < 0·001) in both groups.
Regarding ultrasonographic measurement of liver and perivisceral adipose tissue, TPAT values were higher at T 0 compared to T 3 (P < 0·05) in the sick group. Depth of perivisceral adipose tissue and DPV values were higher at T 0 compared to T 2 and T 3 (P < 0·05) in the healthy group. Portal vein diameter values were higher at T 0 compared to T 2 (P < 0·005) and at T 1 compared to T 2 (P < 0·005) in the sick group.
Finally, GdL was lower at T 0 compared to T 1–T 3 (P < 0·005) in both groups, whereas, it was higher at T 1 compared to T 3 (P < 0·05) in the sick group.
The application of Pearson's correlation coefficient showed a number of significant positive correlations (online Supplementary Table S2). Several factors were correlated with NEFA in both groups (healthy group value given first), including BHB (r = 0·91 and 0·94, P < 0·001), TPAT (r = 0·39 and 0·45, P < 0·01 or better) and PVD (r = 0·59, r = 0·77, P < 0·001). Lower but significant correlations with NEFA were evident in the sick group only for DPAT (r = 0·29, P = 0·01) and DPV (r = 0·29, P = 0·01). Similarly, correlations were evident between BHB and ultrasonographic parameters (online Supplementary Table S2). Within the ultrasonographic measures, correlations were evident in both groups between DL and both DPAT (r = 0·94, r = 0·94, P = 0·000) and DPV (r = 0·62, r = 0·46, P = 0·000) and the two measures of the perivascular adipose tissue (thickness, TPAT and depth, DPAT) were also correlated in both groups (r = 0·4810, r = 0·5438, P = 0·001 or better). Similarly, there were positive correlations between the adipose measures and the portal vein diameter (PVD) and depth (DPV) (online Supplementary Table S2).
Table 2 shows the AUC of DL and DPAT to be greater than 70%. The diagnostic accuracy of DL proved to be a sufficient test for discriminating sick animals with an AUC of 0·71 (95% CI 0·56–0·78; positive likelihood ratio 2·18) and an optimal cut-off value greater than 152·6 mm (epidemiologic sensitivity of 70·06% and specificity of 70·75%). Similar results were found for DPAT that showed AUC of 0·70 (95% CI 0·56–0·78·6; positive likelihood ratio 2·04) and an optimal cut-off value greater than 175·2 mm (sensitivity of 70·06% and specificity of 68·67%). Also of note is TPAT; AUC 0·55 with an optimal cut-off value of 21·5 mm (sensitivity of 60·00% and specificity of 68·75%).
Table 2. Results relative to the receiver operator curve (ROC) for studied parameters to classify sick animals

AUC, Area Under the Curve; Se, Epidemiologic Sensitivity; Sp, Epidemiologic Specificity; LR+, Likelihood ratio Positive; BCS, body condition score; NEFA, non-esterified fatty acids; BHB, β-hydroxybutyrate; DL, depth of the liver; TPAT, thickness of perivisceral adipose tissue; DPAT, depth of perivisceral adipose tissue; PVD, portal vein diameter; DPV, depth of the portal vein; HVD, hepatic vein diameter; DHV, depth of the hepatic vein; GdL, Grades der Leberverfettung. Significance: * positive rate range with Se and Sp >65%
Discussion
The differences obtained during the experimental period probably reflect the significant metabolic changes over the transition period that could increase the liver activity with consequential negative energy balance (Tharwat et al. Reference Tharwat, Oikawa and Buczinski2012). In agreement with the findings of Haudum et al. (Reference Haudum, Starke, Beyerbach, Wohlsein and Rehage2011), a slight hepatomegaly was found in the sick group compared to the healthy group, probably due to a higher incidence of hepatic lipidosis. In agreement with Fiore et al. (Reference Fiore, Piccione, Perillo, Barberio, Manuali, Morgante and Gianesella2017) this study showed a significant decrease of BCS values from T 0 to T 3 in both groups. It is generally recognized that BCS provides a gross but reasonably accurate measure of a cow's energy reserves (Roche et al. Reference Roche, Friggens, Kay, Fisher, Stafford and Berry2009).
In agreement with other authors (Bobe et al. Reference Bobe, Young and Beitz2004; Fiore et al. Reference Fiore, Perillo, Piccione, Gianesella, Bedin, Armato, Giudice and Morgante2016), serum glucose concentration showed a significant decrease at T 1 and a significant increase from T 2, because glucose requirements for lactose production in dairy cows are higher in the early post-partum period (Busato et al. Reference Busato, Faissler, Küpfer and Blum2002). The increase of NEFA and BHB levels found at T 1 highlights the difficulty dairy cows have in coping with energy demand (Cozzi et al. Reference Cozzi, Ravarotto, Gottardo, Stefani, Contiero, Moro, Brscic and Dalvit2011; Fiore et al. Reference Fiore, Barberio, Morgante, Rizzo, Giudice, Piccione, Lora and Gianesella2015, Reference Fiore, Piccione, Perillo, Barberio, Manuali, Morgante and Gianesella2017). In accordance with some authors (Graber et al. Reference Graber, Kohler, Kaufmann, Doherr, Bruckmaier and van Dorland2010; Gross et al. Reference Gross, van Dorland, Bruckmaier and Schwarz2011), NEFA and BHB levels significantly decreased at T 2 especially in the sick group, showing the incapacity of sick animals to compensate for the concomitant negative energy balance. In agreement with Schulz et al. (Reference Schulz, Frahm, Meyer, Kersten, Reiche, Rehage and Dänicke2014) and Fiore et al. (Reference Fiore, Piccione, Perillo, Barberio, Manuali, Morgante and Gianesella2017), our findings showed a significant decrease at T 2 and a progressive return to reference ranges of NEFA and BHB serum levels until the end of the experimental period (T 3) with respect to T 1.
The venous circulation of visceral adipose depots drains to the liver, and Mukesh et al. (Reference Mukesh, Bionaz, Graugnard, Drackley and Loor2010) proposed that accumulation of lipids in these depots may contribute to metabolic disorders. Dâmaso et al. (Reference Dâmaso, do Prado, de Piano, Tock, Caranti, Lofrano, Carnier, Cristofalo, Lederman, Tufik and de Mello2008) demonstrated that the expansion of visceral fat was a determining factor for the increasing prevalence of non-alcoholic fatty liver disease and degree of steatosis in humans. These findings are in accordance with our results, where we observed higher values of TPAT at T 0 compared to T 3 in the sick group. The evaluation of portal hypertension is important to assess the severity of liver diseases and one of its most important signs is the widening of the portal vein (Lessa et al. Reference Lessa, Paredes, Dias, Carvalho, Quintanilha, Takiya, Tura, Rezende, Campos de Carvalho, Resende and Goldenberg2010). In previous studies it has been observed that severe fatty liver in humans and rats was characterized by the compression of hepatic vessels and by hepatic swelling with ultrasonographic evidence of size and shape changes (Seifalian et al. Reference Seifalian, Chidambaram, Rolles and Davidson1998, Reference Seifalian, Piasecki, Agarwal and Davidson1999; McCuskey et al. Reference McCuskey, Ito, Robertson, McCuskey, Perry and Farrell2004). Other authors demonstrated in buffaloes that PVD ranged from 3·25 to 3·7 cm (Khalphallah et al. Reference Khalphallah, Abdelhakiem and Elmeligy2016). Our results demonstrated greater diameter of the portal vein at T 0 and T 1. Moreover, we observed a similar trend in the values of PVD in both groups, however, only in the sick group were PVD values statistically higher at T 0 and T 1 compared to T 2. Previous studies found a distinct increase in liver size and thickness over the portal vein only in cows with very severe fatty liver (Haudum et al. Reference Haudum, Starke, Beyerbach, Wohlsein and Rehage2011), while we found that DPAT and DPV values were higher at T 0 compared to T 2 and T 3 in healthy group without fatty liver.
In the first month after calving, 5 to 10% of dairy cows suffer from severe fatty liver and 30 to 40% suffer from moderate fatty liver, which indicates that up to 50% of dairy cows are at a higher risk for diseases and reproductive problems (Bobe et al. Reference Bobe, Young and Beitz2004, Reference Bobe, Amin, Hippen, She, Young and Beitz2008). According to previous studies (Kalaitzakis et al. Reference Kalaitzakis, Roubies, Panousis, Pourliotis, Kaldrymidou and Karatzias2007; Fiore et al. Reference Fiore, Piccione, Perillo, Barberio, Manuali, Morgante and Gianesella2017) GdL has been observed to be mild at T 0, increasing from moderate to severe at T 1 and slightly decreasing from T 2. According to Fiore et al. (Reference Fiore, Piccione, Perillo, Barberio, Manuali, Morgante and Gianesella2017), our results showed a contemporary peak of GdL and sera BHB and NEFA concentrations at T 1, then simultaneously decreasing till the end of the experiment. Moreover, the presence of clinical signs was not always related with the increase of GdL and this condition is demonstrated by its presence in healthy cows (Fiore et al. Reference Fiore, Piccione, Perillo, Barberio, Manuali, Morgante and Gianesella2017).
In agreement with Schulz et al. (Reference Schulz, Frahm, Meyer, Kersten, Reiche, Rehage and Dänicke2014) and Fiore et al. (Reference Fiore, Piccione, Perillo, Barberio, Manuali, Morgante and Gianesella2017), a significant positive correlation was found between BHB and NEFA in both groups. The significant increase in fat content of the liver in dairy cow was associated with an increase in the size of the organ (Haudum et al. Reference Haudum, Starke, Beyerbach, Wohlsein and Rehage2011). This can support the positive correlation between DL and DPAT, between DL and DPV and between DPAT and DPV found in both groups. In humans, it has been shown that mesenteric fat thickness is an independent determinant of metabolic syndrome in apparently healthy subjects and it was demonstrated that adipose tissue (particularly visceral adipose tissue) is a source of various nutrients and metabolically active agents, including free fatty acids (Alempijević et al. Reference Alempijević, Ješić, Svorcan, Milutinović, Kovacević, Radaljac, Popović, Popović and Krstić2011). In previous studies it was demonstrated that mesenteric adipose tissue has a greater capacity for synthesis of triacylglycerol and that the acute-phase protein can participate in lipid metabolism and/or transport (Mukesh et al. Reference Mukesh, Bionaz, Graugnard, Drackley and Loor2010). Both features of mesenteric adipose tissue can potentially have a negative impact on liver during the transition from pregnancy into lactation (Mukesh et al. Reference Mukesh, Bionaz, Graugnard, Drackley and Loor2010). It was demonstrated in human, that visceral fat accumulation showed a strong positive correlation with liver steatosis (Sabir et al. Reference Sabir, Sermez, Kazil and Zencir2001). The correlations that we demonstrated between adipose characteristics, hepatic measures and metabolic parameters are broadly in agreement with this. In particular, the positive correlation between NEFA and PVD and between BHB and PVD found in both groups and between NEFA and DPV and between BHB and DPV found in sick group could suggest that PVD and DPV can be used as a preliminary diagnostic value for detection of hepatic lipidosis.
The results of ROC analysis added weight to the argument that ultrasonographic measures could be useful to classify sick animals. Liver volume (DL) and the perivisceral fat depth and thickness (DPAT and TPAT) were increased in sick animals. For identifying fatty liver we were able to establish cut-off values for DL of 152·6 mm, DPAT of 175·2 mm and TPAT of 21·5 mm. AUC ranged from 55 to 71%, sensitivity from 60 to 71% and specificity from 69 to 71%. Whilst liver biopsy remains the gold standard for diagnosing and staging fatty liver, there are important factors affecting it that include the quality of the biopsy, the small tissue sample representing the lesion of the whole organ and the interpretation of histological findings.
In conclusion, we can propose ultrasonography as a non-invasive and reliable diagnostic method for predicting the risk of fatty liver in high yielding dairy cows during the transition period. Ultrasonographic measurement of the liver, the mesenteric fat thickness and the portal and hepatic vein diameter can be done quickly and at low cost in both sick and healthy animals. In particular, the mesenteric (perivascular) fat thickness measured on ultrasound was shown to be an independent determinant of fatty liver and could have a role in the diagnosis of metabolic disorders. Further studies with increased numbers are needed to confirm the results obtained and standardize the methodology before it can be introduced into practice.
Supplementary material
The supplementary material for this article can be found at https://doi.org/10.1017/S0022029918000754.


