


Mastitis represents a widespread disease of the mammary gland parenchyma of cows (Seegers et al., Reference Seegers, Fourichon and Beaudeau2003; Geng et al., Reference Geng, Wang, Yu, Wang and Liu2020b). It has a high incidence rate and prevalence in dairy cattle and causes substantial monetary losses in dairy farming globally. Mastitis is primarily driven by mechanical damage, environmental influences and especially by pathogenic microbes such as Streptococcus agalactiae (S. agalactiae) (Tong et al., Reference Tong, Sun, Zhang, Yang and Jiang2020). Bovine mammary epithelial cells (bMECs) have been proven to cope with bacterial invasion and are a significant part of the defense against mastitis and S. agalactiae (Niu et al., Reference Niu, Zhang, Wu, Xiong, Tong and Jiang2020). S. agalactiae (also called group B streptococcus) is a Gram-positive coccus (De Gaetano et al., Reference De Gaetano, Pietrocola, Romeo, Galbo and Beninati2018) which can adhere to the surface of cells and produce virulence factors that impact on the normal functioning of bMECs, in severe cases causing cell death (Pang et al., Reference Pang, Sun, He, Bao, Zhang, Zhou, Zhang, Wei, Liu and Wang2017).
In recent years, autophagy has been considered as an essential function for organic cells to remove intracellular foreign matter (Geng et al., Reference Geng, Liu, Lu, Xu and Han2020a). When the cells are stimulated, autophagy-related 13 (Atg13) would be hypophosphorylated. Subsequently, Atg proteins extract lipids from various sources, such as Golgi bodies and endoplasmic reticulum. Then, double-layered, crescent-shaped membranes are formed around the invading pathogens, the whole structure being known as a phagophore. The nascent phagophore is matured through the interaction of phosphatidylinositol 3-phosphate (P13P), Beclin-1 and other proteins, forming an autophagosome. Mature autophagosomes are anchored to lysosomes and undergo membrane fusion to produce autollysosomal hybrid structures. Invading pathogens are degraded in acidic lysosomal compartments (Mukhopadhyay et al., Reference Mukhopadhyay, Panda, Sinha, Das and Bhutia2014) together with obsolete proteins and organelles (Maejima et al., Reference Maejima, Kyoi, Zhai, Tong and Sadoshima2013; Mukhopadhyay et al., Reference Mukhopadhyay, Panda, Sinha, Das and Bhutia2014). It has been shown that S. agalacae can adhere to the surface of bMECs (Tong et al., Reference Tong, Sun, Zhang, Yang and Jiang2020). The research of De Gaetano et al. (Reference De Gaetano, Pietrocola, Romeo, Galbo and Beninati2018) suggested that S. agalactiae exploited vitronectin on the cell surface to trigger an internalization response and enter cells. It has been reported that S. agalactiae can generate enrichment of the proteins related to autophagy in tilapia leukocytes to affect autophagy (Zhao et al., Reference Zhao, Sun, Chen, Qin and Li2019). When autophagy occurs, the complex of Beclin1 and B-cell lymphoma 2 (Bcl2) will be dissociated, resulting in increased levels of Beclin1 and Bcl2 (Mukhopadhyay et al., Reference Mukhopadhyay, Panda, Sinha, Das and Bhutia2014).
Despite this background knowledge, autophagy of bMECs induced by S. agalactiae has not been covered. This study aimed to systematically describe the distinguishing features of autophagy induced by S. agalactiae in bMECs and the correlation between intracellular survival of S. agalactiae and autophagy by testing changes in autophagy flux, assessing lysosome functions, and exploring the influence of S. agalactiae on the related pathways.
Materials and methods
Bacterial strains and culture conditions
S. agalactiae (ATCC27956) was employed in this experiment. First of all, the bacterial strain was inoculated in brain heart infusion broth (BHI) agar at 37 °C. After 48 h, a single bacterial colony of S. agalactiae was stochastically chosen and cultured in BHI and 24 h later, cells were harvested. The concentration of S. agalactiae was calculated by colony-counting methods.
Cell culture conditions
The bovine mammary epithelial cells (bMECs) were maintained in Dulbecco's modified Eagle's medium (DMEM) supplemented with 10% fetal bovine serum (FBS) in a 5% CO2 incubator at 37 °C. Cells that cultured to 80% fusions were used in the following experiments.
Intracellular infection model
bMECs were inoculated in tissue culture plates, and when the cells covered 80% of the culture plate, S. agalactiae was added at a multiplicity of infection of 50 : 1 (Niu et al., Reference Niu, Zhang, Wu, Xiong, Tong and Jiang2020). After 2 h of incubation, the cells were supplied with a culture medium which contained 100 μg/ml lysozyme and 250 μg/ml ampicillin sodium. Thirty minutes later, the cells were rinsed at least three times using phosphate-buffered saline (PBS) to remove extracellular adherent bacteria. The extracellular medium was collected and cultured on a bacterial plate medium to ensure that extracellular bacteria were killed. The bMECs were again rinsed with PBS to dislodge extracellular adhered bacteria and cultured in 2% FBS-DMEM.
Cell viability assay
Cell viability was determined by the cell counting kit (CCK-8) method according to the manufacturer's instructions. BMECs were seeded into 96-well plates (1 × 10⁵ cells/well) with 100 μL per well of FBS-DMEM. Twelve hours later, cells were infected by S. agalactiae (multiplicity of infection = 50 : 1) for 1, 2, 4, and 6 h. After incubation, the extracellular culture media were removed and cells were gently rinsed three times with PBS. Then, 10 μl of CCK-8 operating fluid was mixed into each well, and plates were incubated for 2 h at 37 °C. Cells deprived of lysozyme and ampicillin sodium were used as a control for antibiotic addition. Non-treated cells incubated simultaneously were used as control groups. The absorbance was read at 450 nm by the Thermo Scientific Microplate Reader (Sunrise, Salzburg, Austria).
Immunoblot assay
The protein levels of sequestome 1 (p62), Beclin1, Bcl2, the serine/threonine-protein kinase p-Akt/Akt, and mammalian target of rapamycin (p-mTOR/mTOR) were analyzed quantitatively by immunoblot. The bMECs were collected gently and split on ice in radio immunoprecipitation assay lysis buffer for 20 min. Lysates were then centrifuged at 12 000 × g for 15 min. The supernatant was collected and the protein consistency was measured by the BCA protein assay kit on the basis of the instructions. Through sodium dodecyl sulfate polyacrylamide gel electrophoresis (SDS-PAGE), the proteins of various molecular weights were uncoupled. After being transferred to 0.45 μm polyvinylidene fluoride (PVDF) membranes using an electric transfer, the proteins were sealed with 5% skimmed milk for 1.5 h at RT. Next, the imprints was cultured with the primary antibody overnight at 4 °C, and fostered with secondary antibody at room temperature for 2 h. The images were detected by hypersensitive enhanced chemiluminescence (ECL) reagents. Immunoblots were scanned, and gray image value was analyzed using the ImageJ software.
Fluorescence microscopy
BMECs were cultivated on sterile glass sheets placed in 24-well plates. Then S. agalactiae was added and incubated for 2 h. Harvested cells were fixed with 4% tissue fixative for 15 min, then 0.2% Triton X-100 was added for 20 min to permeate the cells. After washing with PBS, the cells were sealed at room temperature in 5% bovine serum albumin (BSA) blocking buffer for 30 min. For immunostaining, cells were incubated overnight at 4 °C with the primary antibodies, and then incubated with secondary antibody for 1 h at room temperature. DAPI We used 4′,6-diamidino-2-phenylindole (DAPI) to dye cellular and bacterial DNA. Finally, images were presented on the Leica TCS SPE confocal microscope with a 100 × oil immersion objectives.
Lysotracker deep red staining
BMECs grown on sterile glass sheets were interacted with 100 nM LysoTracker Deep Red at room temperature for 30 min after being exposed to the environment of S. agalactiae. Fluorescence images were examined under the spectral confocal microscope.
Intracellular survival assay
To study the influence of autophagy on the survival of S. agalactiae in bMECs, cells were treated with autophagy regulators such as 200 μm 3-methyladenine (3MA) and 100 nm rapamycin (Rapa) (Geng et al., Reference Geng, Liu, Lu, Xu and Han2020a) while adding bacteria in the subsequent experiments. After 4, 8, 12 h, cells were rinsed with PBS and incubated with 0.1% Triton X-100 for 10 min. Intracellular S. agalactiae was released and collected. The number of S. agalactiae surviving in cells was calculated using colony-counting methods.
Statistical analysis
The values were analyzed using the GraphPad Prism 7 software. All data are displayed as the mean ± sem. The significance of a difference between different groups was confirmed by one-way ANOVA with SPSS software analysis. Differences in the data were considered statistically significant at P < 0.05.
Results
Cell infection model successfully constructed
Methods used in our previous study (Niu et al., Reference Niu, Zhang, Wu, Xiong, Tong and Jiang2020) were marginally modified to build an intracellular infection model, as shown in Fig. 1. Cells and S. agalactiae were incubated at 37 °C for 120 min. Lysozyme and ampicillin sodium were then added at 37 °C for 30 min to kill all bacteria outside the cell. After rinsing with PBS, the culture medium was changed. As shown in Fig. 1b, the viability of bMECs after incubating with intracellular S. agalactiae was examined by CCK-8 assay. CCK-8 assay indicated that cell activity was significantly decreased by S. agalactiae (P < 0.05) after 1 h compared with blank control without bacteria and further decreased (P < 0.01) after 6 h. In addition, S. agalactiae was located intracellularly to an increasing extent in the bMECs of the 1, 2, and 4 h groups but not in the control group (Fig. 1c).

Fig. 1. Cell infection model was successfully constructed: (a) Schematic of the establishment of the intracellular infection model. (b) Effect of S. agalactiae invasion time on cell activity which was measured by the CCK-8 assay. All values are expressed as the means ± sd, (n = 3; *, P < 0.05; **, P < 0.01). C. Typical immunofluorescence images showing colocalization of ɑ-tubulin with DAPI. High magnification images of the outlined area are shown on the right. Scale bars: 10 μm.
S. agalactiae activates autophagy in bMECs
The receptor for microtubule-associated protein 1A/1B-light chain 3 (LC3-II) is located at the phagophore membrane. It plays an important role in the autophagy process and is a standard marker for autophagosomes. LC3-II is generated by the conjugation of cytosolic LC3-I to phosphatidylethanolamine on the surface of nascent autophagosomes (Runwal et al., Reference Runwal, Stamatakou, Siddiqi, Puri and Rubinsztein2019). LC3-II is associated with the relative specificity of autophagosomes and autophagic lysosomes, as it is able to promote the selective uptake and degradation of stimulating compounds such as protein aggregates (Mukhopadhyay et al., Reference Mukhopadhyay, Panda, Sinha, Das and Bhutia2014). As shown in Fig. 2a, green fluorescent spots of LC3-II accumulated around the intracellular bacteria in the groups with S. agalactiae added. Moreover, the number of green fluorescent aggregation points increased with treatment duration, whilst the control group showed only a diffuse distribution throughout. Meanwhile, as Fig. 2b showed, the level of p62 reduced at 1, 2 and then significantly (P < 0.05) at 4 h. Beclin1, a protein that can combine with Bcl2, plays a crucial part in autophagy (Kang et al., Reference Kang, Zeh, Lotze and Tang2011). As presented in Fig. 2c and d, levels of Beclin1 and Bcl2 were increasing continuously in bMECs infected by S. agalactiae, and this change lasted 4 h. The ratio of Beclin1/ APDH significantly increased at 2 (P < 0.05) and 4 h (P < 0.01). The ratio of Bcl2/ɑ-tubulin was significantly increased (P < 0.05) at 4 h. These results indicated that S. agalactiae induces autophagy in bMECs.

Fig. 2. Changes of autophagy flux induced by S. agalactiae in bMECs: (a) Observation of LC3 puncta quantitation under confocal microscopy by calculating 20 cells per state. Scale bars: 10 μm. (b) Expression levels of p62 protein within 4 h. (c) Expression levels of Beclin1 protein within 4 h. (d) Expression levels of Bcl2 protein within 4 h. The WB results of p62, Beclin1, and Bcl2 were processed by ImageJ. The upper image is a typical western blot result, the lower image is the histogram of quantitative analysis. All values are expressed as the means ± sd, (n = 3; *, P < 0.05; **, P < 0.01).
Changes of autophagosome and lysosome
Fluorescent protein confocal microscope and susceptible lysosome probes were used to check the autophagosome and lysosome variation in bMECs (Fig. 3). Importantly, after bMECs were infected by S. agalactiae, intracellular LC3-II and lysosome-associated membrane protein (LAMP) reflected green and red fluorescent spots. The intracellular red and green fluorescent speckles increased visibly within four hour after infection, and the number of overlapping parts (displayed in yellow) increased (Fig. 3a). LysoTracker Deep Red was used to evaluate the diversification of lysosome pH in bMECs. LysoTracker Deep Red displayed as a specific red fluorescence in lysosomes, and the degree of fluorescence enhancement showed a decrease in lysosome pH. As shown in Fig. 3b, the intracellular red fluorescence was enhanced within 1–4 h of infection, which means that infection with S. agalactiae increased the acid value in lysosomes.
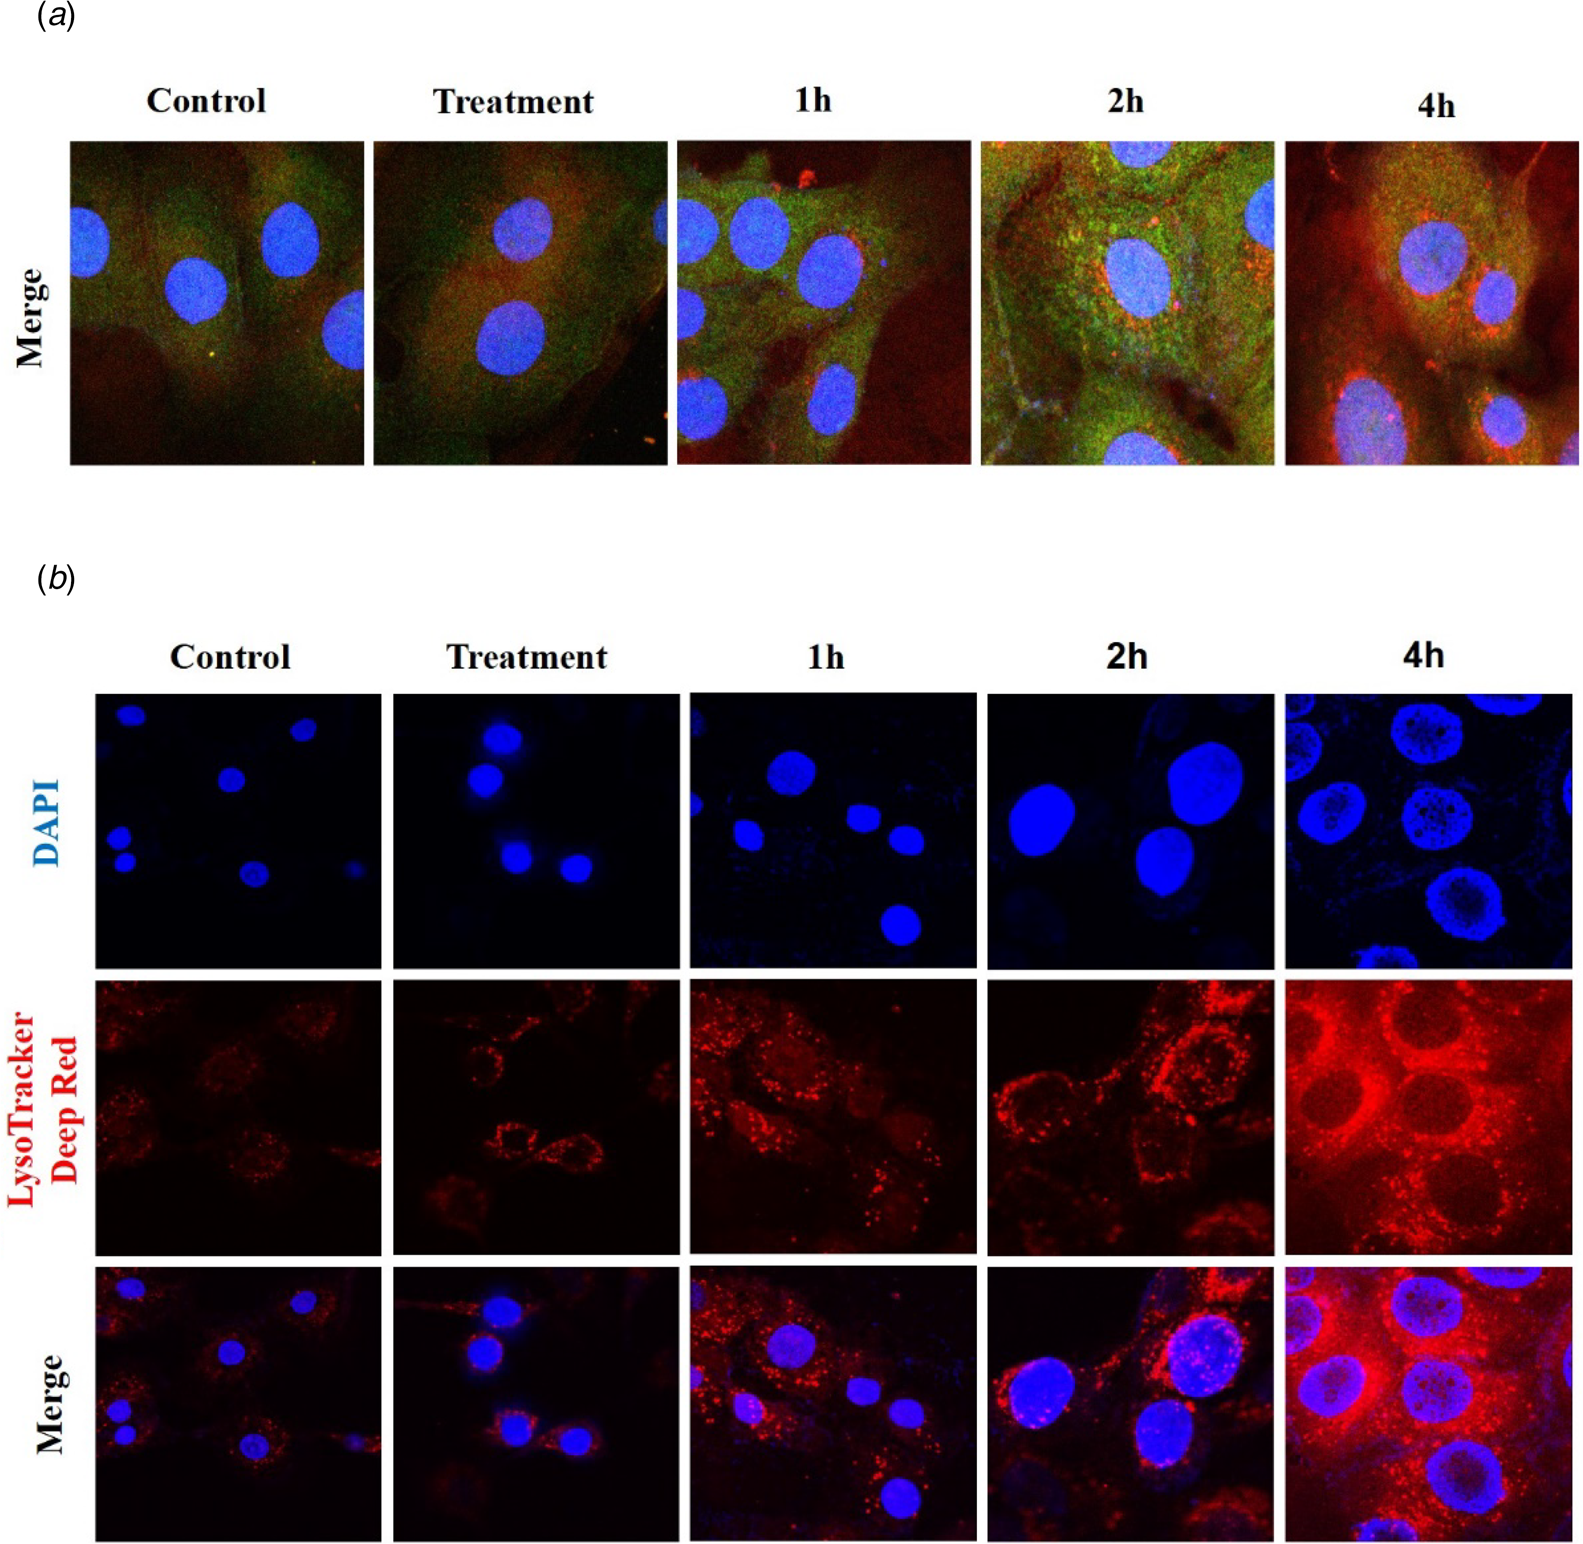
Fig. 3. Changes of autophagosome and lysosome after S. agalactiae infection: (a) Representative confocal images of LAMP2 and LC3 after multiple infections for 1, 2 and 4 h of S. agalactiae. (b) Cells were dyed with LysoTracker Deep Red for 30 min after S. agalactiae infection to explore the lysosomal pH. Scale bars: 10 μm.
Akt/mTOR signaling pathway
Several signaling pathways play a crucial function in regulating autophagy, including the PI3K/Akt/mTOR pathway (Yang et al., Reference Yang, Pi and Wang2018). Autophagy is inhibited by 3MA but activated by Rapa. As represented in Fig. 4a, b, compared with that in the control group, the ratio of p-Akt/Akt and p-mTOR/mTOR significantly decreased (P < 0.05) in groups of Rapa + S. agalactiae (especially) and S. agalactiae alone. Meanwhile, there was no significant change in 3MA treated cells, even if the value showed a numerical increase. The results suggested that S. agalactiae-infection inhibited the activation of p-Akt and p-mTOR, thereby inducing autophagy. Moreover, in the current study, levels of pAkt-LC3-II were detected by fluorescence microscopy (Fig. 4c). Serum can enable the activated p-Akt to enter the nucleus (Fukuda et al., Reference Fukuda, Asano, Nakamura, Adachi, Yoshida, Yanagida and Nishida1997; Mawal-Dewan et al., Reference Mawal-Dewan, Lorenzini, Frisoni, Zhang, Cristofalo and Sell2002). LC3-II staining showed fluorescence with green color, and p-Akt showed red fluorescence. Therefore, the experimental results are consistent with the prediction. A large amount of p-Akt accumulated in the nuclei of control and treatment groups. Especially, for Rapa, Rapa + S. agalactiae, and S. agalactiae groups, the levels of p-Akt in the nucleus decreased significantly, which may be related to the inhibition of Akt activation during autophagy. These results indicate that S. agalactiae induces autophagy via PI3K/Akt/mTOR pathway.

Fig. 4. Detection of Akt and mTOR after S. agalactiae challenge: (a) The variation of p-Akt/Akt protein expression after addition of 3MA, Rapa, and S. agalactiae. (b)The variation of p-mTOR/mTOR protein expression after the addition of 3MA, Rapa, and S. agalactiae. The immunoblot results of p-Akt/Akt and p-mTOR/mTOR were processed by ImageJ. All values are expressed as the means ± sd, (n = 3; *, P < 0.05). (c) Representative confocal images of pAkt and LC3 after adding 3MA or Rapa. Scale bars: 10 μm.
S. agalactiae intracellular survival
In order to understand the function of autophagy on the survival of S. agalactiae in the cell, two autophagy regulators (3MA and Rapa) were added in this experiment, and the results are given in Fig. 5. Compared with the S. agalactiae group, the number of intracellular S. agalactiae in the S. agalactiae + Rapa group showed an extremely significant increase at 4, 8 and 12 h (P < 0.01). In addition, in the S. agalactiae + 3MA group, the number of intracellular S. agalactiae was significantly decreased at 8 (P < 0.05) and 12 h (P < 0.01).

Fig. 5. The number of S. agalactiae surviving in BMECs: BMECs were exposed to S. agalactiae for 2 h. After adding 3MA or Rapa, the intracellular S. agalactiae quantity was calculated at 4, 8 and 12 h. All values are expressed as the means ± sd, (n = 3; *, P < 0.05; **, P < 0.01).
Discussion
Mastitis caused by S. agalactiae is common in dairy cattle worldwide, and the infection rate in some areas is showing a rapid upwards trend (Jørgensen et al., Reference Jørgensen, Nordstoga, Sviland, Zadoks, Sølverød, Kvilte and Mørk2015; Almeida et al., Reference Almeida, Alves-Barroco, Sauvage, Bexiga and Glaser2016). Previous studies have demonstrated that autophagy is involved in the clearance of intracellular pathogens such as S. agalactiae. Six principal steps are involved in the process of mammalian autophagy: start over, nucleation, extension, closure, maturation and degradation or extrusion (Kang et al., Reference Kang, Zeh, Lotze and Tang2011). Our team has confirmed that S. aureus, which like S. agalactiae is a mastitis pathogen, can induce autophagy of bovine mammary gland epithelial cells. We have also explored the role of the MAPK pathway in cell autophagy (Run et al., Reference Run, Wen, Lumei, Na, Xiaozhou, Meihua, Jianzhu, Yongxia and Bo2021). Autophagy is regulated by many signaling pathways. In addition to MAPK signaling, the PI3K/Akt/mTOR pathway is also a classic autophagy pathway (Feng and Qiu, Reference Feng and Qiu2018). However, the relationship between autophagy induced by S. agalactiae and PI3K/Akt/mTOR pathway is unknown.
The method of monitoring autophagy began with the initial discovery of the autophagosome or autophagolysosome (Chikte et al., Reference Chikte, Panchal and Warnes2014). LC3-II is an iconic protein of autophagy and has been extensively used to assess the degree of autophagy (Jiang and Mizushima, Reference Jiang and Mizushima2015). Under normal conditions, when autophagy is activated, LC3 protein as type I (LC3-I) in the cytoplasm is enlisted into autophagosomes and soon afterward transformed into LC3-II (Lu et al., Reference Lu, Li, Tan, An, Cai, Hu, Wang, Wang, Lu and Lu2018). Fluorescent protein LC3 is often used to show the levels of intracellular autophagosomes (Eskelinen, Reference Eskelinen2006). In the current research, S. agalactiae infection resulted in an increasing level of LC3 within 4 h, indicating that an increase in the number of autophagic vacuoles was induced. Protein p62, localized at autophagosomes, is also an autophagy marker protein (Geng et al., Reference Geng, Wang, Yu, Wang and Liu2020b). Studies have reported that p62 is constantly degraded by the autophagy–lysosomal pathway as autophagic activity increases (Lu et al., Reference Lu, Li, Tan, An, Cai, Hu, Wang, Wang, Lu and Lu2018). In this study, the level of p62 decreased in cells treated with S. agalactiae compared with that in cells kept in a normal state, this being significant after 4 h. Beclin1 was discovered as a binding partner of Bcl2. Especially, the Bcl2-Beclin1 complex plays an essential part in both autophagosome formation and fusion with lysosomes (Maejima et al., Reference Maejima, Kyoi, Zhai, Tong and Sadoshima2013; Mukhopadhyay et al., Reference Mukhopadhyay, Panda, Sinha, Das and Bhutia2014). Bcl2 is an anti-autophagy protein that restrains autophagy by directly interacting with the BH3 domain of Beclin1 (He et al., Reference He, Bassik, Moresi, Sun, Wei, Zou, An, Loh, Fisher and Sun2012). Based on previous studies, when autophagy is induced, Bcl2 must be displaced from Beclin1, such that the Bcl2-Beclin1 complex is disrupted (Mukhopadhyay et al., Reference Mukhopadhyay, Panda, Sinha, Das and Bhutia2014). Moreover, autophagy is activated while the Beclin1 signaling pathway in cells is upregulated (Lu et al., Reference Lu, Li, Tan, An, Cai, Hu, Wang, Wang, Lu and Lu2018). As expected, compared with that in the control group, levels of Beclin1 and Bcl2 significantly increased in our work, which suggests that Beclin1 and Bcl2 are involved in S. agalactiae-induced autophagy. In summary, the changes in LC3, p62, Beclin1, and Bcl2 strongly suggest that S. agalactiae induces autophagy in bMECs.
Lysosome-associated membrane protein-2 (LAMP-2) is a fundamental protein ingredient of the lysosome membrane. LAMP-2 promotes the maturation of autophagolysosomes by accelerating vesicular fusion on microtubules, which facilitates the degradation of the contents in the autolysosome (Tanaka et al., Reference Tanaka, Guhde, Suter, Eskelinen, Hartmann, Lullmann-Rauch, Janssen, Blanz, Figura and Saftig2000; Eskelinen, Reference Eskelinen2006). Fusion of lysosomes with autophagosomes produces autolysosomes (Babuta et al., Reference Babuta, Furi, Bala, Bukong, Lowe, Catalano, Calenda, Kodys and Szabo2019). The expression level of LAMP-2 increases when the autolysosome pathway is activated (Geng et al., Reference Geng, Wang, Yu, Wang and Liu2020b). In this study, the intracellular red and green fluorescence spots enhanced during 1 to 4 h post-infection. The number of overlapping parts (displayed in yellow) reached the maximum after 4 h. The results indicate that the number of autolysosomes increased with the increased degree of autophagy. Therefore, it is reasonable to speculate that the autolysosomal pathway is activated. Lysosomes are membranous cell organs involved in the degradation of intracellular proteins and external pathogens. Under a normal physiological environment, lysosomes show weak acidity (Chikte et al., Reference Chikte, Panchal and Warnes2014). Lysosomes contain a large number of hydrolytic enzymes, which are characterized by optimum activity in an acidic environment with pH = 5 (Pierzyńska-Mach et al., Reference Pierzyńska-Mach, Janowski and Dobrucki2014). The LysoTracker Deep Red dye easily passes through cytomembrane as well as membranes of cytoplasmic vesicles and gets captured inside the acidic vesicles, such that intracellular lysosomes reflect red fluorescence. The accumulation of fluorescence probes in their interior is directly related to their acidity (Pierzyńska-Mach et al., Reference Pierzyńska-Mach, Janowski and Dobrucki2014). Previous work has shown that the pH of lysosomes decreases and the fluorescence intensity increases when lysosomal activity is increased. The fluorescence intensity could act as an index of variations in lysosomal pH (Martins et al., Reference Martins, Santos, Rocha, Bacellar and Baptista2018; Zhitomirsky et al., Reference Zhitomirsky, Farber and Assaraf2018). In our current research, the intracellular red fluorescence increased continuously within 4 h post-infection, which proved that the pH in lysosomes was reduced. In short, autophagosomes fused with lysosomes, and the hydrolases in lysosomes dissolved S. agalactiae.
The PI3K/Akt/mTOR pathway is a major intracellular signaling pathway involved in regulating physiological activities in the cell (Feng and Qiu, Reference Feng and Qiu2018). In many cell systems, autophagy is controlled by this pathway. Akt may directly or indirectly phosphorylate mTOR. mTOR (mammalian target of rapamycin) is a major negative feedback regulatory protein of autophagy (Lopiccolo et al., Reference Lopiccolo, Blumenthal, Bernstein and Dennis2008). The activity of mTOR can be inhibited by Rapa, thereby inducing autophagy (Liu et al., Reference Liu, Pei, Yang, Li, Amit, Liu, Buchan and William2017). 3MA inhibits autophagy by blocking the class III PI3K pathway, and it can also suppress the formation of autophagosomes and autophagic lysosomal protein degradation (Zhang et al., Reference Zhang, Song, Zhang, Jiang and Ni2021). Previous studies have shown that inhibiting the PI3K/Akt/mTOR pathway contributes to the induction of autophagy (Tu et al., Reference Tu, Jin, Hu, Ren, Zhao and He2020). The present study observed that compared with controls, the amount of p-Akt and p-mTOR expression significantly decreased in groups of Rapa + S. agalactiae and S. agalactiae. After adding 3MA to inhibit autophagy, although the expression of p-Akt and p-mTOR did not change significantly, it still showed an upward trend. Studies have demonstrated that after serum stimulation, p-Akt could enter the nucleus (Lorenzini et al., Reference Lorenzini, Tresini, Mawal-Dewan, Frisoni, Hong, Allen, Sell and Cristofalo2002; Mawal-Dewan et al., Reference Mawal-Dewan, Lorenzini, Frisoni, Zhang, Cristofalo and Sell2002). In our case, the results of confocal microscope showed that after the addition of Rapa and S. agalactiae at the same time, the level of p-Akt in the nucleus decreased significantly, and the number of LC3 aggregation spots increased significantly compared with the control group and S. agalactiae group. Therefore, we speculate that the activation of p-Akt and p-mTOR were inhibited when S. agalactiae induced autophagy of bMECs.
An intracellular survival assay was carried out to further explore the function of autophagy on intracellular S. agalactiae survival. In particular, when 3MA was added to inhibit autophagy, the number of intracellular S. agalactiae reduced significantly, whereas the number of bacteria increased significantly when Rapa was added. This finding may indicate that it was related to the immune escape of intracellular S. agalactiae, and the occurrence of autophagy was beneficial to S. agalactiae survival.
In conclusion, we have presented evidence that S. agalactiae can induce autophagy in bovine mammary epithelial cells. The mechanism involves the PI3K/Akt/mTOR pathway, and the data further suggest that the pathogen utilizes autophagy to ensure its survival within the cell.
Acknowledgements
The project was supported by the National Natural Science Foundation of China (31802259, 31872535), Shandong Key R&D Program (2019GNC106141), Shandong Natural Science Foundation of China (ZR2018MC027), China Postdoctoral Science Foundation (2018M632704, 2019T120601), and Funds of Shandong ‘Double Tops’ Program.


