- ACC
acetyl-CoA carboxylase
- FA
fatty acids
- FAS
fatty acid synthase
- F/C
forage/concentrate
- LPL
lipoprotein lipase
- LEP
leptin
- SCD
stearoyl-CoA desaturase
There is growing consumer recognition of the link between diet and health. This awareness impacts food choices and the term “functional food” is a generic one often used to describe this concept (Milner, Reference Milner1999). The functional role of conjugated linoleic acid (CLA) has been recognized by the National Research Council (NRC, 1996). CLA is a generic term for a range of positional and geometric isomers of linoleic acid with benefits to human health. The cis-9, trans-11 CLA is responsible for the anticarcinogenic properties of CLA although the mechanisms are still under study (Larsson et al. Reference Larsson, Bergvist and Wolk2005). The trans-12, cis-10 CLA decreases fat mass in animals, while in human studies these effects are inconclusive (Parodi, Reference Parodi2004).
Dairy products provide approximately 75% of human CLA dietary intake (Bauman, Reference Bauman, Mather, Wall and Lock2006). The cis-9, trans-11 CLA in milk fat is the major isomer and it represents about 78–89% of the total CLA in sheep milk fat (Luna et al. Reference Luna, Fontecha, Juárez and de la Fuente2005). To our knowledge there is no such information for goats milk. Diet (Addis et al. Reference Addis, Cabiddu, Pinna, Decandia, Piredda, Pirisi and Molle2005; Nudda et al. Reference Nudda, Battacone, Usai, Fancellu and Pulina2006; Tsiplakou et al. Reference Tsiplakou, Mountzouris and Zervas2006a; Tsiplakou & Zervas, Reference Tsiplakou and Zervas2008a) and season (Nudda et al. Reference Nudda, McGuire, Battacone and Pulina2005; Tsiplakou et al. Reference Tsiplakou, Mountzouris and Zervas2006a) have major effect on CLA milk fat content of small ruminants, while other factors like breed, stage of lactation and parity have no effect on sheep (Tsiplakou et al. Reference Tsiplakou, Mountzouris and Zervas2006b) or cows (Kelsey et al. Reference Kelsey, Corl, Collier and Bauman2003).
Some published results have shown that there are great differences, where CLA milk fat content is concerned, between animal species. Such differences between ruminant species have mainly been attributed to different feeding regimen. Recently, Tsiplakou and Zervas (Reference Tsiplakou and Zervas2008a), showed that when in sheep and goats diets included olive tree leaves or grape marc, sheep milk fat had significantly higher cis-9, trans-11 CLA and vaccenic acid (trans-11 C18:1, VA) concentrations compared to those of goats. The same researchers, in order to avoid the confounding effect of different food intake, fed the two animal species with the same diet (in quantity and composition) and found that there were great species differences with sheep having also significantly higher cis-9, trans-11 CLA and VA concentrations in milk compared with those of goats (Tsiplakou & Zervas, Reference Tsiplakou and Zervas2008b). To our knowledge there are no published data aimed at the mechanism of these species differences when sheep and goats are fed with the same diet. Bearing in mind that the cis-9, trans-11 CLA is produced primarily in the mammary gland by Δ9-desaturase from VA, an intermediate formed in rumen by biohydrogenation (Bauman and Griinari, Reference Bauman and Griinari2003), the objective of this work was to determine if the differences in the fatty acid (FA) profile, with emphasis on cis-9, trans-11 CLA milk fat content, between sheep and goats, under the same dietary treatments are reflected in the transcript levels of lipogenic genes (ACC, FAS, LPL and SCD) involved in FA or in particular in cis-9, trans-11 CLA biosynthesis.
Materials and Methods
The experiment was conducted according to guidelines of the Agricultural University of Athens for the care and use of farm animals by the use of proper management in order to avoid any unnecessary discomfort to the animals.
Twelve, Friesian dairy ewes, 70·1±2·53 kg average body weight (BW) of good body condition (3·0±0·14) and twelve Alpine dairy goats, 56·3±2·11 kg BW of good body condition (2·5±0·19), were used for the experiment. Lambing and kidding started in December and in February respectively, and lasted 2 weeks. All sheep and goats were at their 2nd parity.
The animals were fed with two diets (A and B), consisted of alfalfa hay, wheat straw and concentrates which were from the same batch. The concentrate diet (g/kg) consisted of: maize grain, 360; barley grain, 360; soybean meal, 160; wheat middlings, 110; calcium phosphate, 15; common salt, 3; mineral and vitamins premix, 2. The mineral and vitamin premix contained (per kg as mixed): 150 g Ca, 100 g P, 100 g Na, 100 Co, 300 mg I, 5,000 mg Fe, 10,000 mg Mn, 20,000 mg Zn, 100,000 mg Se, 5,000,000 IU retinol, 500,000 IU cholecalciferol and 15,000 mg α-tocopherol.
The chemical composition and the calculated energy content of alfalfa hay, wheat straw and concentrates are shown in Table 1.
Table 1. Mean daily energy (MJ NELFootnote *) and crude protein (g) requirements of each sheep and goat and their respective intakes per dietary treatment (A and B) and chemical composition (g/kg dry matter) and energy content (MJ NELFootnote */kg dry matter) of alfalfa hay, wheat straw and concentrate (Mean±SEM)1


1 SEM=standard error of the mean, 2S=Sheep, 3G=Goats, 4DIM=Days in milk
* NEL=net energy of lactation (calculated)
Because the sheep and the goats had different requirements (due to different milk yield, body weight etc) (Table 2), each diet (A and B) were not offered to the animals at the same days in milk (DIM), but when the animals had about the same energy and protein requirements (Table 1). Each dietary treatment lasted 3 weeks. Water was offered ad libitum to animals throughout the experimental period. All ewes and goats were weighed in the first and the last day of each dietary treatment.
Table 2. Body weight (kg), milk yield (g/day/head) and milk chemical composition (g/kg) of sheep and goat species fed either with diet A or with diet B (Mean±SEM)Footnote 1

Superscripts 1, 2 and 3 as in Table 1
Means with different superscripts (a, b) for each parameter in each column (between sheep and goats at each dietary treatment) differ significantly (P⩽0·05)
Diet A
Diet A was fed on a group basis as it is traditionally used in practise. Further to that, since food intake affects CLA milk fat content, this regimen was decided in order to have comparable food intake by both animal species. For this purpose Diet A was offered to sheep from DIM=105 to DIM=126, and to goats, from DIM=63 to DIM=84, in order to meet their nutritive requirements. The composition of diet A was calculated according to sheep and goats maintenance and lactation requirements (Zervas et al. Reference Zervas, Kalaisakis and Fegeros2004), taking into account their average body weight, milk yield and milk fat content. Thus, per each group of sheep and goats, diet A consisted daily of 14 kg alfalfa hay, 4 kg wheat straw and 16 kg concentrate with a F/C ratio 53/47 on dry matter (DM) basis. The forages and the concentrates were offered to animals twice a day in two equal parts, at 0800 and 1600 h. No refusals were left from the offered diet. Diet A was also the starting point of the experiment, in order to plane the diet B and the offered amount of food to be consumed by any individual sheep and/or goat.
Diet B
This dietary treatment was chosen to avoid the individual feed intake variation and selectivity, which is usually observed in group feeding, among animals of the same species or between the two animal species. All ewes and goats were fed individually, in order to have comparable energy and crude protein intake, twice a day in two equal parts at 0800 and 1600 h, with 1·0 kg alfalfa hay, 0·3 kg wheat straw and 1·34 kg concentrate daily per animal, with a F/C ratio 49/51 on DM basis. Diet B consumed by sheep from DIM=140 to DIM=161 whereas by goats from DIM=98 to DIM=119. Diet selectivity did not occur and no refusals were left from any of the animals.
The dietary treatments A and B were chosen due to their complementary properties in order to study the species (sheep/goats) differences with the minimum dietary effects. Diet A met the average groups requirements but with an individual variation in food intake among the animals, while with diet B all the animals fed individually with the same amount of food, despite the fact that some animals did not cover their requirements.
Measurements and sample collection
All animals were milked twice a day by milking machine. Two individual milk samples were taken from sheep and goats on the 15th and the last day (21st) of each dietary treatment, after mixing the yield from the evening and the morning milking, on a percent volume (5%). Blood samples were also taken on the last day of each dietary treatment from the jugular vein into heparin-containing tubes and subsequently centrifuged at 2700 g for 15 min to separate plasma from the cells.
Mammary adipocytes (MA) were also taken by biopsy on the last day of each dietary treatment after morning milking. Before the biopsy the mammary gland of the animals was shaved and cleaned. A 2–3 cm incision with scalpel was made in the skin on the upper portion of the right udder in order to reach adipocytes. About 1 g MA was collected under sterile conditions and immediately frozen in liquid nitrogen and stored at −80°C until RNA extraction.
Analyses
Milk and feed samples were analysed for FA profile by gas chromatography, as described by Tsiplakou et al. (Reference Tsiplakou, Mountzouris and Zervas2006a). The plasma FA analysis was done according to the method of Bondia-Pons et al. (Reference Bondia-Pons, Castellote and Lopez-Sabater2004). Alfalfa hay, wheat straw and concentrates were analysed for their chemical composition as described by Tsiplakou et al. (Reference Tsiplakou and Zervas2008b). Plasma nonesterified fatty acids (NEFA) concentrations were determined by spectrophotometric assays using kit C, WAKO, Unipath S.A., Dardilly, France.
Determination of transcripts levels using real-time RT-qPCR assay
Total RNA was isolated from 1 g MA using the Trizol reagent (Invitrogen, Paisley, UK) according to the manufacturer protocol. Prior to RT-PCR, the total RNA samples were treated with DNase I (Promega, Madison, WI) at 37°C for 60 min. The complete digestion of genomic DNA was confirmed by real-time PCR reaction using our gene specific primers. First-strand cDNA was reverse transcribed from 2 μg of DNase-treated total RNA, using SuperScript II reverse transcriptase (Invitrogen), according to standard protocols. The resulted first-strand cDNA was diluted to a final volume of 100 μl, and SYBR green-labelled PCR fragments were amplified using gene-specific primers (Table 3) designed from the transcribed region of each gene using Primer Express 1.5 software (Applied Biosystems, Darmstadt, DE). RT-PCR reactions were performed on the Stratagene MX3005P real-time PCR apparatus using Power-SYBR Green master mix (Applied Biosystems) at a final volume of 15 μl, gene-specific primers at a final concentration of 0·2 μm each and 1 μl of the cDNA as template. PCR cycling started at 95°C for 10 min, followed by 40 cycles of 95°C for 15 sec and 60°C for 1 min. The primer specificity and the formation of primer-dimmers were monitored by dissociation curve analysis and agarose gel electrophoresis. The expression levels of GAPDH were used as internal standards. The use of GAPDH as an internal standard was validated as in all our samples GAPDH transcript levels remained relatively constant with Ct values ranging between 20 and 21·5. Relative transcript levels of the gene of interest (X) were calculated as a ratio to the GAPDH gene transcripts (C), as (1+E)−ΔCt, where ΔCt was calculated as (CtX−CtC). PCR efficiency (E) for each amplicon was calculated employing the linear regression method on the Log (Fluorescence) per cycle number data, using the LinRegPCR software (Ramakers et al. Reference Ramakers, Ruijter, Deprez and Moorman2003).
Table 3. Primers used for real-time RT-qPCR

Statistical analysis
Milk data were analysed using the general linear model (GLM) repeated measures analysis of variance (ANOVA) procedure in order to assess the effects of species (i.e sheep and goats), diet (A & B) and their interactions (species×diet) using the SPSS statistical package program, version 8.0.0. The model used was: Yij=μ+Si+Pj+(S×P)ij+eij where Yij=dependent observation; μ=overall mean; Si=effect of species (i=sheep, goats); Pj=effect of diet (j=A & B ); (S×P)ij=effect of interaction between species and diet; and eij=the residual error. Diet was used as the factor indicating the repetition within the experimental unit. The animal was used in the model as a random factor. In addition, within each dietary treatment differences between the species were analysed using GLM general factorial ANOVA.
The effects of diet (A & B) in each animal species (i.e sheep and goats) or the effects of species in each dietary treatment on the transcripts levels of the genes was tested using Student's t test. Statistical significance was determined at an alpha level of P<0·05.
Results and Discussion
Within the mammary gland, the metabolic pathway for de novo FA synthesis involves two key enzymes: ACC and FAS, while LPL is involved in the uptake of plasma FA. These FA could then be desaturated by SCD resulting in synthesis of cis-9 unsaturated FA. In the mammary gland both epithelium and the mammary adipocytes (MA) optimize their metabolism for the synthesis and utilization of milk FA in both independent and interdependent manners using many of the same enzymes encoded by the same genes (Rudolph et al. Reference Rudolph, Neville and Anderson2007).
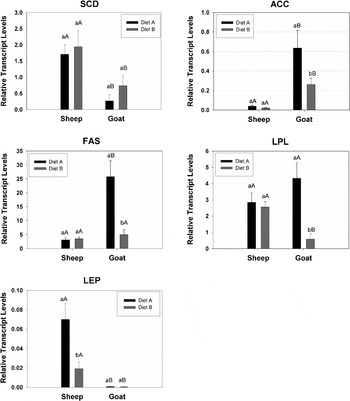
In the present study significant reduction on mRNA of ACC and FAS in the MA of goats (Fig. 1) was observed between the two dietary treatments, which is in accordance with the significant reduction of C14:0 and C16:1 in their milk fat content, while the decrease in C16:0 concentration was not significant (Table 4). The close relationship between mRNA of ACC and FAS and short- and medium-chain FA has already been observed in cows by Piperova et al. (Reference Piperova, Teter, Bruckental, Sampugna, Millis, Yurawecz, Fritsche, Ku and Erdman2000), using a milk fat depressing diet (25/70% forage /concentrate, supplemented with 5% soybean oil) and Ahnadi et al. (Reference Ahnadi, Beswick, Delbecchi, Kennely and Lacasse2002), using diet supplemented with fish oil, and in goats by Bernard et al. (Reference Bernard, Rouel, Leroux, Ferlay, Faulconnier, Legrand and Chiliard2005b) using hay- based diet supplemented with formaldehyde-treated linseed. From the above results of cows and goats, the accumulation of ACC transcripts and the C4:0 – C16:0 milk FA were positively related (r=+0·66) (Bernard et al. Reference Bernard, Leroux, Chiliard, Sejrsen, Hvelplund and Nielsened2006). However, the concentrations of C6:0, C14:0, and C16:0 in sheep milk fat decreased significantly when the animals were fed with diet B compared with diet A, even though the mRNA of ACC and FAS in the MA did not follow this reduction and the FA intake was comparable between the two diets (Table 1).

Fig. 1. Transcript accumulation of genes involved in cis-9, trans-11 C18:2 CLA and FA biosynthesis. SCD=Stearoyl-CoA desaturase, ACC=Acetyl-CoA carboxylase, FAS=Fatty acid synthase, LPL=Lipoprotein lipase, LEP=Leptin.
Superscripts with small letters (a,b) in each animal species (sheep/goats) between the two dietary treatments (A/B) differ significantly (P⩽0·05)
Superscripts with capital letters (A,B) between the two animal species (sheep/goats) in each dietary treatment (A/B) differ significantly (P⩽0·05)
Table 4. Individual fatty acids profile (% of total FA), Δ-9 desaturase ratios concentrations of sheep and goat milk fat fed either with diet A or B (Mean±SEM)Footnote 1

Superscripts 1, 2 and 3 as in Table 1
VA =trans-11 C18:1. This value is not included in the C18:1 content.
Means with different superscripts with small letters
(a,b) in each row for each parameter in sheep and goats (between the dietary treatments) differ significantly (P⩽0·05)
Means with different superscripts with capital letters
(A,B) in each column for each parameter (between sheep and goats in each dietary treatment) differ significantly (P⩽0·05)
In addition, significant reduction was also observed in mRNA levels of LPL in the MA of goats fed with diet B compared with those of diet A. Due to the higher individual milk yield variation among the goats compared with sheep, diet B caused negative energy balance for some of the goats which affected their body weight, but not significantly (Table 2). These results agree with those by Jensen et al. (Reference Jensen, Gavigan, Sawicki, Witsell, Eckel and Neville1994), who showed that underfeeding down regulates the expression of LPL gene in the mammary gland of mouse. The same trend, concerning LPL gene expression, has been also observed and by Bonnet et al. (Reference Bonnet, Leroux, Faulconnier, Hocquette, Bocquier, Martin and Chilliard2000) in adipose tissue and cardiac muscle of sheep. Furthermore, the significant reduction in mRNA levels of LPL in the MA of goats, fed with diet B, compared with diet A, is in accordance with the significant reduction of C18:0 in their milk fat, even though their C18:0 blood plasma concentration did not differ between the two dietary treatments (Table 5). The C18:0 milk FA is imported from the plasma where it is released by the enzyme LPL (Barber et al. Reference Barber, Clegg, Travers and Vernon1997) from triglycerides circulating in chylomicra or in very low density lipoproteins. The concentration of C18:0 in sheep milk fat and blood plasma did not differ between the two dietary treatments (Tables 4 and 5). Interestingly, no significant changes on LPL transcript levels were observed in sheep between the two dietary treatments (Fig. 1).
Table 5. Individual fatty acids profile (% of total FA), and non esterified fatty acids (NEFA) (mg/dL) concentrations of blood plasma of sheep and goat milk fat fed either with diet A or B (Mean±SEM)Footnote 1

Superscripts 1, 2 and 3 as in table 1
VA =trans-11 C18:1. This value is not included in the C18:1 content
Means with different superscripts with small letters
(a,b) in each row for each parameter in sheep and goats (between the dietary treatments) differ significantly (P⩽0·05)
Means with different superscripts with capital letters
(A,B) in each column for each parameter (between sheep and goats in each dietary treatment) differ significantly (P⩽0·05)
The very low accumulation of LEP transcripts in the MA of goats, independently of the dietary treatments (Fig. 1), could be explained by the fact that during lactation adipocytes were decreased dramatically in the mammary gland as it has been shown by Bonnet et al. (Reference Bonnet, Gourdou, Leroux, Chilliard and Djiane2002) in sheep mammary gland. The higher mRNA of LEP sheep MA fed with diet A compared with diet B (Fig. 1) could be attributed to the progress of lactation since the FA intake between the two diets were comparable (Table 1). These results are in accordance with those by Vernon et al. (Reference Vernon, Denis, Sorensen and Williams2002) who showed that the mRNA of LEP decreased during lactation in rodents. The difference on mRNA of LEP in the MA between the two animal species, independently of the fed diet (Fig. 1) could be explained by the different body condition score which was much higher in sheep compared to goats.
The sheep did not show any significant differences in ACC, FAS and LPL gene expression in the MA between the two dietary treatments (Fig. 1), even though there were at different DIM (stage of lactation). This was not the case with goats which showed significant reduction in ACC, FAS and LPL gene expression in the MA from diet A to diet B. Miller et al. (Reference Miller, Delbecchi, Petitclerc, Wagner, Talbot and Lacasse2006) has shown in dairy cows that the stage of lactation had no effect on ACC, FAS and LPL gene expression, which are related to milk synthesis. This supports the hypothesis that other factors, further to stage of lactation, may affect those genes regulation. Probably the negative energy balance of goats fed the diet B (Table 1) could be partly responsible for the above genes expression reduction. This negative energy balance of goats was rather unavoidable, in contrast to sheep, because they had high individual milk yield variation among them and the objective of this study was each of them to consume the same amount of food. The same food and FA intake, by each sheep and goat, was chosen in order to avoid dietary effects which are the major factor affecting the FA profile of milk and blood plasma. Thus, the choice of both diets (A and B) was to minimize the effect of diet and to underline species effects on genes mRNA expression and on VA and cis-9, trans-11 CLA milk fat content.
In sheep, the milk fat concentrations of C6:0, C8:0, C10:0 and C16:0 were significantly lower compared with those of goats when the animals were fed with diet B (Table 4). The same pattern was observed with diet A, only for the concentrations of C10:0 and C16:0. These results could again be explained by changes in mRNA of ACC and FAS levels. Indeed, the mRNA of ACC was significantly lower in sheep MA compared with that of goats independently of the fed diet (Fig. 1). The same trend was observed in the mRNA of FAS, but the results where significant only for diet A. The non statistical differences in C18:0 milk fat and blood plasma concentration between the two animal species agrees with the results on mRNA of LPL in the MA, when the animals were fed with diet A. When the animals were fed with diet B the gene expression of LPL differed significantly between the two animal species even though there was non statistical difference in C18:0 milk and blood plasma. This fact could again be explained by the negative energy balance of goats compared with sheep when the animals were fed with diet B.
When the animals were fed either with diet A or B the main FA in their milk fat were C16:0 and C18:1, with C16:0 having the highest concentration in both animal species, followed by, in decreasing order, C10:0, C14:0, C18:0, C12:0, C18:2n6c, C8:0, C6:0, and C15:0 (Table 4). However, some other FA identified in milk fat showed individual content less than 1% in both animal species (data are not shown).
In both sheep (Ward et al. Reference Ward, Travers, Richards, Vernon, Salter, Buttery and Barber1998) and goats (Bernard et al. Reference Bernard, Leroux, Hayes, Gautier, Chiliard and Martin2001) genomes, SCD is encoded by a single gene, which is transcribed in a 5-kb mRNA. The SCD gene is highly expressed in lactating mammary gland of goats (Bernard et al. Reference Bernard, Leroux, Bonnet, Rouel, Martin and Chiliard2005a) and sheep (Ward et al. Reference Ward, Travers, Richards, Vernon, Salter, Buttery and Barber1998). Studies on SCD gene expression in sheep and goats mammary gland are limited. In ruminants, the only available data concern the nutritional regulation of SCD gene expression both in vivo and in vitro. Few in vivo trials have been carried out in mid-lactation cows (Piperova et al. Reference Piperova, Teter, Bruckental, Sampugna, Millis, Yurawecz, Fritsche, Ku and Erdman2000; Delbecchi et al. Reference Delbecchi, Ahnadi, Kennelly and Lacasse2001; Ahnadi et al. Reference Ahnadi, Beswick, Delbecchi, Kennely and Lacasse2002; Peterson et al. Reference Peterson, Matitashvili and Bauman2003) and goats (Bernard et al. Reference Bernard, Leroux, Bonnet, Rouel, Martin and Chiliard2005a & b). To our knowledge there is no other study which compares sheep and goats under exactly the same dietary treatments, by quality and quantity, concerning lipogenic (ACC, FAS, LPL and LEP) genes and SCD gene, in their MA. In this study the levels on mRNA of SCD in sheep MA were significantly higher compared with those of goats, independently of the fed diet (A or B) and the DIM. This supports the hypothesis of species-specific differences already suggested by Jahreis et al. (Reference Jahreis, Fritsche, Mockel, Schone, Moller and Steinhart1999). The results of mRNA of SCD in MA may partly explain the significantly higher concentrations of cis-9, trans-11 CLA in sheep milk fat compared with those of goats. In addition sheep milk fat had significantly higher concentrations of VA (the substrate which is used from the Δ-9 desaturase in the mammary gland for cis-9, trans-11 CLA production in milk fat) compared with those of goats, independently from the fed diet (Table 4). These results indicate that not only the mRNA expression of SCD in the mammary gland but and other factors (probably in the rumen) are also responsible for species differences (sheep/goats) in the cis-9, trans-11 CLA production in milk fat.
It should also pointed out here that even though sheep and goats in this study had different DIM (stage of lactation) this has no effect on their cis-9, trans-11 CLA milk fat content as it has been shown from previous work with dairy sheep (Tsiplakou et al. Reference Tsiplakou, Mountzouris and Zervas2006b) and cows (Kelsey et al. Reference Kelsey, Corl, Collier and Bauman2003).
Until now, the observed differences between grazing sheep and grazing goats, in cis-9, trans-11 CLA milk fat content, had been attributed to differences in grazing behaviour (Nudda et al. Reference Nudda, Mele, Battacone, Usai and Macciota2003; Tsiplakou et al. Reference Tsiplakou, Mountzouris and Zervas2006a). The results of the above study indicated that there are great species differences between sheep and goats in cis-9, trans-11 CLA milk fat content, with sheep having always higher cis-9, trans-11 CLA content in their milk fat, which needed to be clarified. To this purpose, the present work shows that the different expression of SCD gene under the same dietary treatment explains in part to what the species differences are possibly due.
The mRNA of SCD could be related with milk cis-9 C14:1/C14:0, cis-9 C16:1/C16:0, cis-9 C18:1/C18:0 and cis-9, trans-11 C18:2 CLA/VA ratios (Table 4) (Bauman et al. Reference Bauman, Corl, Baumgard, Griinari and Garnsworthy2001), representing a proxy for mammary gland SCD activity. Globally, both mRNA of SCD and Δ-9 desaturase ratios were higher in sheep than in goats species with the results being significant for mRNA levels of SCD and cis-9 C16:1/C16:0 independently of the fed diet and for the cis-9 C14:1/C14:0 only for diet B.
Furthermore, in this study was also observed that the Δ-9 desaturase activity ratios, expressed by the cis-9 C14:1/C14:0 and cis-9 C16:1/C16:0 ratios, were very low compared with the other two ratios in both animal species independently of the fed diet, because only a small proportion of C14:0 and C16:0 was desaturated to C14:1 and C16:1 (Chilliard et al. Reference Chilliard, Ferlay, Mansbridge and Doreau2000). A higher Δ-9 desaturase activity was estimated in both animal species fed either diet A or diet B, on the basis of the ratio cis-9 C18:1/C18:0 (Table 4). This could be explained by the fact that C18:0 is the most preferred substrate of Δ-9 desaturase in the mammary gland (Chilliard et al. Reference Chilliard, Ferlay, Mansbridge and Doreau2000).