Seasonal variation in the composition of bovine milk has been widely reported (Auldist et al. Reference Auldist, Walsh and Thomson1998; O'Brien et al. Reference O'Brien, Mehra, Connolly and Harrington1999a, Reference O'Brien, Mehra, Connolly and Harringtonb; Chen et al. Reference Chen, Lewis and Grandison2014). Contributing factors include stage of lactation, nutrition, health status, lactation number, and proportions of cows in a herd calving at different times of the year (Guinee & O'Brien, Reference Guinee, O'Brien, Law and Tamime2010; O'Brien & Guinee, Reference O'Brien, Guinee, Fuquay, Fox and McSweeney2011). The most extensively-used feeding methods for dairy cows include indoors offered total mixed ration, comprised mainly of silage, grain, protein and added vitamins and minerals, or outdoors grazing on pasture, usually with a low quantity of concentrate supplementation offered only at the extremes of the pasture-growing season. The former is used most extensively, for example in continental European USA, China, North Africa and India, while outdoors grazing on pasture is preferred in regions where the climate is more temperate and grass growth is abundant, especially in Ireland, New Zealand and South Eastern Australia. With outdoor grazing, dairy herds may consist of cows that calve over a relatively short period in spring (compact calving), or alternatively of cows that calve more regularly throughout the year (year-round calving). These herd types coincide with two milk production systems from pasture, the former with more consistent milk production throughout the year, and the latter with a peak milk production at a specific time of year (e.g., April–May) and decreasing steadily until end of lactation (e.g., December). A major difference between these pasture-feeding systems is that stage of lactation can have a significant impact on the composition and quality characteristics of a milk supply obtained solely, or largely, from spring-calved herds but not on the characteristics of a milk supply from year-round calving-herds (Davies & White, Reference Davies and White1958; White & Davies, Reference White and Davies1958a). Despite this limitation, milk from pasture-fed, spring-calving herds predominates in some countries, such as Ireland and New Zealand, as it provides the most cost-effective feeding system.
The relatively large seasonal variation in the composition of milk from spring-calving herds is undesirable as it can lead to variation in the stability characteristics of milk, e.g., heat stability (White & Davies, Reference White and Davies1958b; Kelly et al. Reference Kelly, O'Keeffe, Keogh and Phelan1982), ethanol stability (Davies & White, Reference Davies and White1958), rennet gelation characteristics (O'Brien et al. Reference O'Brien, Mehra, Connolly and Harrington1999a), and in the composition, quality and yield of dairy products such as cheese (Kefford et al. Reference Kefford, Christian, Sutherland, Mayes and Grainger1995; Auldist et al. Reference Auldist, Coats, Sutherland, Mayes, McDowell and Rogers1996; Guinee et al. Reference Guinee, O'Brien and Mulholland2007) and yoghurt (Cheng et al. Reference Cheng, Clarke and Augustin2002).
To minimise the variation in composition and quality of milk associated with stage of lactation in pasture-based feeding systems without a consistent year-round calving pattern, processors sometimes use a blend of milk from spring- and autumn-calving herds, whereby the use of milk from the extremes of lactation in each supply (spring- or autumn-calving) can be avoided, while allowing continuity of supply across the year. However, relatively little has been published on seasonal variation in the composition or processing characteristics of a milk supply based on spring- and autumn-calving herds. Hence, the objective of the study was to monitor the seasonal changes in the compositional, physicochemical, rennet gelation, heat stability and ethanol stability characteristics of milk from a pasture-based mixed herd in which the proportions of milk from spring-and autumn-calving cows varied.
Materials and methods
Chemicals
The following chemicals were used: lanthanum chloride, hydrochloric and glacial acetic acid, trichloroacetic acid (TCA), acetic acid, sodium acetate (Thermo Fisher Scientific, Pittsburgh, PA, USA); calcium (Ca, 1000 ppm) and phosphorus (P, 1000 ppm) standard solutions for atomic absorption spectroscopy, L-ascorbic acid, sodium molybdate (≥98%), urea, acetonitrile, trifluoroacetic acid and sodium azide (Sigma-Aldrich, St. Louis, MO, USA); 2-mercaptoethanol and sulphuric acid (VWR International, Dublin, Ireland). Ethanol (99·9%) was obtained from Carbon Group (Cork, Ireland).
Milk samples
A representative milk sample (~2 l) was collected monthly from the mixed spring-calving/autumn-calving Holstein Friesian herd at the Teagasc Animal and Grassland Research and Innovation Centre Moorepark, over the period March 2014 to November 2014 and January 2015 to February 2015. The mean calving date for the spring-calving herd was 10 and 11 February in 2014 and 2015, respectively; that for the autumn-calving herd was 5 September in both 2013 and 2014. All milk samples, which comprised a bulked mixture of evening and morning milk, were cooled en route to the bulk tank, maintained at 4 °C, sampled within ~3 h of the morning milking, and analysed within 48 h.
The proportions of milk changed over the year (Fig. 1a; Table 1), with milk from the spring-calving herd decreasing from a maximum of ~95% in August to ~0% in January. Simultaneously, milk from the autumn-calving decreased from ~100% of total milk in January to ~5% in August. The variation in proportions of milk from spring- and autumn-calved cows coincided with changes in the number of autumn- and spring-calving cows over the year, as shown in Fig. 1b.

Fig. 1. Seasonal variation in (a) proportions of milk from spring- (![]() ) or autumn- (
) or autumn- (![]() ) calving cows in a mixed herd, and (b) the number of spring- (▲) or autumn- (△) calving cows. The bulked herd milk was sampled on 11 different occasions during the months of March 2014 to November 2014 and January 2015 to February 2015, and the samples were assigned arbitrarily to Spring (March, April and May), Summer (June, July and August), Autumn (September, October and November) or Winter (January and February) seasons.
) calving cows in a mixed herd, and (b) the number of spring- (▲) or autumn- (△) calving cows. The bulked herd milk was sampled on 11 different occasions during the months of March 2014 to November 2014 and January 2015 to February 2015, and the samples were assigned arbitrarily to Spring (March, April and May), Summer (June, July and August), Autumn (September, October and November) or Winter (January and February) seasons.
Table 1. Seasonal variation in the proportions of milk from spring- and autumn-calved cows in a mixed herd, and the gross composition of raw milk †

*Values within a row not sharing a common superscript differ significantly (P < 0·05).
† The bulked herd milk was sampled on 11 different occasions during the months of March 2014 to November 2014 and January 2015 to February 2015; the changes in proportions of milk from spring- and autumn-calving cows is shown in Fig. 1.
sd, standard deviation.
Composition of raw milk
Milk was analysed in duplicate for total solids, total protein, fat and lactose using the FOSS MilkoScan™ FT+ analyser (N. Foss Electric A/S, Hillerød, Denmark). The composition of the raw milk is shown in Table 1.
Preparation of skim milk
Raw milk was heated to 40 °C for 30 min, skimmed to ~<0·1% (w/w) fat using a disc bowl centrifuge (FT15 Disc Bowl Centrifuge, Armfield Limited, Ringwood, UK), preserved using sodium azide (0·2%, w/w), and held at 4 °C until required for analysis. Skim milk was used in preference to whole milk, as the presence of fat can complicate many of the analyses undertaken such as protein profiling, casein micelle size and hydration and heat stability; consequently, milk is typically defatted prior to these analyses (Holt et al. Reference Holt, Muir and Sweetsur1978; Dalgleish & Law, Reference Dalgleish and Law1988; Glantz et al. Reference Glantz, Devold, Begarud, Lindmark-Månsson, Stålhammar and Paulsson2010; Huppertz, Reference Huppertz, McSweeney and O'Mahony2016).
Preparation of skim milk serum
Milk serum was prepared by ultracentrifugation of skim milk at 100 000 g at 25 °C for 1 h (Sorvall Discovery 90SE ultracentrifuge, Kendro Laboratory Products, Asheville, North Carolina, USA) using a fixed-angle Sorvall Titanium-1270 rotor (Dalgleish & Law, Reference Dalgleish and Law1988) and filtration of the centrifugate through glass-wool.
Gross composition and physicochemical analysis of skim milk and skim milk serum
Skim milk was analysed for lactose using a FOSS MilkoScan™ FT+ (N. Foss Electric A/S, Hillerød, Denmark) and fat and total solids using the CEM SMART Trac II (CEM, North Carolina, USA) and pH. Skim milk and serum were assayed for total protein, casein, whey protein, non-protein nitrogen, Ca and P using standard IDF methods (Lin et al. Reference Lin, Kelly, O'Mahony and Guinee2016), and for protein profile using reversed-phase high performance liquid chromatography (Lin et al. Reference Lin, Kelly, O'Mahony and Guinee2016).
The size and zeta potential of the casein micelles in the skim milk were measured using a Malvern Zetasizer Nanoseries Nano-ZS (Malvern Instruments Ltd, Worcestershire, UK), as described by O'Kennedy & Mounsey (Reference O'Kennedy and Mounsey2009). Casein micelle hydration was calculated as the moisture: casein ratio (g water/g casein) of the pellet obtained on ultracentrifugation, as described by Lin et al. (Reference Lin, Kelly, O'Mahony and Guinee2016).
All analyses were performed in triplicate, apart for N determination which was undertaken in duplicate.
Rennet gelation
Skim milk was adjusted to pH 6·55 at room temperature; the temperature of the pH-adjusted skim milk was adjusted to 31 °C and rennet (Chy-Max® plus, 200 IMCU/ml; Chr. Hansen, Hørsholm, Denmark), diluted 1 : 20 in distilled water, was added on a protein basis at a level equivalent to 5·1 ml of undiluted enzyme per kilogram of milk protein. The changes in storage modulus, G′, of the rennet-treated over time (1 h) were measured in duplicate using dynamic low amplitude strain oscillation rheometry in a controlled stress rheometer (Carri-Med, CSL2 500, TA instruments, New Castle, USA) (Lin et al. Reference Lin, Kelly, O'Mahony and Guinee2016). The following parameters were calculated from the resultant G′/time curve: rennet gelation time (RGT), the time required for G′ to increase to a value of ≥0·2 Pa; G′60, the value of G′ at 60 min, and index of gel firmness or strength; and maximum gel firming rate (GFRmax), as the maximum slope of the G′/time curve.
Heat stability
Samples of skim milk (at natural pH) and pH-adjusted sub-samples of skim milk (pH 6·2 to 7·2 at 21 °C) were placed in 4 ml-heat-resistant glass tubes which immersed and rocked gently in an oil bath at 140 °C, as described by Lin et al. (Reference Lin, Kelly, O'Mahony and Guinee2017). The heat coagulation time (HCT) is defined as the time required for the formation of visual flocs of aggregated protein on the walls of tubes.
Ethanol stability
Sub-samples of skim milk were adjusted to pH values of 6·2, 6·4, 6·6, 6·8 or 7·0 and mixed with aqueous ethanol solutions, ranging from 30 to 98% (v/v), at a volume ratio of 1 : 2 based on a milk protein content of 3·3%, which gave a constant ratio of ethanol solution-to-protein of 59·4 ml/g protein (Horne & Muir, Reference Horne and Muir1990). The ethanol stability (ES) was defined as the lowest concentration of aqueous ethanol required to induce flocculation when the ethanol/milk mixture was mixed by vibration for 30 s (Whirlimixer™, Fisons, Holmes Chapel, UK).
Statistical analysis
The milk samples were blocked arbitrarily into four seasons, namely Spring (March, April and May), Summer (June, July and August), Autumn (September, October and November) and Winter (January and February) (Fig. 1a). Analysis of variance (ANOVA) was carried out using a general linear model (GLM) procedure of SAS 9·3 (SAS Institute, 2011) and the effects of season on each response variable was determined. Tukey's multiple-comparison test was used for paired comparison of treatment means and the level of significance was determined at P < 0·05.
Simple linear regression was carried out to determine whether the relationships between measured parameters were significant. The level of significance was determined at P < 0·05 for all analyses, according to Students t-test.
Results and discussion
Skim milk composition
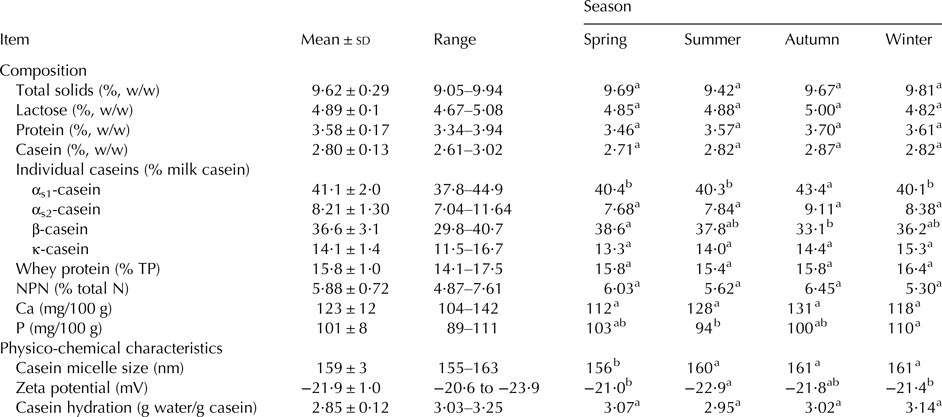
The mean compositional parameters of the skim milk over the year are shown in Table 2. Despite variations throughout the year, season did not significantly affect the concentration of total solids, lactose, protein, casein, whey protein and NPN, or pH (6·63–6·75, data not shown). Similarly, Chen et al. (Reference Chen, Lewis and Grandison2014) reported that season did not significantly affect the mean concentrations of total solids, lactose or urea (major component of NPN) in bulk milk from a year-round calving herd in the UK. However, in contrast to the current study, Chen et al. (Reference Chen, Lewis and Grandison2014) found that season had a significant effect on pH, which varied from 6·73 to 6·87, and the concentrations of protein and casein, which varied from 2·89 to 3·56 and 2·08 to 2·52%, respectively, compared to 3·34–3·94 and 2·61–3·02%, respectively, in the current study. Nevertheless, the percentage change (difference between maximum and minimum values, expressed as a % of the minimum) for concentrations of protein (18%), casein (15%) and whey protein (44%) over the season was comparable to those reported by Chen et al. (Reference Chen, Lewis and Grandison2014), but narrower than those (23, 25 and 53%, respectively) reported by O'Brien et al. (Reference O'Brien, Mehra, Connolly and Harrington1999a) for manufacturing milk in Ireland over the course of a 12 month period. The percentage change over the year in lactose (9%) and NPN (~40%) in the current study were also similar to those reported by O'Brien et al. (Reference O'Brien, Mehra, Connolly and Harrington1999b), but the percentage change in Ca throughout the year was higher (37%, vs. 24%).
Table 2. Seasonal variation in the composition and physico-chemical characteristics of skim milk from a mixed herd comprised of spring-and autumn-calving cows* †
*Values within a row not sharing a common superscript differ significantly (P < 0·05).
† The bulked herd milk was sampled on 11 different occasions during the months of March 2014 to November 2014 and January 2015 to February 2015.
sd, standard deviation; TP, total protein; NPN, non-protein nitrogen; Ca, calcium; P, phosphorus.
The mean levels of αs1, αs2, β and κ-caseins over the season, i.e., ~41·0, 8·2, 36·6 and 14·1% of total casein respectively, were typical of those reported in the literature for bovine milk (Bernabucci et al. Reference Bernabucci, Basiricò, Morera, Dipasquale, Vitali, Cappelli and Calamari2015). Season affected the proportions of αs1- and β-caseins significantly, with autumn milk having a significantly higher proportion of αs1-casein than milk from Spring, Summer or Winter, and a lower proportion of β-casein than spring milk. This trend differs from that reported by Donnelly & Barry (Reference Donnelly and Barry1983) for Irish manufacturing milk, which showed a progressive decrease in the proportion of αs-casein from January to December and β-casein from June to December.
Ca content varied from 104 to 142 mg/100 g across the year but was not influenced significantly by season. The yearly variation, though wide, is consistent with that reported previously for spring-calved or autumn-calved bulk herd milks, e.g., 109–123 mg/100 g in bulk herd ‘liquid’ milk from a mixed calving herd in Ireland (Kelly et al. Reference Kelly, O'Keeffe, Keogh and Phelan1982), 98–126 mg/100 g for bulk herd milk from a year round-calving herd in the UK (Chen et al. Reference Chen, Lewis and Grandison2014), 115–131 mg/100 g for a spring-calving herd milk (White & Davies, Reference White and Davies1958a), and 100–142 mg/100 g (Kelly et al. Reference Kelly, O'Keeffe, Keogh and Phelan1982) or 108–138 mg/100 g (O'Brien et al. Reference O'Brien, Mehra, Connolly and Harrington1999b) for Irish manufacturing milks. P content varied also with season (89–111 mg/100 g) and was influenced significantly by season, being significantly lower in summer milk than in winter milk. The seasonal variation in P was comparable to that (80 to 102 mg/100 g) reported by White & Davies (Reference White and Davies1958a), but larger than that (83 to 95 mg/100 g) obtained for bulk milk samples from 9 different dairy plants in Sweden (Lindmark-Månsson et al. Reference Lindmark-Månsson, Fondén and Pettersson2003).
Physicochemical characteristics of skim milk
While casein micelle size in spring milk was slightly, but significantly, lower than that of milks from the other seasons, the overall seasonal variation in size was quite small (154–163 nm). Seasonal variation in casein micelle size has also been reported by others, including Holt & Muir (Reference Holt and Muir1978) and Glantz et al. (Reference Glantz, Devold, Begarud, Lindmark-Månsson, Stålhammar and Paulsson2010). The former study showed that the casein micelle size of creamery milk in Scotland was significantly lower in Summer (June–August; ~135 nm) than in Winter (December–February; ~70 nm), while the latter study found a significantly lower casein micelle size in summer milk (179 nm) than in winter (204 nm).
ζ-Potential of milk at natural pH is an index of the net negative charge on the casein micelles and, hence, reflects the extent of inter-micellar electrostatic repulsion and stability in the milk. The current values (−20·6 to −23·9 mV) are within the range reported previously for bovine milk at natural pH, i.e., −18·2 to −28 mV (Grimley et al. Reference Grimley, Grandsion and Lewis2009; Glantz et al. Reference Glantz, Devold, Begarud, Lindmark-Månsson, Stålhammar and Paulsson2010). The ζ-potential of summer milk (−22·9 mV) was slightly, but significantly, higher than that of spring milk or winter milk (~−21·0 mV) in the current study.
Casein micelle hydration is the quantity of water entrapped within the micelle and reflects both the structure and extent of interaction between the caseins. Hence, factors that promote casein interaction, e.g., addition of divalent salts such as CaCl2 (Sood et al. Reference Sood, Gaind and Dewan1979; van Hooydonk et al. Reference van Hooydonk, Hagedoorn and Boertiger1986), reduce hydration of casein in milk. Casein hydration varied over the year (2·8–3·3 g water/g casein) but was not significantly affected by season. The mean value of hydration at 25 °C (3·04 ± 0·12 g water/g casein) was within the range reported in the literature (O'Connell & Fox, Reference O'Connell and Fox2000).
Composition of skim milk serum
The mean value for serum N, expressed as protein, was 0·99 ± 0·08% (w/w), equivalent ~25·7–29·8% of total protein in milk (Table 3). Whey protein, casein and NPN accounted for ~63·0, 16·3 and 20·6% of total serum protein, respectively. Serum casein, as a % of milk casein, varied from 3·62–10·54% which was comparable in magnitude to that reported for fresh milk (5–10%) (Dalgleish & Law, Reference Dalgleish and Law1988). While season did not influence the concentrations of total protein, casein or whey protein in the serum, it had significant effect on the proportion of αs (αs1 + αs2) – and κ-caseins. αs-Casein, as a proportion of serum casein, varied from 19·3 to 48·3% across the year, being lowest in Spring (23·8%) and highest in Autumn (37·8%), while κ-casein, which varied from 11·3 to 45·4% of serum casein, showed an opposite trend with season.
Table 3. Seasonal variation in the composition of the serum phase of skim milk from a mixed herd comprised of spring-and autumn-calving cows* † ‡

* Values within a row not sharing a common superscript differ significantly (P < 0·05).
† The bulked herd milk was sampled on 11 different occasions during the months of March 2014 to November 2014 and January 2015 to February 2015.
‡ Skim milk serum was obtained on ultracentrifugation of milk at 100 000 g for 1 h at 25 °C.
sd, standard deviation; NPN, non-protein nitrogen; Ca, calcium; P, phosphorus.
While the concentration of Ca in the serum was not influenced by season, serum Ca as a proportion of total Ca was significantly higher in Summer than in Winter or Spring (Table 3). The mean concentration of serum P in winter-milk was higher than that of milk from Summer or Autumn. Serum P as a proportion of total P was significantly lowest in Autumn.
Rennet gelation
The rennet gelation characteristics (RGT, G′60) of skim milk samples are shown in Table 4. Despite monthly variations, the mean values of RGT, GFRmax and G′60 were not affected significantly by season (Table 4). All rennet gelation parameters were dependent on milk casein content, as reflected by the significant positive correlation between milk casein content and GFRmax or G′60 and the inverse correlation between casein and RGT (Table 5). The trend is consistent with findings from previous studies (Guinee et al. Reference Guinee, O'Callaghan, Mulholland and Harrington1996; Malacarne et al. Reference Malacarne, Franceschi, Formaggioni, Sandri, Mariani and Summer2014), which found a power law relationship between milk protein (and hence casein) content and gel firmness or gel-firming rate (Guinee et al. Reference Guinee, Gorry, O'Callaghan, O'Kennedy, O'Brien and Fenelon1997). The strong relationship between casein level and rennet gelation is expected as the strength of the gel is proportional to the volume fraction of gel building material (calcium phosphate para-casein) (Walstra et al. Reference Walstra, van Dijk and Geurts1985).
Table 4. Seasonal variation in processing characteristics of skim milk from a mixed herd comprised of spring-and autumn-calving cows* †

*Values within a row not sharing a common superscript differ significantly (P < 0·05).
† The bulked herd milk was sampled on 11 different occasions during the months of March 2014 to November 2014 and January 2015 to February 2015
sd, standard deviation; RGT, rennet gelation time; GFR, gel firming rate; G′60, storage modulus at 60 min after addition of rennet; HCTnpH, heat coagulation time at natural milk pH; HCTmax and HCTmin are the maximum and minimum heat coagulation times, respectively, of the HCT/pH (6·2–7·2) curve; ES6·2, ES6·4, ES6·6, ES6·8, and ES7·0 correspond to ethanol stability of milk at pH 6·2, 6·4, 6·6, 6·8 and 7·0, respectively.
Table 5. Relationships between compositional parameters and processing characteristics of skim milk from a mixed herd comprised of spring-and autumn-calving cows †

Correlations were obtained using simple linear regression analysis of the entire data set; only relationships found to be statistically significant are shown: **, P < 0·01; *, P < 0·05.
† Positive and negative correlations between two parameters are indicated by a positive sign (+) and a negative sign (−), respectively.
RGT, rennet gelation time; GFR, gel firming rate; G′60, gel firmness at 60 min after addition of rennet; HCTnpH, heat coagulation time at the natural skim milk pH; HCTmax and HCTmin are the maximum and minimum heat coagulation times, respectively, of the HCT/pH (6·2–7·2) curve; ES6·4, ES6·6 and ES7·0, ethanol stability at pH 6·4, 6·6 and 7·0, respectively; NPN, non-protein nitrogen; Ca, calcium; P, phosphorus.
Heat coagulation time (HCT)
All milk samples had a type A HCT/pH profile, with a maximum HCT at pH 6·6–6·7 (HCTmax) and a minimum at pH 6·8–7·1 (HCTmin). The HCT at natural pH (HCTnpH) and HCTmax are shown in Table 4. Despite month-to-month variations, season did not have a significant effect on HCT at different pH values (Table 4).
The HCTnpH (9·7 to 19·6 min; Table 4) was relatively low compared to that reported by Holt et al. (Reference Holt, Muir and Sweetsur1978) for creamery (silo) skim milk, i.e., 15 to 27 min over a 12 month period from January to December. This lower HCTnpH compared to that of Holt et al. (Reference Holt, Muir and Sweetsur1978) may be attributable to the higher concentrations of lactose (4·67–5·08 vs. 4·63–4·82%) and total Ca (104–142 vs. 99–118 mg Ca/100 g), and lower pH (6·63–6·75 vs. 6·73–6·84) of the milk samples in the current study. During heating of milk at 140 °C, lactose is thermally degraded to formic acid and other organic acids which reduce the pH and accelerate protein aggregation (van Boekel et al. Reference van Boekel, Nieuwenhuijse and Walstra1989; Huppertz, Reference Huppertz, McSweeney and O'Mahony2016). In contrast to the current study and that of Holt et al. (Reference Holt, Muir and Sweetsur1978), Kelly et al. (Reference Kelly, O'Keeffe, Keogh and Phelan1982) found a much larger variation in HCTnpH of creamery milk (~5–80 min) and liquid milk (~40–80 min) at 130 °C, where creamery milk (March year 1- March year 2) was from spring-calving herds, and liquid milk from mixed herds of spring- and autumn-calving cows. Kelly et al. (Reference Kelly, O'Keeffe, Keogh and Phelan1982) found a significant positive correlation between HCTnpH and urea level, which varied from ~2·1 to 4·6% total N in creamery milk and 2·6–4·6% in the liquid milk.
HCTmax, which occurred at pH 6·6 to 6·7, varied from 10·2 to 18·6 min. Simple linear regression analysis (Table 5) indicated a significant (P < 0·05), though weak, positive correlation between HCTmax and level of NPN, which contains ~55% urea (Kelly et al. Reference Kelly, O'Keeffe, Keogh and Phelan1982; Mehra et al. Reference Mehra, O'Brien, Connolly and Harrington1999). The positive effect of NPN on HCTmax, which concurs with the results of previous studies (Muir & Sweetsur, Reference Muir and Sweetsur1977; Fox et al. Reference Fox, Nash, Horan, O'Brien and Morrissey1980), has been attributed to the thermal degradation of urea to ammonia, an effect which reduces the extent of pH reduction during the heating of milk.
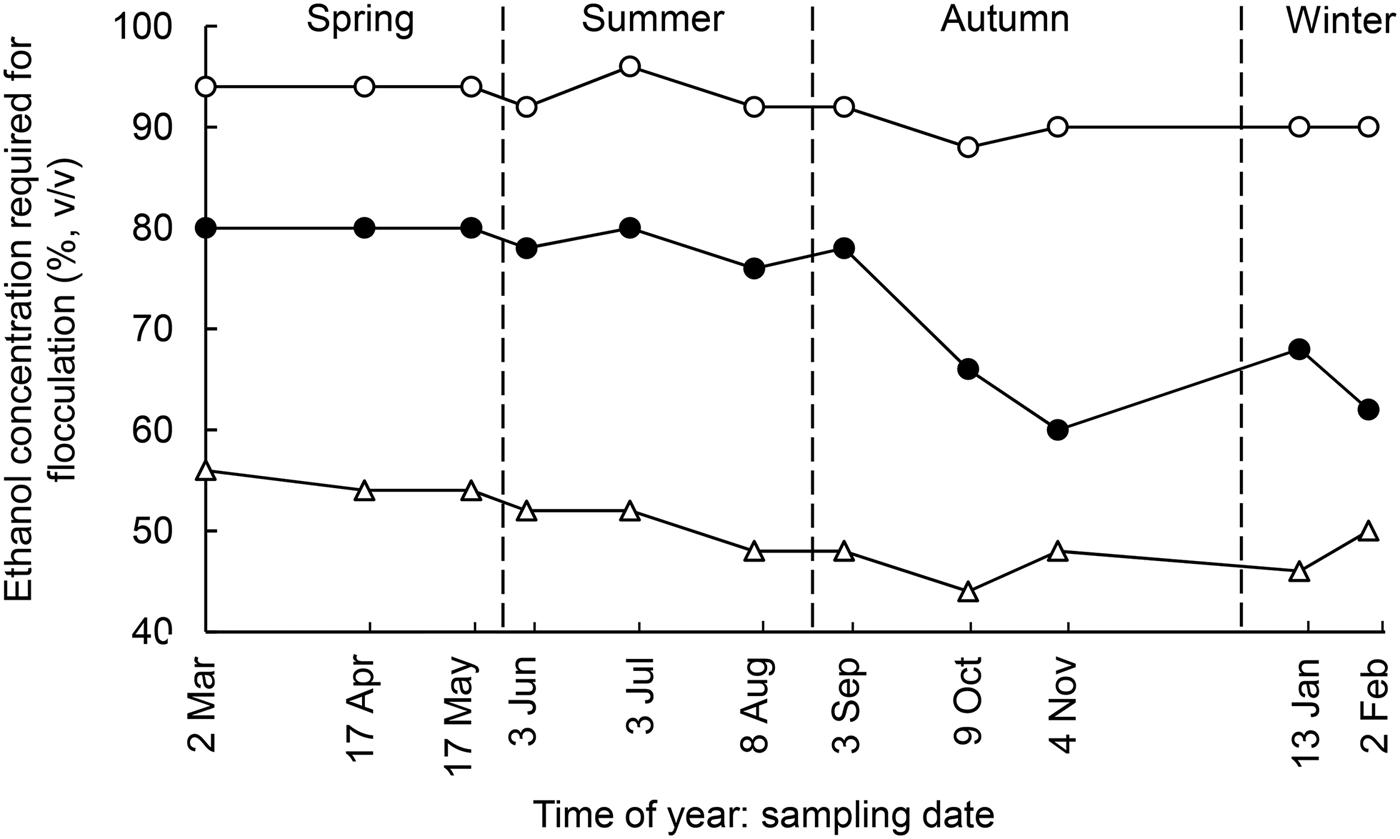
Ethanol stability (ES)
The ES increased significantly with pH for all milk samples, from 38–42% ethanol at pH 6·2 (Table 4) to 88–96% at pH 7·0 (Fig. 2). The increase in ES with pH is consistent with previous studies (Horne & Parker, Reference Horne and Parker1981; Horne & Muir, Reference Horne and Muir1990) and is attributed to the increase in the net negative charge of the casein micelles (Mohammed & Fox, Reference Mohammed and Fox1986). Simple linear regression analysis indicated that ES at different pH values was correlated with different compositional parameters (Table 5).

Fig. 2. Seasonal variations in ethanol stability at pH of 6·4 (▵), 6·6 (●) and 7·0 (○) of skim milk from a mixed herd comprised of spring-and autumn-calving cows as a function of time of year.
ES at pH 6·6 (ES6·6), which showed the largest variation with season (Table 4), correlated negatively with concentrations of sedimentable Ca and P (Table 5). The ES of winter milk at pH 6·6 was significantly lower than that of spring milk (Table 4); a similar trend was noted for ES at pH 7·0 (ES7·0). ES at pH 6·4 (ES6·4) was lower in autumn milk than in spring milk. ES at pH 6·4 correlated negatively with casein micelle size and total Ca content, and positively with concentration of serum P (Table 5). Similar trends were reported by Chen et al. (Reference Chen, Lewis and Grandison2014) who found an inverse relationship between casein micelle size and ES at natural pH (6·73–6·87), and Davies & White (Reference Davies and White1958) who found that the ES of late lactation, bulk herd milk at natural pH increased from 66 to 90% (v/v) ethanol as soluble inorganic P increased from 5 to 37 mg/100 ml.
Conclusions
The seasonal changes in the compositional, physicochemical and processing characteristics of skim milk from a mixed-herd with varying proportions of milk from spring- and autumn-calving cows was investigated during 2014–2015. The data were blocked according to season, denoted arbitrarily as Spring, March–May; Summer, June–August; Autumn, September–November; and Winter, January–February. Autumn milk, as a % of total milk, varied from ~10–20, 5–13, 20–40 and 50–100, in Spring, Summer, Autumn and Winter, respectively. Season affected concentrations of total P and serum P, levels of αs1- and β-caseins (as proportions of total casein), casein micelle size, zeta potential, and ethanol stability at different pH values, significantly. While season did not influence the rennet gelation or heat stability characteristics of the milk, ethanol stability of autumn milk or winter milk at pH 7·0 was lower than that of spring – or summer milk. The absence of significant seasonal effects on most compositional parameters, rennet gelation and heat-stability characteristics suggest that milk from a mixed-herd of spring- and autumn-calving cows is suitable for the manufacture of cheese and milk powder on a year-round basis, when the volume proportion of autumn milk, as a % of total, is similar to that of the current study. Hence, where milk is predominantly from a pasture-based, spring-calving system, as in Ireland, the use of autumn-calving herds at critical times of year (mid-October to February) can help to reduce the processing problems frequently encountered at the extremes of lactation.
The authors gratefully acknowledge the financial assistance of the Dairy Levy Trust Co-operative Society Limited (Dublin, Ireland). The authors also would like to thank Mr. John Paul Murphy, Farm Manager, for his assistance in sample collection.