


In cows, bacteria are capable of invading the mammary glands through the teat canal. Implementation of the Five-Point Plan has reduced the incidence of mastitis (Neave et al. Reference Neave, Dodd and Kingwill1966; Bramley & Dodd, Reference Bramley and Dodd1984). However, mastitis remains the most frequent and prevalent production disease in dairy herds in developed countries (Bradley, Reference Bradley2002).
The impact of mastitis on dairy farming raises concerns for both animal welfare and the hygienic quality of milk (White & McDermott, Reference White and McDermott2001; Bisharat et al. Reference Bisharat, Crook, Leigh, Harding, Ward, Coffey, Maiden, Peto and Jones2004). In addition to causing distress in animals due to inflammation, mastitis decreases both the quantity of milk produced, as well as altering its composition (Hogarth et al. Reference Hogarth, Fitzpatrick, Nolan, Young, Pitt and Eckersall2004). Losses occur from decreased milk production, treatment and labour costs, non-deliverable milk, veterinary costs, reduced milk quality, reduced milk price, increased risk of subsequent mastitis and greater risk of culling or cow death (Seegers et al. Reference Seegers, Fourichon and Beaudeau2003). Annual economic losses are estimated at $2 billion in the USA (De Oliveira et al. Reference De Oliveira, Watts, Salmon and Aarestrup2000) and £168 million in the UK (Bradley, Reference Bradley2002).
It is clear that inhibition of bacterial growth is the first step in protecting the mammary gland against infection. It is known that the non-specific antibacterial defence system, consisting of lactoperoxidase (LPO), H2O2 and thiocyanate, is present in bovine milk (Reiter & Harnulv, Reference Reiter and Harnulv1984; Ekstrand, Reference Ekstrand1989). In the LPO/H2O2/thiocyanate system, LPO with H2O2 catalyses the conversion of thiocyanate into antibacterial hypothiocyanite (Björck et al. Reference Björck, Rosen, Marshall and Reiter1975; Barett et al. Reference Barett, Grabduson and Lewis1999; Furtmüller et al. Reference Furtmüller, Jantschko, Regesberger, Jakopitsch, Arnhold and Obinger2002). LPO and thiocynate are present in bovine milk throughout lactation (Fonteh et al. Reference Fonteh, Grandison and Lewis2002). For the system to function, H2O2 must also be present in milk. We recently reported that cow milk generates H2O2 by utilizing a small molecular weight compound in milk (Sakai et al. Reference Sakai, Satow, Imakawa and Nagaoka2008).
The somatic cell count (SCC) in milk has been used as an indicator of intramammary inflammation (Pyörälä, Reference Pyörälä2003). The increase in electrical conductivity (EC) of milk is explained by increases in sodium and chloride concentrations and by a decrease of potassium concentration (Kitchen, Reference Kitchen1981). After the cell damage, it is generally accepted that sodium and chloride ions pour into the lumen of the alveolus because of increased blood capillary permeability, the destruction of tight junctions and the destruction of the active ion-pumping systems, and that an increase in EC reflects damage of udder epithelial cells (Kitchen et al.Reference Kitchen, Middleton, Durward, Andrews and Salmon1980; Nielen et al. Reference Nielen, Deluyker, Schukken and Brand1992).
Based on SCC of either >300 000 or <200 000 cells/ml in this study, we defined the quarter as either inflamed or uninflamed, respectively. We determined the amount of H2O2 produced by utilizing a small molecular weight compound in milk, and compared H2O2 production in milk from inflamed quarters with that from uninflamed quarters in the same animal. The relationship between H2O2 production and EC was examined.
Materials and methods
Milk sampling and definition of population control
Foremilk (first 15–20 ml) of each quarter was collected during evening milking on three farms at the University of Tokyo, Nihon University and the Institute of Livestock and Grassland Science of Japan. Samples were cooled on ice after collection and were stored at −60°C.
Milk was of delivery grade (colostrum not included), and samples were collected four times at almost equal intervals from August 2005 to May 2006. A total of 194 milk samples were collected and the data were taken as the population control. SCC was mostly below 100 000 cells/ml.
Definition of inflamed and uninflamed quarters
Foremilk was inspected with the Californian mastitis test (CMT) using a PL-tester (Zenoaq, Koriyama, Fukushima, Japan). In cows with CMT-positive quarters, SCC of each quarter was determined. Based on SCC of either >300 000 or <200 000 cells/ml, we defined the quarter as either inflamed or uninflamed, respectively. In approximately 90% of such cases, milk from inflamed quarters had SCC >400 000 cells/ml. Milk was sampled at the time of inspection. In 20 cases, milk from all four quarters in each cow was collected and in 12 cases, only milk from inflamed quarters was collected.
Determination of milk H2O2 and electrical conductivity
Experimental procedures were as described elsewhere (Sakai et al. Reference Sakai, Satow, Imakawa and Nagaoka2008). In this study, however, milk was centrifuged at 40 000 g at 4°C for 1 h. The supernatant was then applied to the YM-3 filter unit (molecular limit 3000) (Millipore Japan, Tokyo, Japan) and centrifuged at 14 000 g at 4°C for 90 min. The filtrate was then collected. After incubating the YM-3 filtrate at 25°C for 4 h, the filtrate was combined with an equal volume of assay reagent (1·2 mg/ml TDPO (bis [2-(3, 6, 9-trioxadecanyloxycarbonyl)-4-nitrophenyl] oxalate) and 0·2 mg/ml pyrene in acetonitrile (Wako Pure Chemicals, Osaka, Japan). Immediately after mixing in a luminometer, the luminescence intensity was counted for 10 s. A standard curve was constructed for each assay using known amounts of H2O2 in water. EC of the 40 000 g supernatant was measured at 25°C using an EC meter calibrated with a standard NaCl solution for each assay and was expressed in milliSiemens (mS/cm). Milk from all four quarters of each cow was assayed both separately and simultaneously, and each determination was performed in duplicate.
Statistical methods
Data are expressed as means±sd with the number of experiments. Statistical analyses were performed using Student's t test and regression analysis. Differences with P values below 0·05 were considered to be statistically significant.
Results
H2O2 production and electrical conductivity in the population
In the present population, the production of H2O2 and EC were 3·6±1·3 nmol/ml and 5·4±0·4 mS/cm (mean±sd), respectively (Table 1). The quarter-to-quarter variation in H2O2 production among cows was 17·3±10·1% (CV). In 12 of the 194 milk samples, however, the quarter-to-quarter variation was larger than 30%. The level of H2O2 production within individual cows remained fairly constant during the sampling period, and lactation-stage dependent variations were not seen (data not shown). The normal range of EC was 5·4±0·8 (2 sd) mS/cm.
Table 1. Hydrogen peroxide production and electrical conductivity (EC) in milk from inflamed and uninflamed quarters.
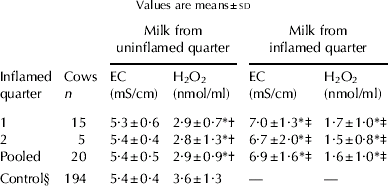
† Compared with controls
‡ Compared with milk from uninflamed quarters in the same cow
§ Average in cows with milk of delivery grade
* P<0·01
H2O2 production and electrical conductivity in inflamed quarter milk
In milk from 37 inflamed quarters, the production of H2O2 and EC was 1·9±1·0 nmol/ml and 6·8±1·7 mS/cm, respectively. The relationship between H2O2 production and EC is shown in Fig. 1. H2O2 production was moderately but significantly correlated with EC (r<−0·71, P<0·01). The upper level of EC was 6·2 mS/cm in this population. In milk from 12 of 37 inflamed quarters, EC was less than 6·2 mS/cm and production of H2O2 was 2·4±1·0 nmol/ml. In milk from inflamed quarters with EC values >6·2 mS/cm, production of H2O2 was 1·5±0·8 nmol/ml and was significantly smaller than that in milk from those with EC values <6·2 mS/cm (P<0·01).

Fig. 1. Relationship between hydrogen peroxide production and electrical conductivity in milk from inflamed quarters. Dotted line indicates the upper level of electrical conductivity in milk of controls (mean+2 sd in Table 1). *P<0·01, n=37.
Production of H2O2 in inflamed and uninflamed quarter milk
In 20 cows, milk from four quarters was separately collected. Among these cows, 15 had one inflamed quarter and 5 had two inflamed quarters. Production of H2O2 in each quarter of individual cows is shown in Fig. 2. In milk from uninflamed quarters, production of H2O2 varied between cows, and relatively small variations were seen within individual cows. In cows with one inflamed quarter, the CV within a cow was 13·4±11·7% in milk from uninflamed quarters (mean±sd, n=15). Average production of H2O2 did not exceed 5 nmol/ml and was mostly below 3 nmol/ml (15/20). In milk from inflamed quarters, production of H2O2 was mostly lower than in other quarters in the cow (18/20). Even though the EC of milk from inflamed quarters was within the normal range, that milk showed the highest EC values in each cow (data not shown).

Fig. 2. Production of hydrogen peroxide in inflamed and uninflamed quarter milk. Inflamed quarter milk is shown as closed symbol and uninflamed quarter milk is shown as open symbol.
H2O2 production and electrical conductivity in milk from inflamed and uninflamed quarters
Results for the production of H2O2 and EC in milk from inflamed and uninflamed quarters are summarized in Table 1. Data for cows with one inflamed quarter did not differ significantly from those for cows with two inflamed quarters. Thus, the data were pooled. Production of H2O2 in milk from inflamed quarters was smaller than that in milk from uninflamed quarters (P<0·01). In milk from uninflamed quarters, production of H2O2 was significantly less than that in the control population (P<0·01). For EC, milk from uninflamed quarters was the same as in the control population. However, a significant increase in EC in milk from inflamed quarters was observed, as compared with that of uninflamed quarter milk from the same cows (P<0·01).
Discussion
In milk from 12 of 37 inflamed quarters, EC remained within the normal range. However, despite remaining within the normal range, milk from inflamed quarters showed the highest EC values in individual cows. Use of an inter-quarter evaluation reportedly improves the sensitivity and specificity of EC to detect subclinical mastitis (Jensen & Knudsen, Reference Jensen and Knudsen1991; Nielen et al. Reference Nielen, Deluyker, Schukken and Brand1992). Based on the lowest EC in uninflamed quarter milk, however, the difference was very small in some cases, agreeing with earlier findings (Nielen et al. Reference Nielen, Deluyker, Schukken and Brand1992; Pyörälä, Reference Pyörälä2003). It has been reported that the degree of increase in EC varies greatly depending on the species of pathogen causing mastitis (Hillerton & Walton, Reference Hillerton and Walton1991; Milner et al. Reference Milner, Page, Walton and Hillerton1996; Shoshani & Berman, Reference Shoshani and Berman1998; Sloth et al. Reference Sloth, Friggens, Løvendahl, Andersen, Jensen and Ingvatsen2003).
The present study determined the amount of H2O2 produced by utilizing a small molecular mass compound in milk (Sakai et al. Reference Sakai, Satow, Imakawa and Nagaoka2008). The ability to produce H2O2 is characteristic in each individual cow, as the production of H2O2 varied between cows and even relatively small quarter-to-quarter variations were seen within individual cows. However, the production of H2O2 in inflamed quarter milk was significantly lower than that in uninflamed quarter milk. It is generally accepted that the composition of milk from infected quarters differs from that from uninfected quarters (Pyörälä, Reference Pyörälä2003; Hogarth et al. Reference Hogarth, Fitzpatrick, Nolan, Young, Pitt and Eckersall2004; Bansal et al. Reference Bansal, Hamann, Grabowski and Singh2005) and these changes are due to intramammary inflammation. As the levels of H2O2 production in milk from uninflamed quarters of the same animal varied within a small range, we conclude that H2O2 production decreases in inflamed quarter milk. After the cell damage, sodium and chloride ions pour into the lumen of the alveolus because of increased blood capillary permeability, the destruction of tight junctions and the destruction of the active ion-pumping systems. The enzyme N-acetyl-B-d-glucosaminidase is normally present in the cytoplasm of cells. The enzyme activity in milk reflects damage of udder epithelial cells and is correlated with EC (Kitchen et al. Reference Kitchen, Middleton, Durward, Andrews and Salmon1980). The activity to produce H2O2 was unaffected by changes in sodium, potassium and chloride concentrations (unpublished data). As H2O2 production was correlated with EC in milk from inflamed quarters, it is suggested that H2O2 production decreased depending on the extent of udder epithelial cell damage. We speculate that synthesis of the H2O2-generating substance is disturbed directly or indirectly by the infection.
We observed that in cows with inflamed quarters, H2O2 production in milk from uninflamed quarters was significantly smaller than that in the control population. Although H2O2 production in milk from uninflamed quarters in individual cows was relatively uniform, it is possible that inflammation results in equal decreases in H2O2 production in uninflamed quarter milk. As the evidence is limited at present, it is uncertain whether mastitis appears in low H2O2-producting cows. We believe that the relationship between mastitis occurrence and ability to produce H2O2 should be carefully examined.
The effectiveness of LPO/H2O2/thiocyanate system is questionable (Rainard & Riollet, Reference Rainard and Riollet2006) as the amounts of H2O2 in milk are very small (Björck et al. Reference Björck, Rosen, Marshall and Reiter1975; Korhonen & Reiter, Reference Korhonen and Reiter1983; Sakai et al. Reference Sakai, Satow, Imakawa and Nagaoka2008). This study shows that the ability to produce H2O2 is a parameter for evaluating the LPO/H2O2/thiocyanate system in cow milk.
The authors are very grateful to Professor K Endo at Nihon University and to Dr S Kushibiki at the National Institute of Livestock and Grassland Science for their support.


